Results from the three main stages of the methodology are presented in three following sections. The proposed method is applied on a case study building complex consisting of 66 apartments housed in two detached buildings and located in Frederikshavn, Denmark. The building complex is in use since 1949, and no major renovations have been undertaken afterward. Even though there is no specific project budget or target for renovation of the building, its age and state allow for a wide range of improvements to the different building parts.
3.1. Project Definition
This section describes the outcome of applying the first stage of the methodology on the selected case study. As the state and energy performance of the case study have been reported in [
37], this section outlines the main findings in relation to building characteristics and defines the additionally studied energy-producing systems.
The primary energy demand for the building in its existing state is found to be 129.6 kWh/m
2 year by the BE18 reference energy model. It considers energy demand for heating, cooling, ventilation, domestic hot water, and electricity for operation of the building. The energy model has been developed and validated by the energy audit described in depth in [
37]. The total heated floor area of 5250 m
2 is divided equally between the apartments, 48 of which are oriented to the west and 18 are oriented to the south. Both buildings are three storeys in height with unheated attic, basement, and utility room. Thermal characteristics for the main building envelope elements are shown in
Table 1.
To achieve NZEB in the Danish context, the primary energy demand must be lower than the limit value of 27 kWh/m
2 year and partially covered by renewable production [
39]. For this specific building, the primary energy demand needs a reduction of nearly 80%. Moreover, it has been reported that heating and domestic hot water demand is covered by district heating sub-station, which is common for both buildings [
37]. The sub-station consists of two heat exchangers (one for heating and one for DHW), which are installed when the building was constructed. Ventilation commences naturally through windows and ventilation openings in the bathrooms.
Considering that the existing district heating sub-station is quite outdated, it is worth considering its replacement. This can be either the re-establishment of a new substation or switching to a different energy system. This, combined with the requirement in Danish building regulations for a share of renewable energy production, can have a large effect on the economic and energy performance, as different systems bear distinct characteristics. Here, it is important to consider local conditions and possibilities, e.g., the availability of district heating or a gas network, space for vertical or horizontal ground-source heat exchangers, available roof area and orientation, etc.
The energy source for a system is a determining factor for defining it as renewable. For example, district heating should not be considered renewable if the source is coal. On the other hand, district heating plants operated on biomass, geothermal, or other renewable sources can be considered renewable. In fact, in Denmark, more than half of district heating plants are powered by renewable sources [
44]. Some renewable energy-producing systems cannot deliver energy on demand, as there are reliant on fluctuating natural driving forces. Therefore, such are better suited to supplement a main energy system that is capable of delivering energy on demand. The produced energy by the secondary renewable system may be used to power the main system directly, stored, or sold to the grid.
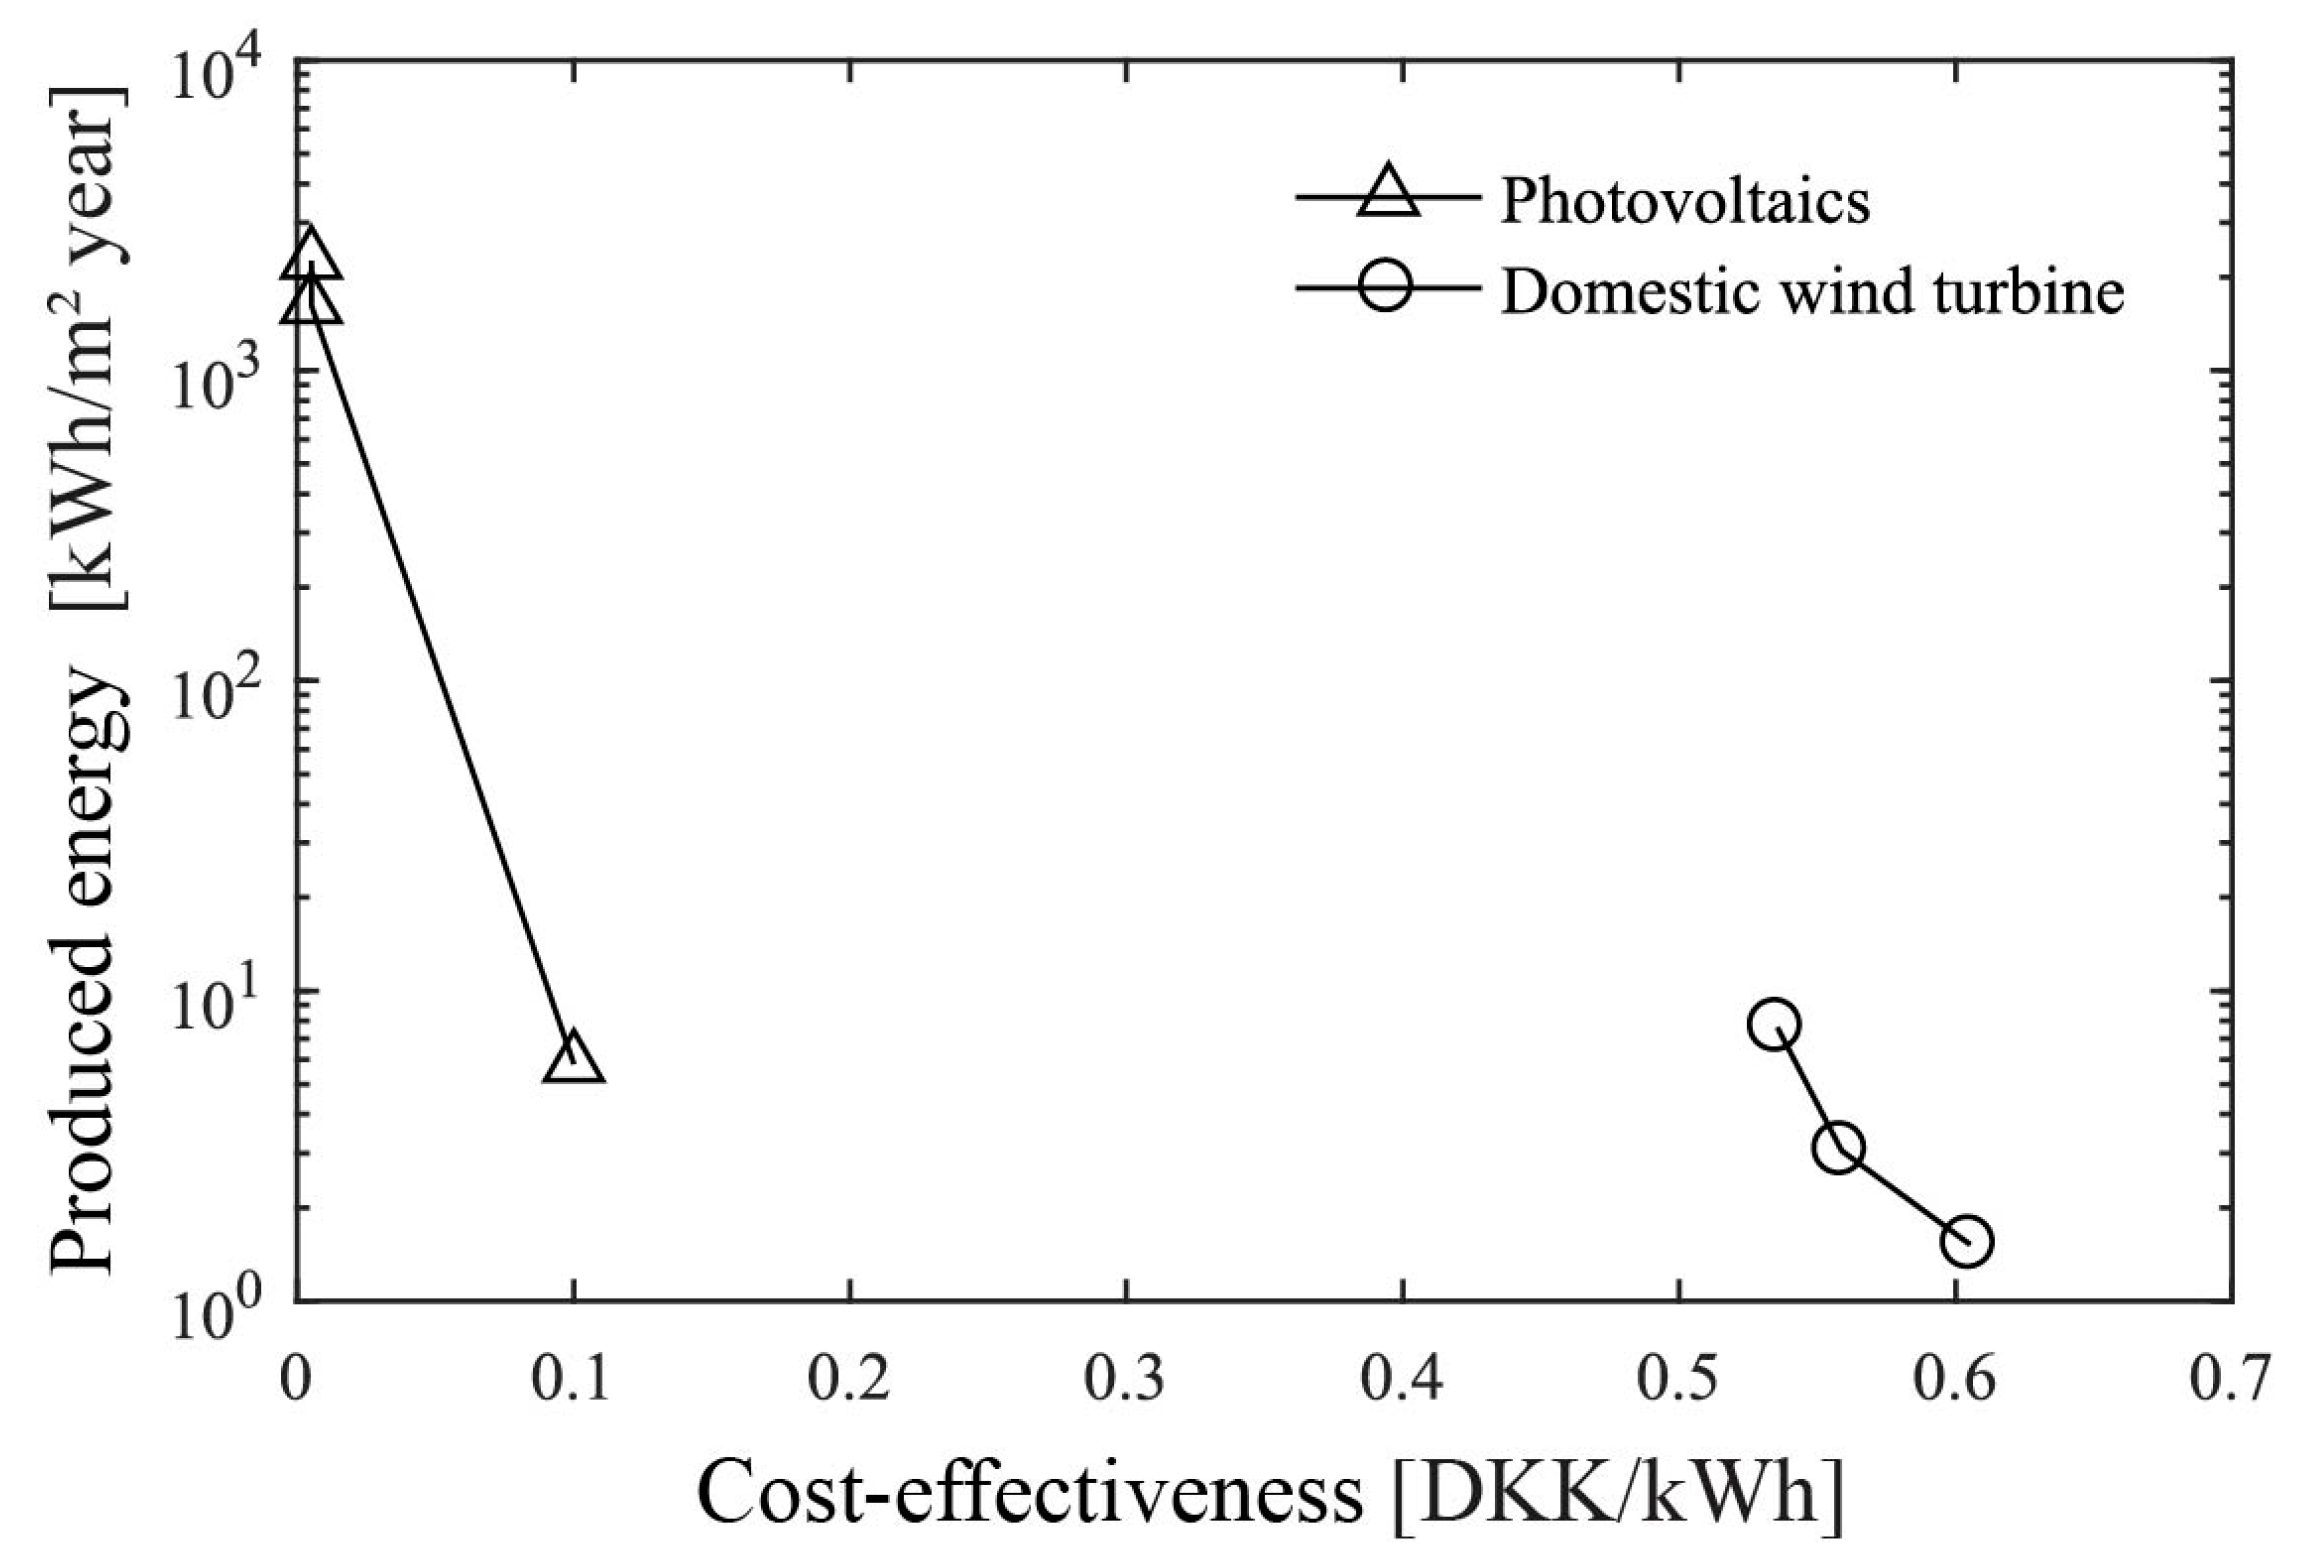
This study investigates four main energy supply systems for heating and domestic hot water and two secondary renewable energy systems. The main supply systems included in the analysis are a district heating sub-station, a natural gas boiler, a Water-to-Water (W/W) heat pump, and an Air-to-Water (A/W) heat pump. Investigated secondary supply systems are the addition of a Domestic Wind Turbine (DWT) and photovoltaic panels (PV). The selection of the investigated system types and sizes hinged on acquiring necessary input data for economical and energy performance analysis. The associated cost and technical specifications for the main and secondary energy-producing systems are accessible in Technology Data Catalogues by the Danish Energy Agency [
40,
41]. To investigate a possible effect of the DWT and PV system size and thereby production, three sizes deemed suitable for the building energy demand and available space are considered. For DWT, the selected system capacities are 5, 10, and 25 kW. In regard to PV, the studied sizes are 6.1, 110, and 150 kWp, corresponding to 30, 500, and 930 m
2, respectively [
40,
41].
3.3. Compilation and Evaluation of Packages
This section provides a description for the approach used to compile renovation packages and presents the results. Furthermore, the resulting global cost and primary energy demand for the selected packages alone and in combination with main and secondary systems are presented and analyzed.
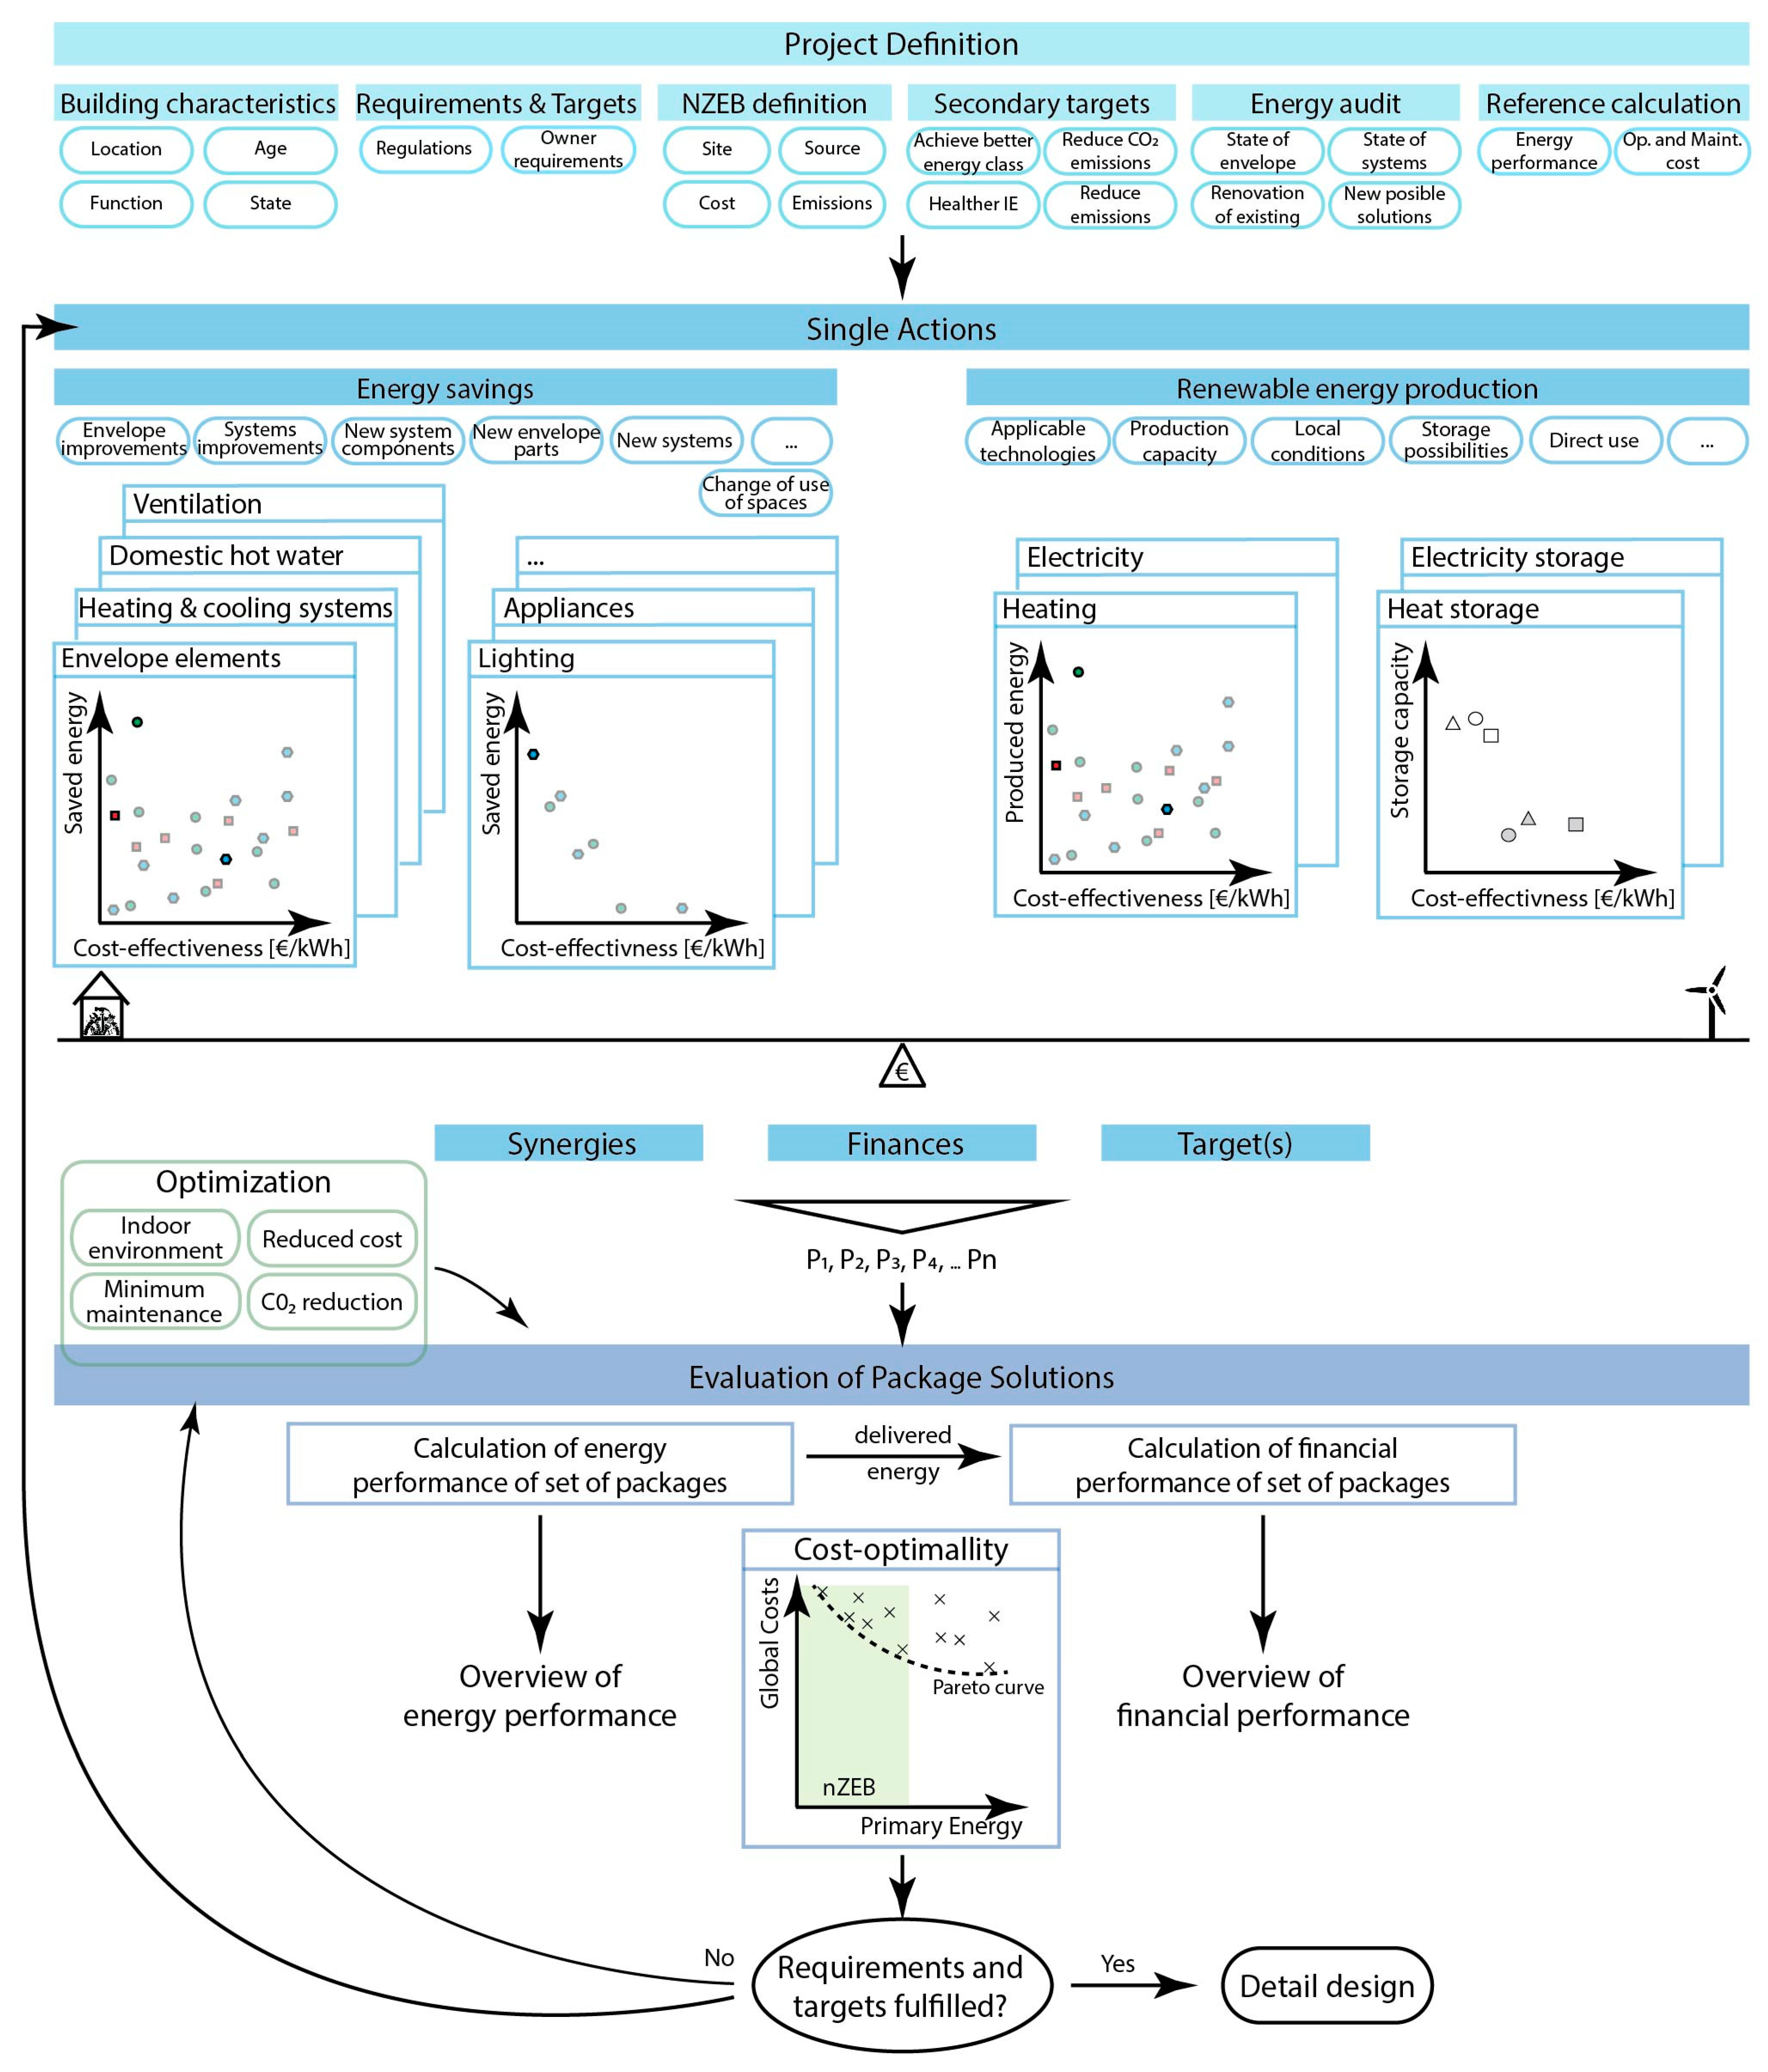
Having determined the individual effect on energy demand and knowing the cost for applying various energy efficiency actions, different energy supply sources, and renewable energy production systems, we can now use the acquired data to sort the actions and compose renovation packages. The objective of this study is to combine renovation packages based on different approaches for the selection of what a package consists of. Moreover, we identify if using cost-effectiveness as a sorting parameter can yield cost-optimal packages.
The compiled renovation packages are differentiated in three target groups, based on the predicted amount of energy savings, which are expressed in percent reduction from the reference. The level of energy savings is set to approximately 20, 40 and 60%. Naturally, packages with lower target have wider selection of possibilities, as less actions are required to reach the target. Therefore, six packages are compiled for target savings of 20%, and two are compiled for 40 and 60%.
The approach used to select the contents of packages 1–6 is to include a variety of rather random building elements, adding up to 20% savings. This is done to mimic cases where the elements to be renovated are pre-selected, but the specific solution is not. The selection of the specific element type, insulation thickness, or class is made on the basis of the energy savings and CEP. The sorting is performed on an element level, as grouped in
Table A1,
Table A2,
Table A3,
Table A4,
Table A5 and
Table A6 in
Appendix A. Then, a selection of the specific element type is made from one or more of the tables, depending on the goal of the package. For packages 1–6, CEP and energy savings are considered to make up packages, which are expected to provide approximately 20% energy savings while still comprised with one of the most cost-effective elements.
Alternatively, the elements included in package 7 are selected on the basis of global CEP sorting, across all investigated actions. This is done with aim of identifying if selection solely based on CEP provides cost-optimal packages. Package 8 considers the same level of savings as package 7, although it focuses on reaching the target by implementing fewer building elements with large individual energy savings. For this package, the first priority is to select the building elements with large individual savings and then select the specific type based on element-sorted CEP.
Packages 9 and 10 consist of a 60% energy reduction target. Package 9 is compiled by CEP sorting on an element level, and then including all needed elements to reach approximately 60% savings, prioritizing those with large savings first. Lastly, package 10 includes all investigated elements but for the compromise of lower energy class windows and terrace doors. The resulting packages and their content details are presented in
Table 2, whereas a list of all elements and their CEP value is available in
Appendix A. The last two rows in
Table 2 provide the predicted savings by the sum of individual contributions of renovation actions and the achieved global savings by the package.
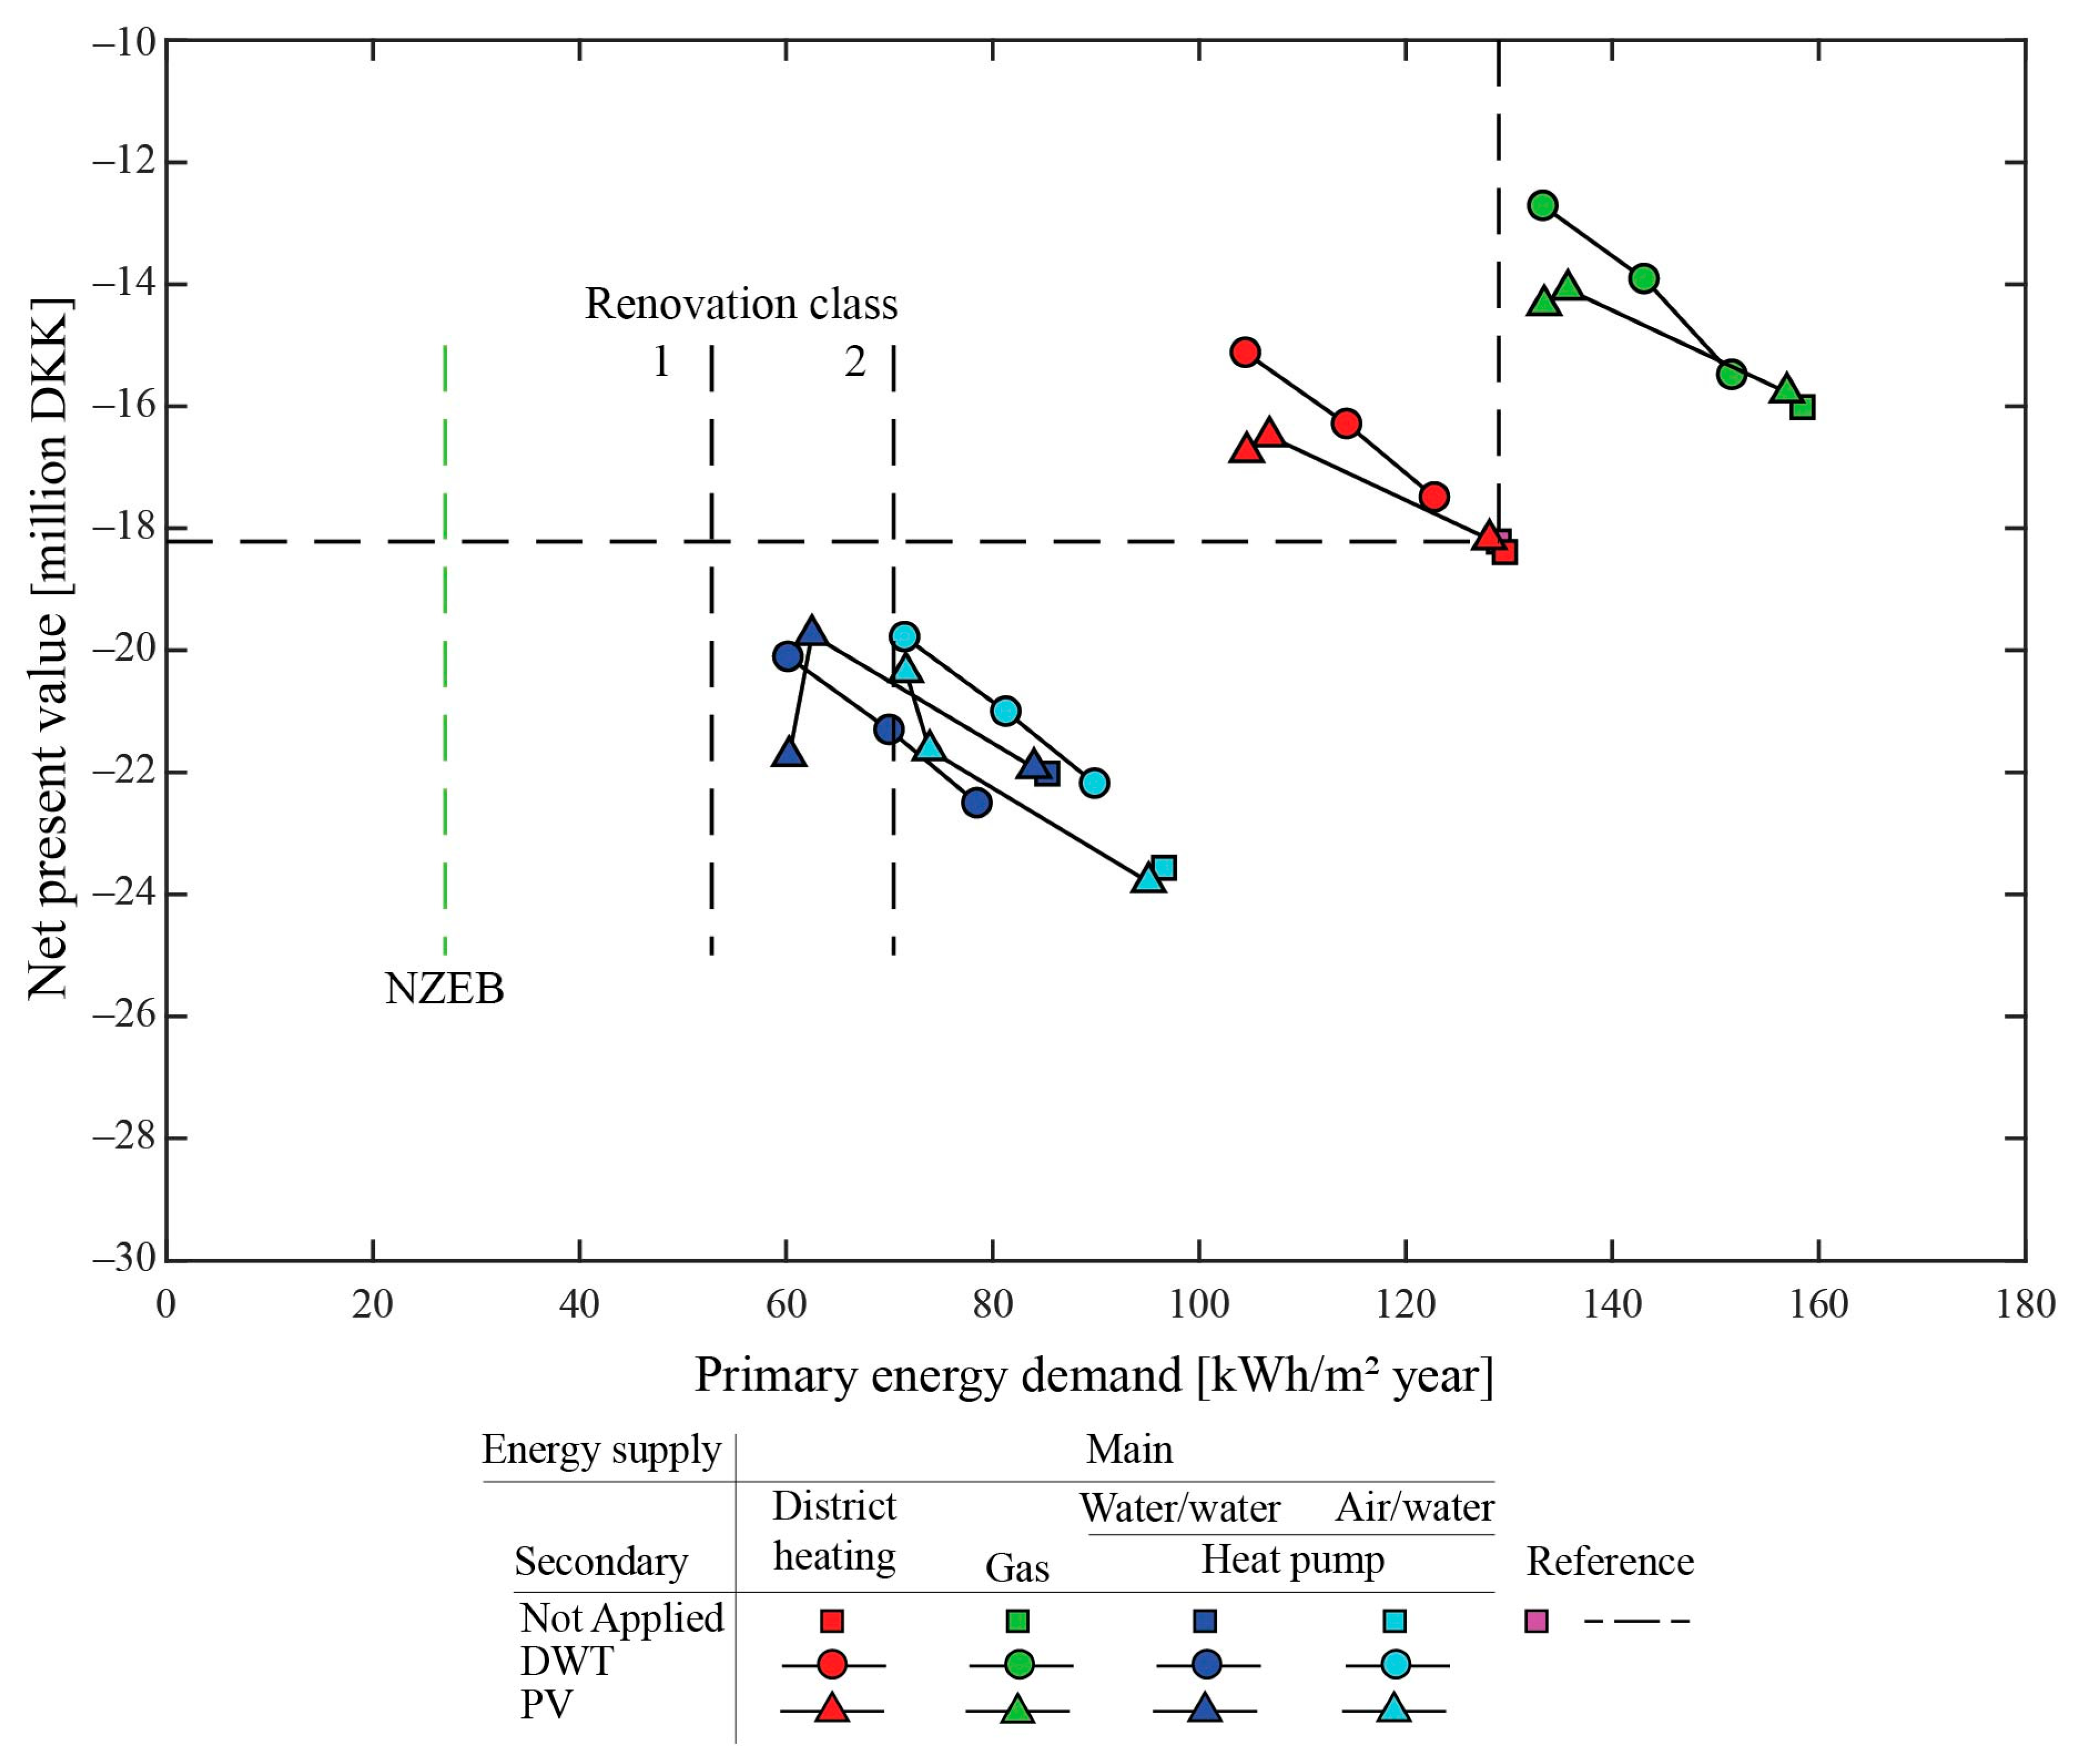
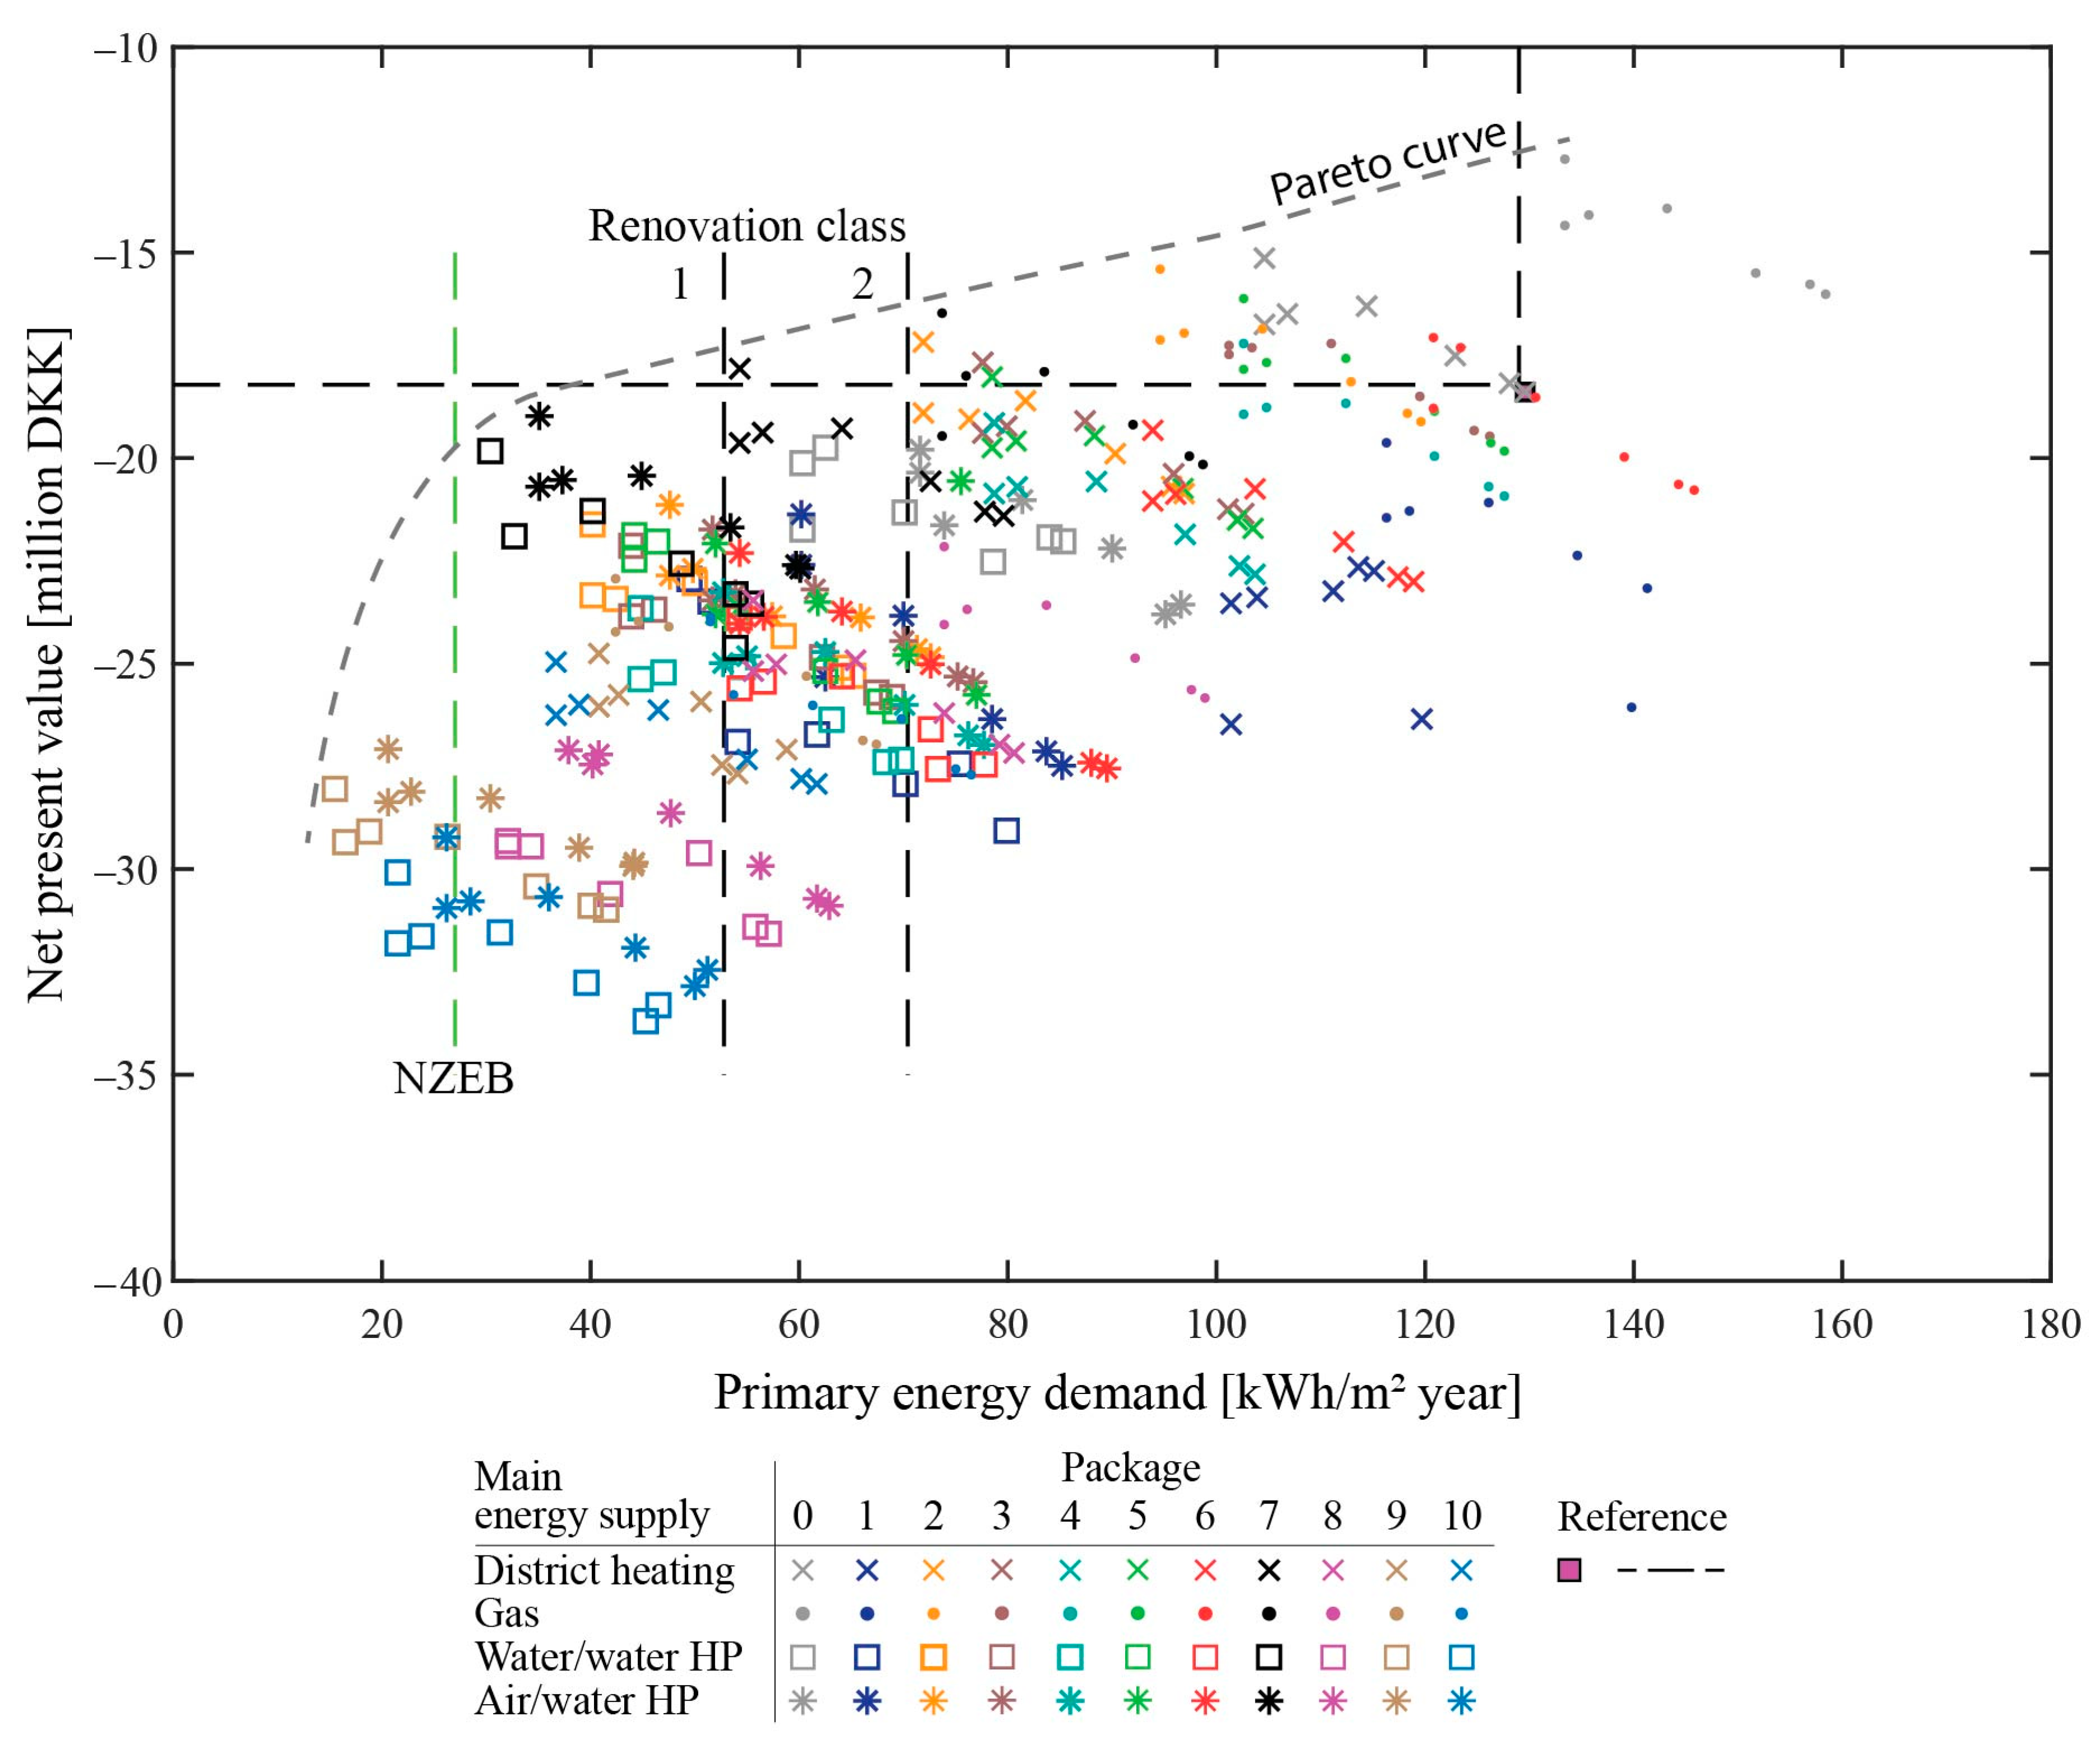
The results for NPV and primary energy demand for each of the specified renovation packages and their combination with main and secondary energy supply are presented in
Figure 5. Similarly to the cost-optimality plot shown in
Figure 1, all studied combinations and the resulting Pareto curve are presented for the purpose of observing the complete solution space. As the differentiation in
Figure 5 is made only by the package and main supply option, there are seven identical symbols appearing for each package. Those correspond to the three studied DWT and PV systems and the main supply systems as stand-alone systems, which are all discussed in detail throughout this section. Package zero represents a change of energy-producing system and/or the addition of renewables, as presented in
Figure 4.
Given the selected boundary conditions for the calculations, 12 of the 308 studied cases satisfy NZEB. Seven of those have W/W heat pumps as the primary supply and five A/W heat pumps. There are 56 solutions lying between the NZEB requirement and renovation class one, while those between the limits for renovation class one and two are 79.
As observed from
Figure 5, there are a number of cases that are rather close to the NZEB target value of 27 kWh/m
2 year but do not reach NZEB. Those have the potential to reach the target by means of model optimization on either the envelope or the producing system’s side.
Figure 5 reveals a general tendency of increasing global cost with reduction of primary energy demand. Nevertheless, there are also solutions with significantly lowered energy demand that are comparable to the reference case total costs. The results are further analyzed for each main supply system in two ways. First, the addition of renovation packages alone is presented in
Figure 6. Second, the packages are combined with the secondary energy production systems in
Figure 7.
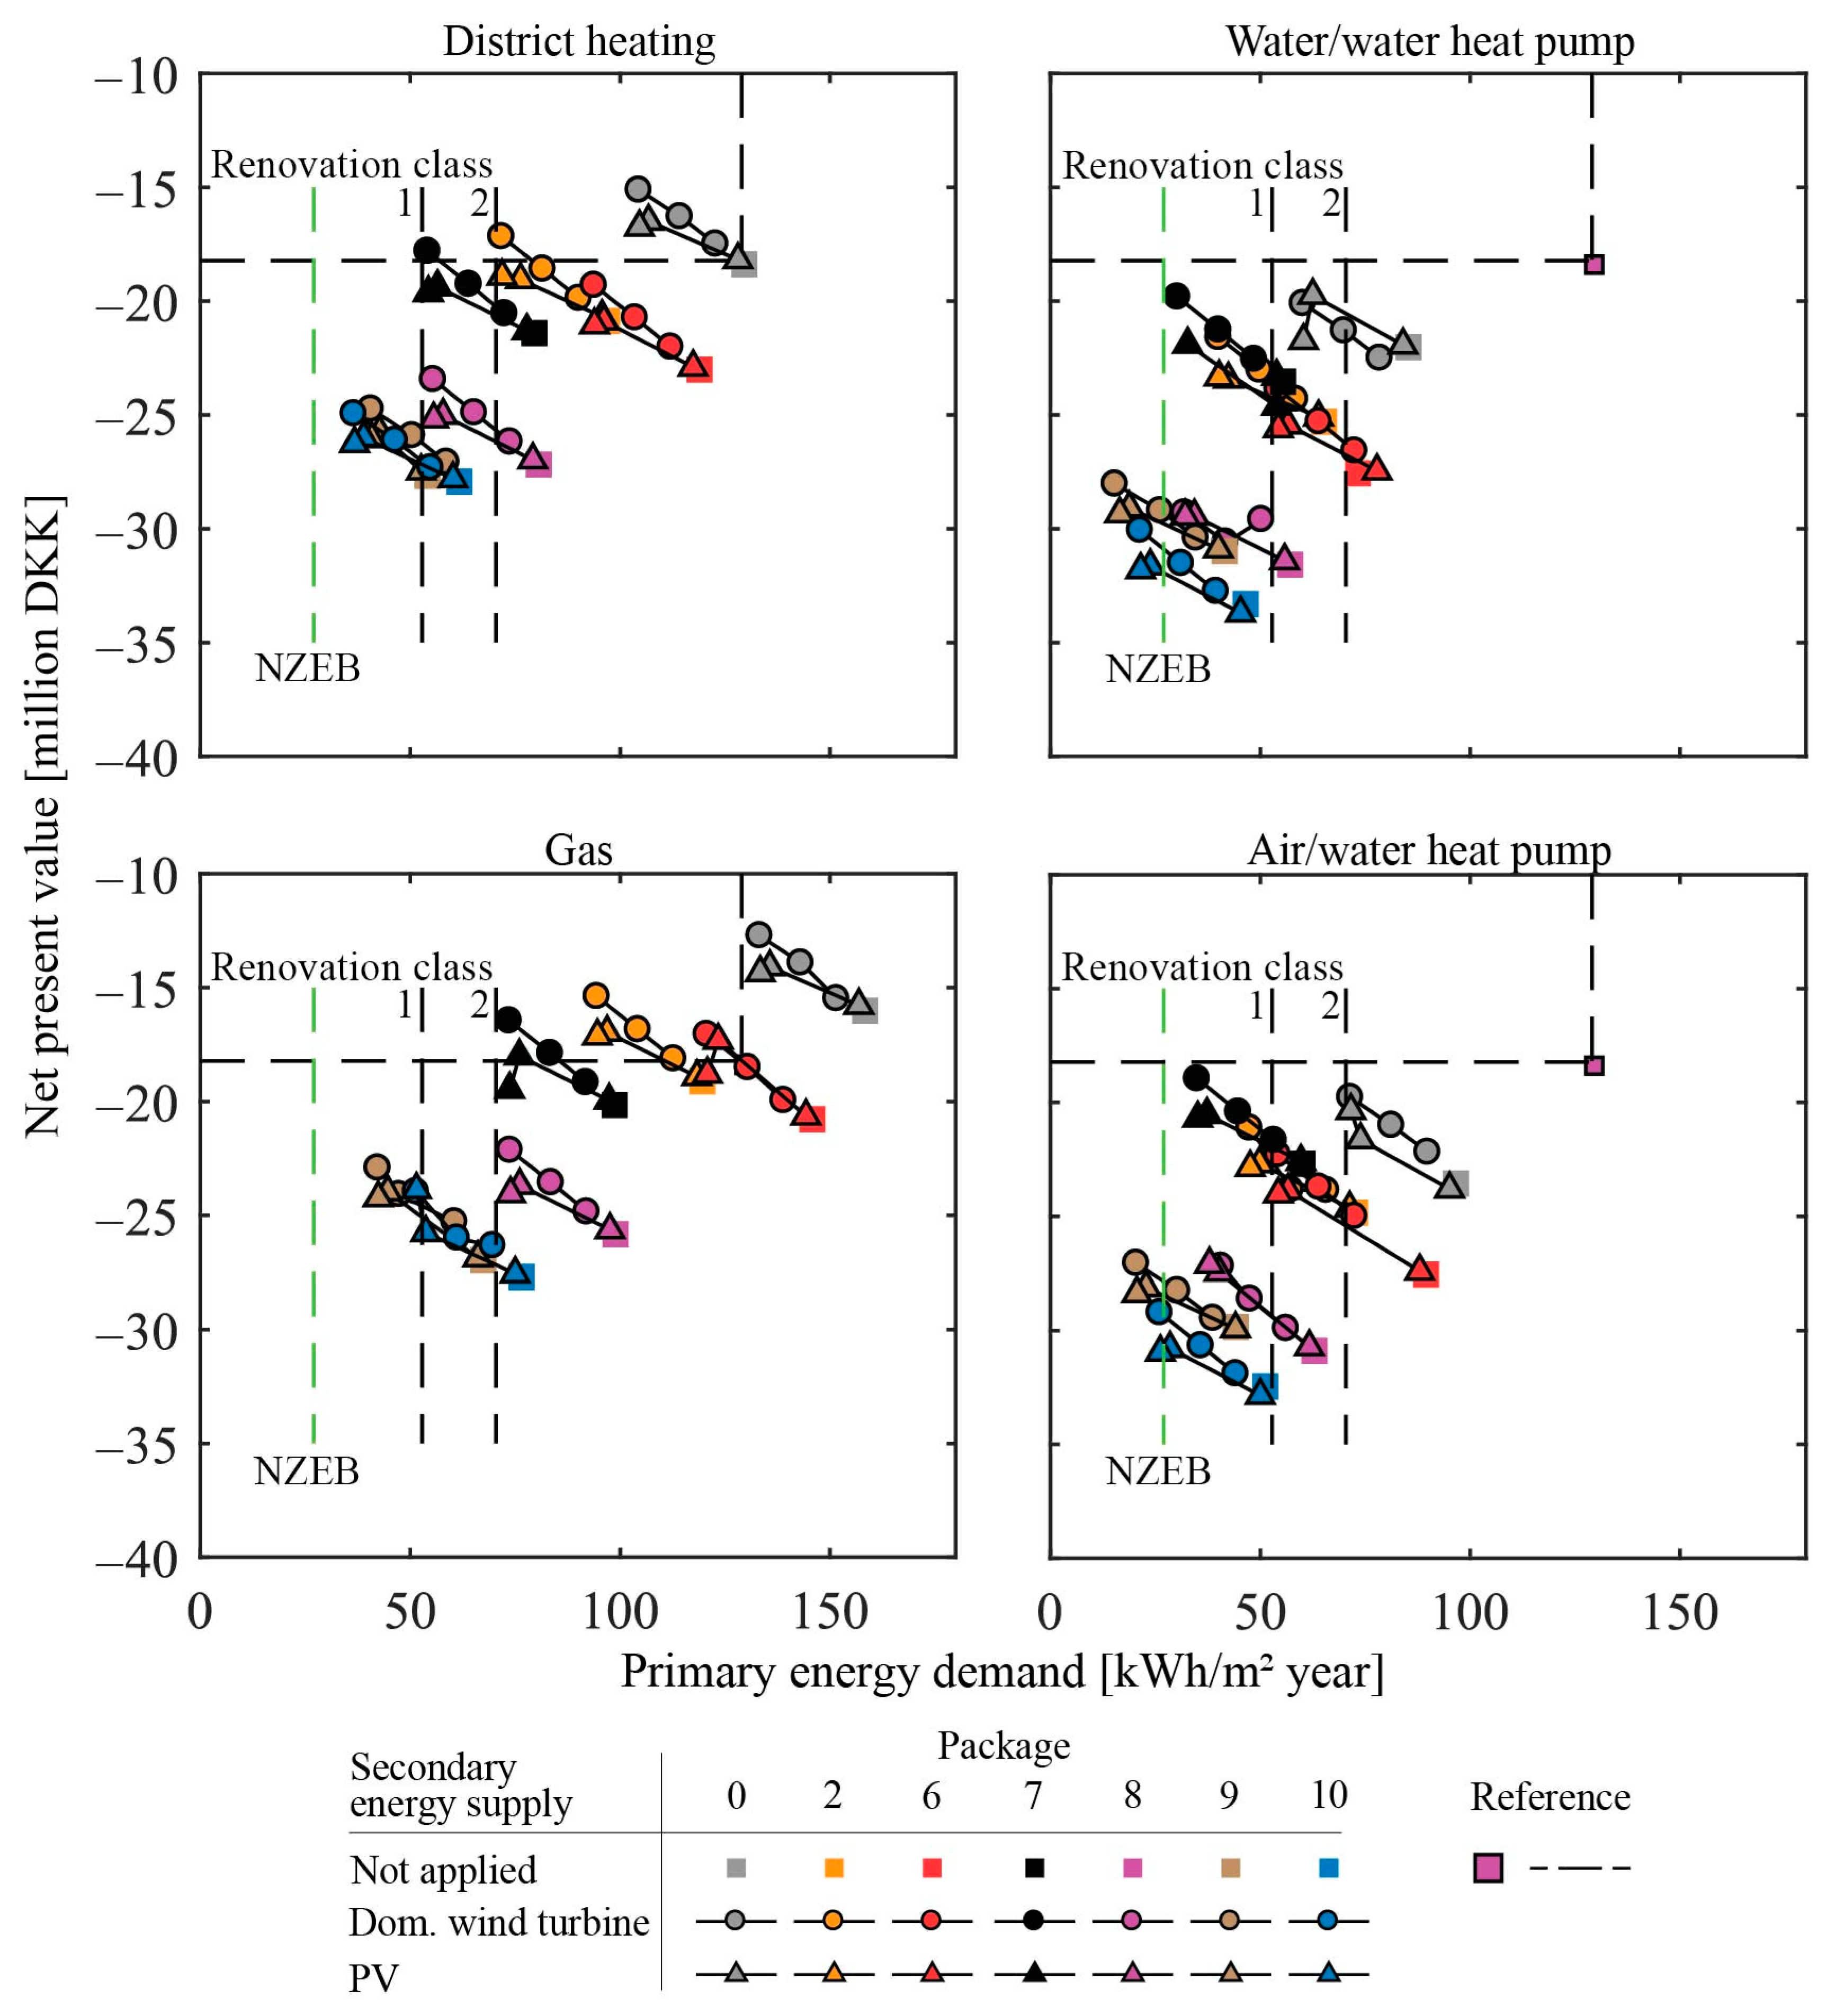
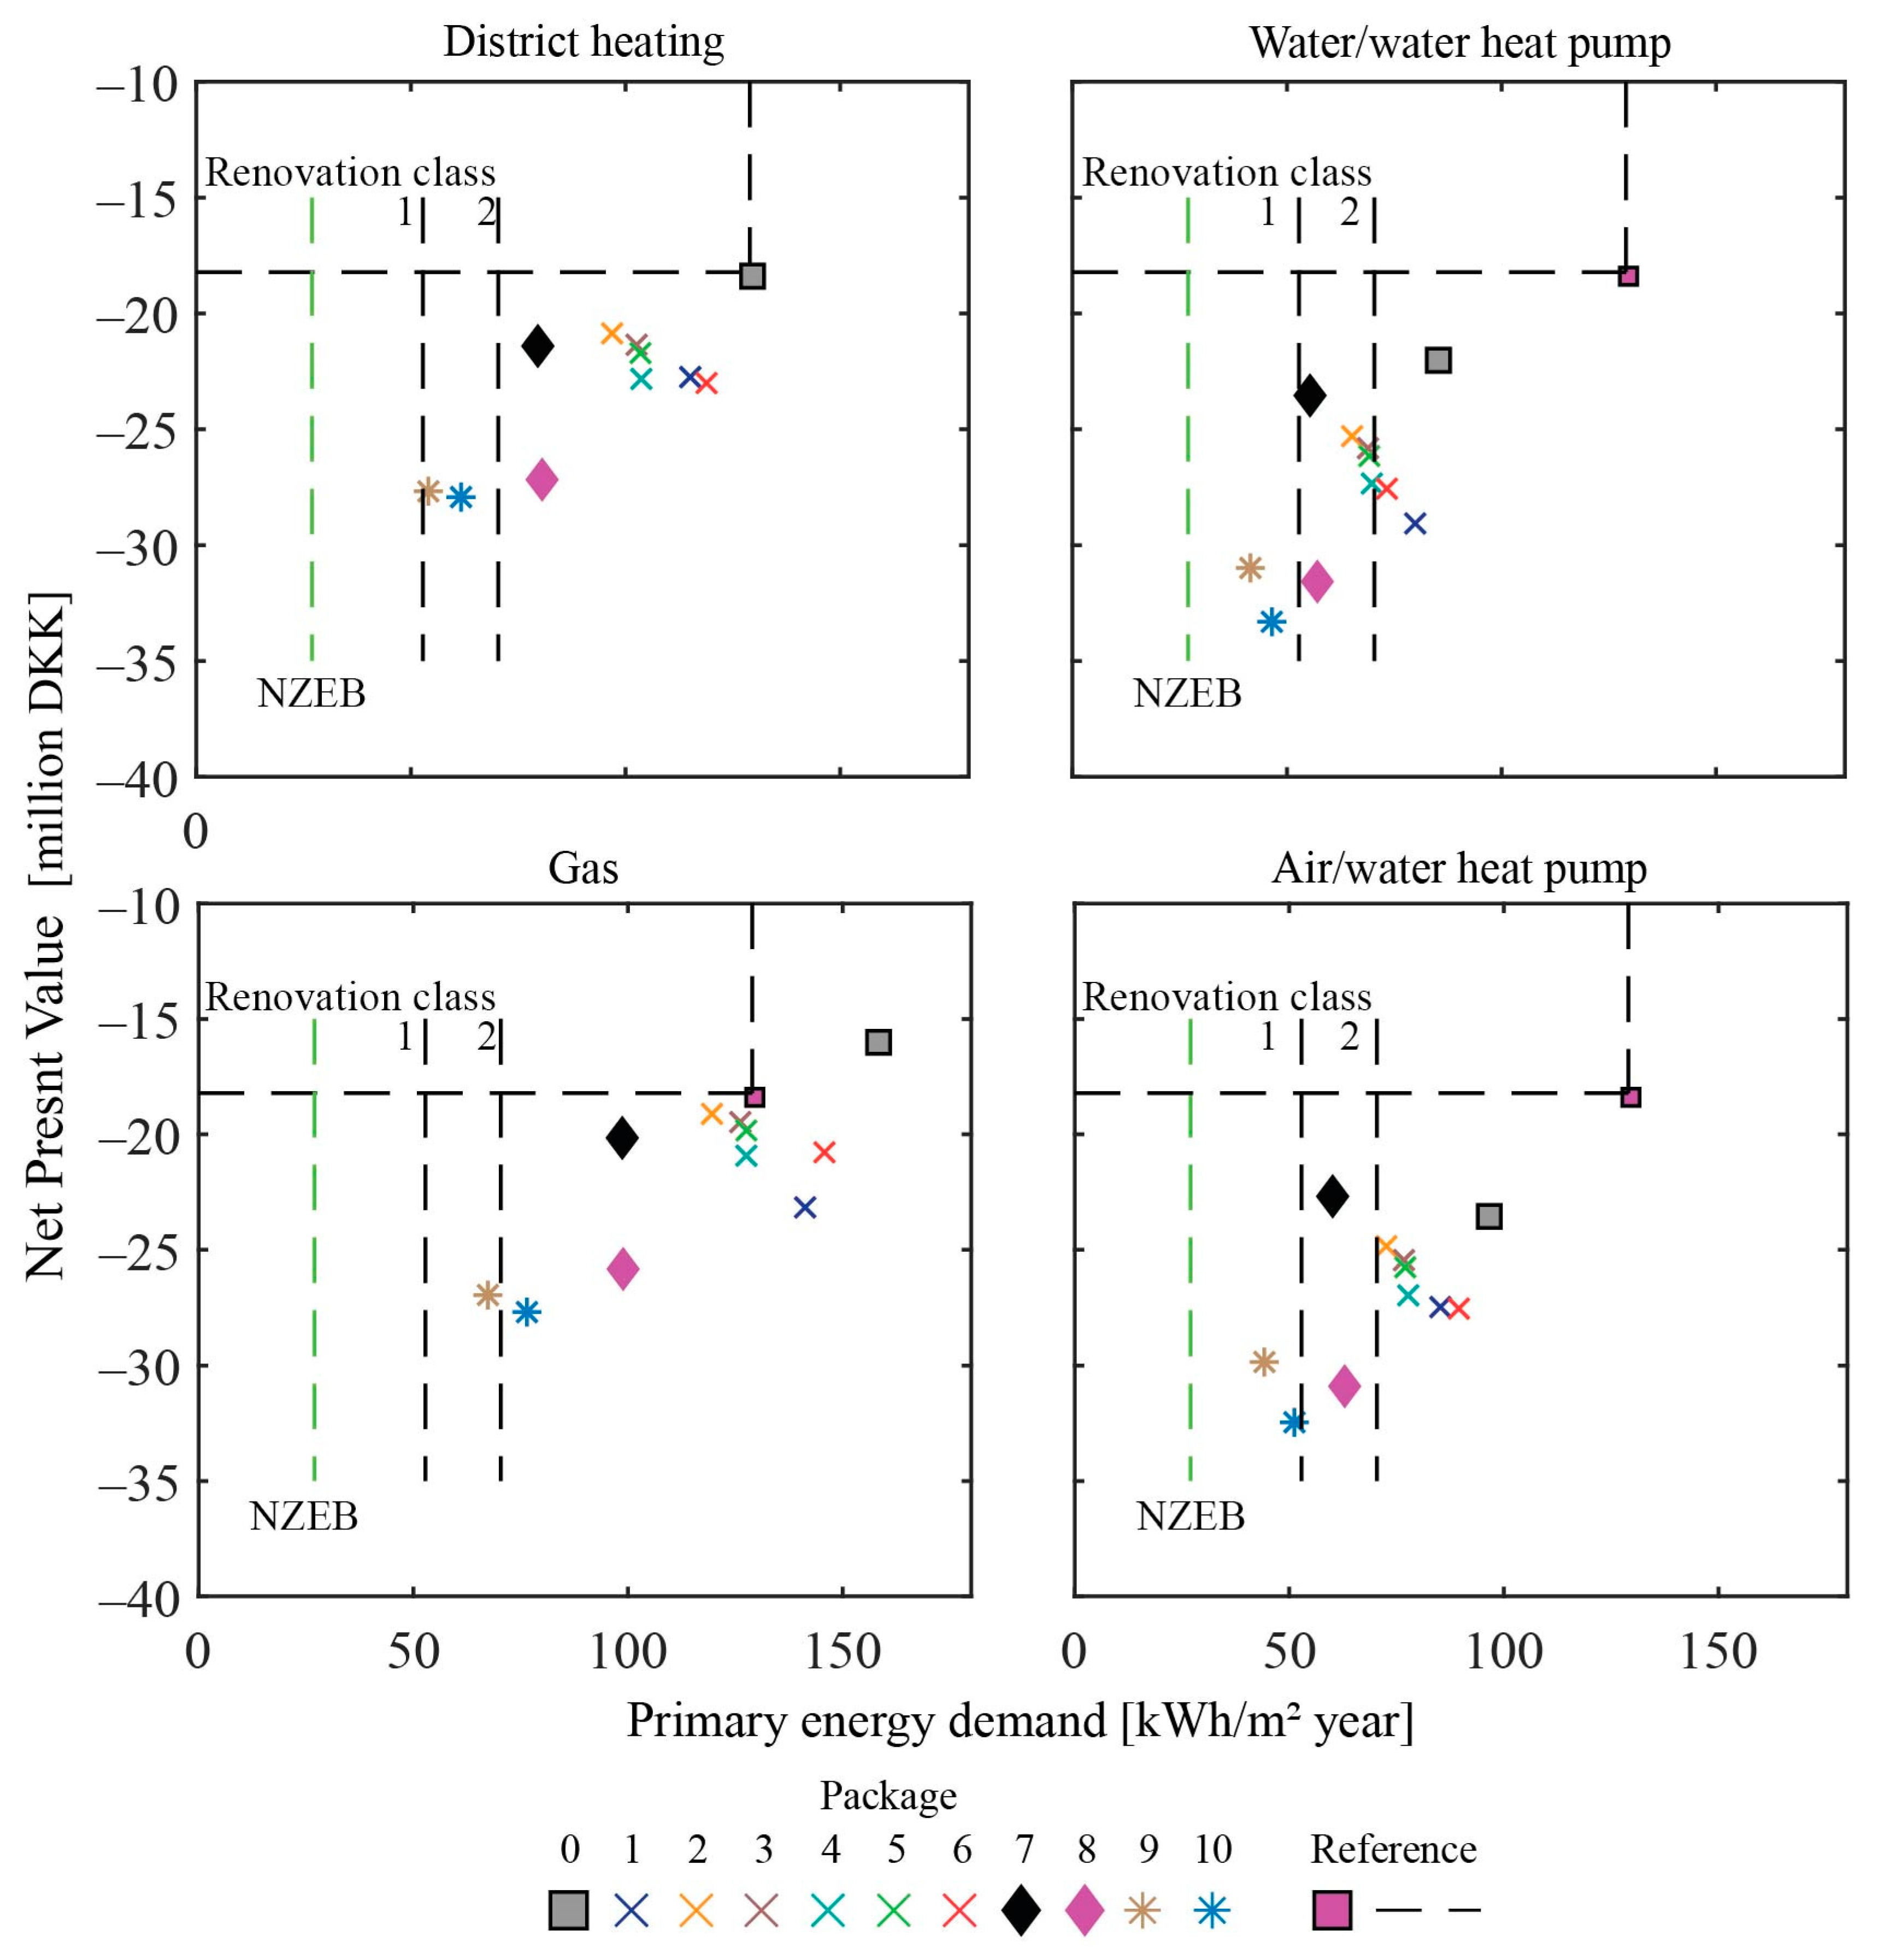
Figure 6 presents the resulting energy demand and NPV by applying the renovation packages defined in
Table 2 to the reference energy model. The results are shown for each main supply type, where packages with energy-saving targets of 20, 40, and 60% are marked with an “x”, a diamond, and a star, respectively. If district heating is kept as the main supply, packages 1–6 (target savings of 20%, based on sum of individual element contributions) provide global savings in the range of 8–25% compared to the reference. As indicated at the bottom of
Table 1, for some of the packages, the addition of individual savings and resulting savings based on global energy balance are equal, while for others, they differ. This confirms that the sum of savings of individual actions is not always equal to the global savings. In fact, the comparison between expected and achieved results in
Table 2 shows a tendency for greater difference between the results with an increasing number of elements in a package. This is evident as packages 2–5 all constitute of two renovated elements and only for one of these are the global savings lower than the sum of individual actions. Furthermore, a mismatch between global saving and sum of individual elements is also present for packages 1 and 6–10, which comprise three or more elements. On the contrary, package 7 consist of five elements and has equal global and summed energy savings, while package 3 consist of two elements but the sum and global savings differ. This indicates that both the type and number of elements included in the package have an influence on how close the expected and achieved savings are.
Analyzing the packages with 20% target savings, it can be noted that package 2 provides the most savings for the least cost-increase (25% energy savings for 14% higher NPV compared to reference). Package 6 is the least efficient and the most expensive of the six packages, providing 8% energy reduction but 26% global cost increase. Packages 3, 4, and 5 provide comparable energy savings of approximately 20%, but they vary in NPV. Respectively, there is a 17, 25, and 19% increase in NPV for packages 3, 4, and 5. Package 1 provides an 11% primary energy reduction and 24% increase in NPV.
Even though the relative relationship between packages 1 and 6 is similar for all other supply systems, it is noticed that the type of main system can influence their order in respect to cost and energy savings. For example, packages 1 and 6 are nearly equal in terms of energy savings and cost for scenarios with district heating and A/W heat pumps, while for scenarios with gas and W/W heat pumps, their cost differs noticeably. As expected, scenarios with heat pumps bring the largest energy savings compared to the reference (35–50% savings), where in the case of W/W heat pumps, this is enough to satisfy renovation class 2.
From
Figure 6, it becomes apparent that packages 7 and 8 perform equally in regard to energy reduction but with considerably different NPV values. Regardless of the applied supply system, package 7 is substantially cheaper than package 8. A possible explanation of the great cost difference can be contributed to the addition of mechanical ventilation with heat recovery to package 8. It can also be noticed that for scenarios with heat pumps, package 7 is the cheapest of all packages, while for district heating and gas, the cost and achieved savings of package 7 are comparable to those of packages 1–6. Higher energy savings outweigh the additional implementation and running cost for package 7 compared to packages 1–6. This shows that higher energy savings does not necessarily mean greater global cost; moreover, how energy savings are achieved can have a large influence on the total global cost. Considering that the approach for compiling package 7 is purely based on the CEP, sorted across all investigated elements, it can be argued that the approach can yield cost-optimal packages.
Packages 9 and 10 compare well in terms of economic and energy performance. Both of the packages include mechanical ventilation with heat recovery; thereby, they are most the expensive and comparable in cost with package 8. In all cases, package 9 is cheaper and more energy efficient than package 10. The cost difference is larger for the two heat pumps scenarios, in which case package 9 is also cheaper than package 8.
Finally, all renovation packages are combined with each of the studied renewable energy systems.
Figure 7 presents the resulting energy demand and NPV, where for clarity, only the best and worst performing packages with 20% target savings are shown. The tendencies observed in
Figure 4 for the addition of renewable systems alone remain unchanged when they are further combined with renovation packages. Namely, PV and DWT lower both the global cost and energy demand. The present analysis excludes the potential reduction of system capacity, resulting from achieved energy savings by a given renovation package. Further considerations in this regard may lower the global cost of energy-producing systems as a consequence of lower investment, replacement, and possibly operation and maintenance cost.
For district heating as the main supply option, only package 2 achieves renovation class two when combined with the largest sizes of PV and DWT. It is noticed that global costs for the largest DWT are also lower than the reference. Neither of the cases incorporating package 6 result in renovation class classification. Packages 7 and 8 in combination with two of the DWT or PV solutions satisfy renovation class two, where the larger system sizes reach the limit for renovation class one. The offset in global cost between packages 7 and 8 appears to remain unchanged. Despite the relatively large savings obtained from packages 9 and 10, reaching NZEB with district heating is still not possible, even with the addition of renewable secondary supply.
As explained previously, natural gas and district heating have equal heating demand; however, due to the higher primary energy factor for gas, these scenarios observe higher primary energy demand. Hence, the only solutions satisfying any of the denoted building renovation classes are also the ones with the highest savings. In fact, only a few solutions combining gas and large DWT or PV systems surpass requirements for renovation class one. The results in
Figure 7 confirm that natural gas would likely not be the favored solution for cases in Denmark where the target is NZEB, even with the addition of renewable energy production. However, natural gas could be applicable if the target is global cost reduction.
Nearly all solutions incorporating heat pumps and renovation packages satisfy renovation class two. Actually, when the more efficient W/W heat pump is combined with larger PVs or DWT, renovation class 2 can be achieved without the addition of energy-saving measures (marked in gray in
Figure 7). This is also true for the A/W heat pump, although only for the largest PV and DWT systems. It can be noticed that for both heat pumps types, package 7 combined with 25 kW DWT is the cheapest solution of all. Although package 7 combined with either PV or DTW does not satisfy the NZEB requirement, it can be foreseen that a small optimization of selecting one or more elements in the package with higher energy saving could make that possible. Additional reductions of about 4 and 10 kWh/m
2 per year are needed for W/W and A/W heat pumps to reach the limit value, respectively. Most solutions involving packages 9 and 10 in combination with heat pumps and secondary renewables lay in the region between 27 and 52 kWh/m
2 year. The solutions satisfying the NZEB requirement consist of A/W heat pumps combined with packages 9 and 110, 150 kWp PVs, or 25 kW DWT. In the case of W/W heat pumps, both packages 9 and 10 combined with the aforementioned renewables fit with the NZEB limit.


