Article

Measurement of Absolute Acoustic Nonlinearity Parameter Using Laser-Ultrasonic Detection

1
School of Mechanical Engineering, Hanyang University, Seoul 04763, Korea
2
Korea Atomic Energy Research Institute, Daejeon 34057, Korea
3
Department of Flexible and Printable Electronics, and LANL-JBNU Engineering Institute-Korea, Jeonbuk National University, Jeonju 54896, Korea
*
Author to whom correspondence should be addressed.
Appl. Sci. 2021, 11(9), 4175; https://doi.org/10.3390/app11094175
Submission received: 1 April 2021 / Revised: 28 April 2021 / Accepted: 28 April 2021 / Published: 3 May 2021
(This article belongs to the Special Issue Non-Destructive Testing of Materials and Structures)

Abstract

:
The absolute acoustic nonlinearity parameter β is defined by the displacement amplitudes of the fundamental and second-order harmonic frequency components of the ultrasonic wave propagating through the material. As β is a sensitive index for the micro-damage interior of industrial components at early stages, its measurement methods have been actively investigated. This study proposes a laser-ultrasonic detection method to measure β. This method provides (1) the β measurement in a noncontact and nondestructive manner, (2) inspection ability of different materials without complex calibration owing to direct ultrasonic displacement detection, and (3) applicability for the general milling machined surfaces of components owing to the use of a laser interferometer based on two-wave mixing in the photorefractive crystal. The performance of the proposed method is validated using copper and 6061 aluminum alloy specimens with sub-micrometer surface roughness. The experimental results demonstrated that the β values measured by the proposed method for the two specimens were consistent with those obtained by the conventional piezoelectric detection method and the range of previously published values.

1. Introduction

The nonlinear ultrasonic technique (NUT) is an innovative nondestructive evaluation (NDE) method [1,2] used to diagnose micro-damage such as thermal aging [3,4], fatigue damage [5], creep [6], and others [7,8] at an early stage in industrial components. This method uses the nonlinear ultrasonic behavior (i.e., ultrasonic nonlinearity) including nonlinear resonance, mixed frequency response, sub-harmonic generation, or second-harmonic generation, of an ultrasonic wave propagating through a material [9]. The NUT is known to be effective for the microstructural characterizations of a material, such as examining the grain boundaries [10], second-phase precipitates and inclusions [11,12], and dislocation density [13], when compared with the conventional linear ultrasonic technique using ultrasonic velocity and attenuation.
In the NUT, a relative acoustic nonlinearity parameter β , defined by the detected electric signal amplitudes from any ultrasonic receiver regardless of displacement, is used as an indicator [14,15]. However, this relative β is limited to a relative comparison between the before and after damage of a material [16]. To address this issue, several researchers have actively investigated the measurement of the absolute acoustic nonlinearity parameter β, which is defined by the displacement amplitudes of the ultrasonic wave. This absolute β measurement provides a quantitative evaluation of the material microstructural properties and micro-damage, thus providing the potential for quantitative NDE [17].
Currently, a piezoelectric detection method is the most widely used method to measure β, owing to its advantages of high sensitivity for the measurement of sub-nanometer-scale displacements and convenience because it utilizes general NDE equipment [18]. Dace et al. [19] proposed this method for the first time where they first measured β using the through-transmission method and calibrated β to β based on the transfer function using a pulse-echo method. They successfully obtained the β values for 6061 aluminum alloys (Al6061-T6) and fused silica. Kim et al. [20] used the piezoelectric detection method to characterize the material microstructures and successfully investigated the characteristics of second-phase precipitation in heat-treated Al6061-T6 [16] and thermally aged CF8M cast stainless steel [21]. They also evaluated the yield strength by ultrasonic reconstruction of a nonlinear stress-strain curve [22] based on the β measurements and successfully estimated the yield strength of heat-treated Al6061-T6. However, the piezoelectric detection method uses a contact-type piezoelectric transducer, which requires a couplant and special shoe for effective application [23]. Moreover, it requires a complicated calibration to compensate for the frequency-dependent sensitivity of the transducer and material-dependent-coupling coefficient between the transducer and tested material, which requires repeating the calibration whenever either the incident wave frequency or test material is changed [24].
To address these issues, studies have reported the use of noncontact detection methods such as capacitive [25] and laser detection methods [26] to measure β . Yost et al. [25] used a capacitive receiver, which measures the change in capacitance between one side of a specimen and the receiver to measure β for the aluminum alloy specimens. Hurley et al. [26] used a Michelson-type laser interferometer to measure β , which is a well-known method that provides a direct means of absolute displacement amplitudes. These methods can be applied without couplant and special shoes. They allow the user to neglect the effect of coupling at the contact interface compared to piezoelectric detection owing to their broad frequency range up to several megahertz [27]. However, they required a test specimen with an optically flat surface with a roughness level of approximately several nanometers, which makes it difficult to apply to the general NDE industry.
In this study, a laser-ultrasonic detection method is used to measure β , where a photorefractive interferometer based on two-wave mixing (TWM) in the photorefractive crystal (PRC) is used as the receiver. This method provides (1) noncontact and nondestructive measurement of β ; (2) the inspection ability of different materials without complex calibration owing to the direct ultrasonic displacement measurement, and (3) applicability for the β measurement even on the general milling machined surfaces of components because of the use of a scattered light beam. These advantages provide the potential for the quantitative characterization of hidden damage and material microstructures. The remainder of this paper is a brief description of the theoretical background for absolute β and photorefractive interferometric detection in Section 2; experimental setup for the specimen preparation and ultrasonic measurement in Section 3; experimental results and validation in Section 4, and conclusions in Section 5.

2. Brief Description of Theoretical Background

2.1. Absolute Acoustic Nonlinearity Parameter (β)

Physically, the β parameter is directly related to the second-order nonlinear elastic constants of the material [9]. Because these nonlinear elastic constants are closely related to the microstructural features and micro-damage of the components, the β parameter measured using the NUT has been used as an indicator for quantitative NDE [9]. Assuming that the planar longitudinal wave propagates in lossless isotropic media, β can be defined as follows based on the nonlinear wave equation solution [28]:
β = 8 A 2 k 2 x u A 1 2 ,
where A 1 and A 2 are the displacement amplitudes of the fundamental frequency component for the propagating ultrasonic wave and that of the harmonic component produced by the wave distortion depending on the different nonlinearity sources existing in the material, respectively, k is the wavenumber, and x u is the ultrasonic wave propagation distance. When an ultrasonic wave with a monochromatic fundamental frequency generated by an ultrasonic transmitter propagates through the material, the nonlinearity sources frequently interact with the propagating ultrasonic wave, leading to wave distortion. Consequently, the second-order harmonic component for the initial fundamental wave is generated, resulting in a varying β . The relative β parameter, which has been conventionally used for relative comparison, is defined by
β = 8 A 2 k 2 x u A 1 2 ,
where the superscript indicates the amplitude of the electrical signal measured by the receiver.

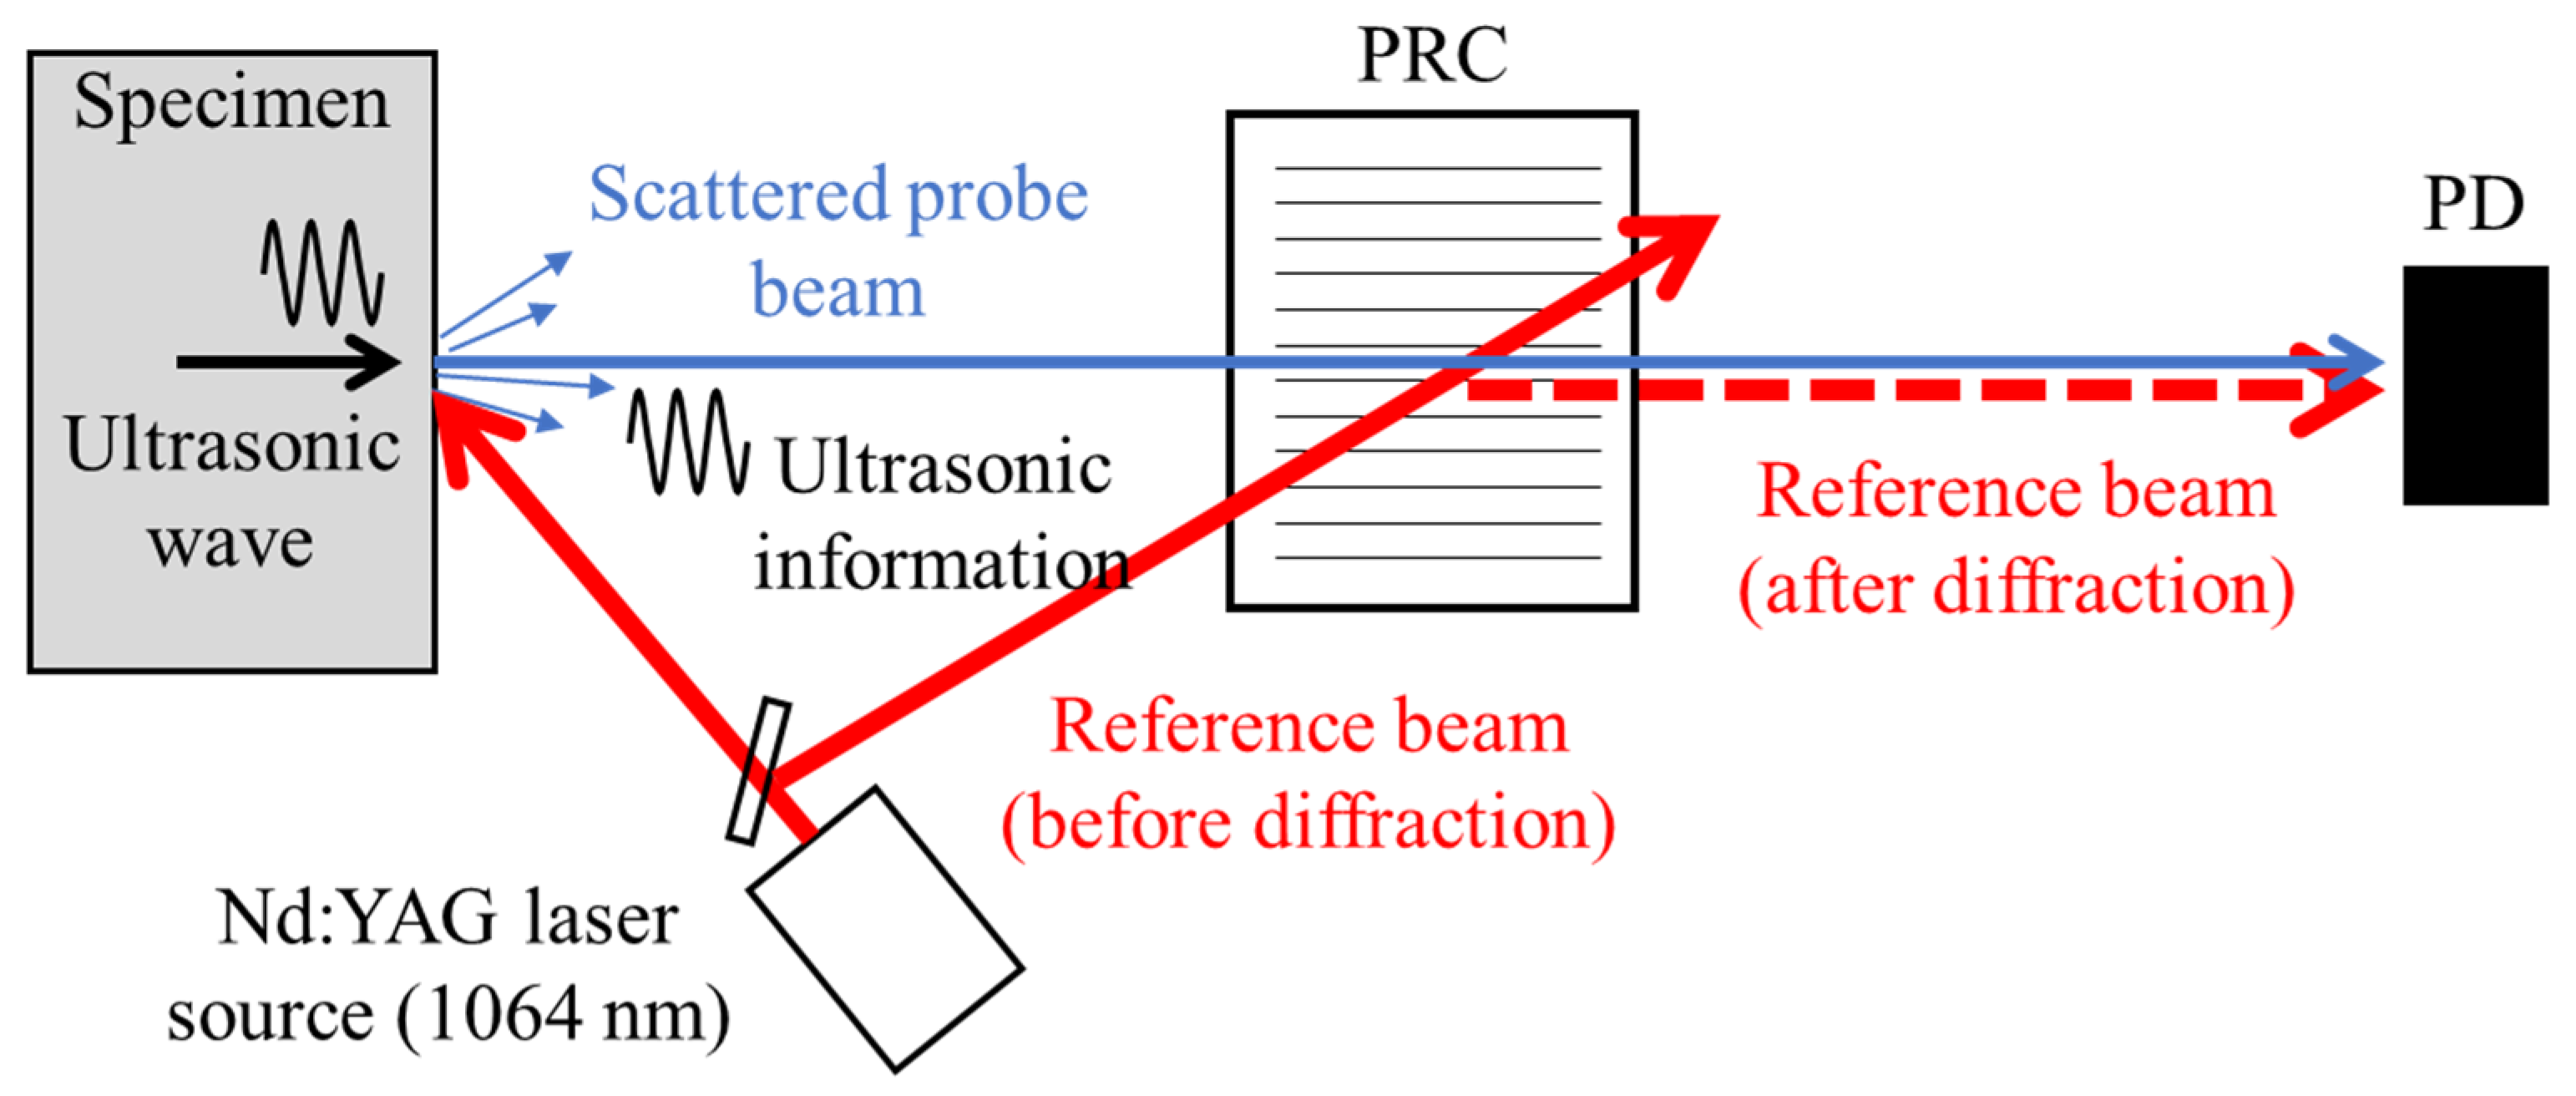
2.2. Laser-Ultrasonic Detection Using Photorefractive Interferometer

The β parameter can be obtained by measuring the ultrasonic displacement amplitudes of the fundamental and second-order harmonic components. In this study, a photorefractive interferometer based on TWM in the PRC is used to measure the ultrasonic displacement amplitudes. Figure 1 displays a schematic configuration of the system. In this system, a probe beam and a reference beam that is created by the photorefractive effect are used. The probe beam, which acquires ultrasonic information in the form of phase modulation after reflection on the test specimen, transmits into the PRC, interferes with the reference beam to perform demodulation, and then provides an ultrasonic signal proportional to the displacement amplitude [29]. Note that the minimum detectable ultrasonic displacement A obtained from several previous studies [30] is as follows:
A = λ o 4 π ( h ν · Δ f 2 η · P 0 ) 0.5 exp ( ζ x c 2 ) sin ε x c ,
where λ o is the optical wavelength, h ν is the photon energy, η is the quantum efficiency of the photodetector (PD), Δ f is the detection bandwidth, P 0 is the probe beam power on the PRC, ζ and x c are the absorption and thickness of the PRC, respectively, and ε is the photorefractive amplitude gain. In our experiments, A was approximately 0.01 nm [30], which is sufficient for the ultrasonic displacement measurements of A 1 and A 2 . A previous study has also reported that this interferometer has a higher sensitivity even on the rough surfaces of the components because it uses a scattered light beam from the surface instead of a specularly reflected light beam [31].

3. Experimental Setup
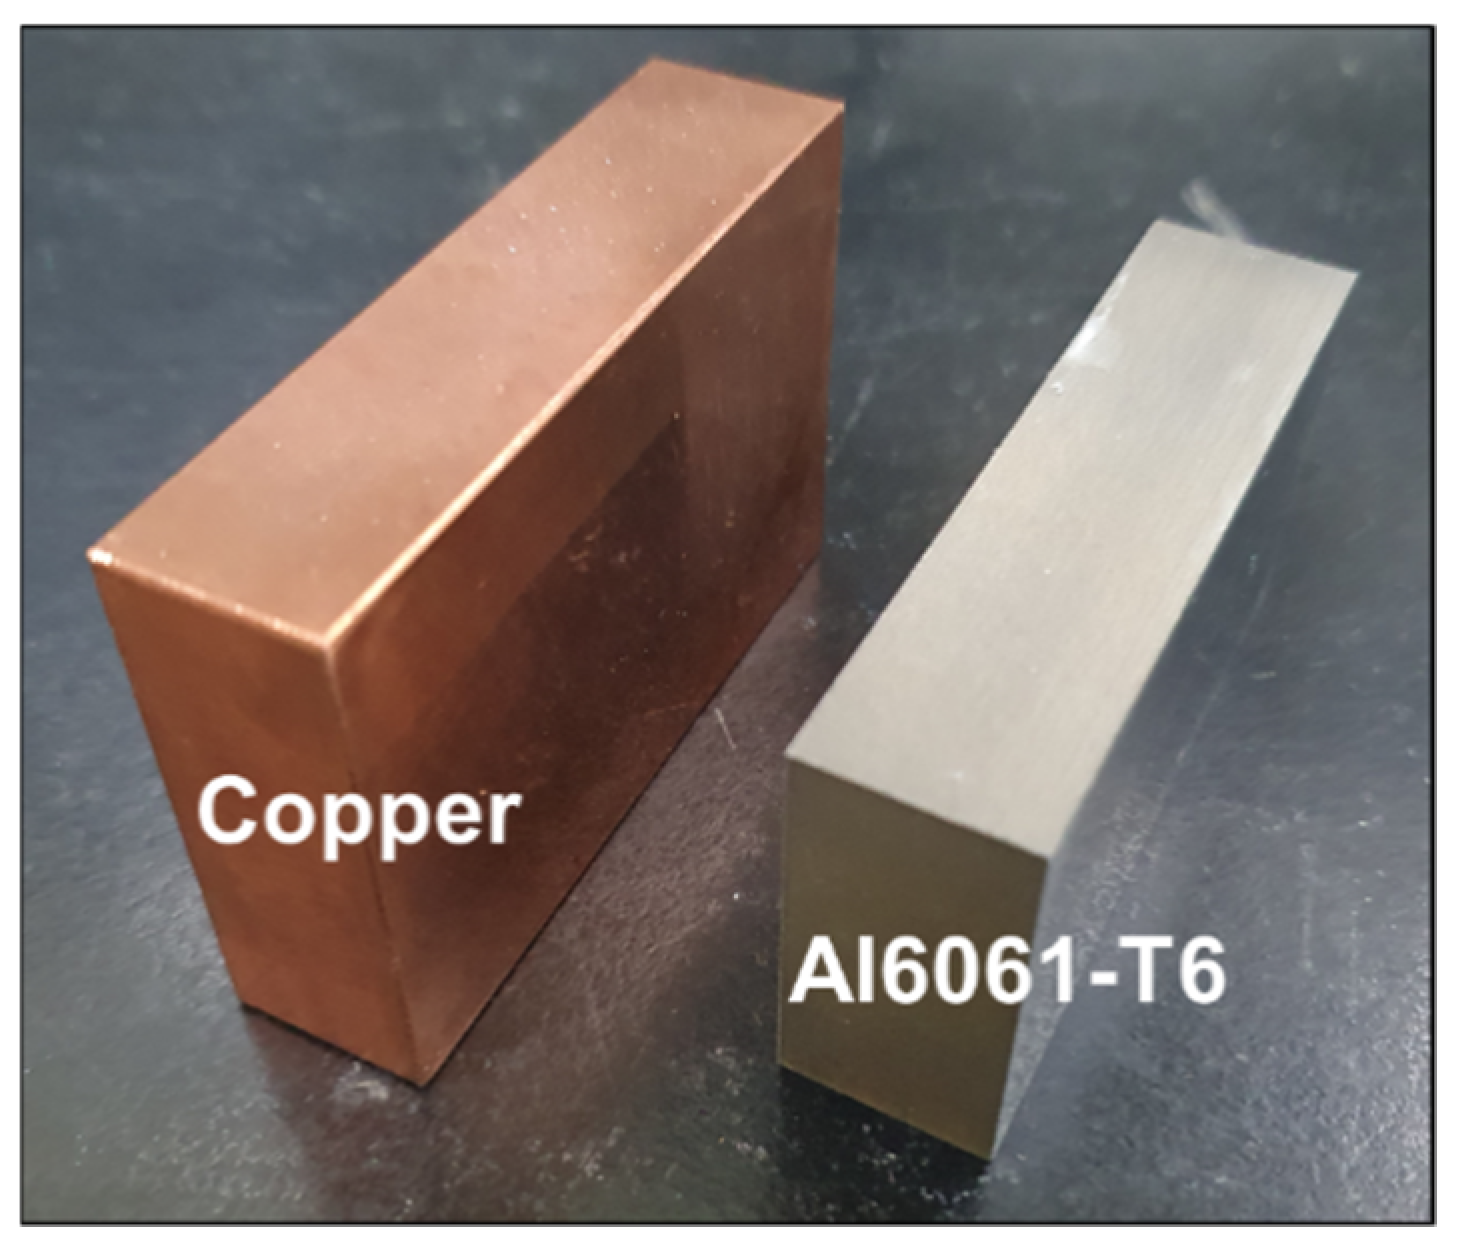
3.1. Test Specimens

Two test specimens fabricated using copper and Al6061-T6 bulk materials were prepared to validate the performance of the proposed laser-ultrasonic detection method. The material properties such as density, wave speed, and acoustic impedance for the two specimens were considerably different from each other. Detailed values are presented in Table 1. A general milling machine polished the specimen surfaces; the arithmetic average of their roughness (Ra) measured by a commercial roughness tester was approximately 0.64 μm. This level is approximately ten times greater than that of the optically flat surface required for other capacitive receivers or the Michelson and Fabry–Pérot interferometers [9]. Both specimens were of the same thickness of 20 mm. Note that when the wave propagation distance (i.e., specimen thickness) is greater than a certain level (called the Fresnel zone [32]), ultrasonic diffraction occurs independent of the material nonlinearity and increases the measurement error. Here, because the wave propagation distance (20 mm) is within the Fresnel zone (copper: 48 mm, Al6061-T6: 37 mm), the diffraction effect is not considered. Images of the test specimens are displayed in Figure 2.

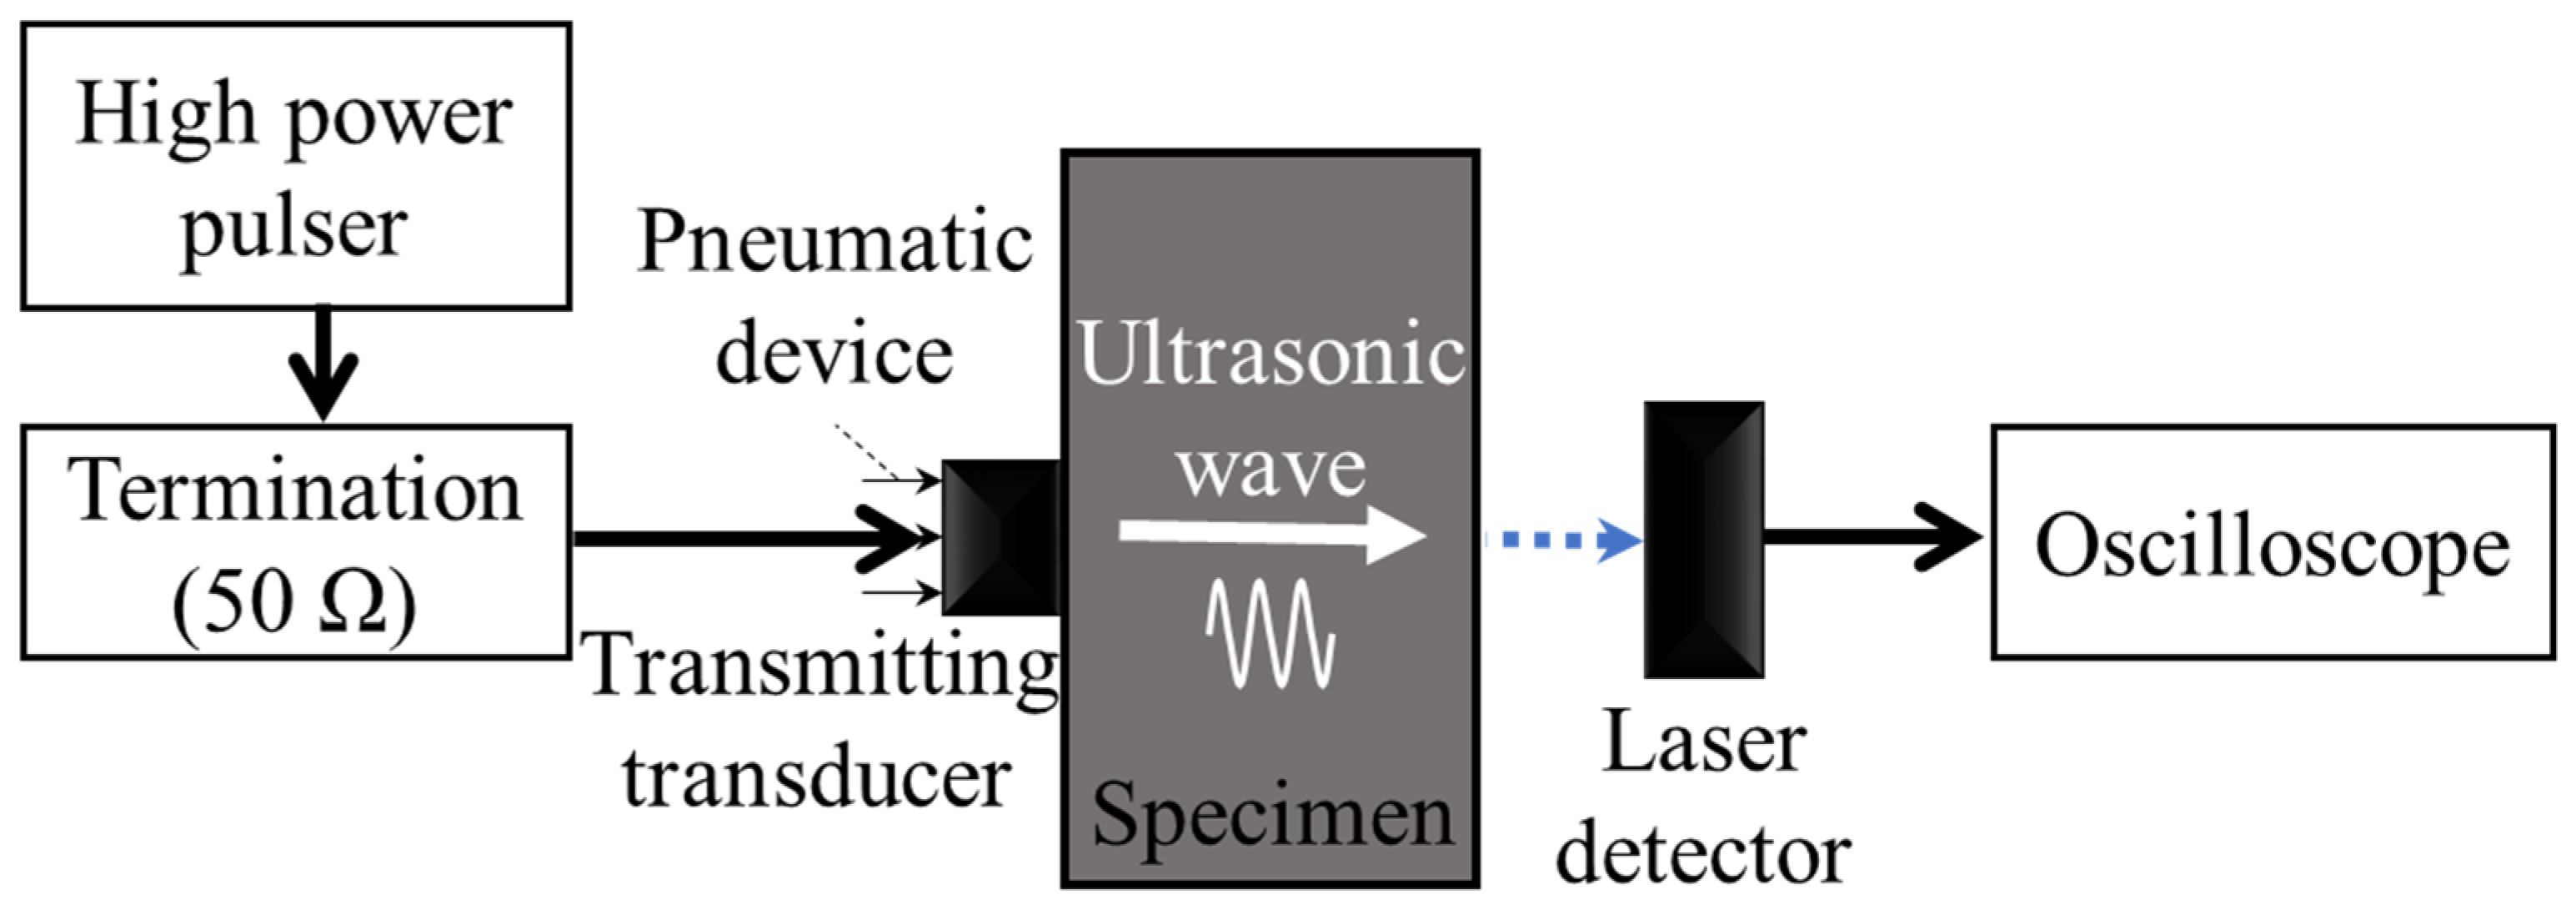
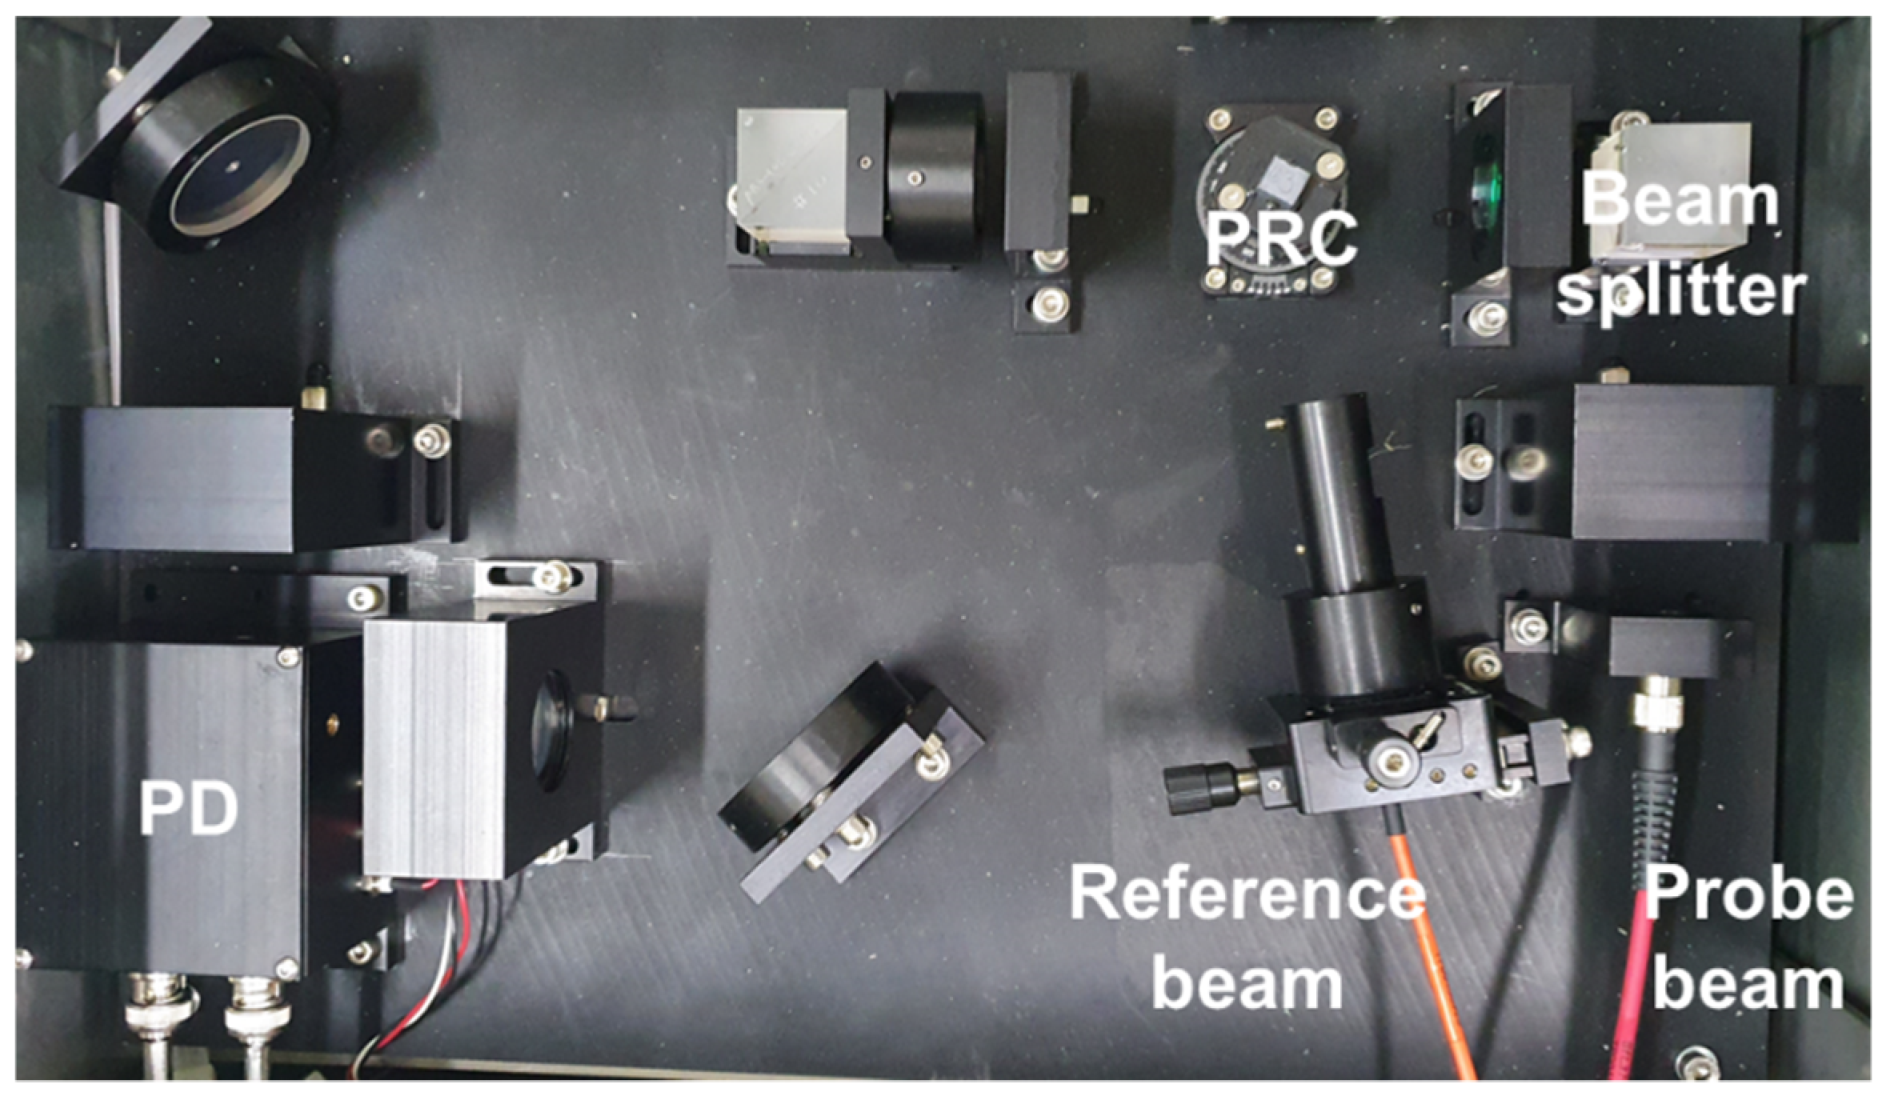
3.2. Ultrasonic Measurement Using Laser Detection

Figure 3 displays a schematic diagram for the measurement of the β parameter using the proposed laser-ultrasonic detection method. A high-power pulser (RITEC, RAM-5000) produced tone-burst sinusoidal signals with 10 cycles and drove a LiNbO 3 transducer with a center frequency of 2.25 MHz, which was used as a transmitter. The ultrasonic wave produced by the transmitter propagated through the test specimen and was measured on the other side using laser-ultrasonic detection. In the laser-ultrasonic detection system (TECNAR, TWM), the probe beam laser used was a frequency-stabilized Nd:YAG operating at a wavelength of 1064 nm . The probe beam was delivered into the PD head through fiber optics to illuminate the surface of the test specimen, and the scattered light collected by the head optics was delivered into the main interferometer. A picture of the photorefractive interferometric system is displayed in Figure 4. The PD head was positioned vertically relative to the target surface to detect the out-of-plane displacement; the distance between the PD head and surface was 45 mm. The output signal from the interferometer was recorded on a digital oscilloscope (Lecroy, Wavesurfer452) with 300 averaging and signal processing on a computer. All experiments were conducted by increasing the input power to obtain the linear fitting plot of A 2 over A 1   2 (i.e., β ) and repeated four times to improve the repeatability and reproducibility of the measurement.

4. Experimental Results

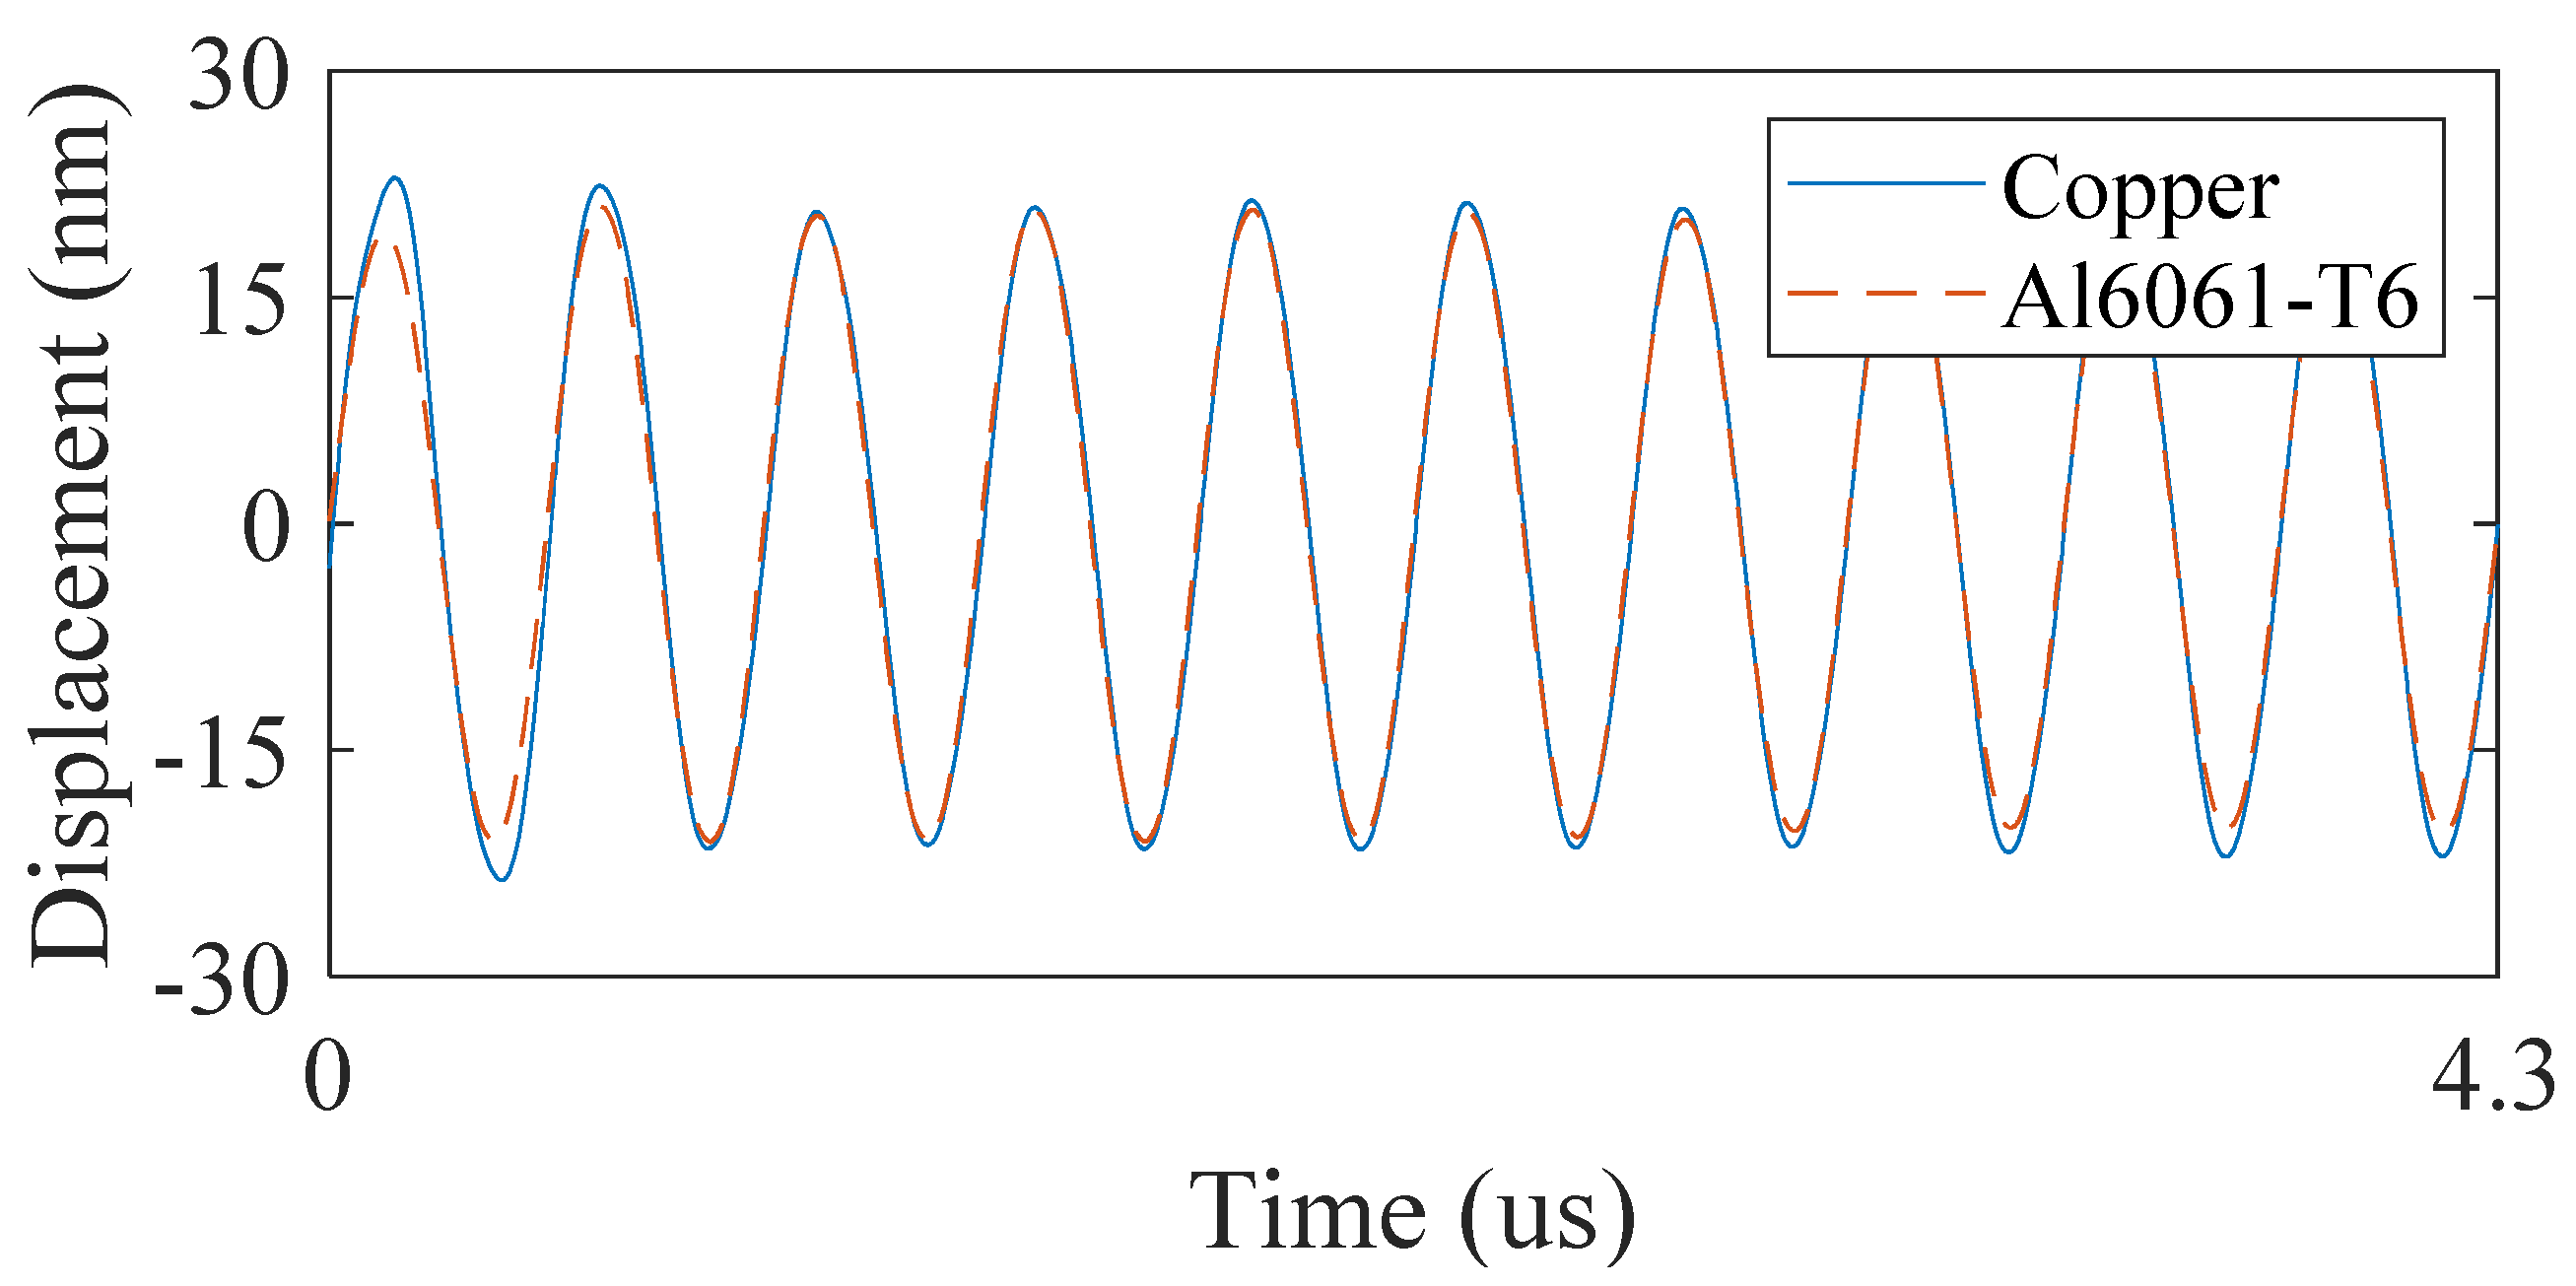
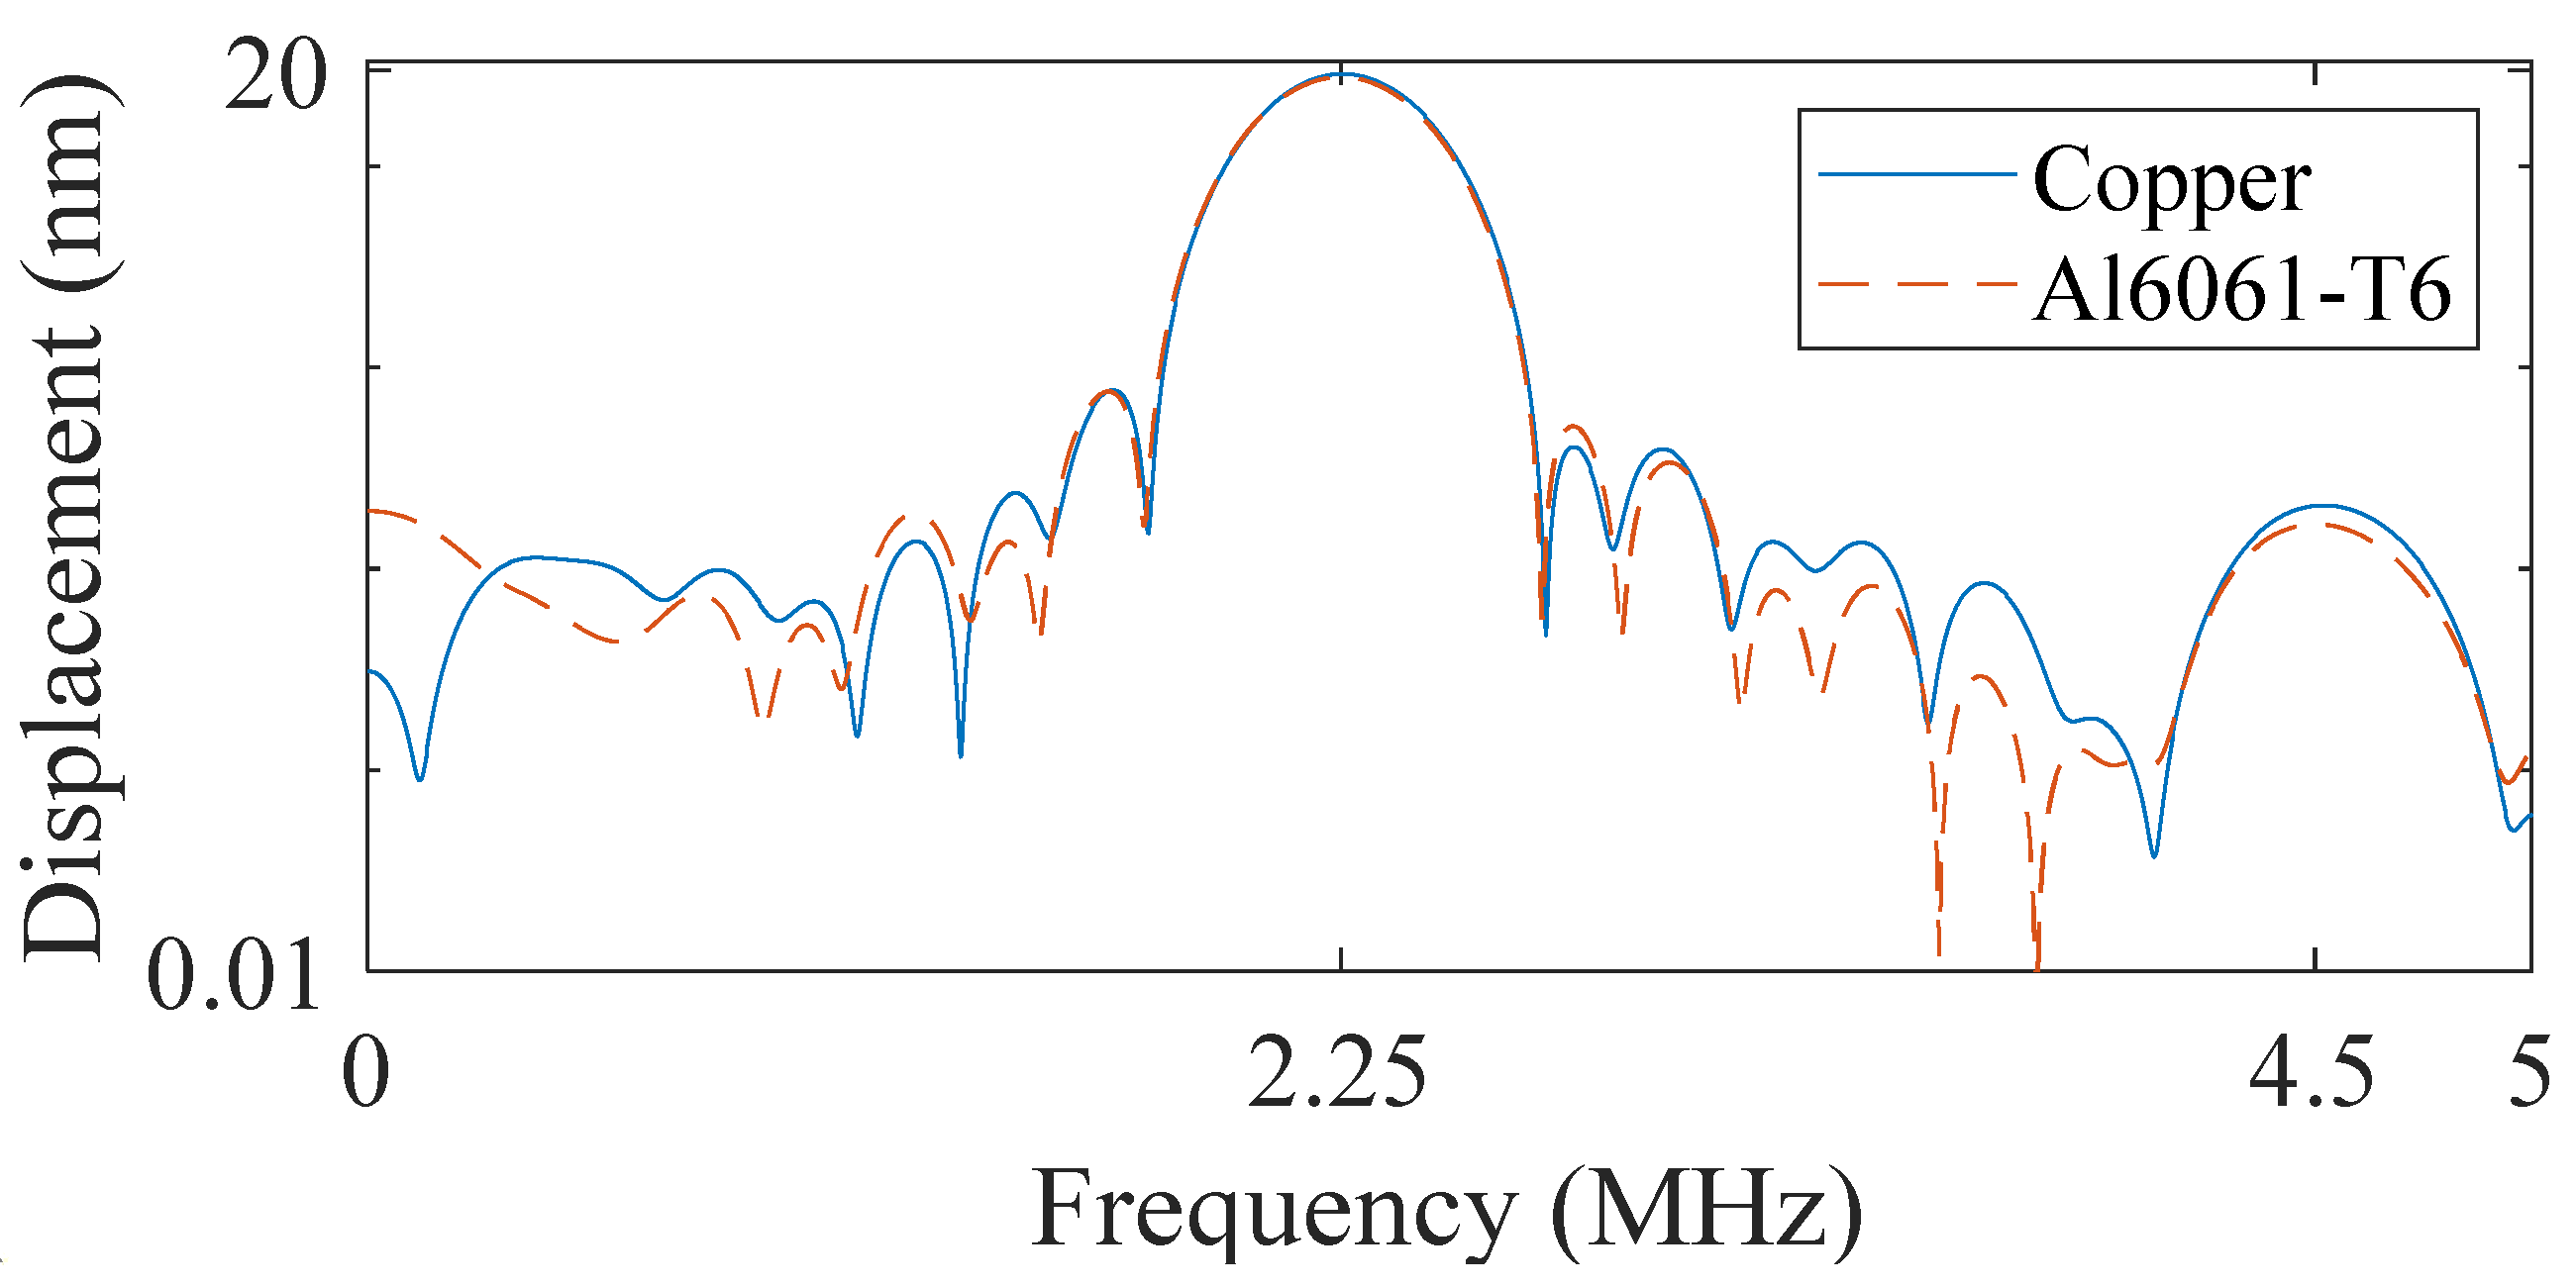
4.1. Laser-Ultrasonic Detection Results
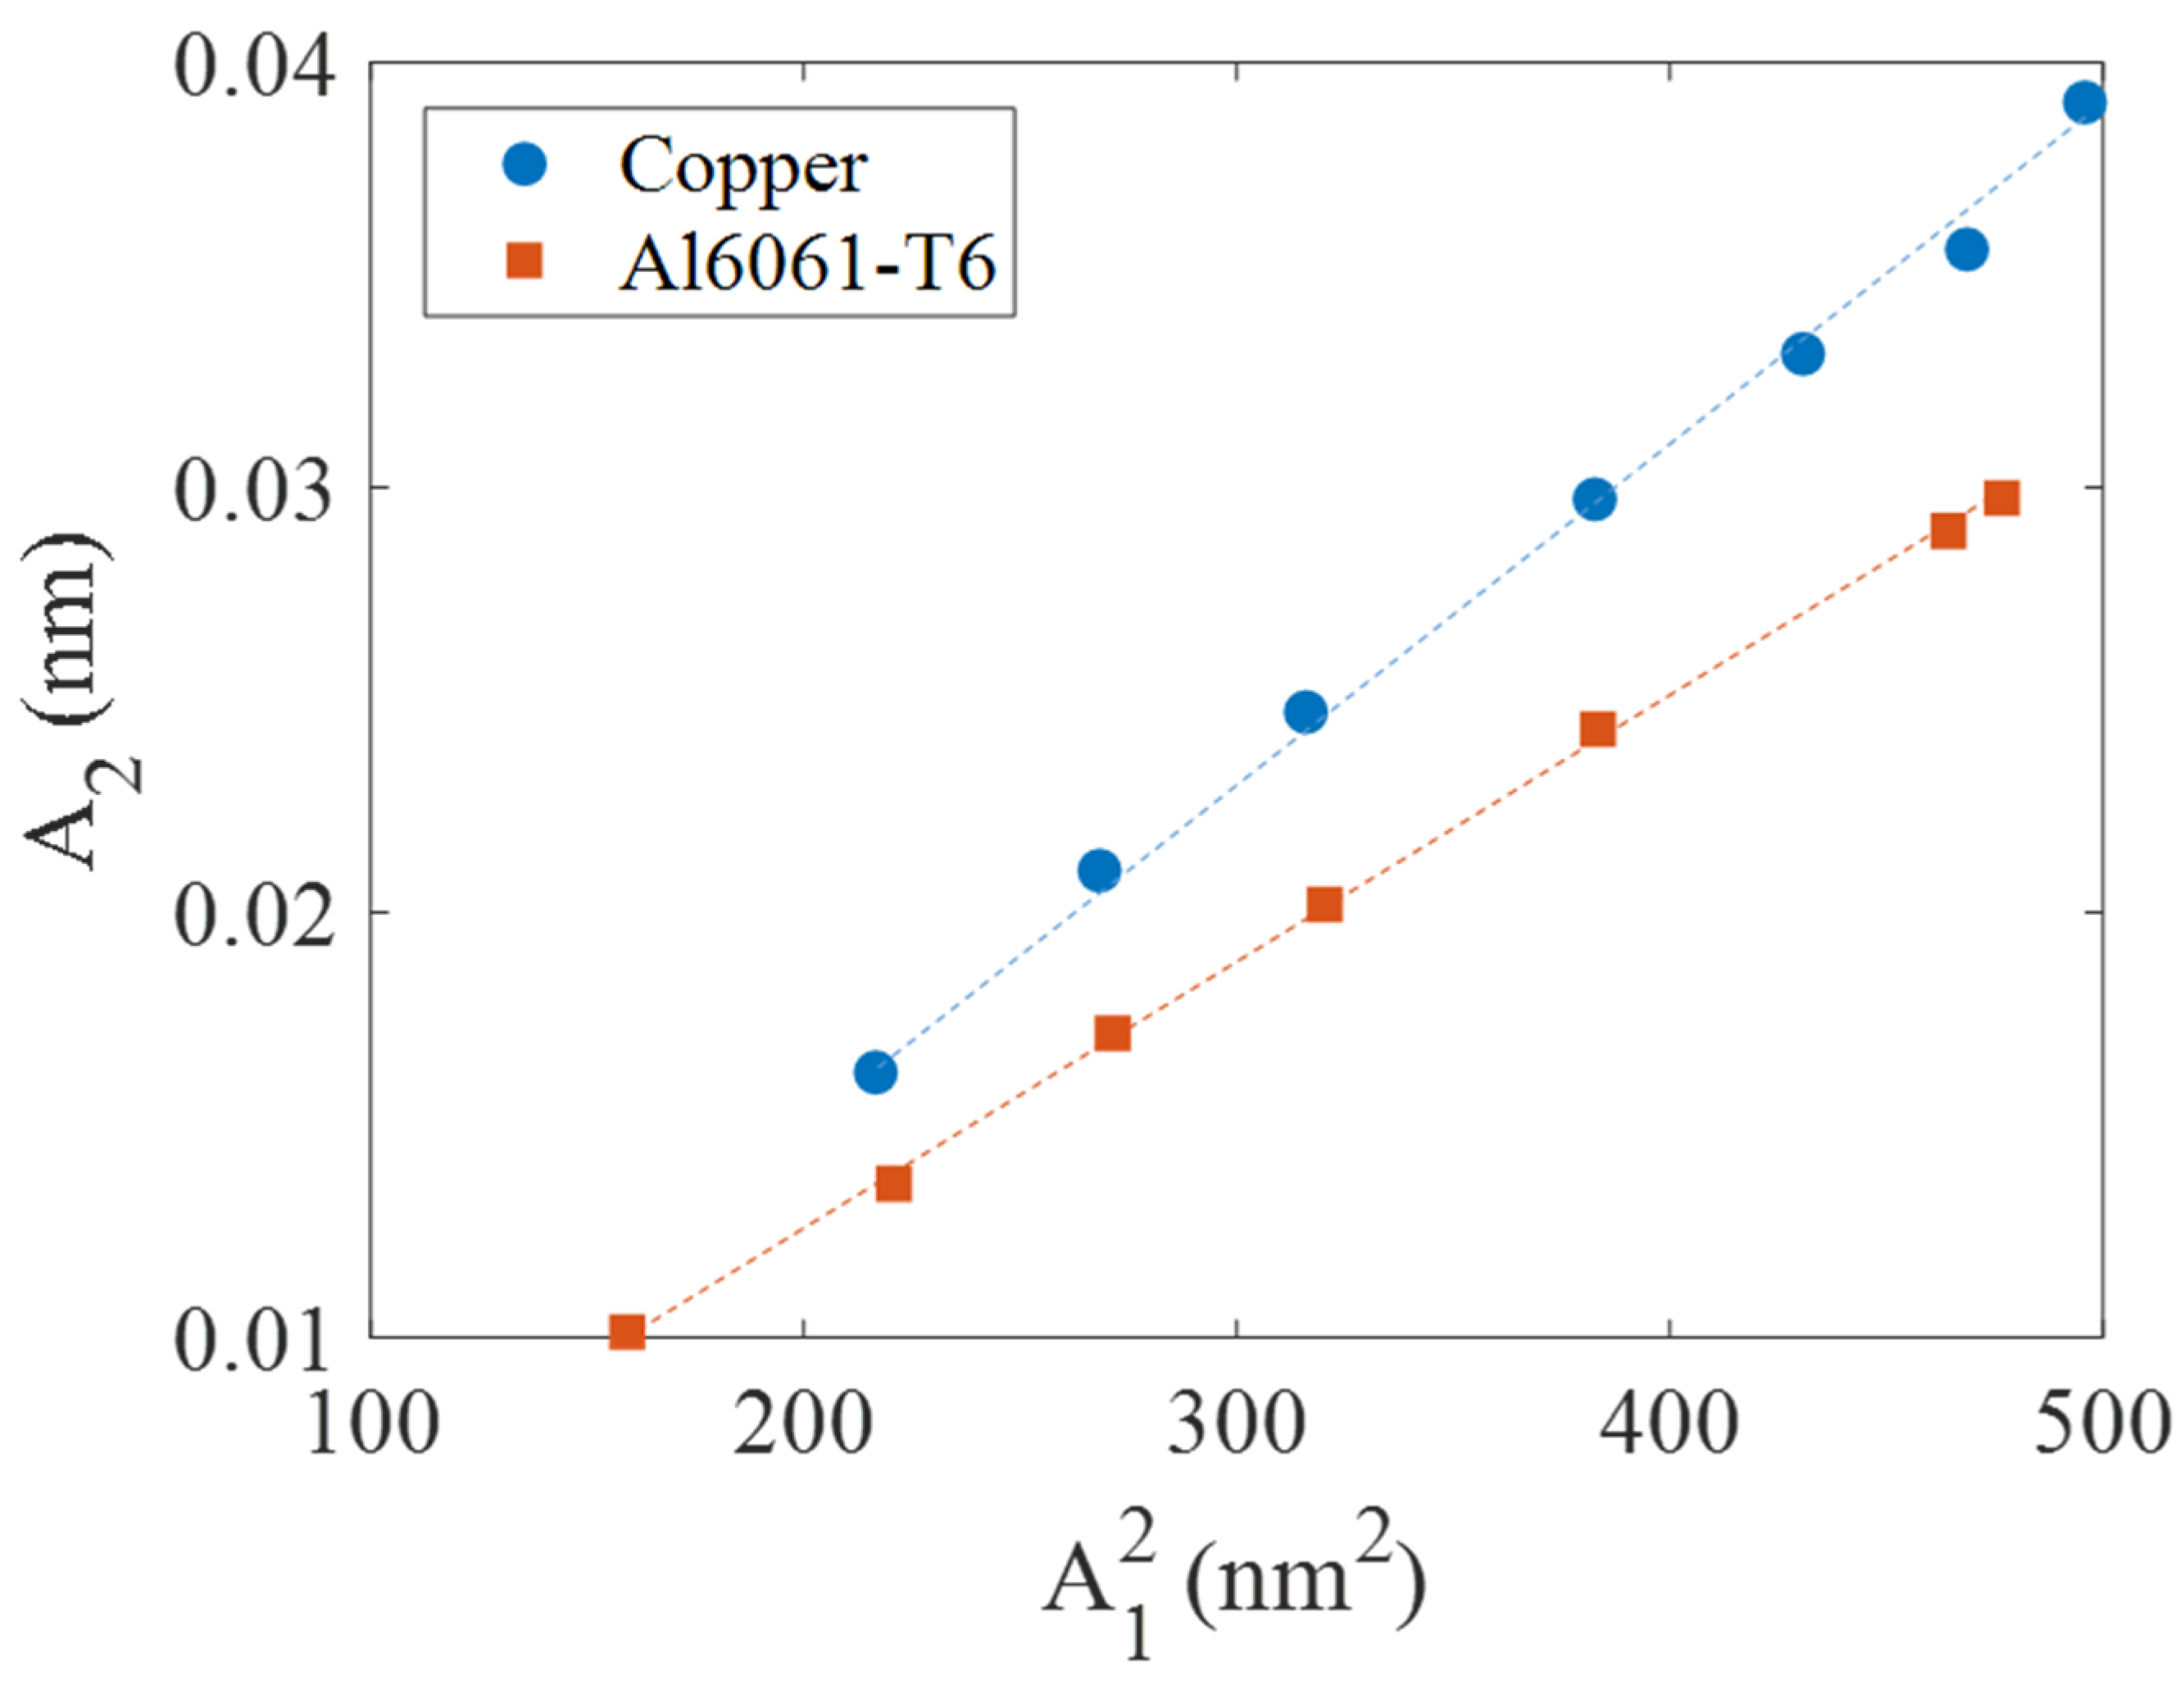
The absolute β parameter was measured using a laser-ultrasonic detection method. Before measuring β , the capability of the absolute ultrasonic displacement amplitude measurement of the photorefractive interferometer was compared with that of the conventional Fabry–Pérot interferometer. Because the surface roughness of the tested prepared specimens was rougher (Ra: 0.64 μm) than the optically flat surface level (Ra: approximately several nanometers), where the Fabry–Pérot interferometer was applicable, the copper and Al6061-T6 specimens were polished with a mirror-like finish (approximately 8 nm). Figure 5 displays the measurement results of the ultrasonic displacement amplitudes for the copper (blue circle) and Al6061-T6 (brown square) specimens using the photorefractive and Fabry–Pérot interferometers, where the former used general milling machined specimens and the latter used the mirror-like specimens. The measurement results for the copper and Al6061-T6 specimens indicated a high correlation with the y = x function, within 10% deviation, demonstrating the capability of the absolute ultrasonic displacement amplitude of the photorefractive interferometer, even on a rough surface. Note that a deviation of about 10% is an acceptable level in consideration of the experimental environment or the effect of surface roughness of the specimen [26].
Figure 6 displays typical ultrasonic signals in the time-domain measured using the laser detection method, where the blue solid and brown dotted lines represent the signals obtained from the copper and Al6061-T6 specimens, respectively. The y-axis represents the ultrasonic displacement amplitude. For a clear comparison of the waveforms obtained from the two specimens, the waveform for the copper specimen was horizontally shifted in the time domain corresponding to that of the Al6061-T6 specimen. Note that because the longitudinal ultrasonic velocities for the copper (4750 m/s) and Al6061-T6 (6300 m/s) specimens are different from each other, the arrival times of the ultrasonic signals measured for the two specimens are different.
The displacement amplitudes of the fundamental ( A 1 ) and second-order harmonic ( A 2 ) components were extracted in the frequency domain. Here, a Hanning window was applied to increase the frequency resolution, where a side-lobe effect generated by the fundamental component, which has the potential to bury the second-harmonic component, was minimized. The scaling factor was also compensated for by the energy loss according to the Hanning window [33]. The typical signals for the tested specimens in the frequency domain, which were Fourier transformed using fast Fourier transform, are displayed in Figure 7, where blue and dotted-brown lines present the signals for the copper and Al6061-T6 specimens, respectively. In Figure 7, while the ultrasonic displacement amplitude of the fundamental frequency component for the copper specimen corresponded to that of the Al6061-T6 specimen, displacement amplitudes of the second-order harmonics for the copper and Al6061-T6 specimens are slightly different with each other. Although the surface roughness of both specimens was not optically flat, the spectra of the second-order harmonics and that of the fundamental frequency components can be clearly observed.
Figure 8 displays the relationship between A 2 and the square of A 1 , which were extracted from their frequency spectra, as a function of increasing input displacement amplitudes in both specimens. The relationships indicate acceptable linearity with a high correlation coefficient (0.99) for both specimens. From the slope, ultrasonic wavenumber ( k u ), and ultrasonic wave propagation distance ( x u ) for each specimen described above, the absolute β parameters for the copper and Al6061-T6 specimens were determined and are listed in Table 2. The β value of the copper specimen obtained from the laser-ultrasonic detection method was β c u = 3.4 , and that of the Al6061-T6 specimen was β A l = 4.9 .
The difference in β values between the two materials is attributed to the difference in the microstructural characteristics such as the lattice parameter, crystal structure, phase, and dislocation density between the two materials. Generally, the β value of Al6061-T6 is higher than that of the copper because aluminum alloys such as Al6061-T6 are composed of various ingredients, which may result in higher lattice anharmonicity and dislocation density when compared to the pure copper [9].

4.2. Validations

A conventional piezoelectric detection method was used to validate the experimental results for the proposed laser-ultrasonic detection method. This method was composed of two parts: a relative β parameter measurement and calibration [20]. In the former, a through-transmission method [20] with a pair of 2.25 MHz and 5 MHz piezoelectric transducers as transmitter and receiver was used to measure the β′ parameter. Here, except for the change in the receiver, the experimental procedure was virtually the same as the aforementioned laser-ultrasonic detection. In the latter, a pulse-echo method [34] with a 5 MHz piezoelectric transducer, which corresponded to the receiver in the through-transmission method, was conducted to obtain a transfer function; this was used to calibrate the electric voltage amplitude measured from the piezoelectric receiver to the absolute displacement amplitude.
The βCu and βAl values obtained from the piezoelectric detection method are listed in Table 2 with those obtained using the laser detection method. The reference ranges of the previously published studies are listed together. The βCu and βAl values obtained from the piezoelectric detection were 3.2 and 5.0, respectively. The experimental results for the laser and piezoelectric detection methods demonstrated acceptable agreement within a deviation of approximately 4%. These values were within the range of previously published values. This 4% deviation could be unavoidable when considering the differences in the experimental environment, detector size, and surface roughness. These results indicate that the proposed method is suitable for measuring the absolute β parameter independent of the material type in a noncontact and nondestructive manner. Furthermore, the results indicate that this laser-ultrasonic detection method could be applicable even on rough surfaces corresponding to general milling machined surfaces (approximately sub-micrometer scale).

5. Conclusions

In this study, the measurement of the absolute acoustic nonlinearity parameter ( β ) was conducted using the laser-ultrasonic detection method, where a laser interferometer based on TWM in the PRC was used as the receiver. This detection method provides (1) noncontact and NDE to measure the β parameter; (2) owing to the direct ultrasonic displacement detection, an inspection ability of different materials without complex calibration when compared to conventional piezoelectric detection, and (3) applicability for general milling machined surfaces owing to the use of photorefractive interferometer.
First, the absolute ultrasonic displacement amplitudes measured in the general milling machined surfaces (Ra: 0.64 μm) for the copper and Al6061-T6 specimens using photorefractive interferometric detection indicated high correlation with those measured on an optically flat surface (Ra: 8 nm) using conventional Fabry–Pérot interferometric detection. For the copper and Al6061-T6 specimens with general milling machined surfaces, the absolute β C u and β A l values measured by the proposed method were 3.4 and 4.9, respectively, which matched well with those of the conventional piezoelectric detection method and the cited reference ranges. These results indicate that the proposed laser detection method is applicable to components with different material properties and rough surfaces. A future study is warranted to apply the proposed laser detection method to different materials and assess material degradation such as fatigue and thermal aging.

Author Contributions

Conceptualization, S.-H.P.; methodology, S.-H.P., J.K., D.-G.S. and K.-Y.J.; validation, S.-H.P. and S.C.; formal analysis, S.-H.P.; investigation, S.-H.P.; resources, S.-H.P. and K.-Y.J.; writing—original draft preparation, S.-H.P.; writing—review and editing, S.-H.P. and K.-Y.J.; supervision, S.C. and K.-Y.J.; funding acquisition, K.-Y.J. All authors have read and agreed to the published version of the manuscript.

Funding

This work was supported by a Korea Institute of Machinery & Materials grant funded by the Korea government (MSIT) (NK230l).

Institutional Review Board Statement

Not applicable.

Informed Consent Statement

Not applicable.

Conflicts of Interest

The authors declare no conflict of interest.

References

  1. Jhang, K.Y. Nonlinear ultrasonic techniques for nondestructive assessment of micro damage in material: A review. Int. J. Precis. Eng. Manuf. 2009, 10, 139. [Google Scholar] [CrossRef]
  2. Kim, J.; Ha, H.-P.; Kim, K.-M.; Jhang, K.-Y. Analysis of the Influence of Surface Roughness on Measurement of Ultrasonic Nonlinearity Parameter Using Contact-Type Transducer. Appl. Sci. 2020, 10, 8661. [Google Scholar] [CrossRef]
  3. Park, J.; Kim, M.; Chi, B.; Jang, C. Correlation of metallurgical analysis & higher harmonic ultrasound response for long term isothermally aged and crept FM steel for USC TPP turbine rotors. NDT&E Int. 2013, 54, 159–165. [Google Scholar]
  4. Li, M.; Lomonosov, A.M.; Shen, Z.; Seo, H.; Jhang, K.-Y.; Gusev, V.E.; Ni, C. Monitoring of thermal aging of aluminum alloy via nonlinear propagation of acoustic pulses generated and detected by lasers. Appl. Sci. 2019, 9, 1191. [Google Scholar] [CrossRef] [Green Version]
  5. Cantrell, J.H. Dependence of microelastic-plastic nonlinearity of martensitic stainless steel on fatigue damage accumulation. J. Appl. Phys. 2006, 100, 063508. [Google Scholar] [CrossRef] [Green Version]
  6. Balasubramaniam, K.; Valluri, J.S.; Prakash, R.V. Creep damage characterization using a low amplitude nonlinear ultrasonic technique. Mater. Charact. 2011, 62, 275–286. [Google Scholar] [CrossRef]
  7. Liu, M.H.; Kim, J.Y.; Jacobs, L.; Qu, J.M. Experimental study of nonlinear Rayleigh wave propagation in shot-peened aluminum plates-Feasibility of measuring residual stress. NDT&E Int. 2011, 44, 67–74. [Google Scholar]
  8. Zeitvogel, D.T.; Matlack, K.H.; Kim, J.Y.; Jacobs, L.J.; Singh, P.M.; Qu, J.M. Characterization of stress corrosion cracking in carbon steel using nonlinear Rayleigh surface waves. NDT&E Int. 2014, 62, 144–152. [Google Scholar]
  9. Jhang, K.-Y.; Choi, S.; Kim, J. Measurement of Nonlinear Ultrasonic Parameters from Higher Harmonics. In Measurement of Nonlinear Ultrasonic Characteristics; Springer: Berlin/Heidelberg, Germany, 2020; pp. 9–60. [Google Scholar]
  10. Doerr, C.; Kim, J.-Y.; Singh, P.; Wall, J.J.; Jacobs, L. Evaluation of sensitization in stainless steel 304 and 304L using nonlinear Rayleigh waves. NDT&E Int. 2017, 88, 17–23. [Google Scholar]
  11. Cantrell, J.H.; Yost, W.T. Effect of precipitate coherency strains on acoustic harmonic generation. Int. J. Appl. Phys. 1997, 81, 2957–2962. [Google Scholar] [CrossRef]
  12. Cantrell, J.H.; Yost, W.T. Determination of precipitate nucleation and growth rates from ultrasonic harmonic generation. Appl. Phys. Lett. 2000, 77, 1952–1954. [Google Scholar] [CrossRef]
  13. Cantrell, J.H.; Zhang, X.-G. Nonlinear acoustic response from precipitate-matrix misfit in a dislocation network. Int. J. Appl. Phys. 1998, 84, 5469–5472. [Google Scholar] [CrossRef]
  14. Park, S.-H.; Kim, J.; Jhang, K.-Y. Relative measurement of the acoustic nonlinearity parameter using laser detection of an ultrasonic wave. Int. J. Precis. Eng. Manuf. 2017, 18, 1347–1352. [Google Scholar] [CrossRef]
  15. Hong, X.; Liu, Y.; Lin, X.; Luo, Z.; He, Z. Nonlinear ultrasonic detection method for delamination damage of lined anti-corrosion pipes using PZT transducers. Appl. Sci. 2018, 8, 2240. [Google Scholar] [CrossRef] [Green Version]
  16. Kim, J.; Jhang, K.-Y.; Kim, C. Dependence of nonlinear ultrasonic characteristic on second-phase precipitation in heat-treated Al 6061-T6 alloy. Ultrasonics 2018, 82, 84–90. [Google Scholar] [CrossRef]
  17. Jhang, K.Y. Applications of nonlinear ultrasonics to the NDE of material degradation. IEEE Trans. Ultrason. Ferroelectr. Freq. Control 2000, 47, 540–548. [Google Scholar] [CrossRef]
  18. Choi, S.; Lee, P.; Jhang, K.Y. A Pulse Inversion-Based Nonlinear Ultrasonic Technique using a Single-Cycle Longitudinal Wave for Evaluating Localized Material Degradation in Plates. Int. J. Precis. Eng. Manuf. 2019, 20, 549–558. [Google Scholar] [CrossRef]
  19. Dace, G.E.; Thompson, R.B.; Brasche, L.J.; Rehbein, D.K.; Buck, O. Nonlinear acoustics, a technique to determine microstructural changes in materials. In Review of Progress in Quantitative Nondestructive Evaluation; Springer: Boston, MA, USA, 1991; pp. 1685–1692. [Google Scholar]
  20. Kim, J.; Song, D.-G.; Jhang, K.-Y. Absolute measurement and relative measurement of ultrasonic nonlinear parameters. Res. Nondestruct. Eval. 2017, 28, 211–225. [Google Scholar] [CrossRef] [Green Version]
  21. Kim, J.; Kim, J.-G.; Kong, B.; Kim, K.-M.; Jang, C.; Kang, S.-S.; Jhang, K.-Y. Applicability of nonlinear ultrasonic technique to evaluation of thermally aged CF8M cast stainless steel. Nucl. Eng. Technol. 2020, 52, 621–625. [Google Scholar] [CrossRef]
  22. Kim, J.; Kim, C.-S.; Kim, K.-C.; Jhang, K.-Y.; International, E. Evaluation of yield strength by ultrasonic reconstruction of quadratic nonlinear Stress–Strain curve. NDT&E Int. 2020, 112, 102242. [Google Scholar]
  23. Choi, S.; Seo, H.; Jhang, K.Y. Noncontact Evaluation of Acoustic Nonlinearity of a Laser-Generated Surface Wave in a Plastically Deformed Aluminum Alloy. Res. Nondestruct. Eval. 2015, 26, 13–22. [Google Scholar] [CrossRef]
  24. Dace, G.E.; Thompson, R.B.; Buck, O. Measurement of the acoustic harmonic generation for materials characterization using contact transducers. Rev. Prog. Quant. Nondestruct. Eval. 1992, 11, 2069–2076. [Google Scholar]
  25. Yost, W.T.; Cantrell, J.H. Absolute ultrasonic displacement amplitude measurements with a submersible electrostatic acoustic transducer. Rev. Sci. Instrum. 1992, 63, 4182–4188. [Google Scholar] [CrossRef]
  26. Hurley, D.; Yost, W.; Boltz, E.; Fortunko, C. A Comparison of Three Techniques to Determine the Nonlinear Ultrasonic Parameter β. In Review of Progress in Quantitative Nondestructive Evaluation; Springer: Boston, MA, USA, 1997; pp. 1383–1390. [Google Scholar]
  27. Zhou, X.L.; Yu, Q.X. Wide-Range Displacement Sensor Based on Fiber-Optic Fabry–Perot Interferometer for Subnanometer Measurement. IEEE Sens. J. 2011, 11, 1602–1606. [Google Scholar] [CrossRef]
  28. Park, S.-H.; Hong, J.-Y.; Ha, T.; Choi, S.; Jhang, K.-Y. Deep Learning-Based Ultrasonic Testing to Evaluate the Porosity of Additively Manufactured Parts with Rough Surfaces. Metals 2021, 11, 290. [Google Scholar] [CrossRef]
  29. Delaye, P.; Blouin, A.; Drolet, D.; de Montmorillon, L.-A.; Roosen, G.; Monchalin, J.-P. Detection of ultrasonic motion of a scattering surface by photorefractive InP: Fe under an applied dc field. JOSA B 1997, 14, 1723–1734. [Google Scholar] [CrossRef]
  30. Blouin, A.; Delaye, P.; Drolet, D.; Monchalin, J.P. Optical detection of ultrasound by two-wave mixing in photorefractive semiconductor crystals under applied field. In Review of Progress in Quantitative Nondestructive Evaluation; Springer: Boston, MA, USA, 1997; pp. 571–577. [Google Scholar]
  31. Pouet, B.F.; Ing, R.; Krishnaswamy, S.; Royer, D. Heterodyne interferometer with two-wave mixing in photorefractive crystals for ultrasound detection on rough surfaces. Appl. Phys. Lett. 1996, 69, 3782–3784. [Google Scholar] [CrossRef]
  32. Park, S.-H.; Choi, S.; Jhang, K.-Y. Porosity Evaluation of Additively Manufactured Components Using Deep Learning-based Ultrasonic Nondestructive Testing. Int. J. Precis. Eng. Manuf.-Green Tech. 2021, 1–13. [Google Scholar] [CrossRef]
  33. Harris, F.J. On the use of windows for harmonic analysis with the discrete Fourier transform. Proc. IEEE 1978, 66, 51–83. [Google Scholar] [CrossRef]
  34. Park, S.-H.; Jhang, K.-Y.; Yoon, H.-S.; Sohn, H. Porosity Evaluation of Additive Manufactured Parts: Ultrasonic Testing and Eddy Current Testing. J Korean Soc Nondestruct Test. 2021, 41, 1–10. [Google Scholar] [CrossRef]
  35. Cantrell, J.H. Crystalline-Structure and Symmetry Dependence of Acoustic Nonlinearity Parameters. J. Appl. Phys. 1994, 76, 3372–3380. [Google Scholar] [CrossRef]
  36. Yost, W.T.; Cantrell, J.H.; Breazeale, M.A. Ultrasonic nonlinearity parameters and third-order elastic constants of copper between 300 and 3 °K. J. Appl. Phys. 1981, 52, 126–128. [Google Scholar] [CrossRef]
  37. Li, P.; Yost, W.T.; Cantrell, J.H.; Salama, K. Dependence of acoustic nonlinearity parameter on second phase precipitates of aluminum alloys. In Proceedings of the IEEE 1985 Ultrasonics Symposium, San Francisco, CA, USA, 16–18 October 1985; pp. 1113–1115. [Google Scholar]
Figure 1. Schematic configuration of photorefractive interferometric system.
Applsci 11 04175 g001
Figure 2. Images of tested specimens.
Applsci 11 04175 g002
Figure 3. Schematic diagram for measurement of β parameter using laser-ultrasonic detection.
Applsci 11 04175 g003
Figure 4. Picture of photorefractive interferometric system.
Applsci 11 04175 g004
Figure 5. Performance comparison for absolute displacement measurement between photorefractive and Fabry–Pérot interferometers.
Applsci 11 04175 g005
Figure 6. Typical ultrasonic signals in time-domain for copper (blue solid line) and Al6061-T6 (brown dotted line) specimens. The two signals aligned with the time axis overlap each other.
Applsci 11 04175 g006
Figure 7. Typical frequency-domain signals for copper (blue solid line) and Al6061-T6 (brown dotted line) specimens.
Applsci 11 04175 g007
Figure 8. Linear fitting plots of A 1 2 and A2 for copper (blue circle) and Al6061-T6 (brown square) specimens.
Applsci 11 04175 g008
Table 1. Material properties of copper and Al6061-T6 specimens.
SpecimenCopperAl6061-T6
Thickness (mm)2020
Density (kg/m3)89602700
Longitudinal wave velocity (m/s)47506300
Acoustic impedance
(106 kg/m2s)
42.617.0
Table 2. Measured absolute parameters (βCu) and (βAl).
Measurement of β Results
Laser DetectionPiezoelectric DetectionReference Range
Copper3.43.22.1–3.5 [35,36]
Al6061-T64.95.04.5–5.69 [9,37]
Publisher’s Note: MDPI stays neutral with regard to jurisdictional claims in published maps and institutional affiliations.

