Article

Experimental Analysis of Driver Visual Characteristics in Urban Tunnels

1
College of Automobile and Traffic Engineering, Nanjing Forestry University, Nanjing 210037, China
2
College of Locomotive and Vehicle, Nanjing Institute of Railway Technology, Nanjing 210031, China
*
Author to whom correspondence should be addressed.
Appl. Sci. 2021, 11(9), 4274; https://doi.org/10.3390/app11094274
Submission received: 9 April 2021 / Revised: 2 May 2021 / Accepted: 6 May 2021 / Published: 8 May 2021

Abstract

:
Through an urban tunnel-driving experiment, this paper studies the changing trend of drivers’ visual characteristics in tunnels. A Tobii Pro Glasses 2 wearable eye tracker was used to measure pupil diameter, scanning time, and fixation point distribution of the driver during driving. A two-step clustering algorithm and the data-fitting method were used to analyze the experimental data. The results show that the univariate clustering analysis of the pupil diameter change rate of drivers has poor discrimination because the pupil diameter change rate of drivers in the process of “dark adaptation” is larger, while the pupil diameter change rate of drivers in the process of “bright adaptation” is relatively smooth. The univariate and bivariate clustering results of drivers’ pupil diameters were all placed into three categories, with reasonable distribution and suitable differentiation. The clustering results accurately corresponded to different locations of the tunnel. The clustering method proposed in this paper can identify similar behaviors of drivers at different locations in the transition section at the tunnel entrance, the inner section, and the outer area of the tunnel. Through data-fitting of drivers’ visual characteristic parameters in different tunnels, it was found that a short tunnel, with a length of less than 1 km, has little influence on visual characteristics when the maximum pupil diameter is small, and the percentage of saccades is relatively low. An urban tunnel with a length between 1 and 2 km has a significant influence on visual characteristics. In this range, with the increase in tunnel length, the maximum pupil diameter increases significantly, and the percentage of saccades increases rapidly. When the tunnel length exceeds 2 km, the maximum pupil diameter does not continue to increase. The longer the urban tunnel, the more discrete the distribution of drivers’ gaze points. The research results should provide a scientific basis for the design of urban tunnel traffic safety facilities and traffic organization.

1. Introduction

To ease urban traffic congestion and reduce traffic delays, massive networks of urban expressway networks have been built in big cities. A tunnel under an urban expressway does not affect the urban landscape, occupies a small area, and has a positive effect on reducing the land use of urban roads, shortening the driving mileage, and facilitating urban traffic. Underpass tunnel interchanges are mostly adopted in downtown areas. However, the urban tunnel structure is closed, its internal environment is monotonous, and the light intensity, temperature, and humidity of the inside and outside of the tunnel are quite different [1,2,3]. Therefore, the driver’s physiological and psychological state will change when driving in the tunnel environment, which will affect not only the driver’s correct perception of the surrounding environment information but also the driver’s decision-making and manipulation behavior [4,5]. In recent years, the number of traffic accidents in urban tunnels shows a trend of increasing. Feng et al. counted a total of 3976 traffic accidents occurring on the first ring road in Hefei in 2015, of which 325 occurred in urban underpass tunnels, accounting for 8.2% [6,7]. Due to dense urban population and large traffic flow, tunnel section, as the bottleneck of an urban expressway, is not only prone to accidents but also difficult to deal with after accidents. Therefore, it is extremely important to study the traffic safety of urban tunnels. However, existing tunnel traffic safety research mainly focuses on expressway tunnels, and the research related to the traffic safety of urban tunnels is relatively scarce, but whether expressway tunnel traffic safety-related research conclusions are applicable to urban tunnels still needs to be further verified [8,9,10]. At present, the traffic capacity of the entrance and exit sections of urban tunnels is low, and the phenomenon of drivers changing lanes at will to overtake is serious. At the same time, the speed limit of urban expressway tunnels is generally 60 km/h or above, and some sections even reach 80 km/h (such as the Nanjing Yangtze River tunnel speed limit of 80 km/h), which is consistent with the speed limit of expressway tunnels. It is necessary to carry out special research on traffic safety of urban expressway tunnels, which can further improve the theoretical system of tunnel traffic safety research theoretically and practically, improve the driving efficiency of urban tunnel sections.
Existing research confirms the significant influence of the tunnel environment on drivers’ eye movement parameters and establishes a relationship between eye movement parameters and tunnel parameters such as illumination, driving speed, and visual induction facilities [11]. There are three basic forms of eye movement: winking, saccade, and gaze. Fixation indicators mainly include fixation area, fixation time, pupil diameter (or area), whereas saccade indicators mainly include saccade time, saccade speed, and saccade amplitude, and blinking indicators commonly used include blink duration and blink frequency [12]. This paper carried out a driver visual characteristics experiment for an urban expressway tunnel. It was based on experimental data analysis of urban tunnel-driving pupil diameter, scanning time, and interest area. Then, the time series clustering method was used to cluster the visual characteristic parameters of drivers, and the clustering results were analyzed so as to provide a reference for the study of urban tunnel traffic safety.

2. Literature Review

Drivers obtain driving information mainly from the surrounding environment, more than 90% of which is visual. The purpose of tunnel lighting is to convey the necessary traffic information to the driver to ensure his driving safety and comfort. In this process, the driver’s eyes act as a link, and their movement characteristics can accurately reflect the driver’s real feelings during the process of entering the tunnel [13,14,15].
Tunnel driver vision is always a popular research topic, and numerous real and simulated car experiments have been carried out so far. Kircher and Ahlstrom conducted a tunnel-driving simulation experiment, and the results showed that tunnel design and illumination had some influence on the drivers’ behavior, but visual attention given to the driving task was the most crucial factor, giving rise to significant changes in both driving behavior and visual behavior [16,17]. Hu et al. used the change rate of driver pupil area to describe the influence of sunlight under the ventilation shaft of an urban tunnel on drivers and established a random selection model of deceleration behavior under strong solar light [18]. The variations in the drivers’ eye movements and speed were much more significant in the entrance zone of a tunnel without spatial intervisibility than in a tunnel with spatial intervisibility [19,20]. The least-squares method of change point analysis was used to detect the time and locations of sudden changes in eye movement characteristics, and it was found that changes in road environments could cause a significant increase in fixation count and fixation duration for female drivers, such as in scenarios with traffic accidents or sharp curves [21]. The results for pupil size in the daytime increased when approaching the tunnel entrance, while at night, pupil size decreased when approaching the tunnel entrance and then increased after entering the tunnel. The pupil size in the daytime has a significant negative correlation with vehicle speed, while the pupil size at night did not show any significant association with vehicle speed. Furthermore, the average fixation duration in the daytime increased when entering the tunnel and had a significant negative correlation with vehicle speed. Furthermore, the average number of fixations in the daytime decreased when entering the tunnel and had a significant negative correlation with vehicle speed. However, the average fixation duration and the average number of fixations at night did not show any significant association with vehicle speed [22]. The transfer function of a BP artificial neural network proposed by Yan et al. was employed to simulate and analyze the variation of the drivers’ eye movement parameters [23]. Hu et al. established a mathematical model of tunnel drivers’ fixation time and eye movement amplitude based on a BP neural network [24,25]. Peng et al. established a visual search pattern matrix and a comprehensive evaluation model of eye movement characteristics based on the experimental data of drivers’ fixation and saccade behaviors, which could be used to quantitatively judge driving proficiency [26]. It was proposed that the combination of visual information of high and low frequencies could effectively improve the driver’s speed perception ability, reducing the driver’s reaction time and improving the tunnel-driving safety by placing multiple frequency markers on the sidewall and road surface of the tunnel [27,28]. Hu et al. established the relationship model between the driver’s visual recognition distance and the brightness difference inside and outside of the tunnel and calculated the brightness difference threshold of the tunnel entrance section at night at different design speeds [29,30].
These studies generally suggest that the human eye movement characteristics of drivers at the entrance and exit of tunnels have obvious changes. In addition to the change of pupil area, the fixation characteristics also change with the complexity of road conditions, which is manifested in the increase in fixation times and the decrease in fixation time.

3. Experiment Design

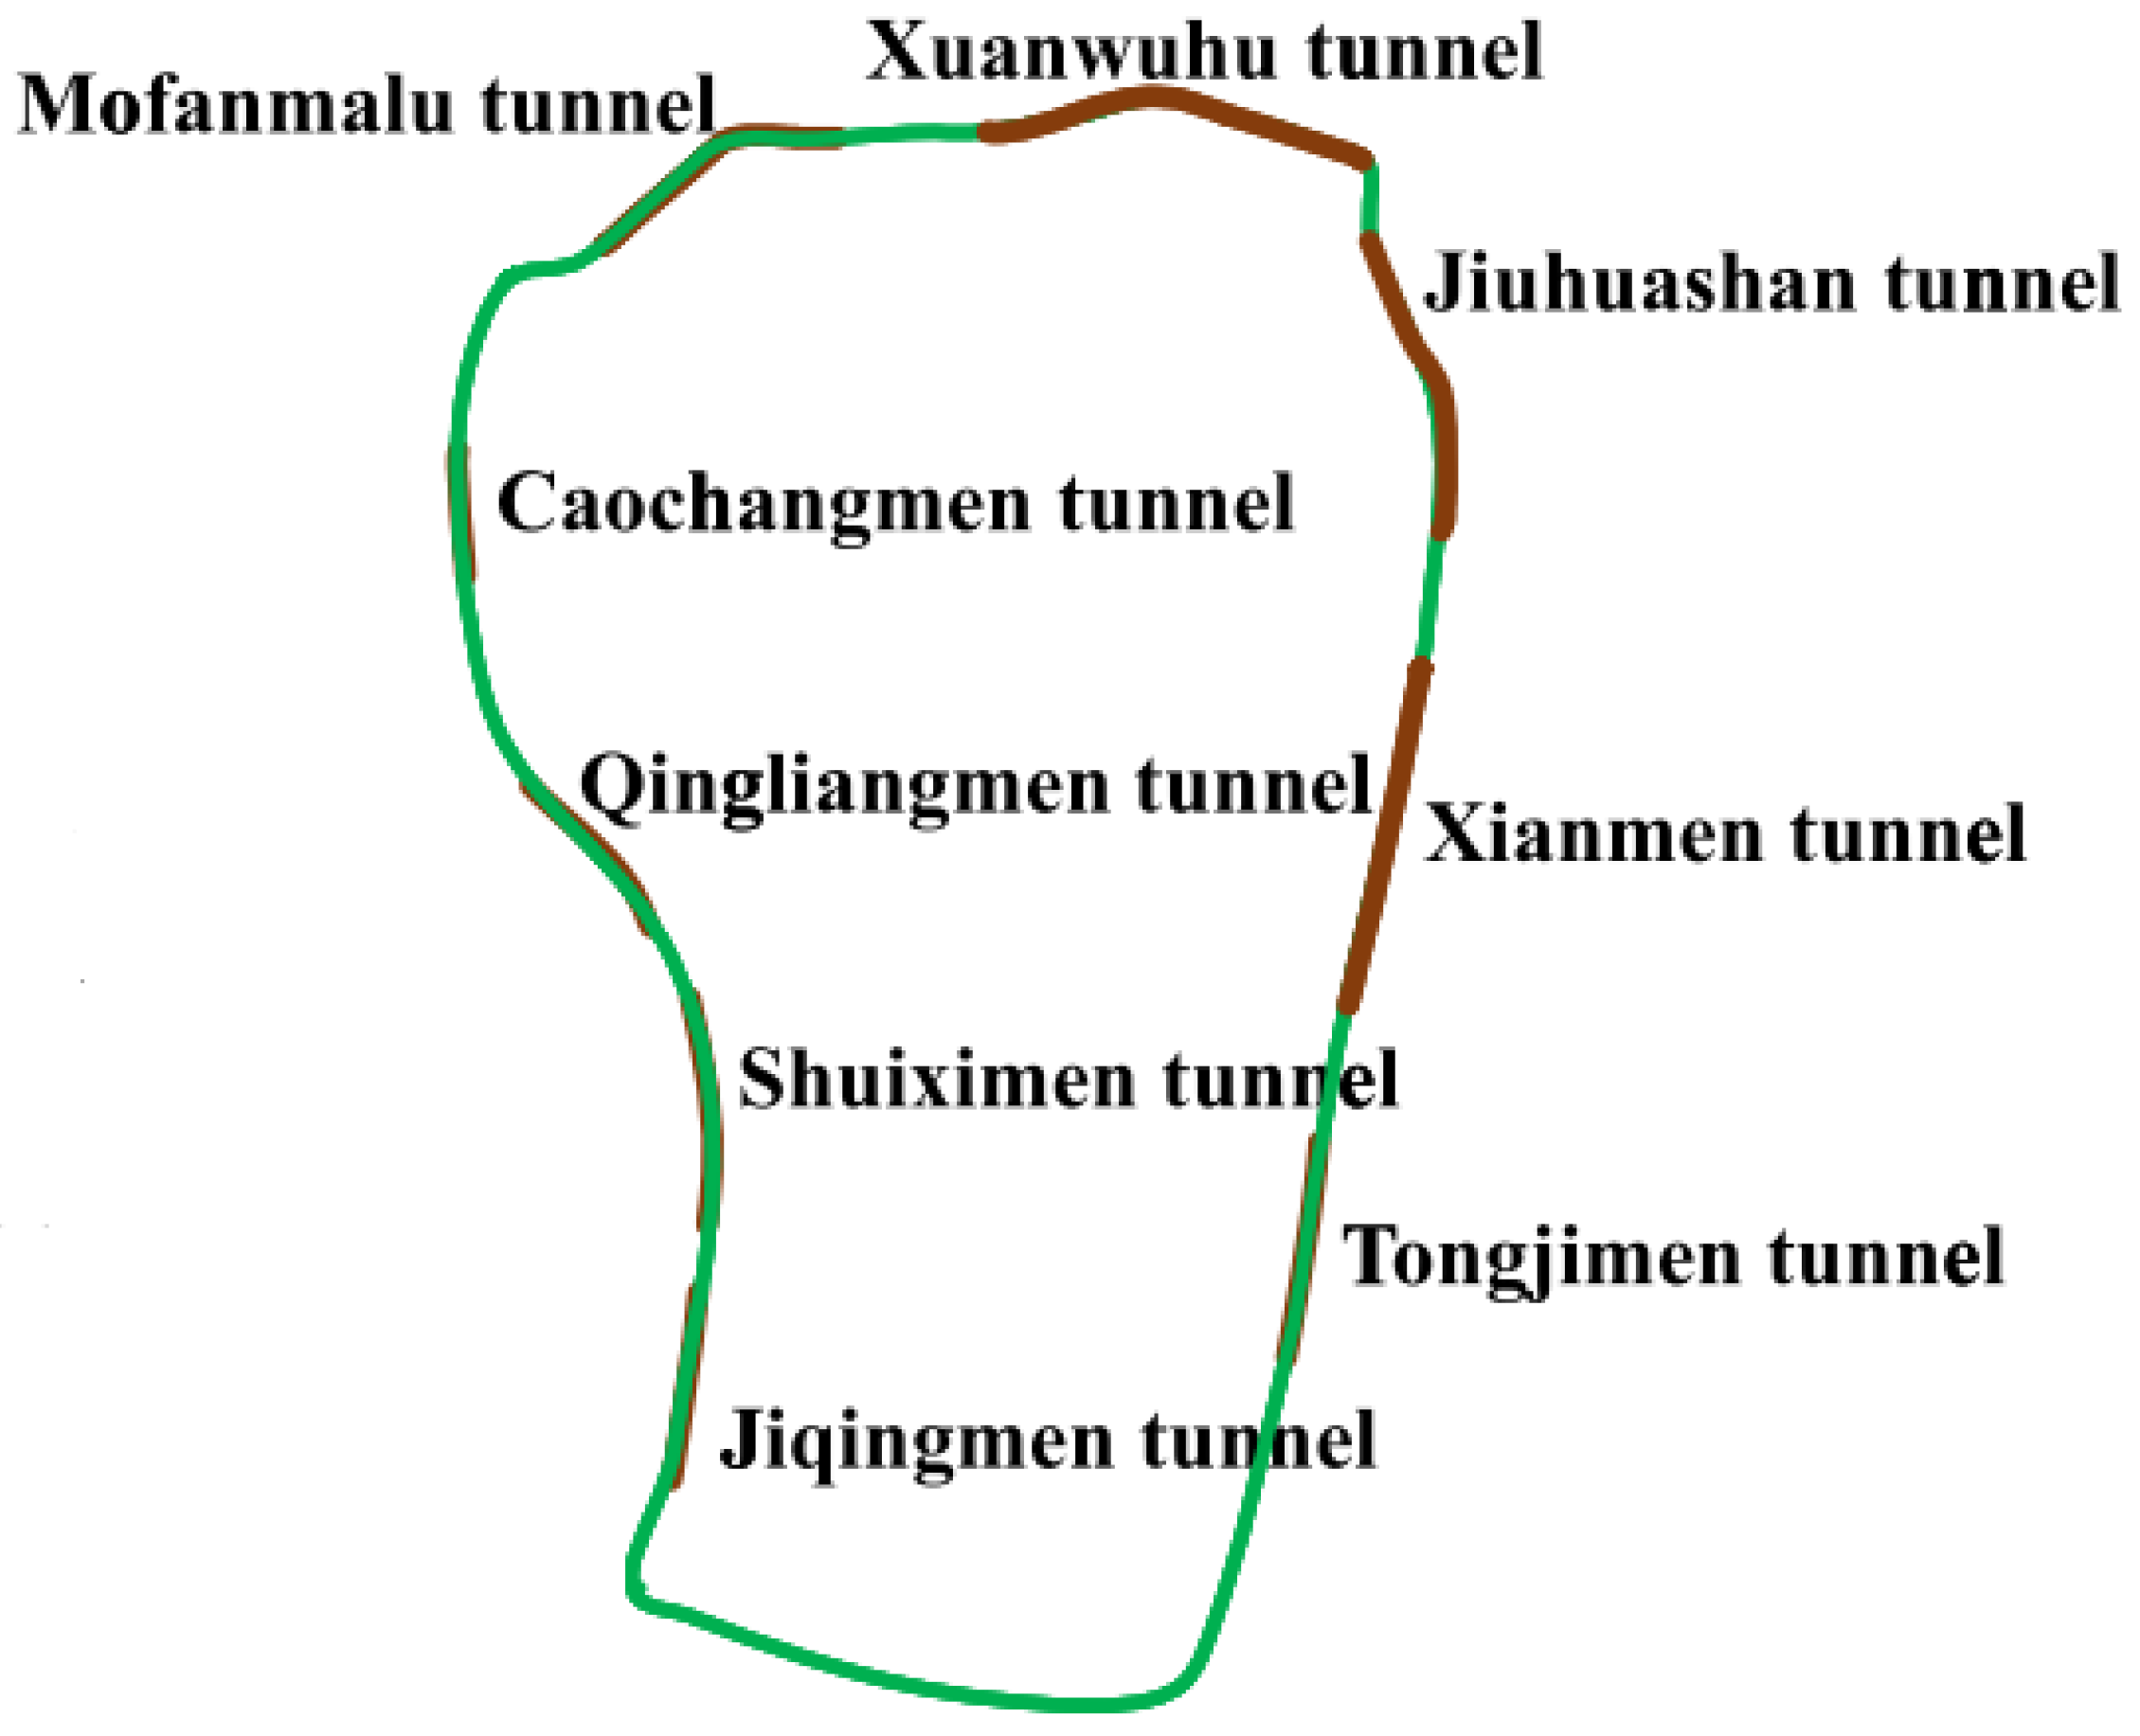
3.1. Experiment Locations

The fast inner ring road in Nanjing was selected as the experimental section, as shown in Figure 1. The Nanjing fast inner ring road comprises four expressways in the core area of the main city, with an overall length of 33.06 km in the shape of a well, among which the length of the elevated section is 18.19 km, while the tunnel section is 14.87 km. There is no signal light in the whole journey. The design speed of the elevated section is 80 km/h, and the speed limit of the tunnel section is 60 km/h. Caochangmen Tunnel, Qingliangmen Tunnel, Shuiximen Tunnel, and Jiqingmen Tunnel are located on the western inner ring road, whereas the south inner ring road is elevated to Yingtian Avenue. The inner ring north line has Mofanmalu Tunnel and Xuanwuhu Tunnel. Jiuhuashan Tunnel, Xianmen Tunnel, and Tongjimen Tunnel are located on the eastern inner ring road. Xuanwuhu Tunnel is the tunnel under the lake, whereas Jiuhuashan Tunnel is the mountain tunnel, and the others are intersection overpass tunnels. All tunnels are designed with six two-way lanes, and the entrances and exits are equipped with enhanced lighting. The experimental tunnel length is between 0.59 and 2.78 km, as shown in Table 1.

3.2. Experiment Facilities

The wearable eye tracker Tobii Pro Glasses 2 was used to collect the driver’s visual behavior data and was used in conjunction with the Pro Glasses Controller software. The device must be calibrated before use to ensure the authenticity of the collected data. In the experiment, if individual subjects could not be calibrated, they were excluded. The experimental vehicle was a Volkswagen Magotan automatic transmission car, in suitable condition.

3.3. Participants

Subjects were randomly recruited and were required to have corrected binocular vision of at least 1.0, with a C2 level or above driver’s license, with a total driving distance of more than 5000 km. Ultimately, 25 subjects were actually recruited, and 21 drivers obtained effective experimental data, including 14 male drivers and 7 female drivers, with an average age of 38 years and an age standard deviation of 7.35. The average driving age was 12 years, and the standard deviation of driving age was 8.5.

3.4. Experimentation

The experimental period was from 11:00 a.m. to 3:00 p.m. on a fine-weather day from August to September 2019. The participants were divided into five groups, and each group drove the vehicle through the experimental section in a circular manner. During the experiment, each participant took part in at least 30 driving experiments. Before the experiment, subjects were required to maintain adequate sleep with normal physical skills and no fatigue driving phenomenon.
(1)
Step 1: Each subject calibrates the eye tracker to ensure the normal function of the experimental equipment.
(2)
Step 2: Subjects start from Huayuan Road along Xuanwu Avenue in the direction of the Xinzhuang interchange. They are familiar with the vehicle condition and do not record the experimental data.
(3)
Step 3: After arriving at the Xinzhuang overpass, the eye tracker data is recorded. Meanwhile, the experimental assistants begin to record the speed data and illuminance data.
(4)
Step 4: After driving counterclockwise around the fast inner ring for one week, the subject makes a U-turn at the Xinzhuang overpass and then drives clockwise around the fast inner ring for one week to complete the experiment.
In the experiment, the threshold of eye movement angular velocity was defined as 30°/s; less than that is fixation, and greater than that is saccades. When the time interval of adjacent fixation points was less than 75 ms, and the eye movement angle was less than 0.5°, the fixation points were combined. When the fixation time was less than 60 ms, the fixation points were removed to reduce interference. When the time interval of data loss was less than 75 ms in the process of eye movement data acquisition, the linear interpolation method was used for data compensation. The sliding mean filtering method was used to reduce the noise of eye movement data.

4. Results

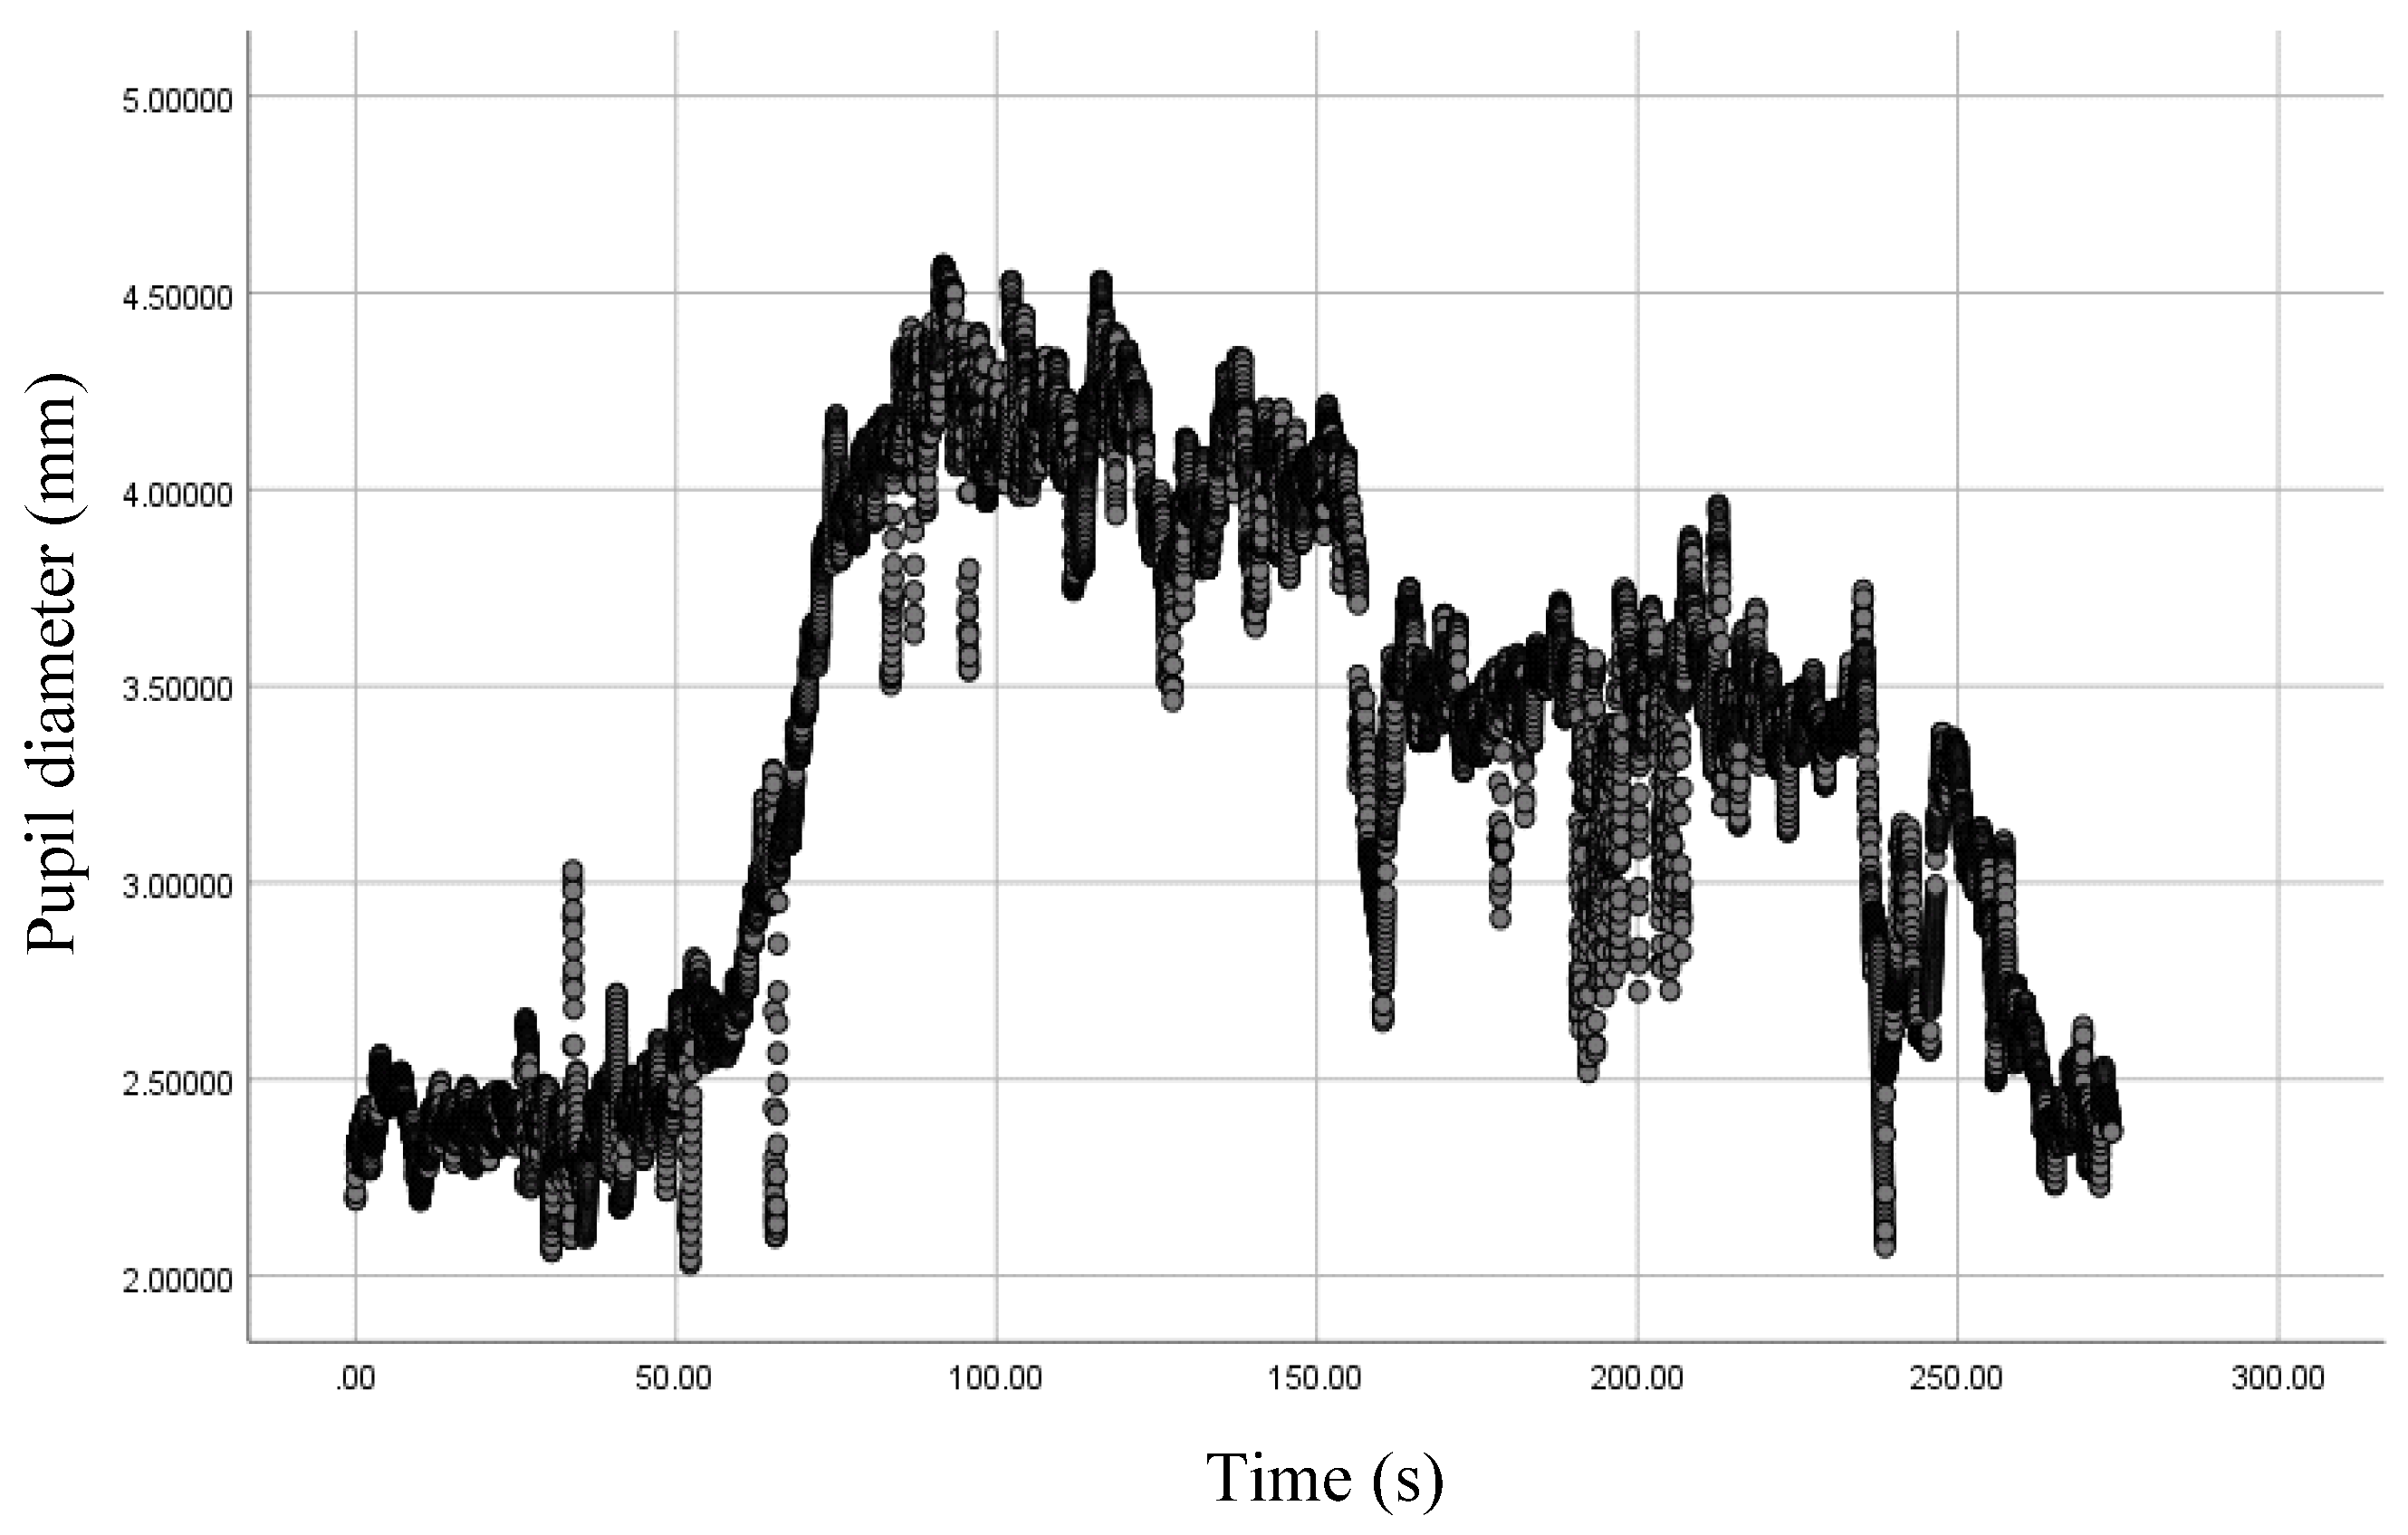
4.1. Analysis of the Change Law of Visual Characteristics of Drivers in a Single Urban Tunnel

Taking Xuanwu Lake Tunnel as an example, the statistical variation curve of pupil diameter of test drivers in the process of tunnel-driving is shown in Figure 2. During the period of 0~50 s, the driving behavior of vehicles outside the tunnel was not affected by the tunnel environment. The pupil diameter fluctuated slightly around a low 2.42 mm, and the driving load was relatively low. When the time period from 50 to 150 s corresponded to the transition section of the tunnel entrance, the difference in light intensity between the inside and the outside of the tunnel caused the pupil diameter of drivers to grow rapidly and fluctuate continuously around a high value of 4.24 mm until the driver completed the process of “dark adaptation”. At this point, the driving load was higher. The period of 150~250 s corresponded to the inner area of the tunnel. After the drivers adapted to the light intensity in the tunnel, the pupil diameter decreased slightly to a large fluctuation of around 3.4 mm. It is speculated that the large fluctuation is a result of the uneven light intensity caused by the lighting arrangement in the tunnel and various vehicle taillights and other light sources. The time period of 250~300 s corresponded to the transition section of the tunnel exit. Due to the influence of natural light outside the tunnel, the pupil diameter of drivers decreased significantly, and the process of “bright adaptation” was relatively smooth.

4.2. Clustering Analysis of Visual Characteristics of Urban Tunnel Drivers

The purpose of cluster analysis is to classify samples according to their similarity or difference, thus forming different categories, which are homogenous within classes and heterogeneous between classes. The clustering of time series can be divided into three categories: clustering by time point (similarity in time), clustering by shape (similarity in space), and clustering by change (similarity in data generation process). The common clustering algorithm is K-means clustering, but it needs to specify the number of clustering in advance. A different number of clustering and initial clustering center have a great influence on the results of the K-means algorithm [31]. A two-step clustering (or second-order clustering) algorithm can automatically determine the number of clustering and perform clustering analysis on category variables and continuous variables at the same time. The two-step clustering algorithm is mainly divided into the following two steps [32].
The first step is to establish the number of clustering features. A sample is taken as the root node of the tree, and the distance measure method is selected as the similarity basis between samples while the similarity critical value is determined. The samples that meet the similarity degree are put into the same tree node, and the samples that exceed the critical value will generate new nodes.
The second step is to determine the optimal number of clustering. The nodes were classified by using the agglomeration method, and the clustering model with the best fitting data was found by judging the Akaike information criterion (AIC) and Bayesian information criterion (BIC).
The silhouette coefficient is usually used to evaluate the result of a clustering model. Combining the two factors of cohesion and separation, the silhouette coefficient can evaluate the impact of different algorithms or different operation modes on the clustering results based on the same original data, whose definition is shown in Equation (1):
S ( i ) = b ( i ) a ( i ) max { a ( i ) , b ( i ) } ,
where S ( i ) is the silhouette coefficient, a ( i ) represents the distance between vector i and all the other points in the cluster that it belongs to, and b ( i ) represents the average distance between vector i and all the points in the cluster closest to it.
In this paper, a two-step clustering algorithm was used to cluster the visual parameters of drivers in urban tunnels in order to identify similar or different behaviors of drivers at different locations in the tunnels.

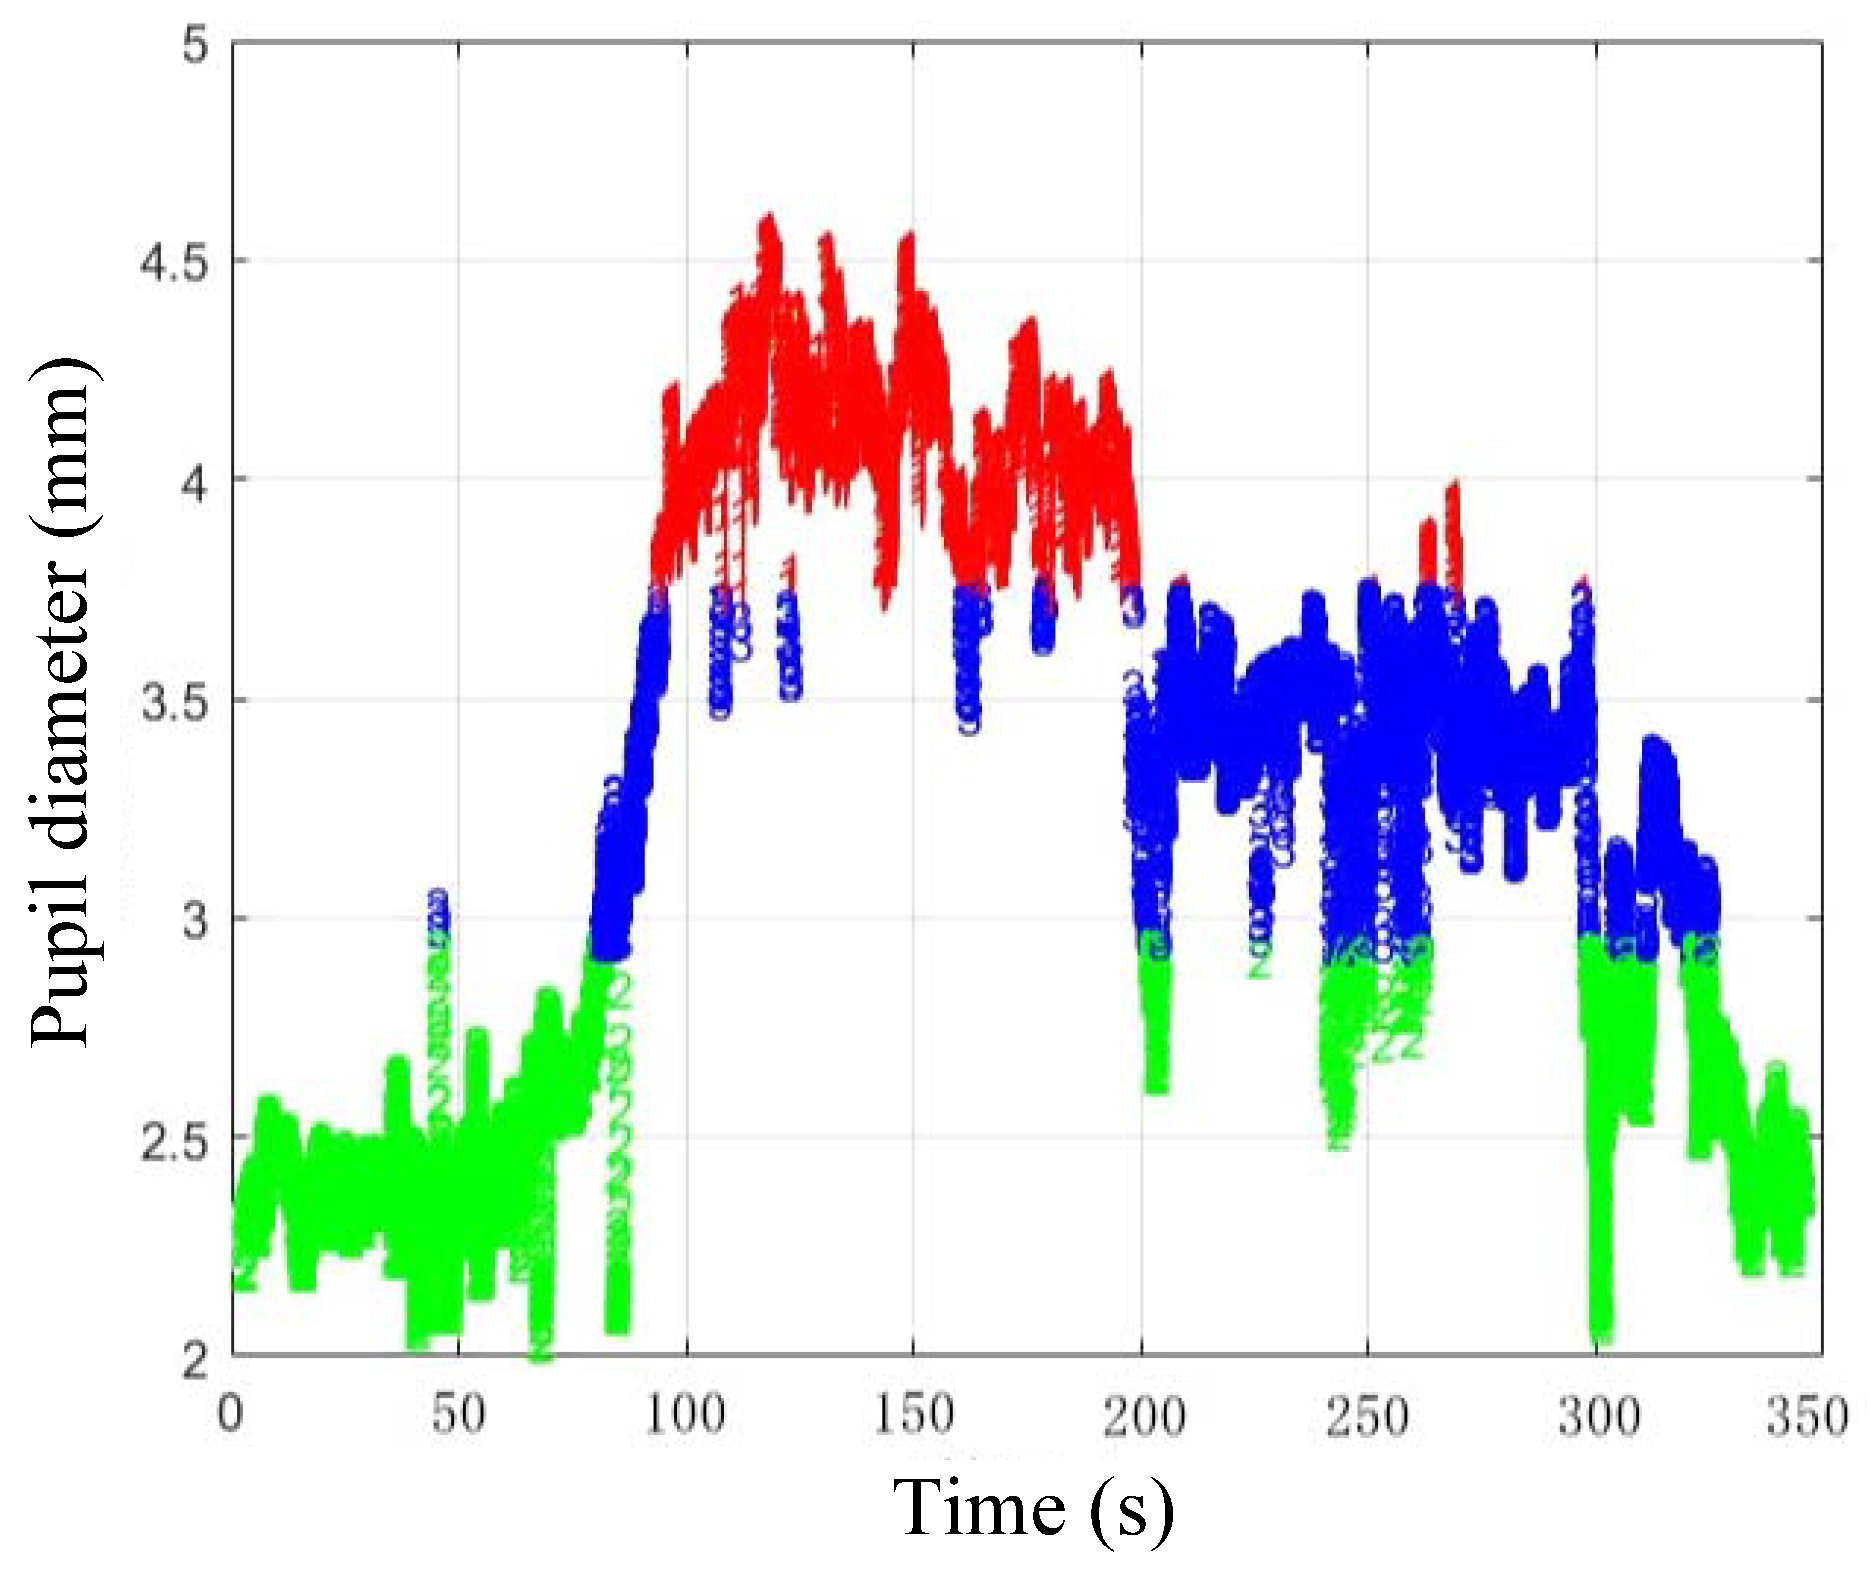
4.2.1. Cluster Analysis of Pupil Diameter

The two-step clustering algorithm was used to conduct cluster analysis on the pupil diameter data of drivers in urban tunnels. As shown in Figure 3, the pupil diameter data were divided into three categories, and the size of each category was reasonable with suitable differentiation. The silhouette coefficient was 0.8, illustrating that the clustering model is fine. The statistics of clustering results are shown in Table 2, where the proportions of three kinds of samples are 30.5%, 33.4%, and 36.1%, and the clustering center values are 4.0867, 2.4782, and 3.3765, respectively.
It can be seen from Figure 3 that the first type of sample is mainly concentrated in high values, as shown in red in the figure, corresponding to the transition section area of the tunnel entrance. The sample values in this area remain high and oscillating, which is obviously different from other categories. The second type of sample is mainly concentrated in a low value, as shown in green in the figure, which corresponds to the area outside the tunnel and part of the tunnel exit. In this area, the sample value fluctuates slightly in the low place, and the driving load is the lowest. Finally, the third type of sample is concentrated in the median value, as shown in blue in the figure, which mainly corresponds to the part of the rapidly growing pupil diameter in the tunnel and the entrance section.

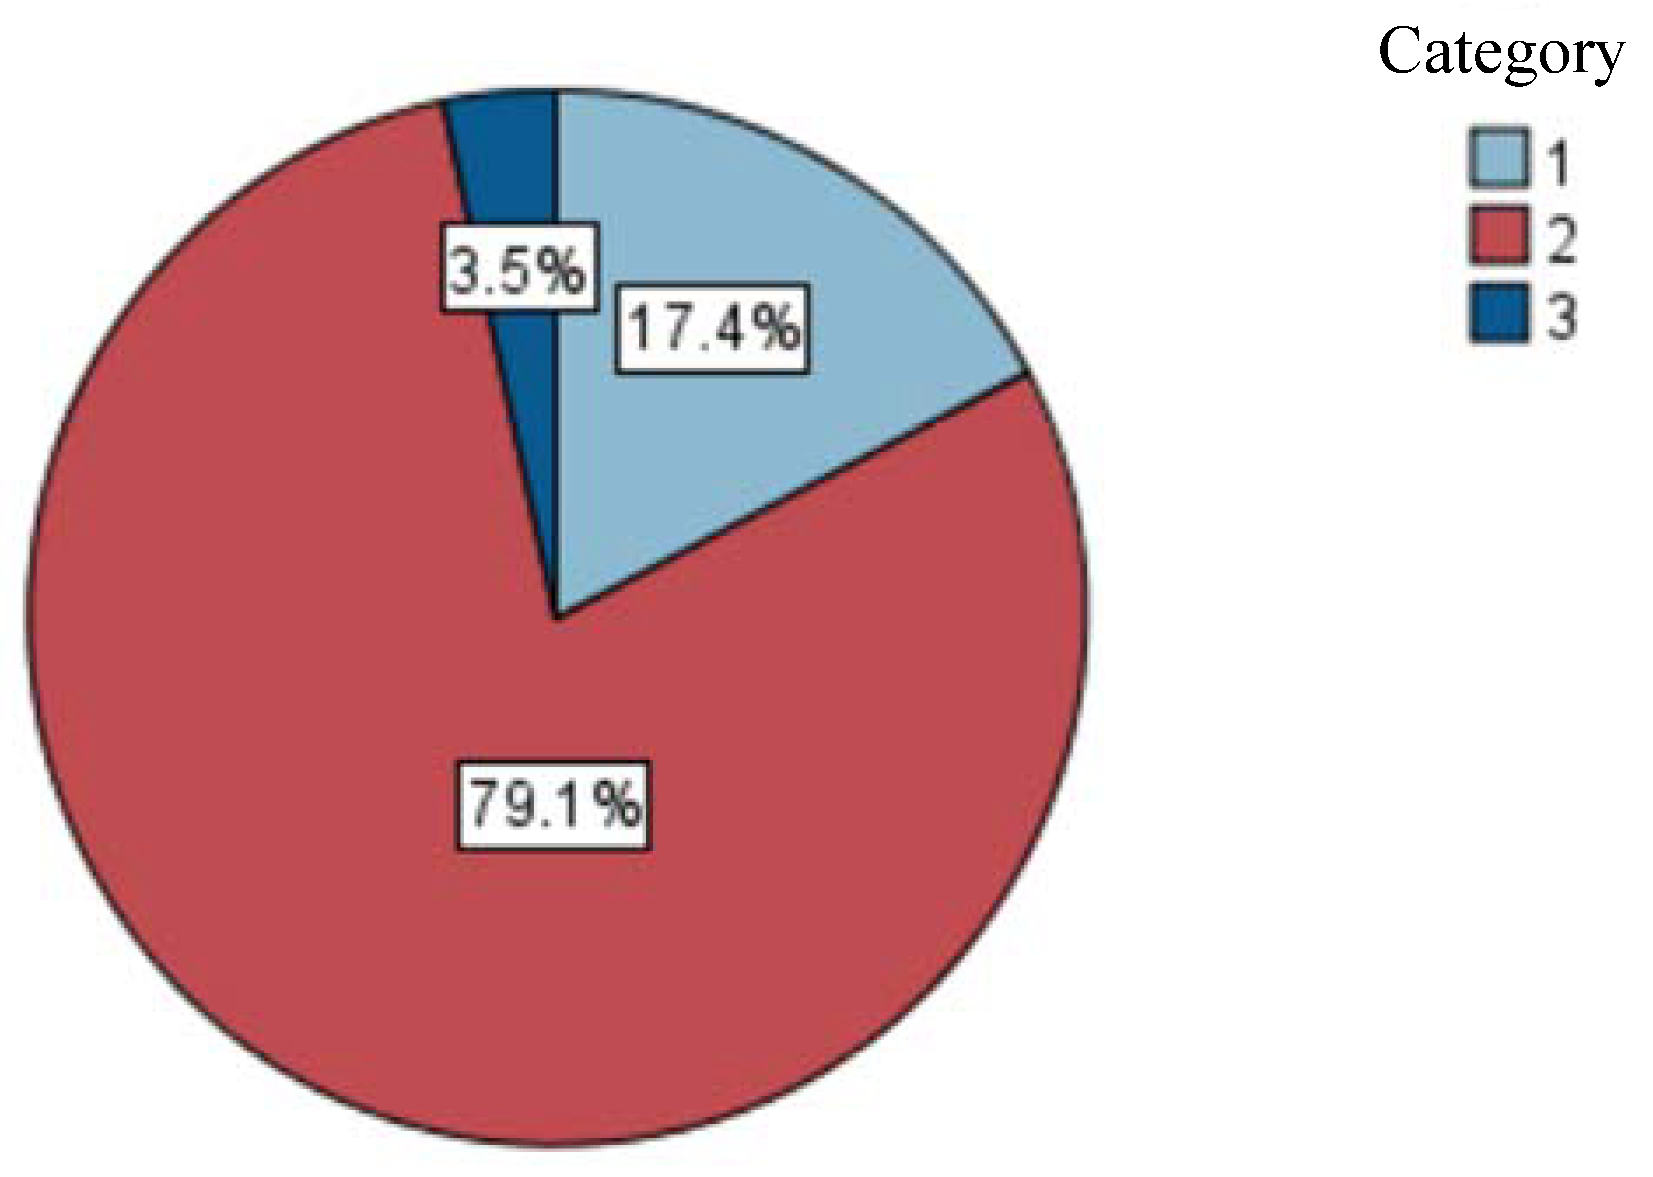
4.2.2. Cluster Analysis of Change Rate of Pupil Diameter

The clustering results of drivers’ pupil diameter change rate were also divided into three categories (as shown in Figure 4). The statistics are shown in Table 3. The number of samples in the first category accounts for 17.4%, and the clustering center value is 0.9727, while the second category accounts for 79.1% with a clustering center value of −0.1587, and the third category only accounts for 3.5% with a central clustering value of −1.2461. The size-category ratio reaches 22.87, and the silhouette coefficient is 0.35, indicating poor model discrimination. The reason for the analysis in combination with Figure 1 is that the pupil diameter change rate of drivers only changes sharply during the transition period from 50 to 70 s at the tunnel entrance, while fluctuating within a limited range in other areas, such as the outside and the inside of the tunnel. Therefore, the clustering results obtained are of no practical significance.

4.2.3. Bivariate Cluster Analysis

A two-step clustering algorithm can easily deal with multivariable data. Due to the large-scale difference between the driver’s pupil diameter and its rate of change, they were standardized. The two-step clustering algorithm was used to cluster the two normalized variables, and the results are shown in Figure 5. As can be seen from the statistical results in Table 4, the sample data were divided into three categories, where the proportions of three kinds of samples were 17.8%, 33.1%, and 49.1%, and the clustering center values were 1.6244, 0.4502, and −0.8926, respectively. The size of each category was reasonable, and the size-category ratio was 2.88 with a silhouette coefficient of 0.8, indicating a suitable degree of discrimination.
As can be seen from the three-dimensional distribution diagram in Figure 5, the clustering sample has suitable discrimination. The red sample in the figure corresponds to the transition section area of the tunnel entrance, with the best identification. The green sample in the figure corresponds to the unaffected outer tunnel area and part of the tunnel exit. The area with the longer duration is the area outside the tunnel, while the area with the shorter duration or the intermittent occurrence of such sample is the area at the exit of the tunnel. The blue sample in the figure mainly corresponds to areas inside the tunnel and part of the entrance section. According to the pupil diameter change rate index in the 3D figure, the change rate of the tunnel entrance section is obviously larger, while the change rate of the tunnel interior is relatively stable. Therefore, the tunnel interior or tunnel entrance section corresponding to the green category samples in the figure can be distinguished significantly.

4.3. Analysis of the Impact of Urban Tunnel Length on Drivers’ Visual Characteristics

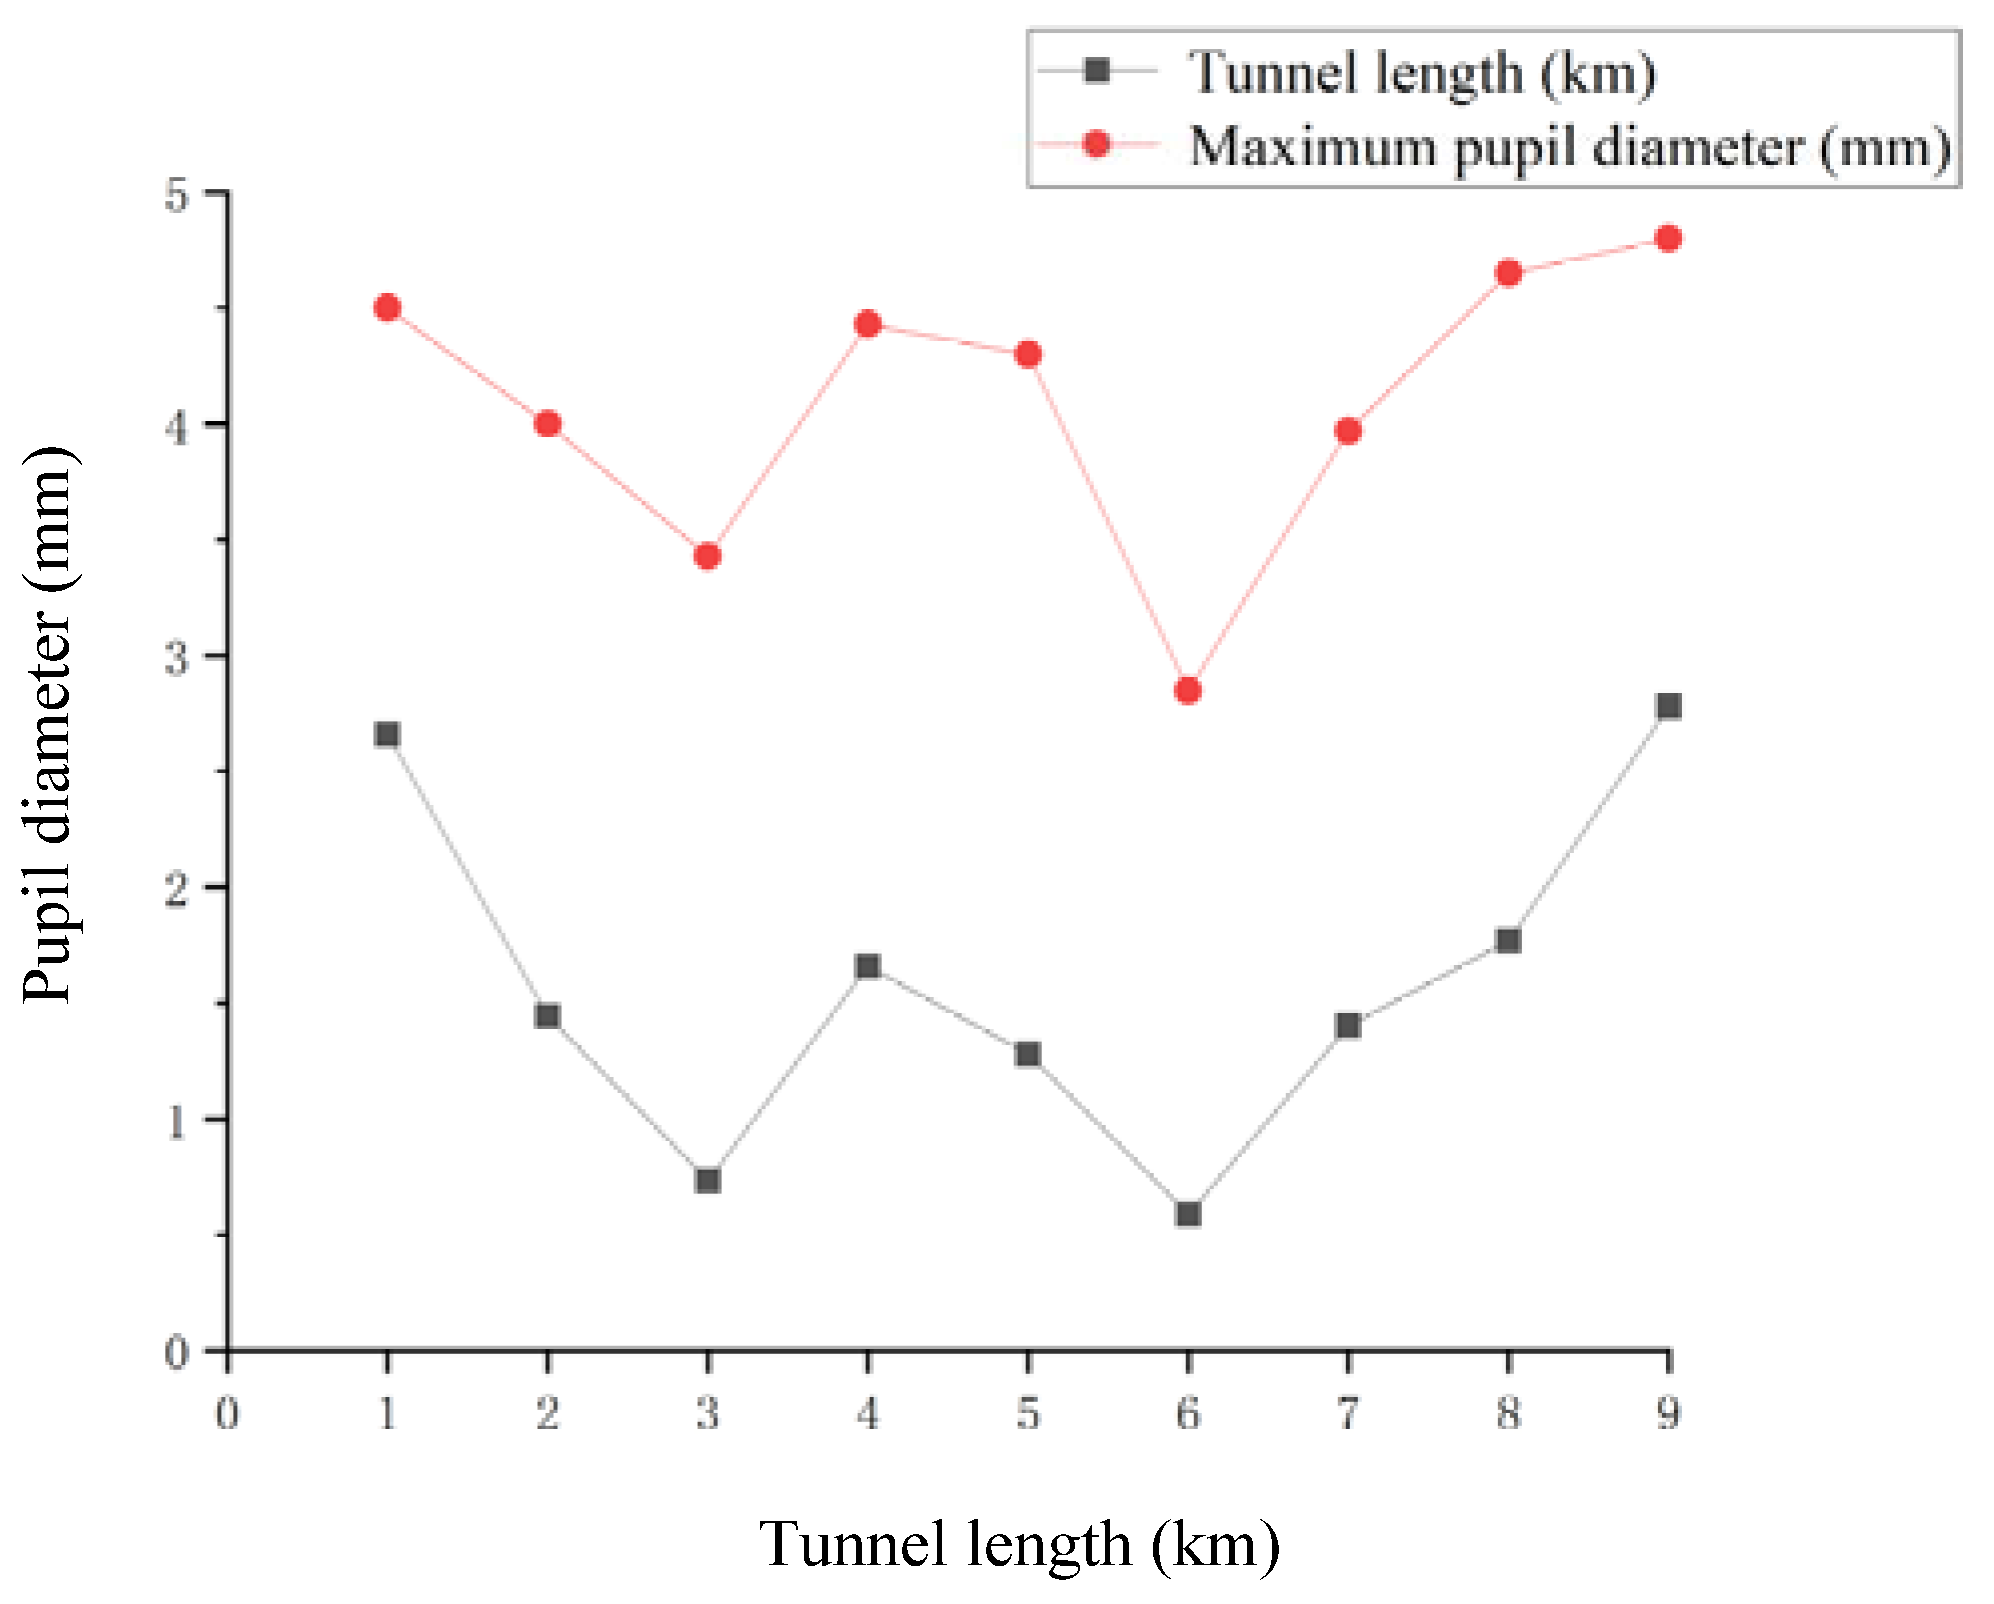
4.3.1. Analysis of the Influence of Urban Tunnel Length on Pupil Diameter

It was found that the amplitude of the pupil diameter of the driver was obviously different in different tunnels. Furthermore, the maximum pupil diameter of all the test drivers in the process of driving through each tunnel was counted, where the maximum and minimum values were eliminated, and the remaining data are taken as the mean value of the maximum pupil diameter of the test drivers. The maximum pupil diameter of the drivers and the tunnel length obtained from the statistics are summarized in Figure 6. It can be seen from that figure that the variation trend of the driver’s maximum pupil diameter is consistent with the urban tunnel length. The polynomial fitting was adopted to obtain the fitting curve as shown in Figure 7, and the fitting polynomial is shown in Equation (2):
y = 1.72 + 2.46 x 0.507 x 2 , and   R 2 = 0.907 .
It can be seen from Figure 7 that the length of the urban tunnel has a significant effect on the maximum pupil diameter of drivers. When tunnel length less than 1 km, the tunnel entrance is affected by the external light intensity, with the internal illuminance significantly higher relative to the longer tunnel. At the same time, the visibility of the short tunnel is better, as the driver can generally see the exit section at the entrance of the short tunnel, which helps reduce the tension of the driver. Therefore, the maximum pupil diameter of the driver is relatively small. With the increase in the length of the tunnel, the maximum pupil diameter increases rapidly to around 5 mm, then it flattens out and does not grow further with the increase in tunnel length. The reason is that with the increase in the tunnel length, the illumination value of the middle section decreases rapidly. To identify environmental information, the driver’s pupil diameter significantly increased, and the visual load increased. When the tunnel length exceeds 2 km, the illumination value of the middle segment of the tunnel does not further decrease, so the maximum pupil diameter of the driver does not have a further trend of increasing.

4.3.2. Analysis of the Influence of Urban Tunnel Length on Saccade Time

In a safe and comfortable environment, the driver’s eye movement is mainly in the form of fixation, accompanied by a little scanning behavior, and the fixation point moves forward synchronically with the vehicle. When the driving environment is poor, drivers will constantly adjust their sight to adapt to the surrounding environment, which manifests as an increase in drivers’ saccade behavior and a decrease in corresponding fixation behavior. At the same time, the driver’s visual recognition is reduced, with the operation reaction time prolonged. The average percentage of glancing time of the tested drivers in each tunnel is shown in Figure 8, and the percentage of glancing time of the drivers shows a certain changing trend with the change of tunnel length. The relationship between the two is further fitted, as shown in Figure 9, and the fitting polynomial is shown in Equation (3):
y = 2.49 + 2.3 x 0.4 x 2 , and   R 2 = 0.93 .
As can be seen from Figure 9, when the tunnel length is small, drivers can still maintain a high fixation behavior and a relatively low percentage of saccade time due to the suitable visibility of the tunnel, which has little impact on drivers’ visual distance. With the increase in tunnel length, the percentage of drivers’ scanning time increases rapidly, which indicates that the dark environment inside the tunnel has a significant impact on driving behavior. Drivers constantly adjust their sight to adapt to the dark environment inside the tunnel. In the tunnel length of more than 2.5 km of Xuanwuhu Tunnel and Jiuhuashan Tunnel, the driver scanning time percentage was the largest, but the growth rate was lower than other several “short” tunnels. This is because the influence of a tunnel on driving behavior is mainly strongest at the entrance and exit sections. After light and shade adaptation, the illumination value in the middle segment is relatively stable, and the influence on driving behavior fluctuates little, so the contribution rate to the percentage of saccade time is not large.
By comparing the fitting curves in Figure 7 and Figure 9, it can be seen that when the tunnel length changes from 0.6 to 2 km, the maximum pupil diameter of drivers increases by 73%, while the percentage of scanning time increases by 47%. Therefore, when the length of an urban tunnel is less than 2 km, the pupil diameter value is relatively more sensitive to the change of tunnel length. When the length of the urban tunnel exceeds 2 km, the growth rate of maximum pupil diameter and percentage of saccades time decrease simultaneously, and the growth rate of the former decreases more obviously.

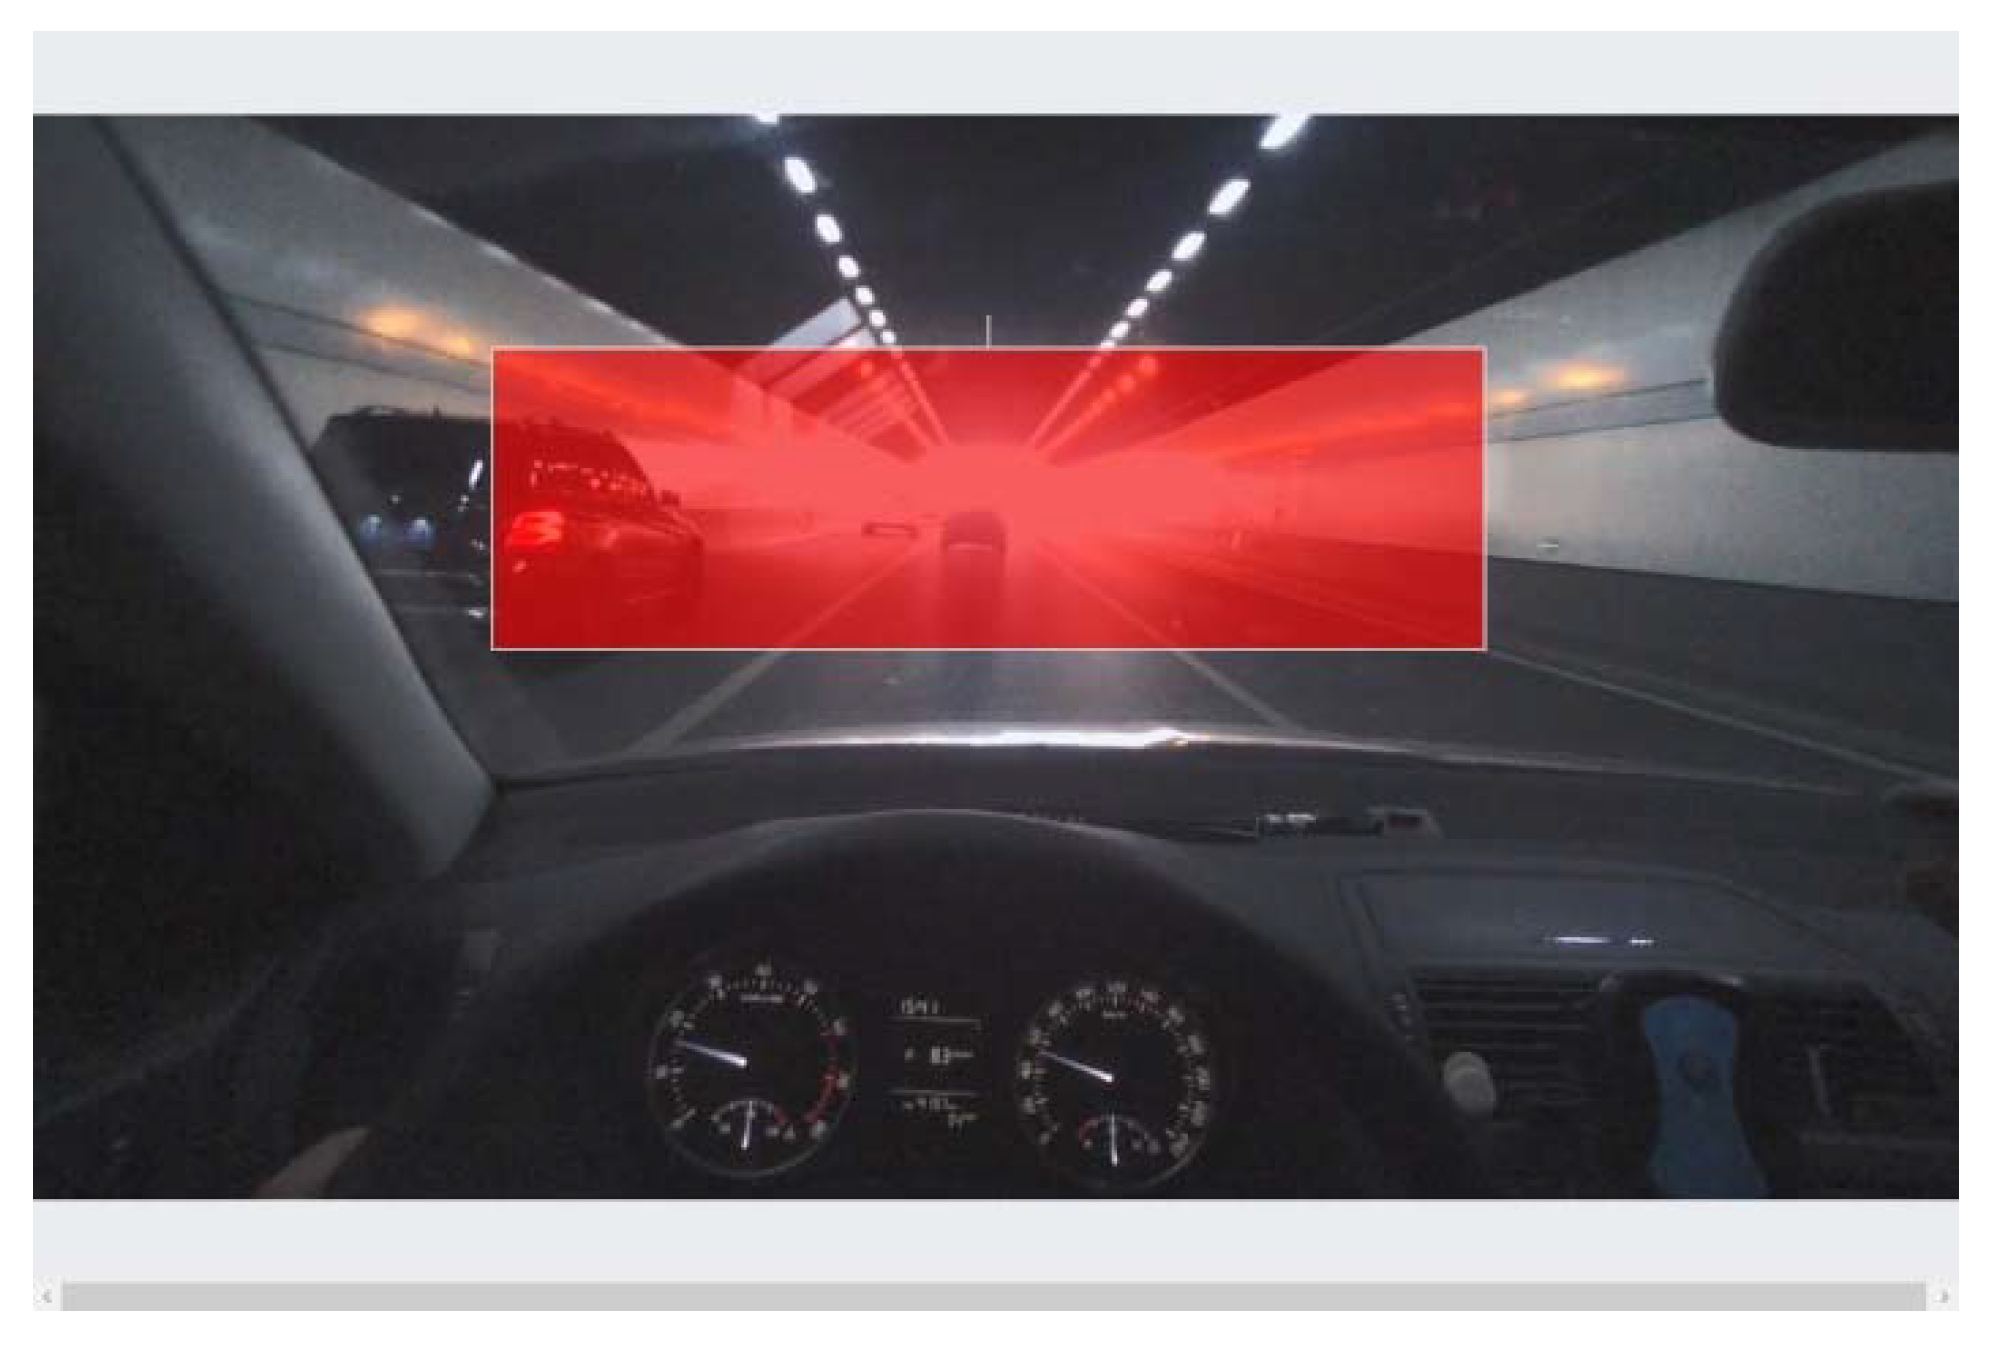
4.3.3. Analysis of the Influence of Urban Tunnel Length on Gaze Area

In the process of driving, drivers obtain traffic information from the surrounding environment through a visual search strategy. A concrete performance is the driver’s fixation point remaining fixed. In a relatively safe and comfortable driving environment, the fixation point mainly focuses on the lane in front of the vehicle. The distribution of fixation points of the test drivers when driving through Xuanwuhu Tunnel is shown in Figure 10. According to the distribution of drivers’ fixation points, the lane boundary in front of the urban tunnel is taken as the horizontal boundary, and the near-view point of the lane in front and the far-view point of the stopping sight distance is taken as the vertical boundary [19,33]. A simplified safety fixation area is proposed, as shown in the red area in Figure 11. In the statistical process of driving through each tunnel, the percentage of fixation points distributed in the safety fixation area of the tested drivers is shown in Table 5.
It can be seen from Figure 10 and Table 5 that the range of fixation point distribution in the horizontal and vertical directions is larger when driving through a long tunnel. To obtain relevant traffic information, drivers constantly adjust the position of fixation points when driving through a long tunnel, and the driving load increases. Meanwhile, the percentage of fixation points in the right lane in front decreases, and the driving risk increases significantly.

5. Conclusions

In this paper, a two-step clustering algorithm and a data-fitting method were used to process the experimental data of drivers’ visual parameters by carrying out urban tunnel-driving experiments, and the changing trend of drivers’ visual characteristics in urban tunnels was studied. The following conclusions are drawn:
(1) The urban tunnel environment has a significant influence on the pupil diameter of drivers. The pupil diameter and its change rate increase sharply at the tunnel entrance transition section and then maintain a high fluctuation, while the pupil diameter at the tunnel exit changes relatively gently.
(2) The two-step clustering algorithm has suitable adaptability to drivers’ pupil diameter. The clustering results are divided into three categories with suitable classification degrees and obvious differences between high and low center values of clustering. Through the bivariate two-step clustering, a three-dimensional distribution map of the driver’s pupil diameter and its change rate, the transition section at the tunnel entrance, the outside of the tunnel, and the inside of the tunnel can be clearly identified.
(3) A short urban tunnel length of less than 1 km, due to relatively suitable visibility, and the impact of external natural light, supplemented by suitable lighting facilities, has little impact on the visual characteristics of drivers. When the length of the urban tunnel is between 1 and 2 km, the illumination value inside the tunnel decreases rapidly, which has the greatest impact on drivers’ vision. When the tunnel length exceeds 2 km and further increases, the effect on drivers’ visual characteristics decreases significantly. The length of the urban tunnel has a significant influence on the distribution of drivers’ fixation points. The greater the tunnel length, the lower the percentage of drivers’ fixation points in the lane ahead, and the greater the driving risk.
The driving experiment in this paper was conducted in off-peak hours in fine weather, and the personal characteristics of the drivers were not studied further. The next stage of the study will consider the impact of traffic flow changes on urban tunnel-driving behavior, and at the same time, different types of test drivers will be recruited to study the impact of personal traits on tunnel-driving behavior. On the other hand, the parameters selected in the cluster analysis are relatively single, and some sections still need to be further differentiated by the change rate of pupil diameter. In the next stage, other parameters will be introduced into the study to further improve the accuracy of the primary recognition of the cluster model. The applicability of the simple safety zone evaluation method quoted in this paper still needs to be further verified.

Author Contributions

Conceptualization, S.F. and J.M.; methodology, S.F.; software, S.F.; validation, S.F. and J.M.; formal analysis, S.F. and J.M.; investigation, S.F.; resources, S.F.; data curation, S.F.; writing—original draft preparation, S.F.; writing—review and editing, S.F. and J.M.; visualization, S.F.; supervision, S.F.; project administration, J.M.; funding acquisition, J.M. All authors have read and agreed to the published version of the manuscript.

Funding

This research was funded by the Youth Foundation of National Natural Science Foundation of China, Grant No. 51508280 and the Excellent Scientific and Technological Innovation team of Universities in Jiangsu Province, Grant No. 2019042.

Institutional Review Board Statement

The study was conducted according to the guidelines of the Declaration of Helsinki, and approved by the Institutional Review Board of Nanjing Forestry University (protocol code 2020-09-005, September 2020).

Informed Consent Statement

Informed consent was obtained from all subjects involved in the study.

Data Availability Statement

Some or all data, models, or code generated or used during the study are available in a repository or online in accordance with funder data retention policies. The data used to support the findings of this study can be offered by the authors upon request.

Conflicts of Interest

The authors declared that they have no conflict of interest in this work.

References

  1. Ma, Y.; Lu, L.; Lu, J.J. Safety evaluation model of urban cross-river tunnel based on driving simulation. Int. J. Inj. Control. Saf. Promot. 2016, 24, 293–302. [Google Scholar] [CrossRef]
  2. Du, Z.; Zheng, Z.; Zheng, M. Drivers’ visual comfort at highway tunnel portals: A quantitative analysis based on visual os-cillation. Transp. Res. Part D Transp. Environ. 2014, 31, 37–47. [Google Scholar]
  3. Changbin, C.; Junhua, W.; Yangming, L.; Cao, C. Driving simulator validation for research on driving behavior at entrance of urban underground road. In Proceedings of the 2015 International Conference on Transportation Information and Safety (ICTIS), Wuhan, China, 25–28 June 2015; pp. 147–150. [Google Scholar]
  4. Zhou, Z.; Ma, J.; Lu, T.; Li, G.; Fang, S.; Tan, T. An Evaluation Method for Visual Search Stability in Urban Tunnel Entrance and Exit Sections Based on Markov Chain. IEEE Access 2020, 8, 68559–68569. [Google Scholar] [CrossRef]
  5. Liang, S.Y.; Yang, C.Y. Study of the Lighting of Entrance/Exit Segments of Urban Tunnels and Outside-Tunnel Roads Based on Visual Efficiency Theory. Appl. Mech. Mater. 2014, 470, 871–875. [Google Scholar] [CrossRef]
  6. Feng, Z.; Yang, M.; Zhang, W.; Du, Y.; Bai, H. Effect of longitudinal slope of urban underpass tunnels on drivers’ heart rate and speed: A study based on a real vehicle experiment. Tunn. Undergr. Space Technol. 2018, 81, 525–533. [Google Scholar] [CrossRef]
  7. Yang, Y.; Yao, M. Analysis of Influencing Factors of Traffic Accidents in Undersea Tunnel. J. Eng. Res. Rep. 2020, 37–49. [Google Scholar] [CrossRef]
  8. Zhao, E.-Z.; Dong, L.-L.; Chen, Y.; Lou, Q.; Xu, W.-H. The Impact of LED Color Rendering on the Dark Adaptation of Human Eyes at Tunnel Entrances. Int. J. Environ. Res. Public Health 2020, 17, 1566. [Google Scholar] [CrossRef] [Green Version]
  9. Jiao, F.; Du, Z.; Wang, S.; Ni, Y.; He, R. Drivers’ Saccade Characteristics in Curves of Extra-Long Urban Underwater Tunnels. Transp. Res. Rec. J. Transp. Res. Board 2020, 2674, 102–111. [Google Scholar] [CrossRef]
  10. Jiao, F.; Du, Z.; Wang, S.; Yang, L.; Ni, Y. Research on drivers’ visual characteristics in different curvatures and turning conditions of the extra-long urban underwater tunnels. Tunn. Undergr. Space Technol. 2020, 99, 103360. [Google Scholar] [CrossRef]
  11. Zheng, Z.; Du, Z.; Yan, Q.; Xiang, Q.; Chen, G. The impact of rhythm-based visual reference system in long highway tunnels. Saf. Sci. 2017, 95, 75–82. [Google Scholar] [CrossRef]
  12. Feng, D.; Chen, F.; Pan, X. Research on Driver Physiological Load at the Lowest Point of City River-crossing Tunnels. Transp. Res. Procedia 2017, 25, 1494–1502. [Google Scholar] [CrossRef]
  13. Gil-Martín, L.; Peña-García, A.; Jiménez, A.; Hernández-Montes, E. Study of light-pipes for the use of sunlight in road tunnels: From a scale model to real tunnels. Tunn. Undergr. Space Technol. 2014, 41, 82–87. [Google Scholar] [CrossRef]
  14. Roberts, A.C.; Christopoulos, G.I.; Car, J.; Soh, C.-K.; Lu, M. Psycho-biological factors associated with underground spaces: What can the new era of cognitive neuroscience offer to their study? Tunn. Undergr. Space Technol. 2016, 55, 118–134. [Google Scholar] [CrossRef]
  15. Mehri, A.; Sajedifar, J.; Abbasi, M.; Naimabadi, A.; Mohammadi, A.A.; Teimori, G.H.; Zakerian, S.A. Safety evaluation of lighting at very long tunnels on the basis of visual adaptation. Saf. Sci. 2019, 116, 196–207. [Google Scholar] [CrossRef]
  16. Kircher, K.; Ahlstrom, C. The impact of tunnel design and lighting on the performance of attentive and visually distracted drivers. Accid. Anal. Prev. 2012, 47, 153–161. [Google Scholar] [CrossRef] [PubMed]
  17. Kircher, K.; Ahlstrom, C. Evaluation of methods for the assessment of attention while driving. Accid. Anal. Prev. 2018, 114, 40–47. [Google Scholar] [CrossRef] [PubMed]
  18. Hu, X.; Zhang, F.; Lu, J.; Liu, M.; Ma, Y.; Wan, Q. Research on influence of sun glare in urban tunnels based on cellular automaton model in the framework of Kerner’s three-phase traffic theory. Phys. A Stat. Mech. Its Appl. 2019, 527, 121176. [Google Scholar] [CrossRef]
  19. He, S.; Liang, B.; Pan, G.; Wang, F.; Cui, L. Influence of dynamic highway tunnel lighting environment on driving safety based on eye movement parameters of the driver. Tunn. Undergr. Space Technol. 2017, 67, 52–60. [Google Scholar] [CrossRef]
  20. Qin, X.; Zhang, N.; Zhang, W.; Meitner, M. How does tunnel interior color environment influence driving behavior? Quantitative analysis and assessment experiment. Tunn. Undergr. Space Technol. 2020, 98, 103320. [Google Scholar] [CrossRef]
  21. Guo, Y.; Wang, X.; Xu, Q.; Liu, F.; Liu, Y.; Xia, Y. Change-Point Analysis of Eye Movement Characteristics for Female Drivers in Anxiety. Int. J. Environ. Res. Public Health 2019, 16, 1236. [Google Scholar] [CrossRef] [Green Version]
  22. Qin, L.; Dong, L.-L.; Xu, W.-H.; Zhang, L.-D.; Leon, A.S. Influence of Vehicle Speed on the Characteristics of Driver’s Eye Movement at a Highway Tunnel Entrance during Day and Night Conditions: A Pilot Study. Int. J. Environ. Res. Public Health 2018, 15, 656. [Google Scholar] [CrossRef] [Green Version]
  23. Yan, Y.; Yuan, H.; Wang, X.; Xu, T.; Liu, H. Study on Drivers Fixation Variation at Entrance and Inside Sections of Tunnel on Highway. Adv. Mech. Eng. 2014, 7, 273427. [Google Scholar] [CrossRef]
  24. Hu, Y.; Zhu, T.; Li, J.; Liu, H. Research on fixation transition characteristics of drivers in extra-long tunnel. J. Saf. Sci. Technol. 2017, 13, 42–48. [Google Scholar]
  25. Zhu, T.; Wu, L.; Hu, Y.; Liu, H.; Xu, B. Research on Characteristics of Drivers Mental Workload in Extra-long Expressway Tunnels Based on the Factor Model. China J. Highw. Transp. 2018, 31, 165–175. [Google Scholar]
  26. Peng, J.; Wang, C.; Shao, Y.; Xu, J. Visual Search Efficiency Evaluation Method for Potential Connected Vehicles on Sharp Curves. IEEE Access 2018, 6, 41827–41838. [Google Scholar] [CrossRef]
  27. Du, Z.; Xu, W.; Xiang, Y. Research on Light Environment Improvement Framework of Highway Tunnel Based on Visual Guidance. China J. Highw. Transp. 2018, 31, 122–129. [Google Scholar]
  28. Du, Z.; Ni, Y.; Yang, L.; Wen, J.; Yu, X. Effectiveness Experiment of Sight Induction Facilities of Curve Sections in Highway Tunnel. J. Traffic Transp. Eng. 2020, 20, 215–225. [Google Scholar]
  29. Hu, J.; Zhang, X.; Guo, D. Research on the Tunnel Entrance Night Light Environment of Highway Tunnel Based on Visual Safety. Trans. Beijing Inst. Technol. 2016, 36, 487–490. [Google Scholar]
  30. Zhang, X.; Hu, J.; Wang, M.; Guo, X. Road Surface Luminance of Tunnel Interior Zone Based on the Driving Visual Cognition Demand. J. Beijing Univ. Technol. 2016, 42, 768–773. [Google Scholar]
  31. Cai, X.; Cailin, L.; Bo, P.; Xiaoyong, T.; Zhigang, G. Road Traffic Safety Risk Estimation Based on Driving Behavior and Information Entropy. China J. Highw. Transp. 2020, 33, 190–201. [Google Scholar]
  32. Fu, Z.; Tian, Z.; Xu, Y.; Qiao, C. A Two-Step Clustering Approach to Extract Locations from Individual GPS Trajectory Data. ISPRS Int. J. Geo-Inf. 2016, 5, 166. [Google Scholar] [CrossRef]
  33. Liang, B.; Shiyong, H.; Guobing, P.; Yao, X.; Lulu, C. Study of Driving Safety in a Highway Tunnel with New Interior Applied Materials. Mod. Tunn. Technol. 2015, 52, 16–21, 29. [Google Scholar]
Figure 1. Fast inner ring road of Nanjing City.
Applsci 11 04274 g001
Figure 2. Driver pupil diameter change curve.
Applsci 11 04274 g002
Figure 3. Cluster distribution diagram of driver pupil diameter.
Applsci 11 04274 g003
Figure 4. Cluster distribution of pupil diameter change rate.
Applsci 11 04274 g004
Figure 5. Cluster 3D distribution of two variables.
Applsci 11 04274 g005
Figure 6. Experimental data of tunnel length and maximum pupil diameter.
Applsci 11 04274 g006
Figure 7. The fitted curve of tunnel length and maximum pupil diameter.
Applsci 11 04274 g007
Figure 8. Experimental data of tunnel length and percentage of scanning time.
Applsci 11 04274 g008
Figure 9. The fitted curve of tunnel length and percentage of scanning time.
Applsci 11 04274 g009
Figure 10. Distribution of driver fixation points in Xuanwuhu Tunnel.
Applsci 11 04274 g010
Figure 11. Safe gaze area.
Applsci 11 04274 g011
Table 1. Experimental tunnel length statistics.
TunnelLength (km)
Xuanwuhu Tunnel2.66
Mofanmalu Tunnel1.44
Caochangmen Tunnel0.73
Qingliangmen Tunnel1.66
Shuiximen Tunnel1.28
Jiqingmen Tunnel0.59
Tongjimen Tunnel1.40
Xianmen Tunnel1.77
Jiuhuashan Tunnel2.78
Table 2. Clustering distribution of pupil diameter.
CategorySamplesPercentageCluster CenterStandard Deviation
1417330.5%4.08670.1734
2457933.4%2.47820.1687
3494836.1%3.37650.1986
Table 3. Clustering distribution of pupil diameter change rate.
CategorySamplesPercentageCluster CenterStandard Deviation
1238417.4%0.97270.6037
210,84179.1%−0.15870.4075
34743.5%−1.24611.1119
Table 4. Clustering distribution of two variable.
CategorySamplesPercentageCluster CenterStandard Deviation
1233917.8%1.62440.2783
2453533.1%0.45020.3346
3672649.1%−0.89260.2041
Table 5. Percentage of driver gaze in the safe area.
TunnelPercentage (%)
Xuanwuhu Tunnel52.4
Mofanmalu Tunnel61.7
Caochangmen Tunnel78.5
Qingliangmen Tunnel59.8
Shuiximen Tunnel65.7
Jiqingmen Tunnel83.6
Tongjimen Tunnel66.8
Xianmen Tunnel57.2
Jiuhuashan Tunnel50.8
Publisher’s Note: MDPI stays neutral with regard to jurisdictional claims in published maps and institutional affiliations.

