1. Introduction
Agriculture is one of the main economic activities in the world. Today, considering the continuous human growth population and the limited food availability, agricultural activities need to be monitored on regular basis, in such a manner that the increase in efficiency in food production is enabled, while protecting the natural ecosystems [
1,
2,
3,
4]. In this context, crop classification can be used to provide information about production and thus becomes a useful tool for developing sustainable plans and reducing environmental issues associated with agriculture [
5,
6,
7]. As a result, timely collection and the analysis of data from large crop areas is of great interest. Traditionally, such analysis is carried out by using computational tools and satellite imagery processing with artificial intelligence (AI) techniques [
8,
9,
10,
11].
Throughout the years, several AI techniques have been explored to tackle the problems related with crop classification [
12,
13]. In such vein, machine learning (ML) benchmark algorithms have been successfully used from both unsupervised [
14,
15] and supervised [
16] inferences. Nonetheless, conventional ML techniques may not be recommendable (and may even be prohibitive) when a manual feature extraction stage is unfeasible. In addition, ML approaches may require exhaustive parameter tuning to reach a high accuracy. In this connection, by overcoming these drawbacks, deep learning (DL) has recently taken place as one of the most appealing approaches. Broadly, DL approaches can be divided into artificial neural networks (ANNs), recurrent neural network (RNNs) and convolutional neural networks (CNNs) [
17]. Particularly, for image classification problems, CNNs and RNNs are preferred over conventional ANNs as they extract sequential information. RNNs have proven to be effective at extracting temporal correlations and classifying data as a whole while maintaining a manageable computational complexity. In this regard, some works [
18,
19] have proposed novel network architectures based on RNNs combined with CNNs for automated feature extraction from multiple satellite images through learning time correlation.
CNNs are of special interest as their main advantage over other techniques—besides automatically extracting features through convolutional layers—is their ability to capture spatial features (i.e., the pixel arrangement and relationships thereof) [
20,
21] as well as its versatility [
22,
23]. Recent works based on hybrid methods combining 2D- and 3D-CNN [
24] have proven that 3D-CNNs enable the joint spatial–spectral feature representation from stacked spatial bands. Such methods have been shown to be less computationally expensive than those solely based on 3D-CNN architectures [
25,
26,
27]. In addition, some exploratory studies exhibit that 3D-CNNs may underperform 2D-CNNs when classes have similar textures across multiple spectral bands [
28], and therefore 2D-CNN-based approaches are preferred by the vast majority of recent research works on crop classification. Following from these insights and given that this work is not intended to include spatial–temporal information, 2D-CNNs are the architectures of choice for this study.
Nonetheless, despite being appealing for image analysis in agriculture settings, techniques based on 2D-CNNs may involve complex architectures with a great amount of layers and parameters entailing a high computational cost and training time [
25,
29]. Therefore, there is still a need for creating more accurate crop classification systems which involve a lower computational burden.
Aimed at establishing a way forward to provide solutions in this regard, this work introduces a competitive methodology for crop classification from multispectral satellite imagery by taking advantage of using an enhanced 2D-CNN together with a novel post-processing step. Inspired by the main workflow of various RNN/2D-CNN-based methods for patch classification [
20,
30,
31,
32,
33,
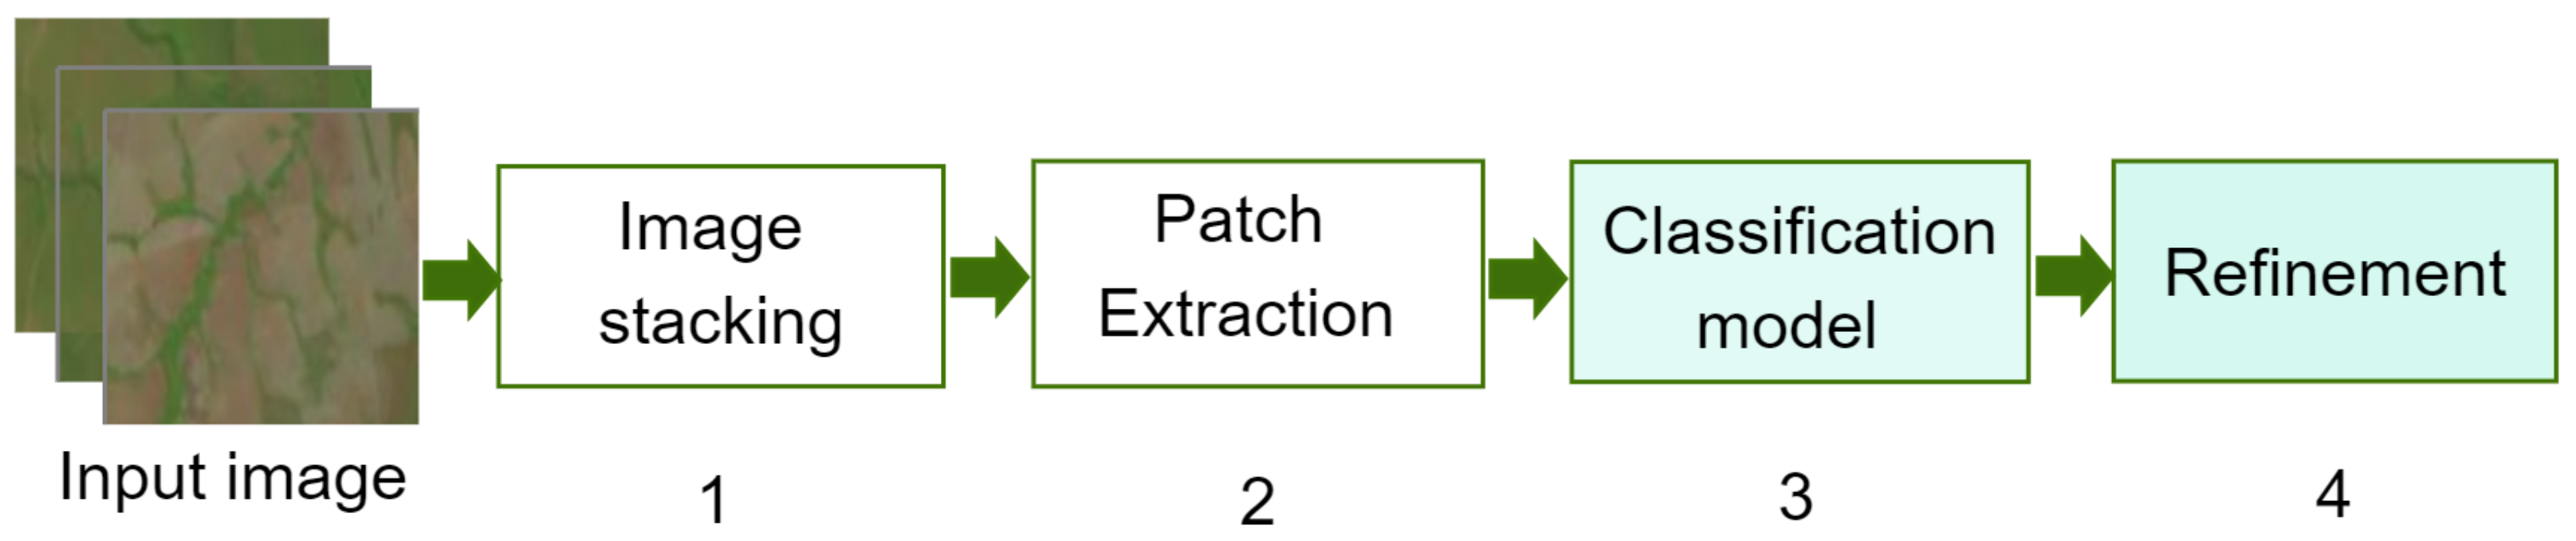
34], the proposed methodology mainly contains four steps: image stacking, patch extraction, 2D-CNN based modelling for classification purposes and post-processing, as depicted in
Figure 1.
In broad terms, the proposed methodology works as follows: (1) the images are stacked to increase the number of features; (2) the input images are split into patches and fed into the 2D-CNN; (3) the 2D-CNN architecture is designed following a smaller-scale approach, and trained to recognize 10 different types of crops (soybean, corn, cotton, sorghum, non-commercial crops (NCC), pasture, eucalyptus, grass, soil, and Cerrado); and (4) reduce the classification error caused by lower-spatial-resolution images, and a here-introduced post-processing step is performed.
Images used in this work are from the Campo Verde database, introduced in [
30], which corresponds to a Landsat 8 imagery of a tropical region (Municipality of Campo Verde) from Brazil. Its analysis represents a challenging problem as it holds a wide range of crops, and related research works have mostly been devoted to studying non-tropical areas.
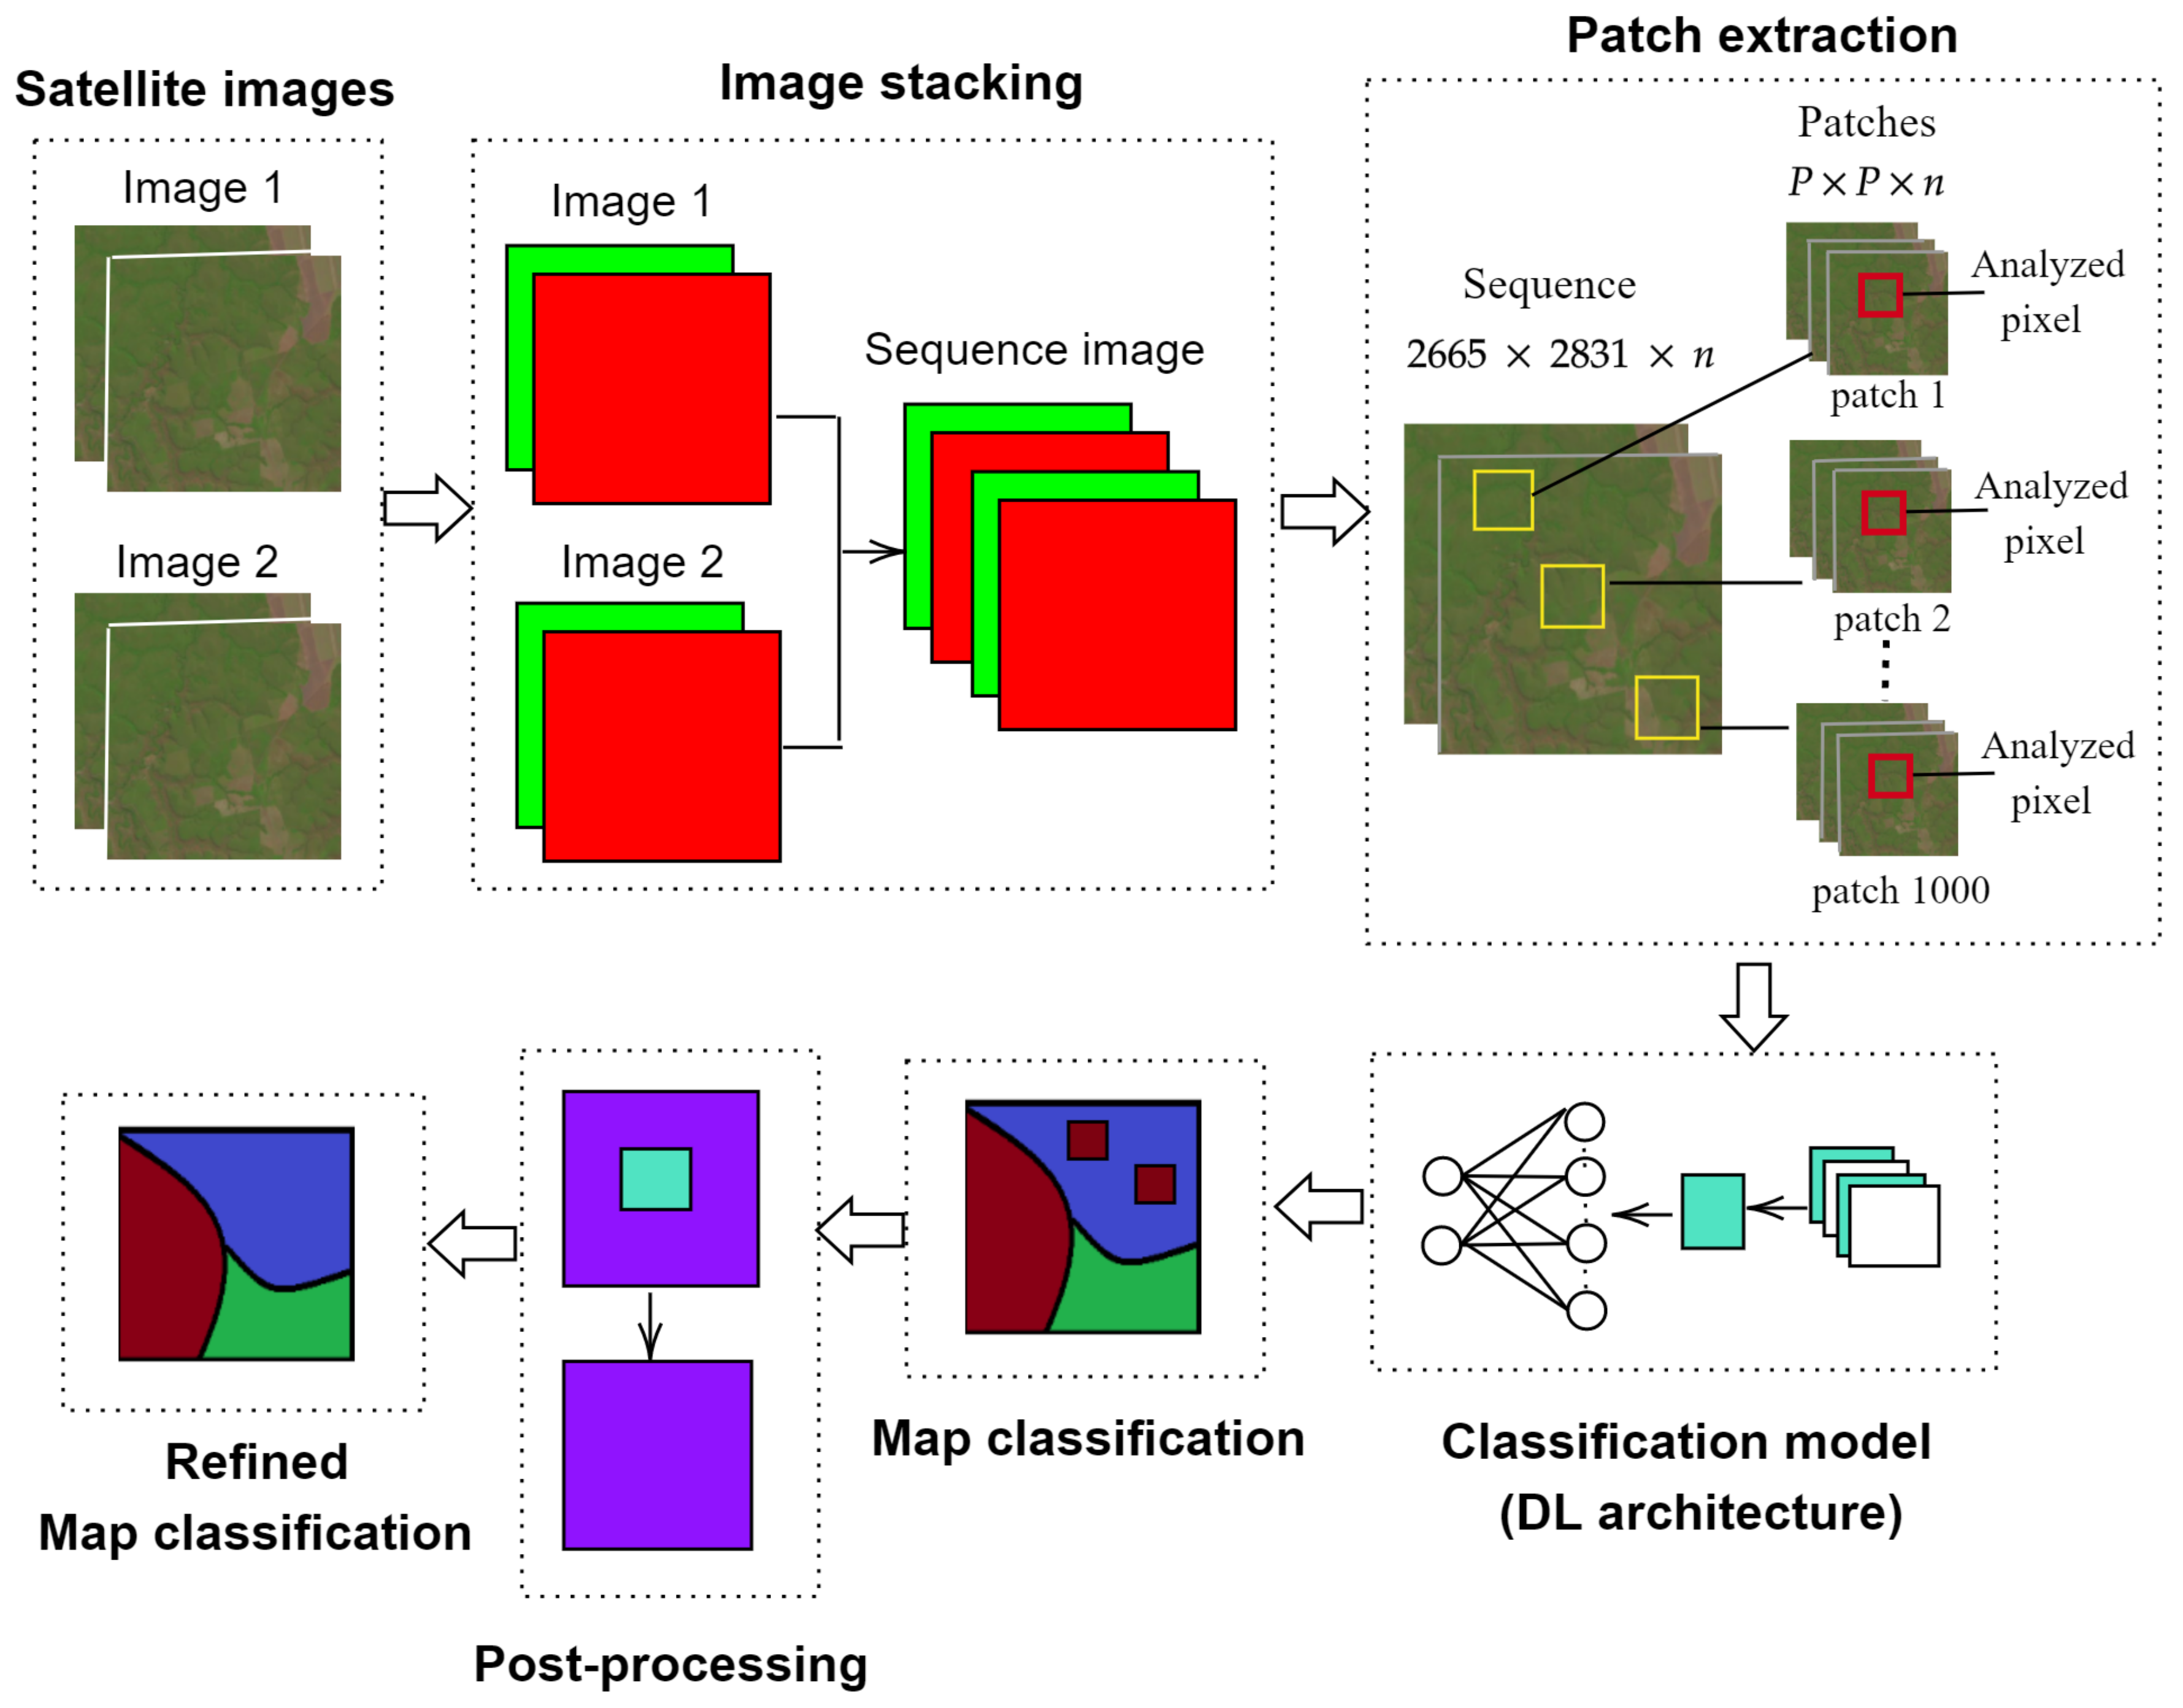
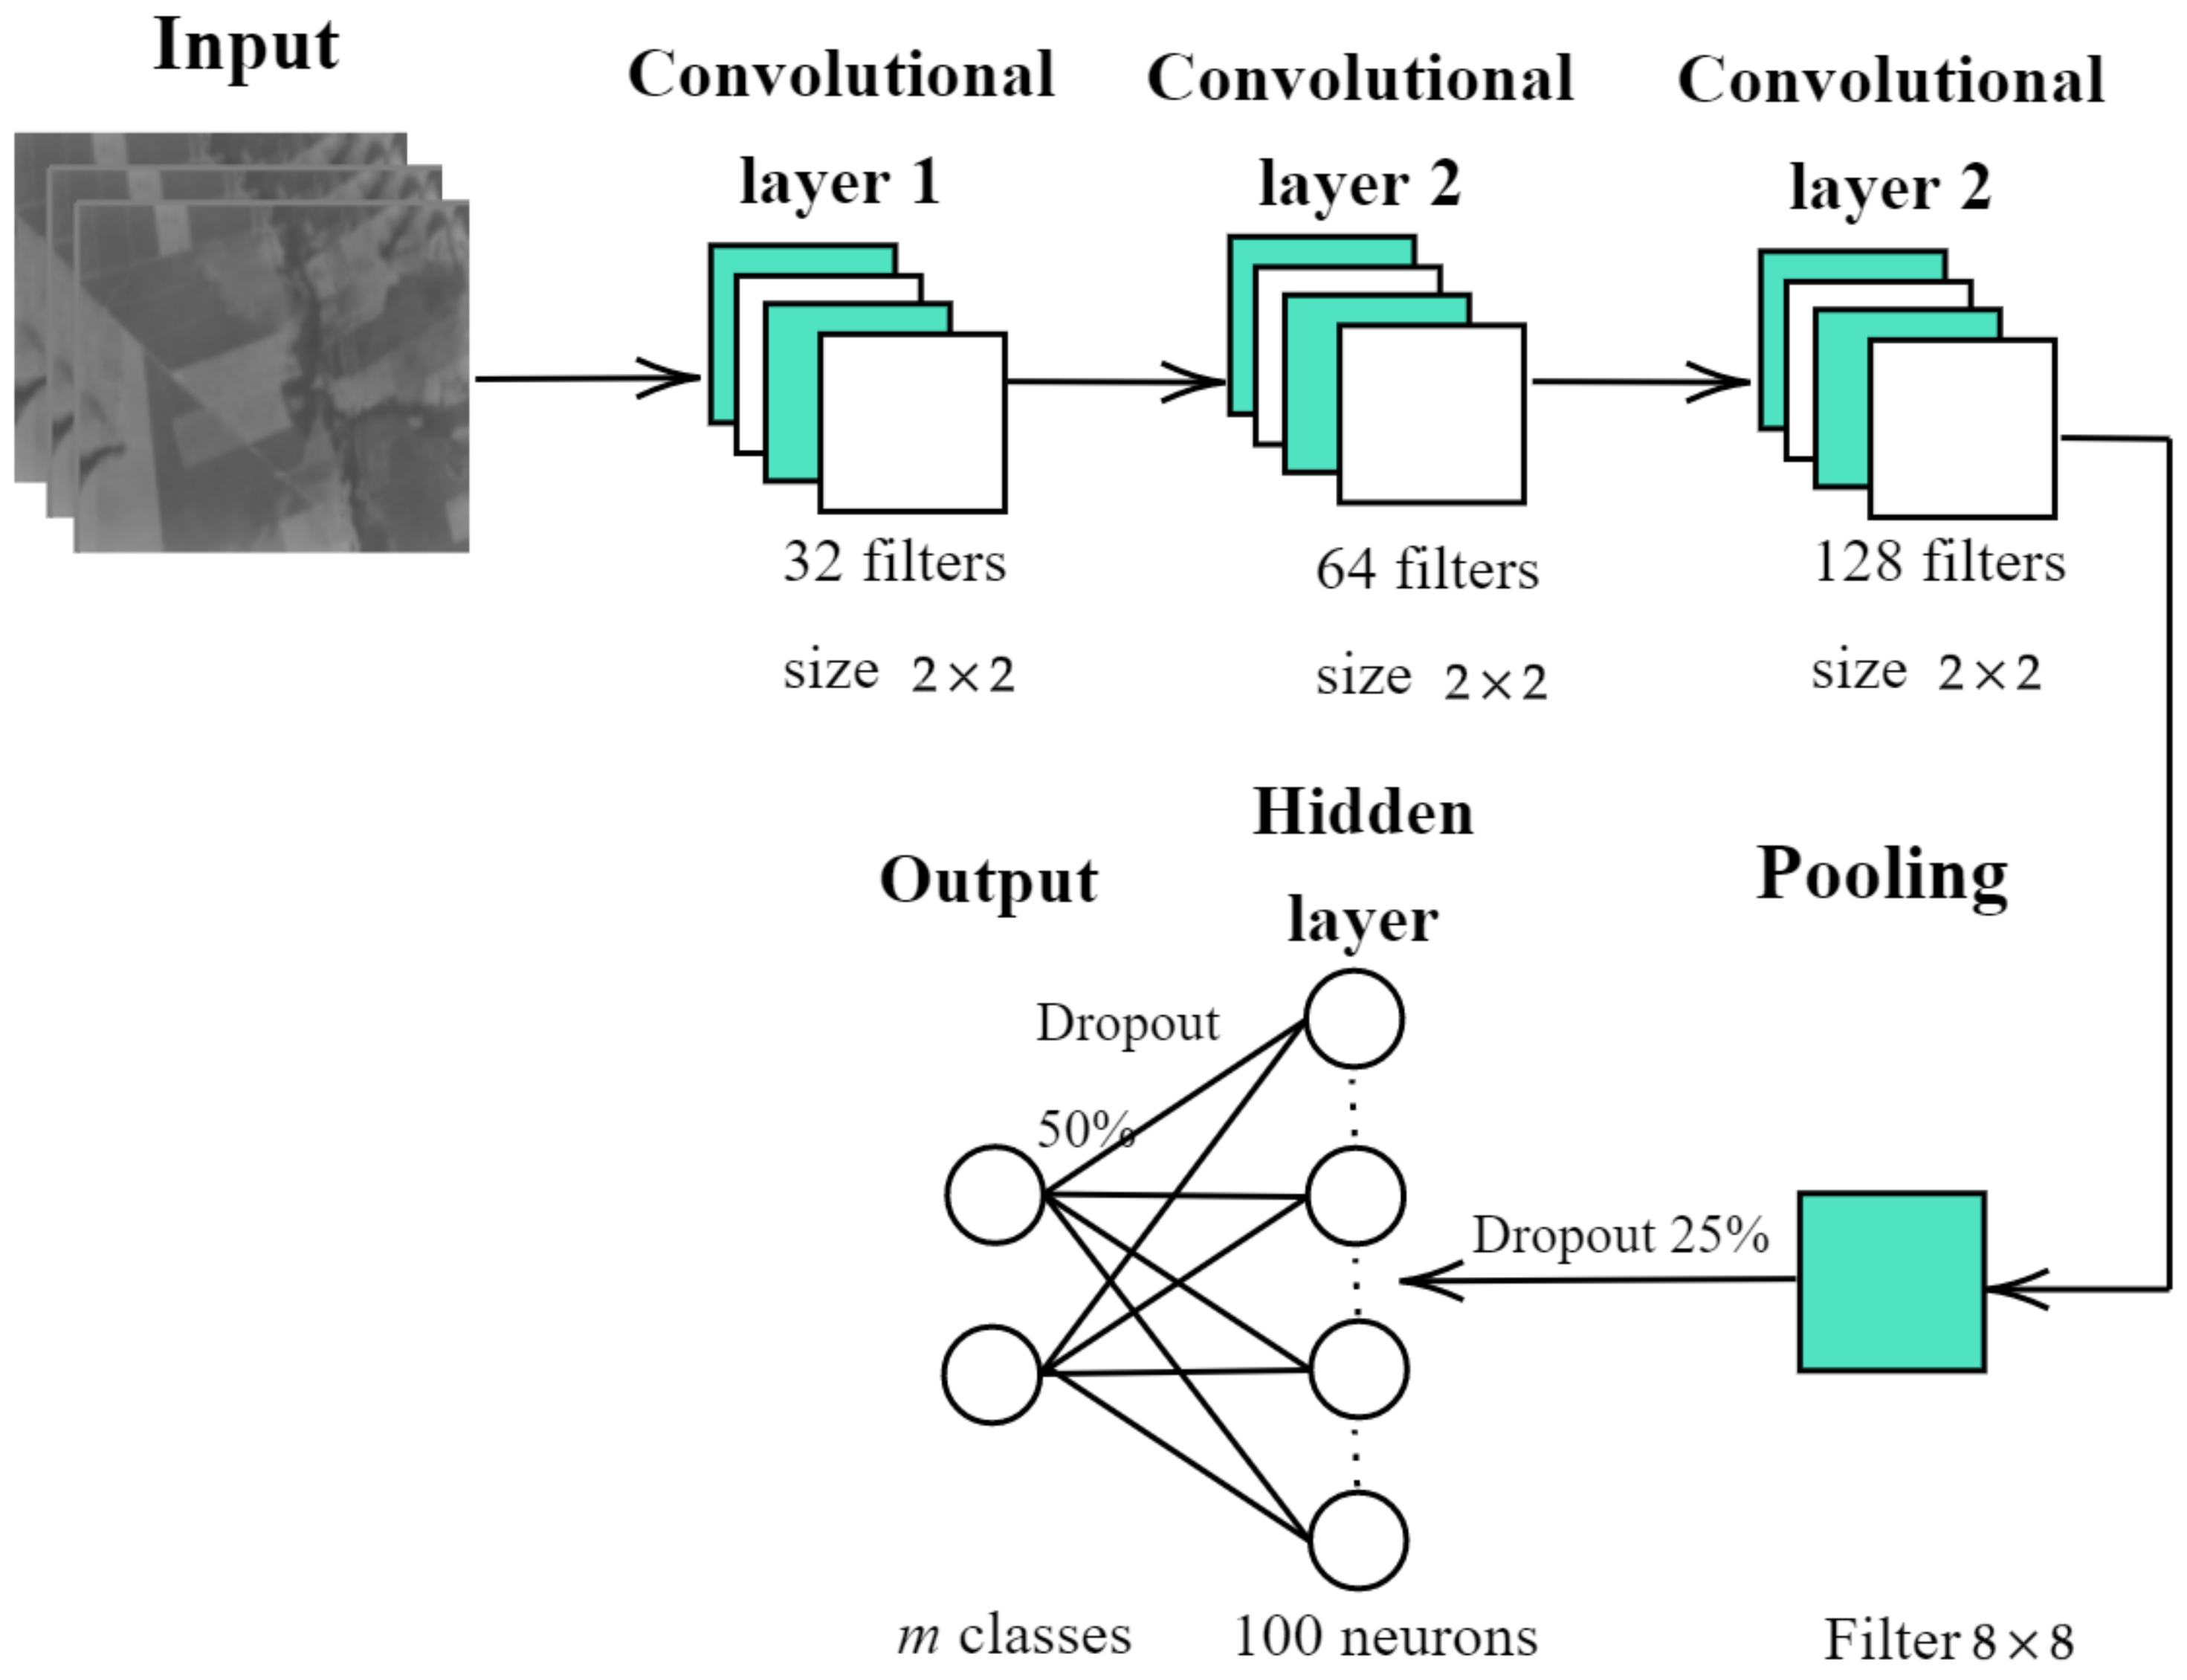
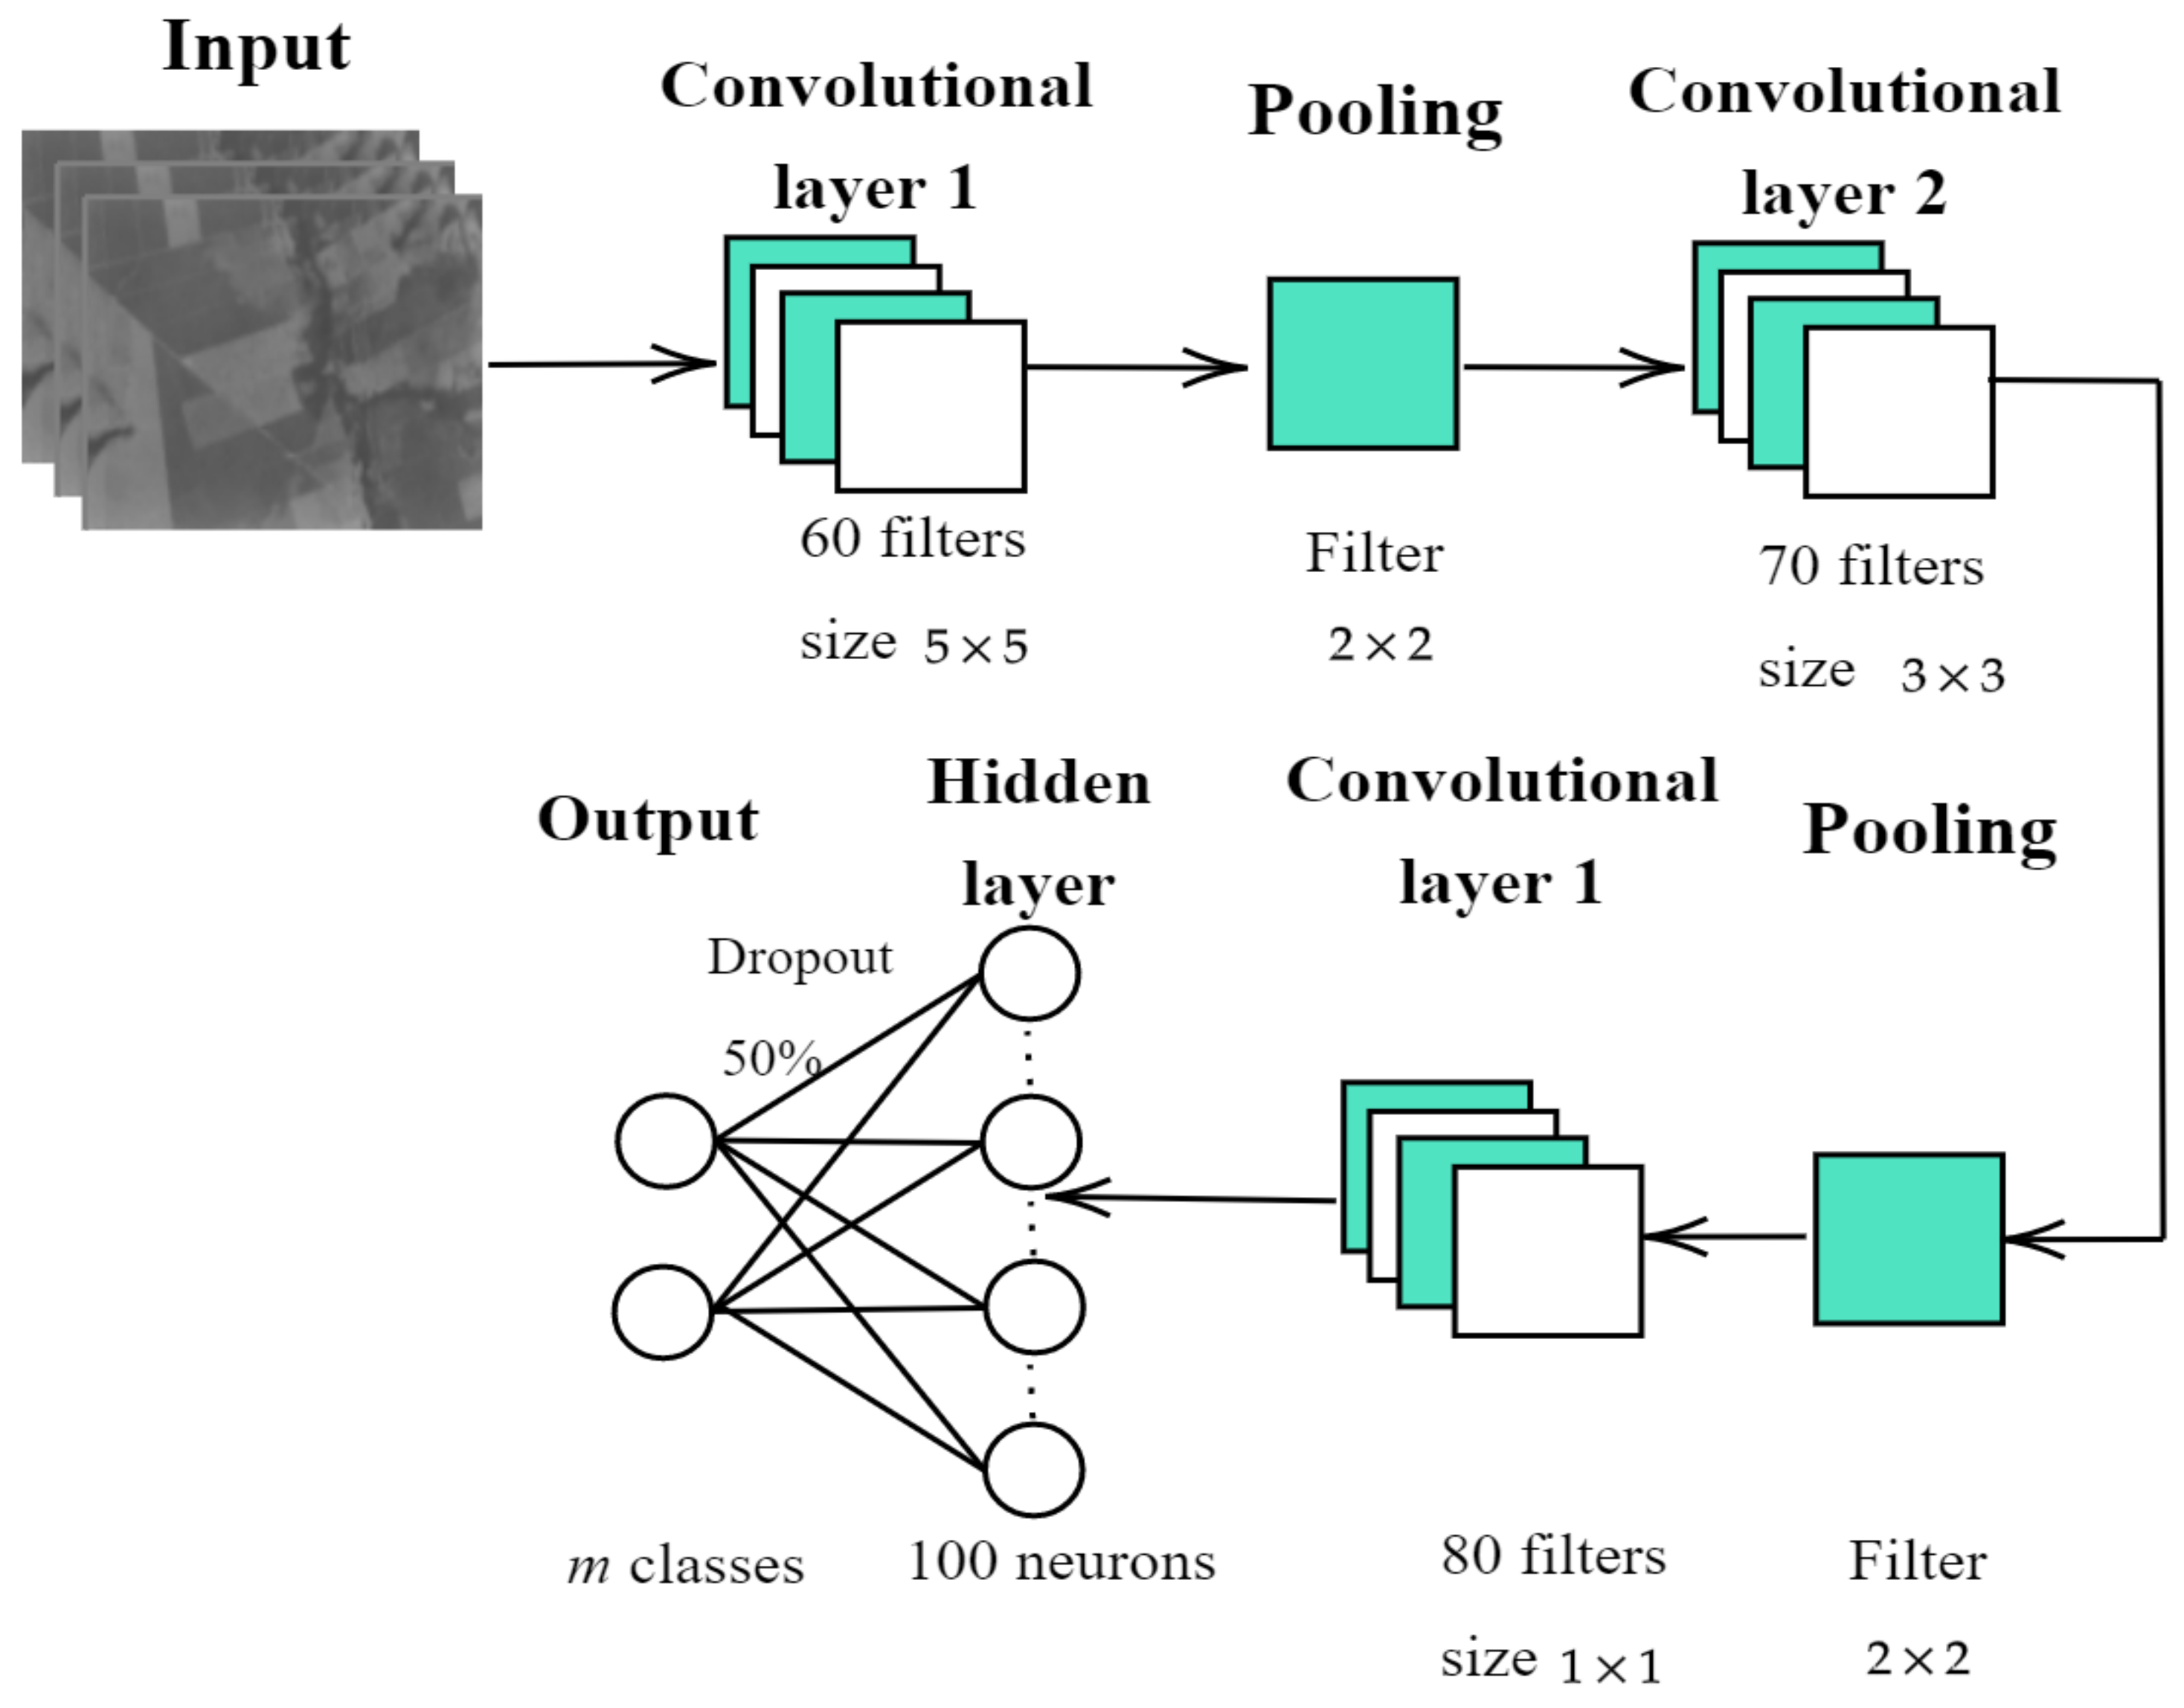
As for the design and implementation of the enhanced 2D-CNN, the following architecture is proposed: firstly, the 2D-CNN is trained independently for each one of the sequences by extracting patches of pixels in size, where n is the number of bands in the sequence. Secondly, the training patches are passed through three layers of convolution, yielding the feature maps. Thirdly, a pooling layer reduces the feature map size. Finally, the classification task itself is carried out by a fully-connected layer and the output layer.
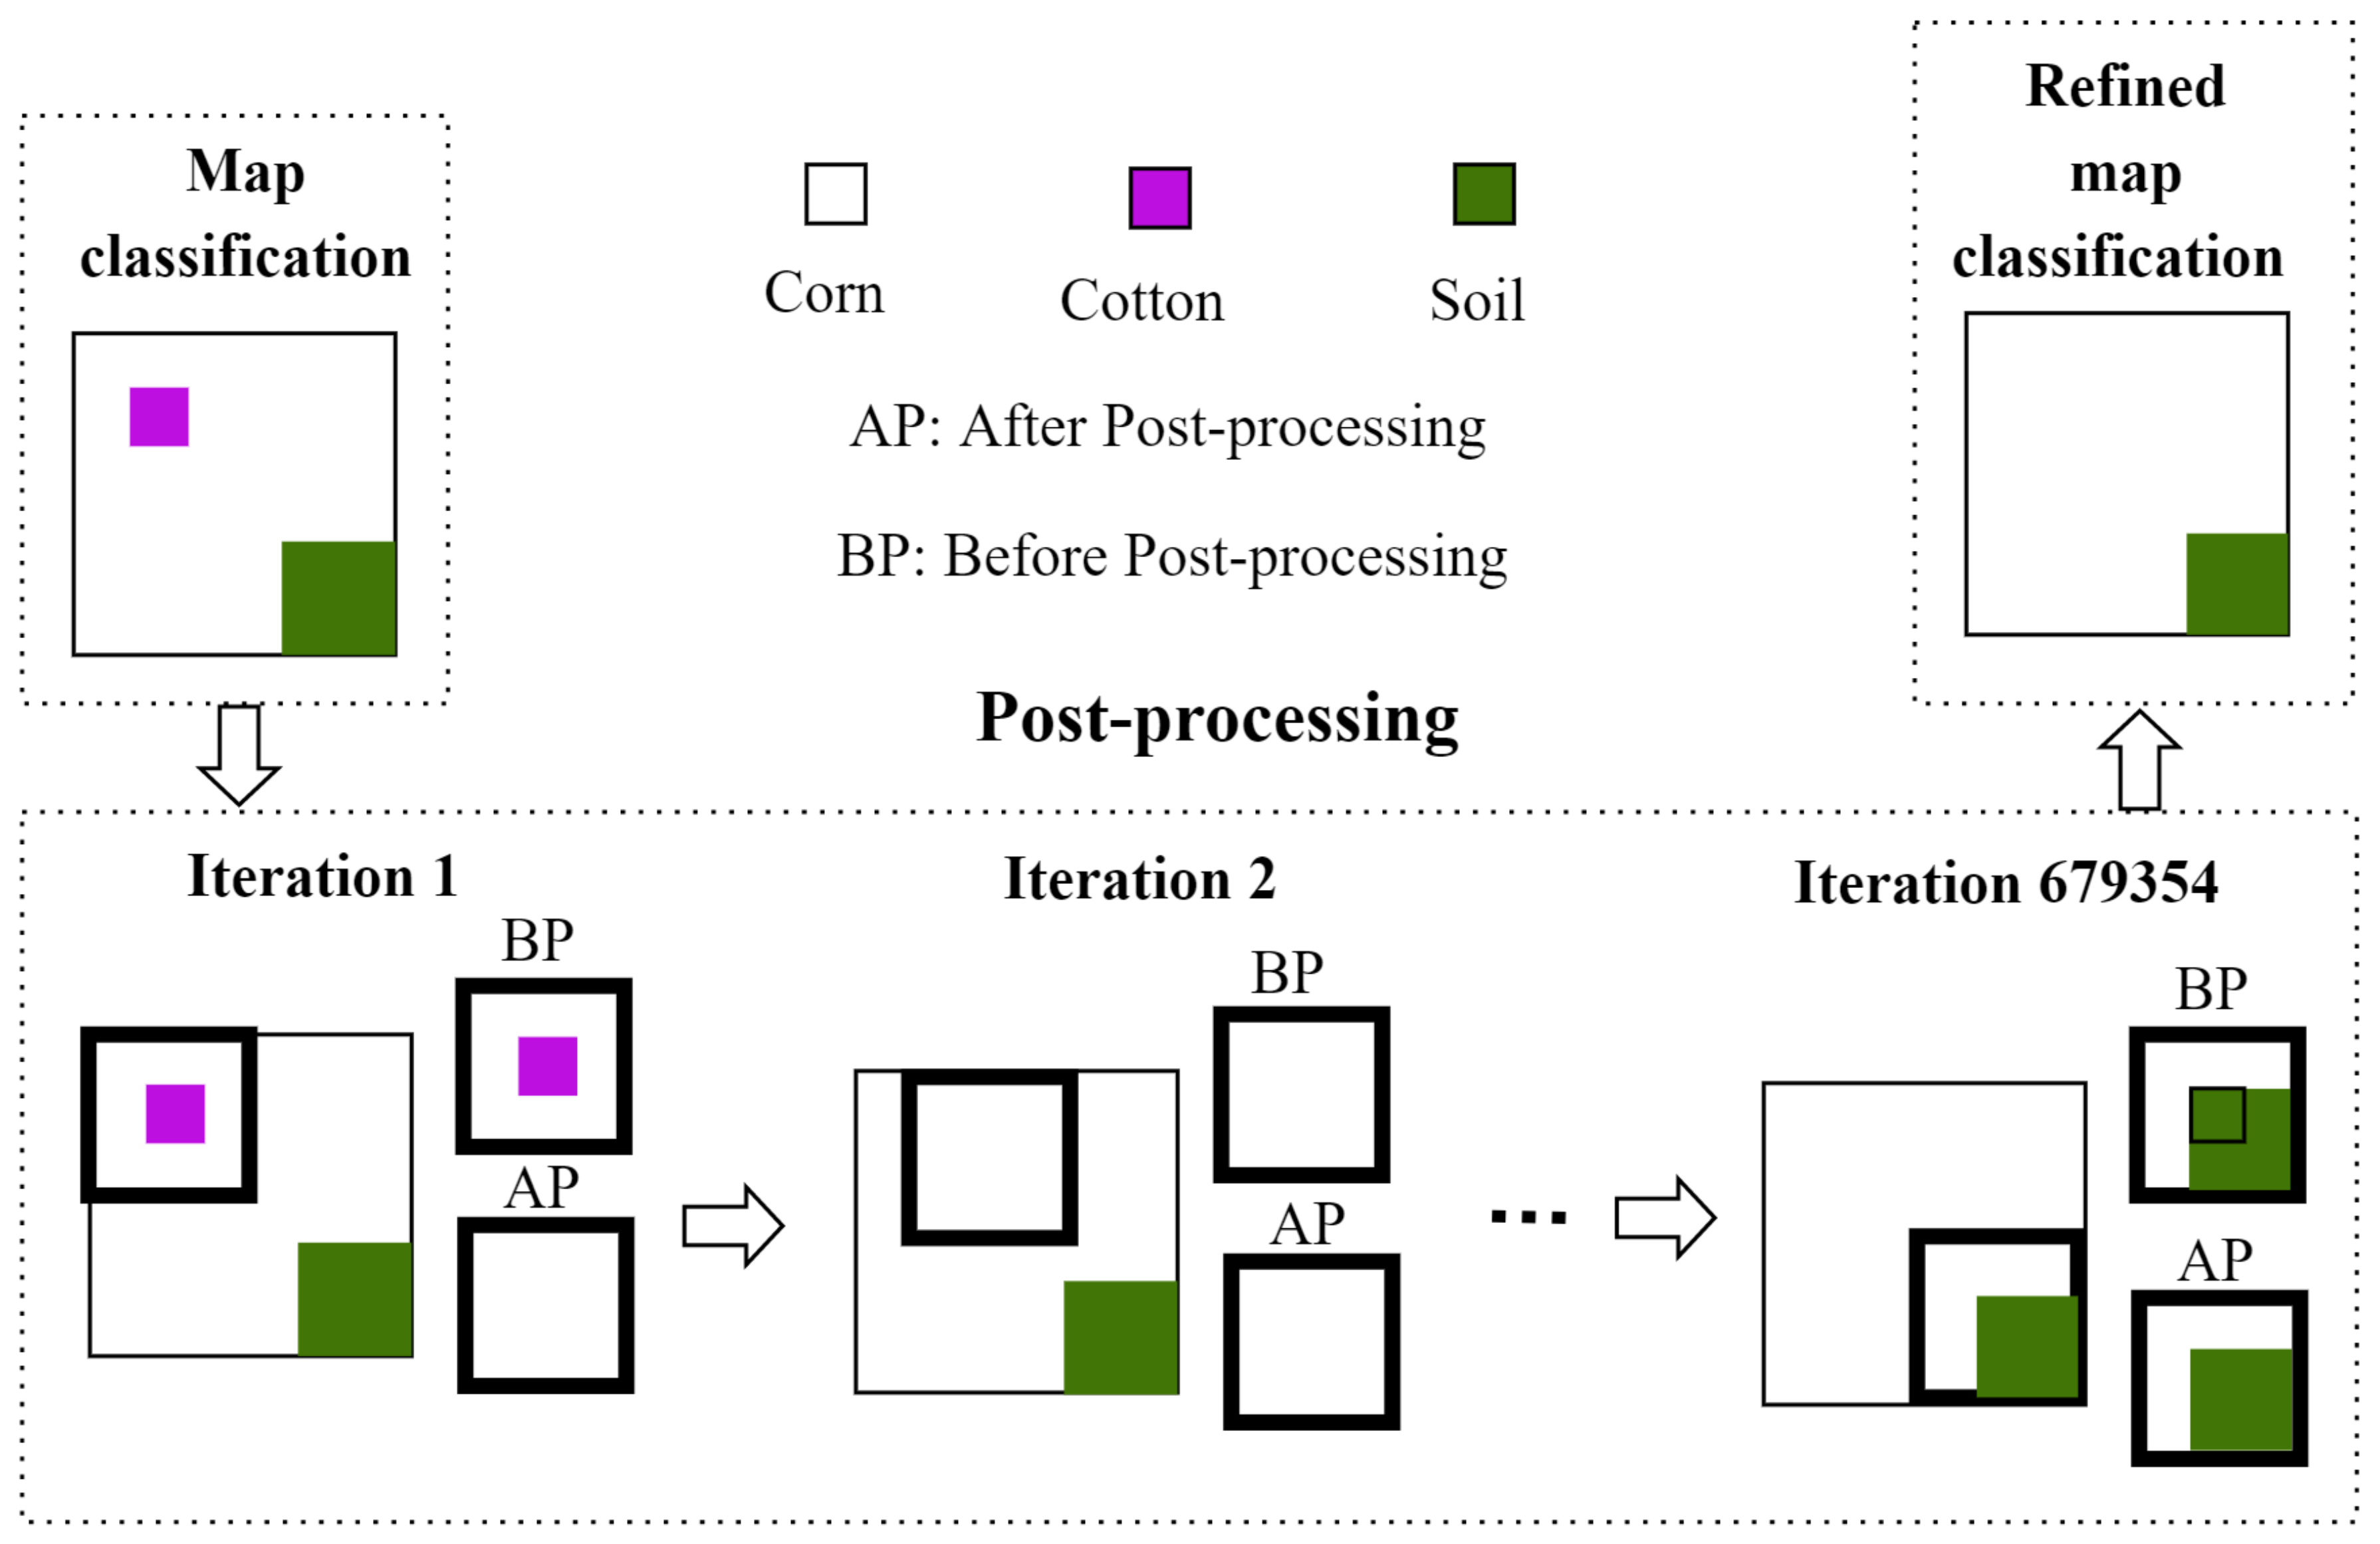
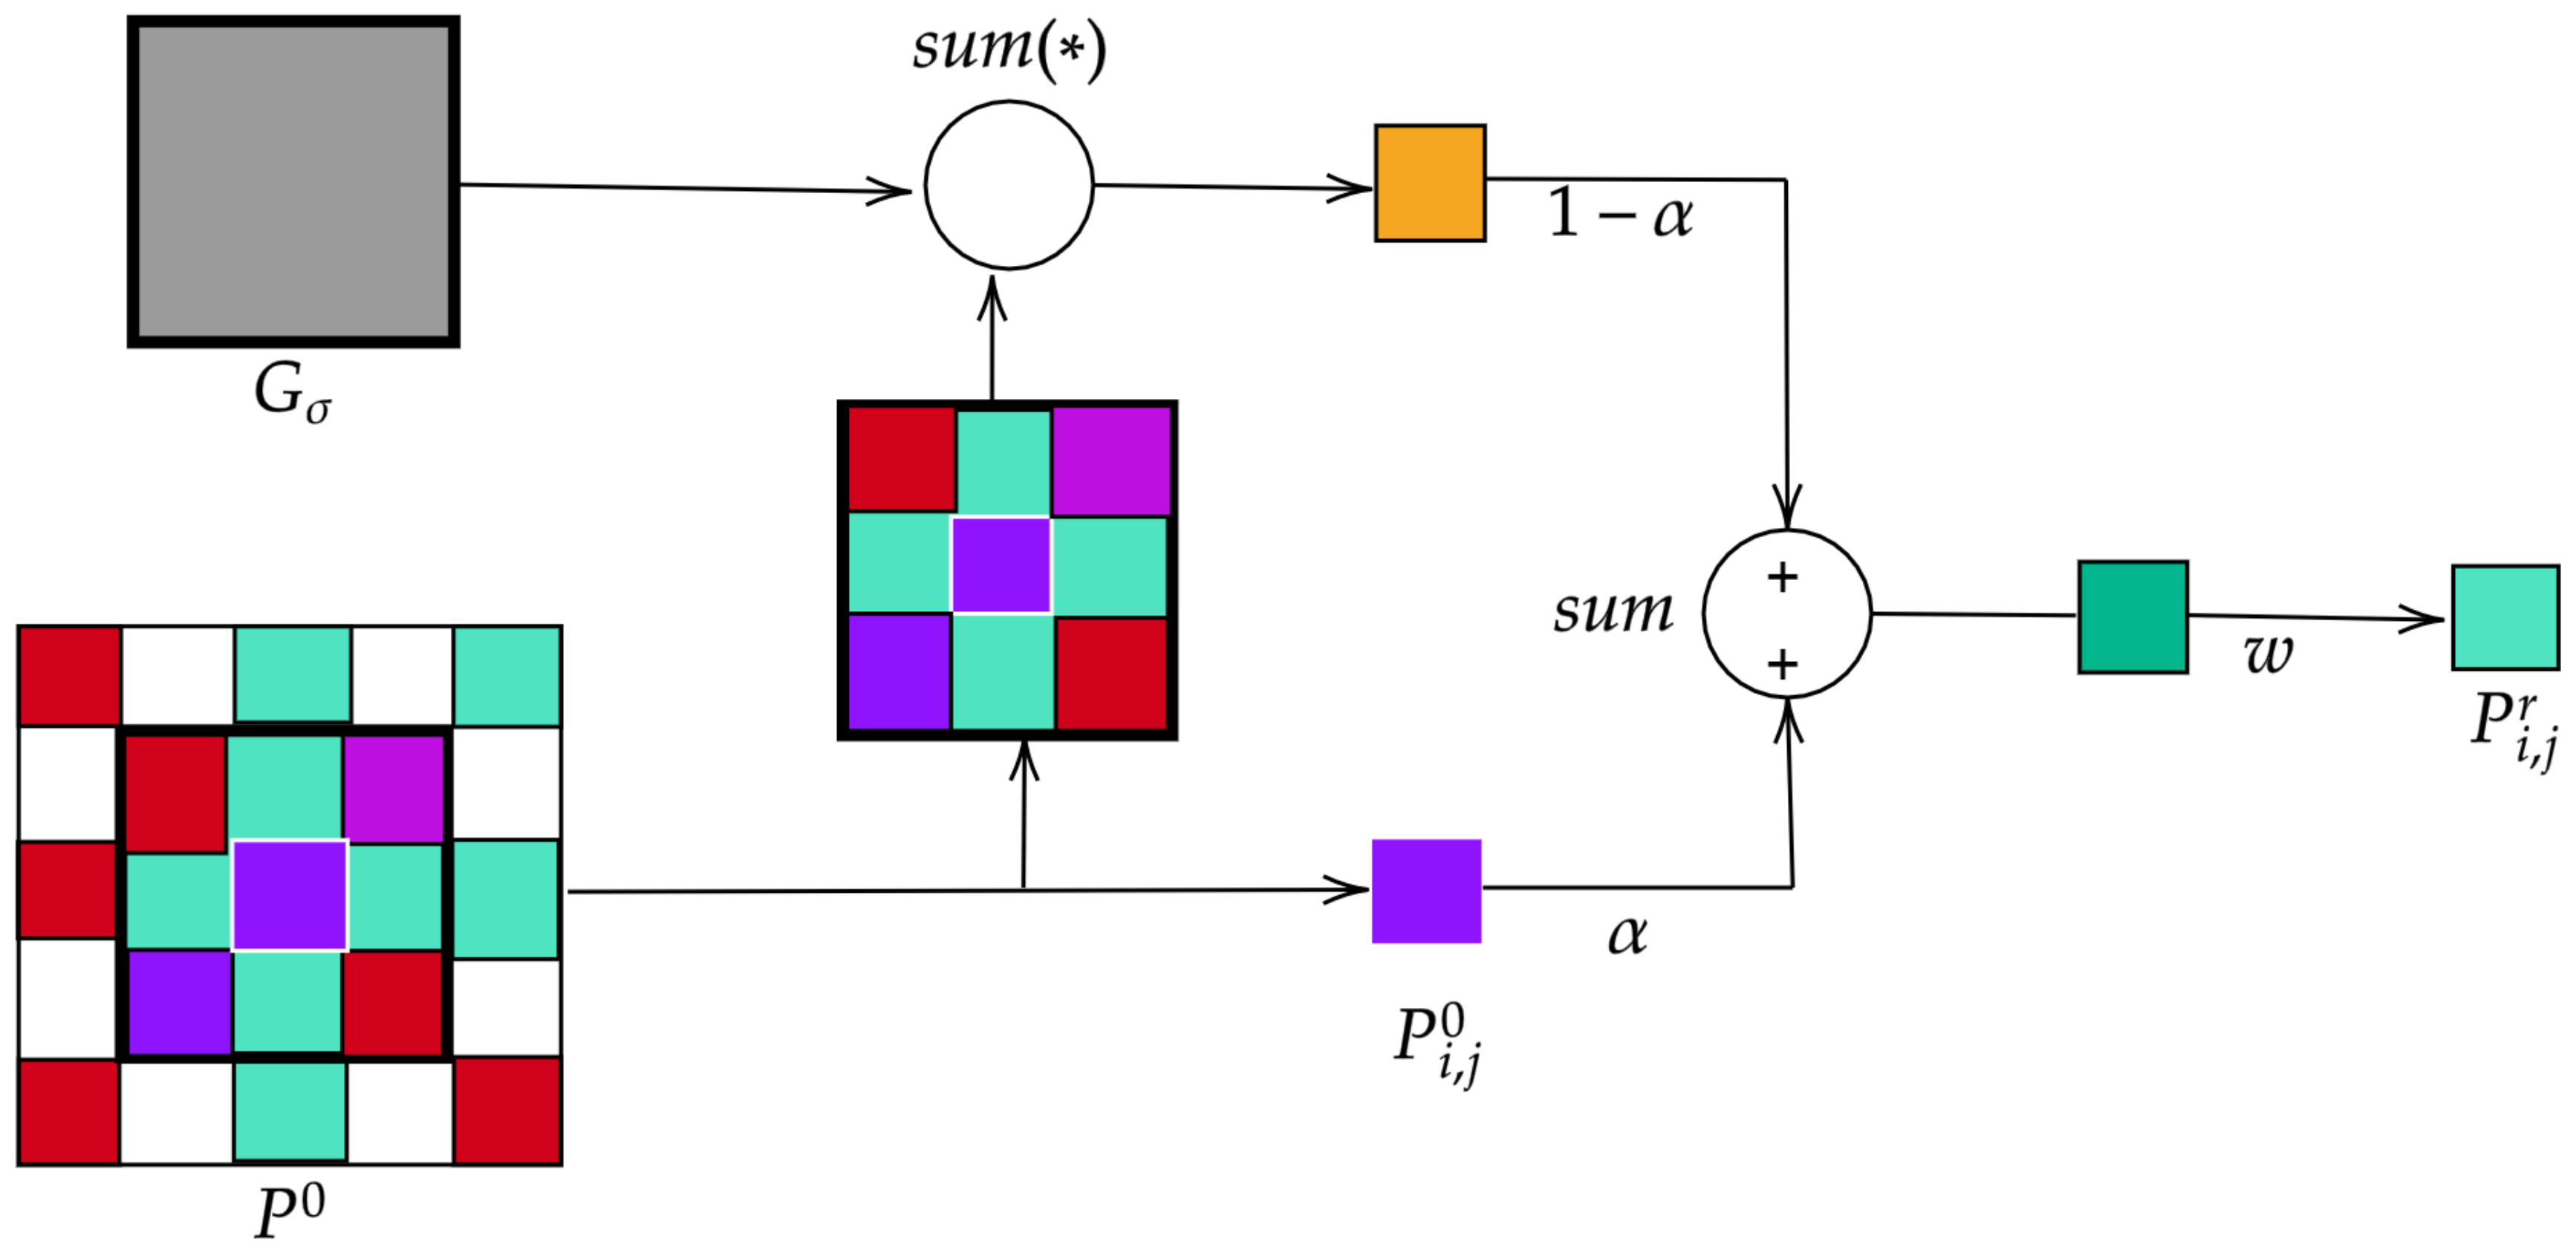
As for the post-processing stage, it can be said that it consists in refining the annotations obtained by the 2D-CNN by eliminating discontinuities and misclassified pixels through morphological operators. This post-processing becomes crucial as it makes the the methodology more robust to lower-spatial-resolution images and therefore improves the classification rate.
The experimental framework used in this research is designed by following those developed in similar works [
30,
31]. Two sequences of the Campo Verde database are considered: 1. from October 2015 to February 2016; and 2. from March to July 2016. The proposed methodology achieves a
score of
, which is higher than the previous results reported in the literature [
20,
30,
31,
32,
33,
34]. Indeed, a competitive rise of the classification rate in contrast to benchmark-and-recent works conducting experiments on the same dataset was accomplished. This performance is attributed to the exhaustive search of parameters across all the stages of the proposed methodology (namely, the selection of patches size, and setting of the number of filters for the CNN). For comparison purposes, the ability of an RNN architecture alone to classify patches as a whole while maintaining low computational complexity is also explored. Additionally, a biological technique (iterative label refinement) is also evaluated to make comparisons with the proposed post-processing.
This paper is structured as follows:
Section 2 presents a brief review of state-of-the-art related works. The database and the methods of the proposed methodology’s building blocks are described in
Section 3.
Section 4 describes the experiments carried out over the Campo Verde database.
Section 5 presents the results and discussion across the experiments. Some additional results of evaluating the proposed methodology over urban-materials-related images (Pavia scenes) are presented in
Section 6. Finally,
Section 7 gathers the concluding remarks.
2. Related Works
Satellite and aerial images have been classified with several techniques, including ML and DL methods for different purposes. A recent survey about different techniques used in remote sensing [
17] reports that DL architectures is one of the most used techniques for farming applications. Therefore, remarkable studies on crop classification from images have been devoted to this kind of technique. The authors in [
35] carried out a study on remotely sensed time series in California in order to classify 13 summer crop categories. The authors compared traditional methods such as random forest and support vector machine (SVM) with two DL architectures: a long short-term memory (LSTM) and a 1D-CNN, demonstrating that the 1D-CNN architecture reaches the best results (an accuracy around 85.54%) among all DL and non-deep learning models. Similarly, Ref. [
36] is devoted to classify 14 types of crops in Sentinel images along 254 hectares of land in Denmark. It used a DL architecture inspired by the results from the combination of two networks, a fully connected network (FCN) and an RNN. The latter architecture was also used by [
37] for classifying crops in Sentinel images of France; the classified crops are rice, sunflower, lawn, irrigated grassland, durum wheat, alfalfa, tomato, melon, clover, swamps, and vineyard. The proposed approach is compared against traditional methods such as the
k-nearest neighbor (
k-NN) and SVM, exhibiting better results when using the DL approach.
The work carried out in [
38] classifies 22 different crops of aerial images using a CNN with local histograms. The method extracts information related with texture patterns and color distribution to achieve scores of 90%. The study in [
18] combines a CNN and an RNN in a pixel-based approach to classify 15 types of crops on multi-temporal Sentinel-2 imagery of Italy. The DL method was compared with ML methods including SVM and RF. The best accuracy values were reached by the R-CNN approach with a value of 96.5%. A novel classification technique is proposed in [
19], which applies transfer learning (TL) to solve the problem related to imbalanced databases. It was tested on a crop database with the aim of recognizing pests. Furthermore, this research compares various CNN architectures and achieves an accuracy over 95%. Another work [
39] uses an RNN-based approach to classify SAR data from China.
More specialized studies have explored the benefit of using 3D-CNNs in spatio-temporal remote sensing images. For instance, in [
25], a new paradigm for crop identification area by using 3D-CNNs is introduced to incorporate the dynamics of crop growth. Likewise, the research presented in [
26] used a 3D-CNN to classify four scenes where urban areas as well as crops (including lettuce and corn) could be found. The proposed 3D-CNN together with a principal component analysis (PCA) stage (applied to extract the most important information from the images) achieves an overall accuracy above 95%. Another 3D-CNN model for cloud classification was explored in [
27], which was tested over two databases (GF-1 WFV validation data and ZY-3 validation data). Such a model reaches an accuracy of 97.27%. The work developed in [
40] classifies a tree database of Finland. There are 4142 trees clustered into three classes (pine, spruce and birch). The classification stage was carried out with four convolutional layers and three max pooling layers, accomplishing an accuracy of approximately 94%. A very recent work in the field of hyperspectral image analysis using 3D-CNN [
41], similarly to [
40], mainly aimed to classifying trees from a Finnish database. It compared both DL and ML methods, and experimentally demonstrated that 3D-CNN yields the best results (above 91% of accuracy). A 3D-CNN is also successfully used to classify soybean and grass from the MODIS data of USA [
42]. The preliminary results of a 3D-CNN classification model of cotton and corn crops from the Sentinel data of Turkey are outlined in [
43].
A worth-reviewing paper overviewing of applications and advances of DL in agriculture in detail and information on key aspects (such as databases, and typical crop classification problems, among others) is presented in [
5]. Another work of great interest is that reported in [
44], which outlines CNNs and their applications in different fields.
Regarding the use of the Campo Verde database for crop classification purposes, the following works are worth making note of. The Campo Verde database was introduced in [
30], with the intention to outline the problems related to the farming field for educational purposes. It is documented and manually annotated. [
30] also depicted an experiment with a random forest classifier. The study in [
31] evaluates a CNN and a FCN obtaining greater efficiency when using the latter architecture. For experiments, two sequences consisting of an image stacking were evaluated: the first sequence corresponding to the period from October 2015 to February 2016, and the second sequence from March to July 2016. As a conclusion, the FCN is proven to be a better solution outperforming the baseline in terms of processing time in the inference phase. Another similar technique was proposed in [
20], which uses CNN- and RNN-based architectures. This study reported higher results for the RNN since the CNN is fed with the co-occurrence matrix features rather than extracting their own features. A classification approach of tropical crops is presented in [
32], which followed a method that compares auto-encoders, CNNs, and FCNs networks in terms of segmentation performance over Sentinel images of Campo Verde. As a result, it was observed that the accuracy was better when using DL techniques (specifically, CNN), rather than the other considered methods—indeed, the CNN-based approach showed a more stable behavior. The research presented in [
33,
34] apply DL techniques to classify not only Campo Verde but also Luis Eduardo database [
45] (another agriculture database from Brazil). Both works use approaches based on an FCN and similar parameters including a
patch size and assess the methodology over individual images and sequences composed by several images. It is worth mentioning that [
34] adds an LSTM structure to the methodology, which allows learning from multi-temporal data. The incorporation of such LSTM yielded a remarkable increase in the overall performance, highlighting then the importance of the temporal information for crop recognition.
At this extent, it is worth noticing that most of the previously mentioned works were traditionally tested only on Sentinel images of Campo Verde (not the Landsat images) for crop classification tasks since Landsat images are covered by clouds. Furthermore, studies have accomplished a
score not over 75%. Likewise, in [
46], it is highlighted that the classification of heterogeneous crops is still a challenging open issue as there exists a diverse and complex range of spectral profiles of crops, as it is the case of Campo Verde.
5. Results and Discussion
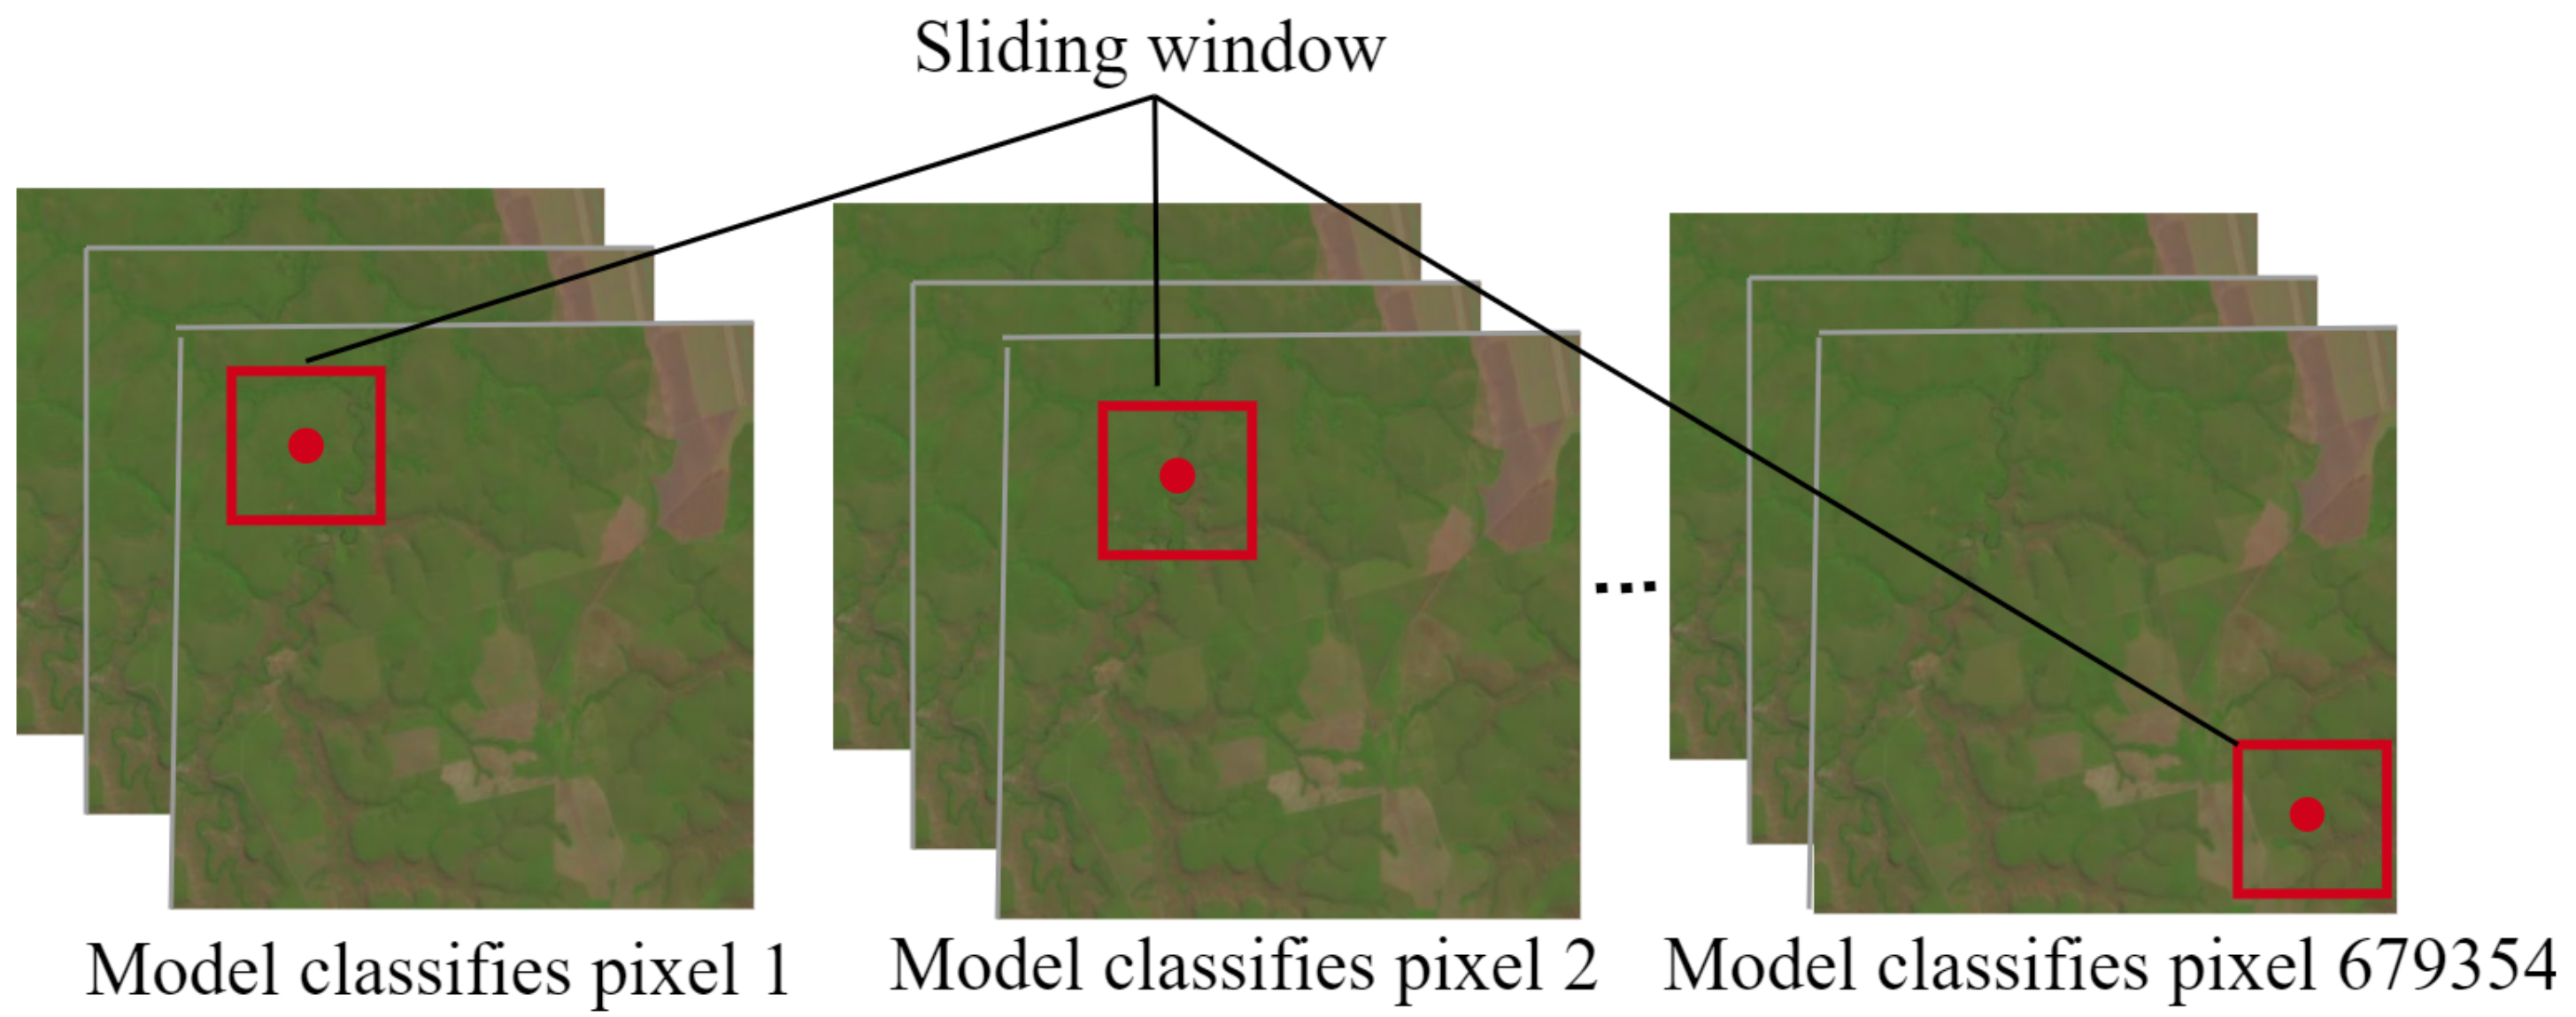
This section reports three sets of experiments derived from the scheme shown in
Figure 3, which examine the impact of the introduced DL architectures and the post-processing phase on the overall performance of the proposed methodology to accurately classify pixels from satellite images in a sliding window fashion.
5.1. Comparison between Results of DL Architectures
The proposed 2D-CNNs and RNN architectures are compared to determine their ability to correctly classify image patches.
Table 4 reports
,
, and
achieved by each architecture.
It can be observed that 2D-CNN 1, characterized by three consecutive convolutional layers, leads to higher evaluated architectures. However, it is worth noting that the achieved score for sequences 1 and 2 is only 2.54% and 0.38%, higher than that reached by 2D-CNN 2, respectively. This is explained since it down-sample features once before applying fully connected layers resulting in a model with the presence of a greater quantity of features that allow to classify crops correctly.
These results also indicate that convolutional layers followed by a pooling layer in 2D-CNN 2 might down-sample useful features for purposes of this work. Furthermore, the remarkable accuracy, higher than 12%, achieved by 2D-CNN 1, and 2 over RNN architecture was also observed. The average achieved by the CNN in sequence 1, for example, is strongly higher than the value achieved for the RNN.
Also it is demonstrated that the features obtained by the convolutions applied over the images allow to obtain higher accuracy than the spectral signature features used by the RNN. Since 2D-CNN 1 will ensure a significantly high , , and , it has been chosen as the best trade-off for the proposed methodology and used in the map classification phase.
5.2. Comparison between the Results of Post-Processing Techniques
To explore the advantage of adding the post-processing phase, this work evaluates two post-processing techniques named: post-processing based on morphological operations (PMO) and post-processing based on iterative label refinement (PILR). By taking average of all
,
, and
metrics in
Table 5.
It can be seen that PMO reaches the highest accuracy scores, and just 0.04%, 0.02%, and 0.05% higher than , , and , respectively achieved by the proposed methodology before post-processing (proposed methodology - BP) for sequence 1. However, for sequence 2, PMO is just 0.25%, −0.3%, and 0.66% higher than , , and , respectively.
On one hand, obtained results demonstrate that the PMO technique slightly improves the overall results achieved by PILR technique. This behavior may be attributed to the distribution of data in the database since the PILR technique removes some minority classes and misclassified them with the class containing the majority samples.
On the other hand, the filter size used in PMO is suitable for the images analyzed because it is small, and consequently, significant information is not removed by the technique.
Thus, although PILR has been demonstrated to be stronger in other works [
56], the PMO technique is established in the proposed methodology as a suitable post-processing technique for crop classification. Results for the proposed methodology-BP are also reported in
Table 5.
5.3. Comparison with the State-of-the-Art
Table 6 collects the metric values achieved by all evaluated approaches. The DL approaches described in [
20,
31,
32,
33,
34] and random forest classifiers [
30] are selected for purposes of comparison. They have been chosen not only because they are among the most efficient ML approaches in literature, but also because of their similarity to the proposed work, as they perform their crop classification on Campo Verde database.
In addition, for the selected approaches, some parameters, such as the patch size, depth, and filter size must be carefully set to guarantee the best accuracy to be achieved for a given application.
Table 7 collects computational complexities data where the number of
operations is computed for compared DL models where the architecture details are provided.
From
Table 6, it can be seen that the proposed methodology with post-processing reaches the highest scores in almost all metrics for image sequences 1 and 2. The closest competitor from the state-of-the-art is represented by the FCNN approach reported in [
34] with an
≈ 3.31% higher for image sequence 1 and ≈ 2.98% lower for image sequence 2. However, the nice property of the proposed methodology is that, when it did not win, its
achieved is very close to the highest one.
The major advantage of the proposed methodology over state-of-the-art approaches is the improvement in terms of classification accuracy. This slight improvement is attributed to the post-processing phase and the exhaustive parameter research carried out during the experiments.
From
Table 7, it can be observed that the models with a higher number of
operations (often deeper models), do not always lead to higher accuracy scores as a proper parameter setting per model is required. For instance, FCNN [
34] though being among the most complex models for sequence 2, showed a relatively low
score. On the contrary, in addition to involving the lowest number of
operations, the proposed 2D-CNN 1 achieves an
score higher than most of the compared DL models.
As it is well known, the CNN depth has a fundamental impact on the overall classification, as well as on the computational resources required for training and deployment purposes. However, the proposed methodology is based on consecutive convolutional layers with a significant reduction in depth regarding the other architectures. For example, in [
34] an LSTM and an FCNN are used at the same time to classify Campo Verde, and in [
31], 100 filters are used in the convolutional layers. In
Table 7, the complexity of the 2D-CNN 1 is compared with the most outstanding architectures used by the works mentioned in
Table 6.
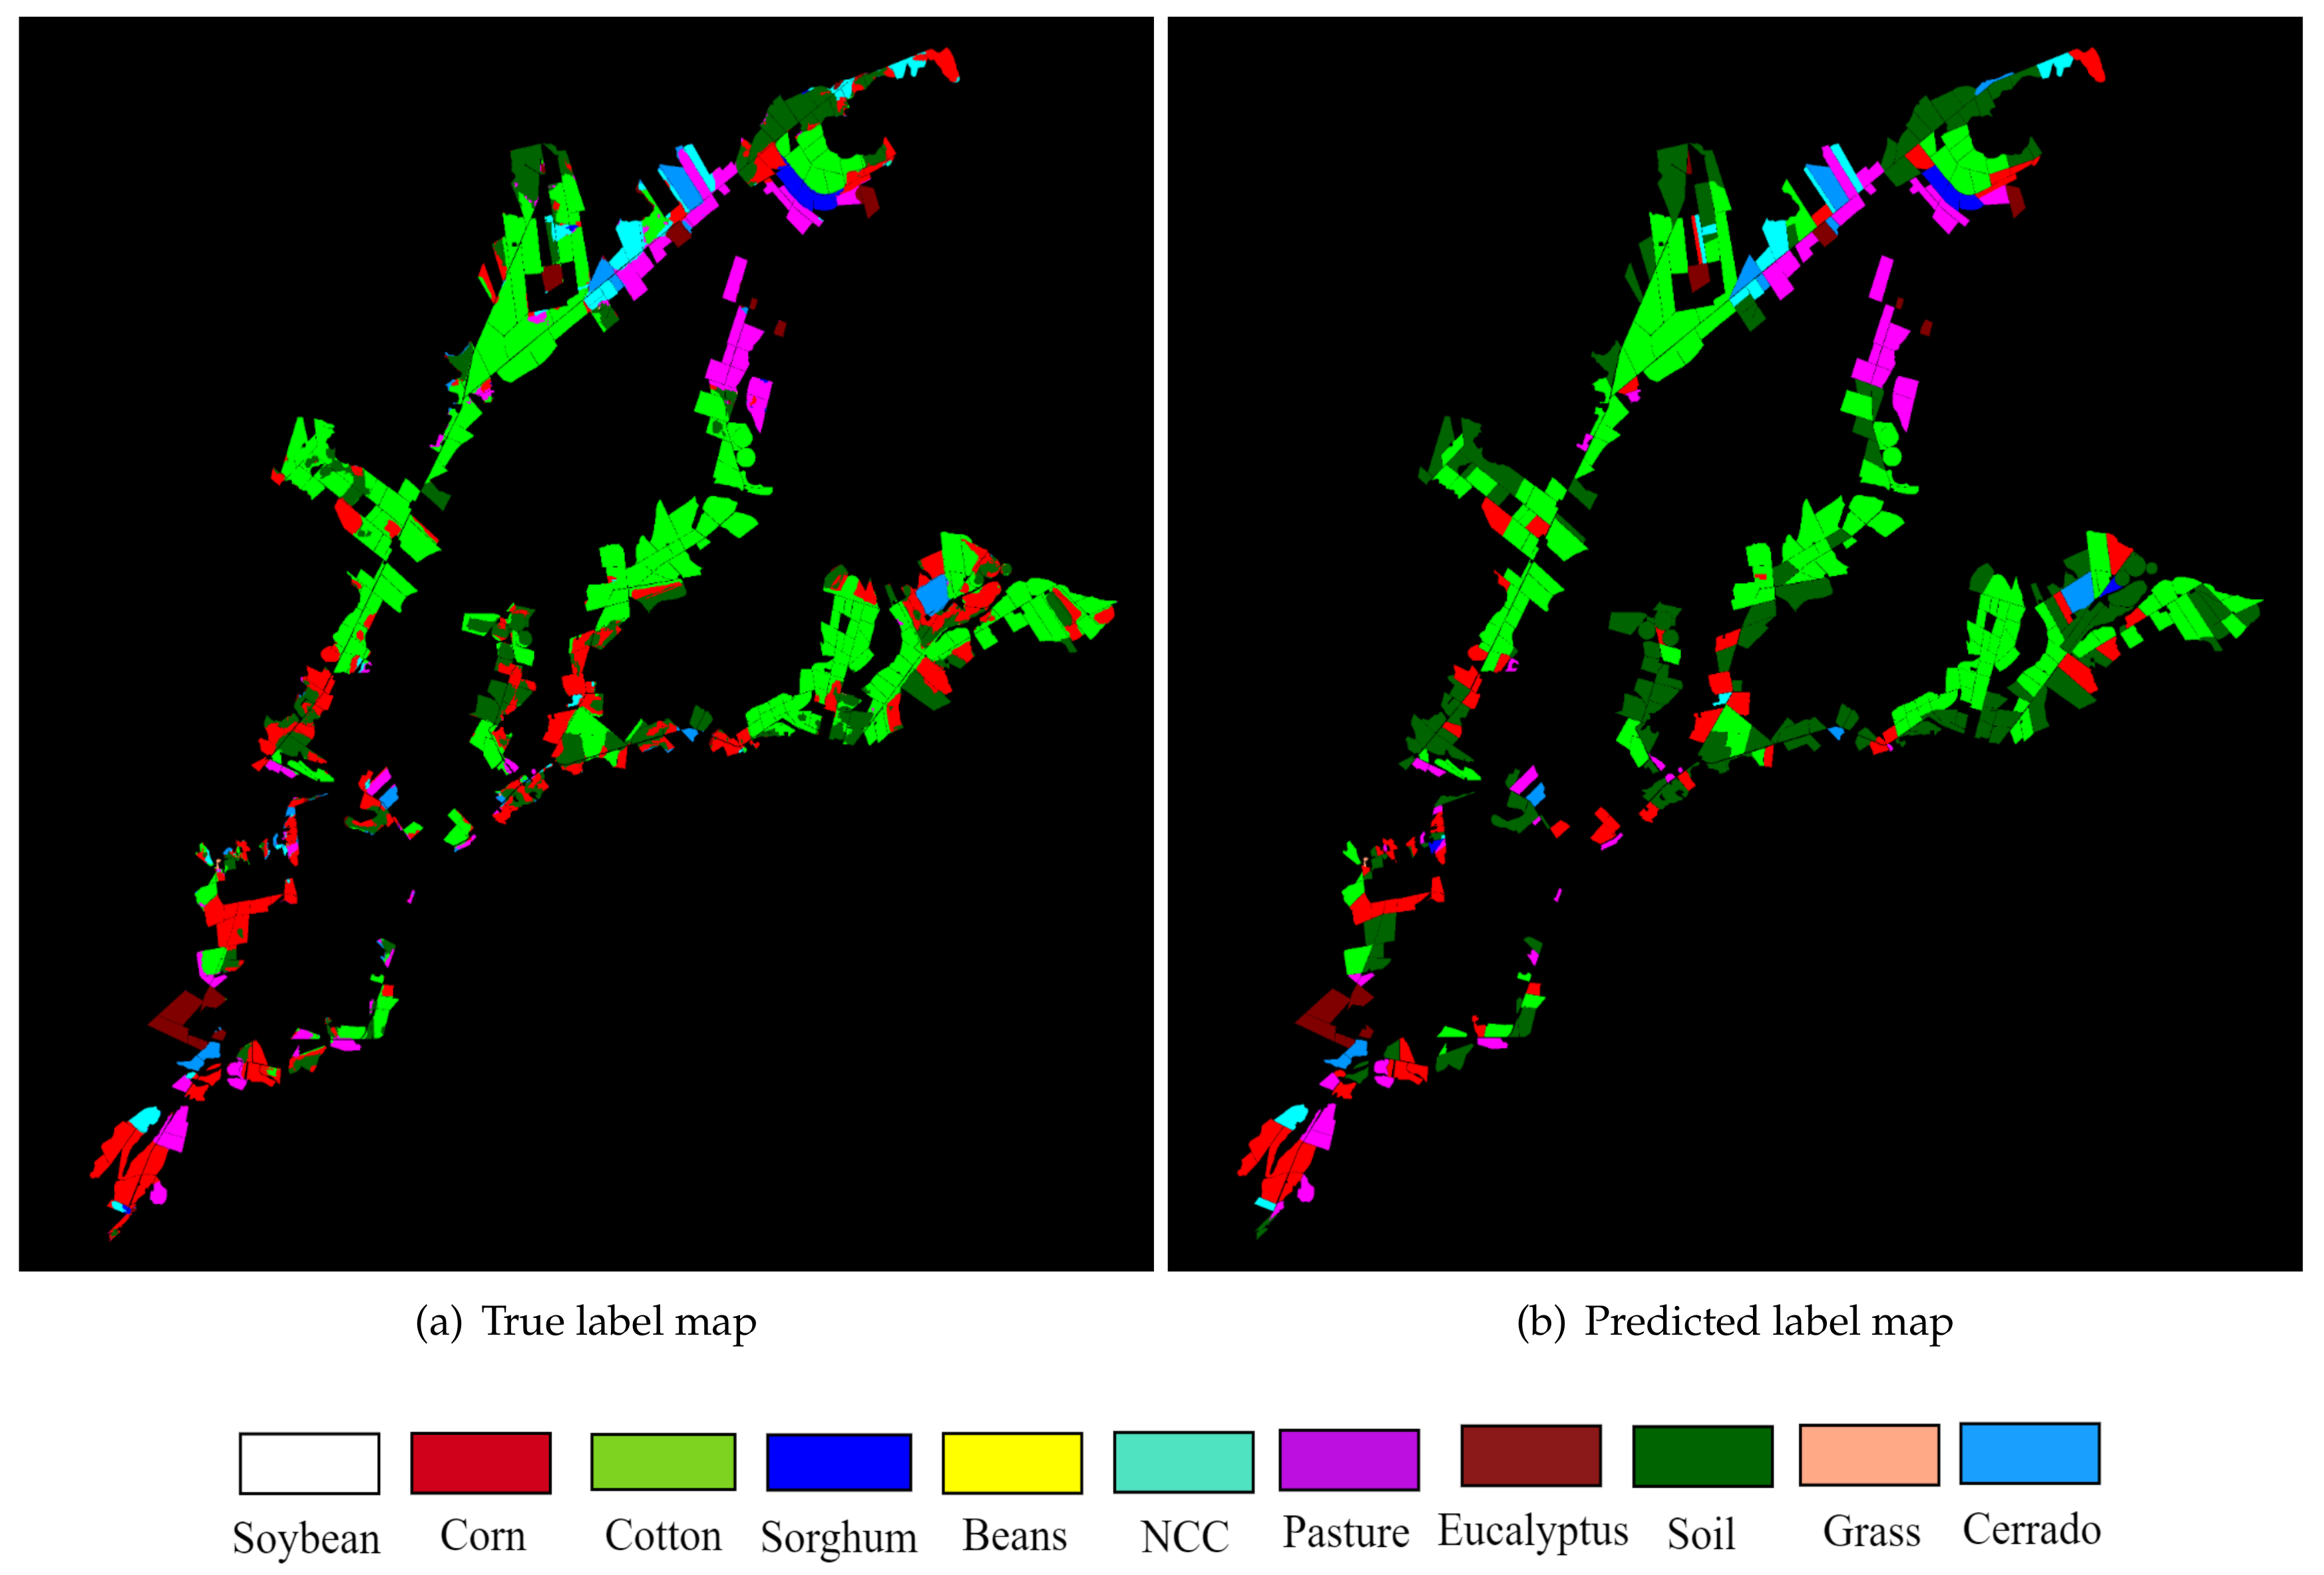
5.4. Classification Map
Finally,
Figure 10 depicts the image sequence 2 classes map obtained with the proposed methodology using 2D-CNN 1 and PMO.
Figure 10a describes the true label map and
Figure 10b depicts the predicted label map. Graphically, it was observed how some classes were misclassified; for instance, in some regions, cotton was labeled as corn. However, comparing the label maps, it was observed that a good soil classification is achieved.
6. Additional Results: Evaluating Proposed Methodology on Urban Material Classification
To experimentally demonstrate the ability of the proposed methodology to classify images from other domains, some additional experiments were carried out on the Pavia scenes database, which was intended for urban material recognition.
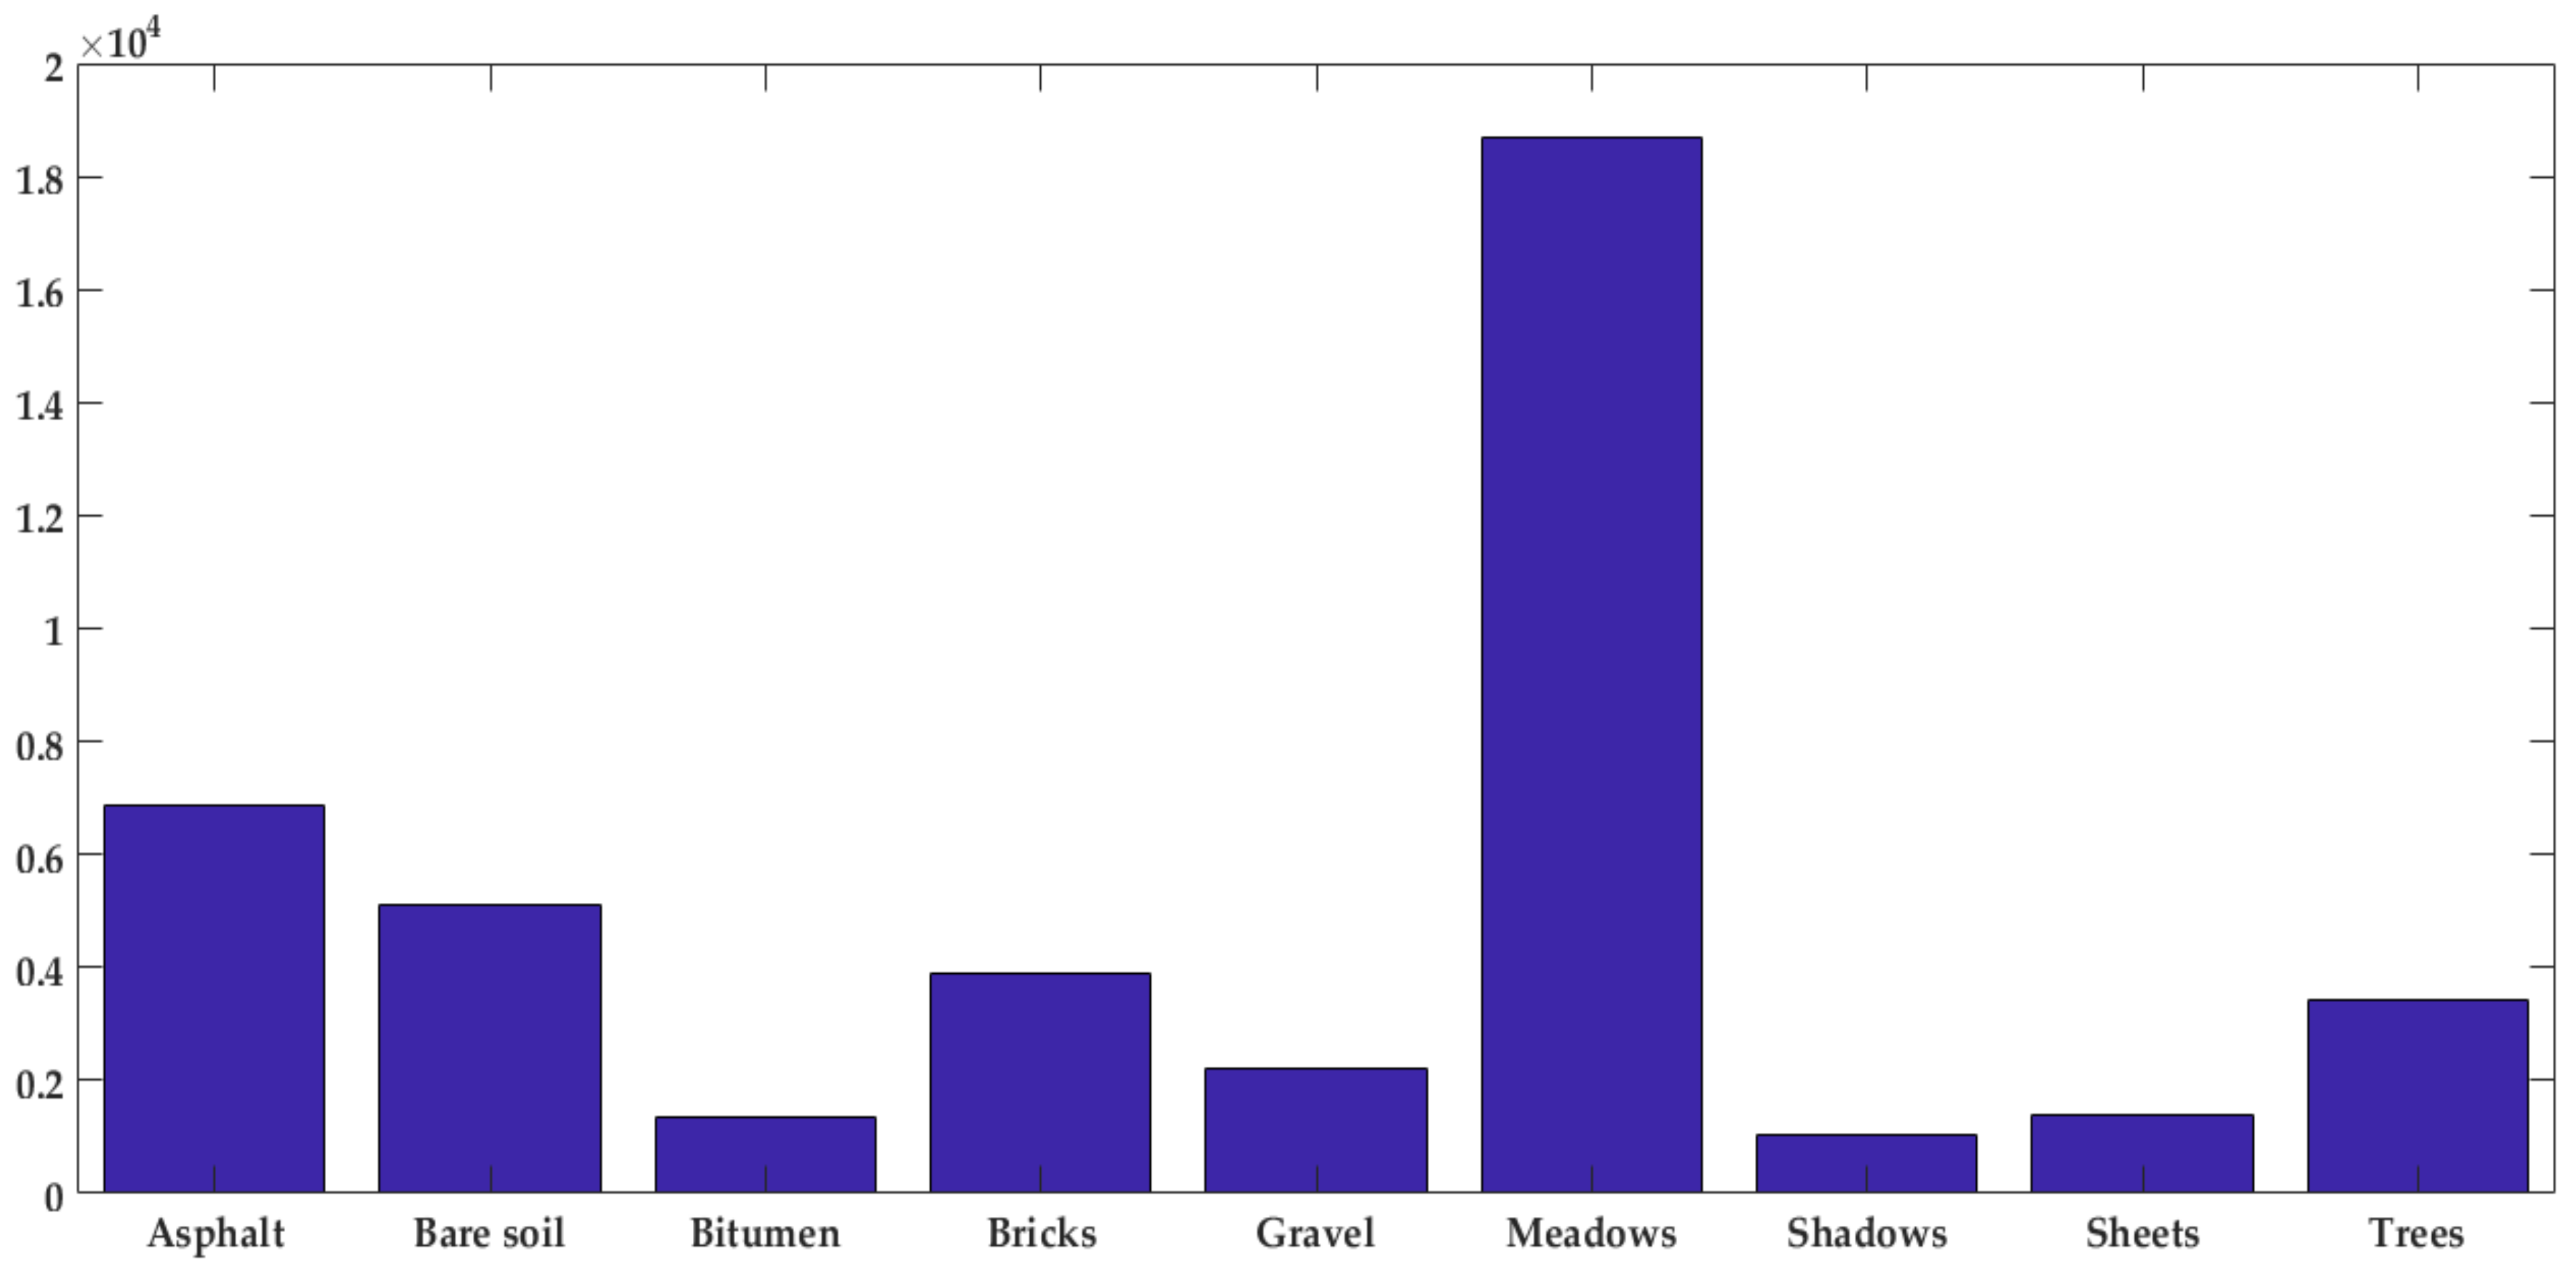
One of its samples is an image acquired by the ROSIS sensor over Pavia University, northern Italy, which has 103 spectral bands, and a size of pixels. Its geometric resolution is 1.3 m, and it is labeled into nine classes (asphalt, meadows, gravel, trees, metal sheets, bare soil, bitumen, bricks, and shadows).
The number of samples for each class is depicted in
Figure 11. It was observed that there are more samples labeled as “meadows” while there is just a few numbers of other samples such as shadows and bitumen. Therefore, Pavia scenes classification is a highly imbalanced database.
6.1. Experimental Setup for Pavia Database
Since the Pavia database contains smaller images, a patch size of was used to classify the Pavia database. It guarantees that each patch has a minimum of 241 pixels of the same class. The analyzed pixel is located at location .
The number of patches used for each class is 200, yielding a total number of 1.8K patches. The extracted patches are split into subsets using 90% of the data for training, and 10% of them for validation.
The testing is carried out using the remaining data, i.e., 42,122 pixels from the image (as seen in
Table 8).
6.2. Comparison with the State-of-the-Art
Table 9 summarizes the results obtained by the proposed methodology applied to Pavia database which are compared to recent research to classify Pavia database.
It can be seen that the proposed methodology reaches higher
than [
60] while keeping a comparable
.
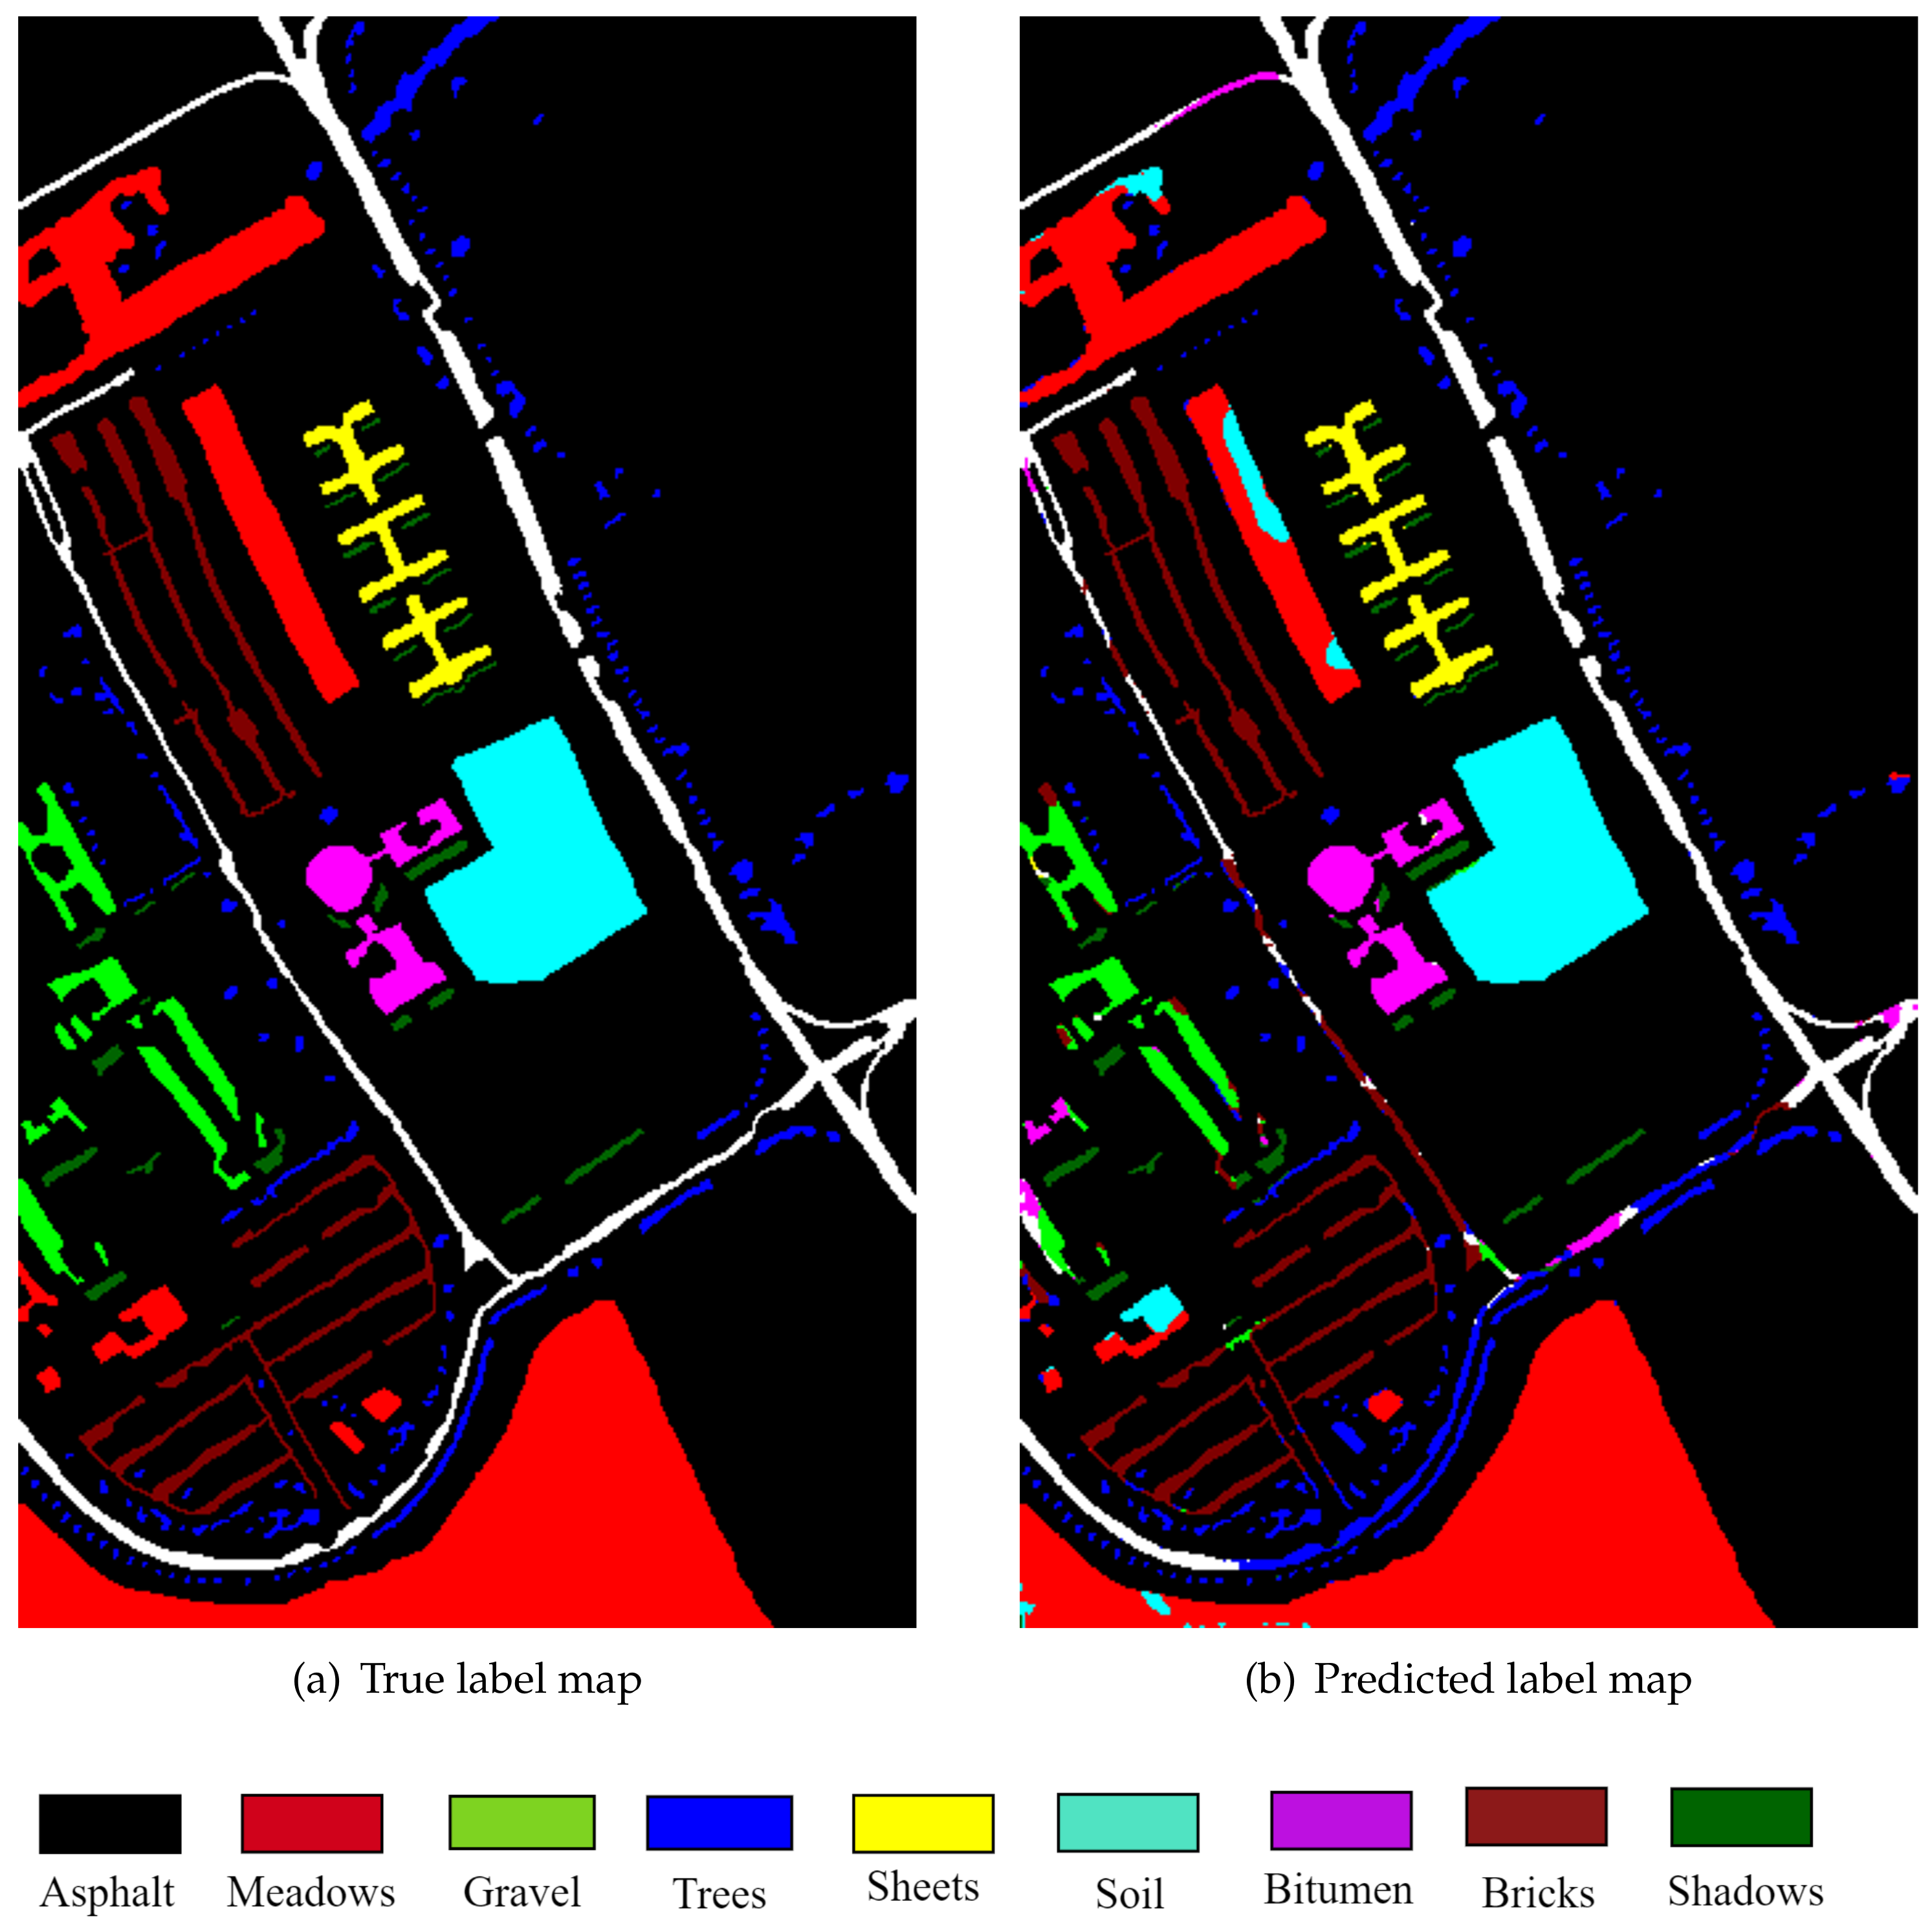
6.3. Classification Map
Finally,
Figure 12 depicts the class map for the Pavia image obtained by the proposed methodology (2D-CNN 1 after post-processing).


 and
and 


