Abstract
Military bases perform important national security missions. In order to perform these missions, specific electrical energy loads must have continuous, uninterrupted power even during terrorist attacks, adversary action, natural disasters, and other threats of specific interest to the military. While many global military bases have established microgrids that can maintain base operations and power critical loads during grid disconnect events where outside power is unavailable, many potential threats can cause microgrids to fail and shed critical loads. Nanogrids are of specific interest because they have the potential to protect individual critical loads in the event of microgrid failure. We present a systems engineering methodology that analyzes potential nanogrid configurations to understand which configurations may improve energy resilience and by how much for critical loads from a national security perspective. This then allows targeted deployment of nanogrids within existing microgrid infrastructures. A case study of a small military base with an existing microgrid is presented to demonstrate the potential of the methodology to help base energy managers understand which options are preferable and justify implementing nanogrids to improve energy resilience.
1. Introduction
Many militaries such as the United States Department of Defense (DOD) and the US Navy (USN) heavily rely on uninterrupted electrical power to execute national security missions. With approximately 800 DOD military installations around the world, the supply of electricity is paramount in order to maintain operations [1]. The supply of power to loads that support national security missions (critical loads) must be maintained [2]. In the civilian sector, uninterrupted power is important for human safety and survival in extreme weather conditions, and losing power in other conditions can have significant economic impacts (e.g., losing in-process product, losing production over the duration of the outage, production re-start costs, etc.).
Recent events have exemplified the need for a more localized energy generation and storage system to reduce vulnerabilities such as centralized generators failing due to extreme cold weather or transmission lines going offline due to wildfires. For instance, in February 2021 the state of Texas experienced a near catastrophic failure to its power grid due to severe cold weather. Rolling blackouts issued by the Electric Reliability Counsel of Texas (ERCOT) was deemed vital to prevent a worst case scenario from occurring where “demand for power overwhelms the supply of power generation available on the grid, causing equipment to catch fire, substations to blow, power lines to go down” [3]. California has seen public safety power shutoffs to millions of electrical customers in recent years due to fire weather events where transmission lines can be turned off in order to prevent potential wildfires [4].
Already, many DOD and Department of the Navy (DoN) bases, and other global military bases have microgrids to allow for base-level generation, storage, and consumption of energy during events that cause a base to be disconnected from the larger grid which improves base energy resilience [2]. However, events that occur within a base perimeter (e.g., airplane crash, adversary action, stored munitions explosion, fire, etc.) can disrupt, disable, or destroy a base microgrid which can cause critical loads necessary to support national security missions to be un-served even when grid power is available [5]. One potential avenue to improve energy availability to critical loads on military bases is nanogrids where highly localized generation, storage, and consumption of electricity is implemented to allow for individual critical loads to continue to be served even when microgrids go down.
Efficiency, reliability, and resilience (sometimes called resiliency in certain DoN source documents) are the three pillars of energy security defined by DoN and Naval Facilities Engineering Command (NAVFAC) issuances [6]. The desire to increase energy security ushered in a new age of smart grid infrastructure for DOD installations and installations of other militaries with a focus on developing base microgrids. DOD installations ashore are defined as secure land locations where the maintaining and projecting of war-fighting strength is critical for executing national security missions to preserve the United States of America’s national defense [7]. Microgrids have been used in many DOD installations to improve resilience and reliability [8]. Resilience, defined by the NAVFAC as “the ability to respond, adapt, and recover from a disturbance” is the focal pillar of energy security for this research [6]. In general, DOD microgrids aim for either 7 or 14 days of grid independence where only local generation and storage resources can support critical loads [8]. However, current DOD and DoN guidance (including NAVFAC guidance) has not addressed potential disruptions occurring to microgrid infrastructure. In addition to the three pillars of energy security, DOD has mandated that 25% of all power used on bases be renewably generated by 2025 which is often achieved by some combination of solar and wind power [9].
Microgrids are considered one of the key building blocks of current and future ashore and military power infrastructure. Hallmarks of microgrids include local energy generation and storage resources that are connected to loads within a clear microgrid system boundary such as an installation perimeter [10]. Many military microgrids also have the ability to connect and disconnect from the larger grid as needed [10]. Nanogrids take the concept of local energy generation, storage, and consumption one step smaller by drawing the system boundary around only a few or even just one load and associated generation and storage equipment. Some nanogrid implementations (and of most interest to militaries) are connected to microgrids via one or more switches that allow a nanogrid to share its generation and storage capabilities with the larger microgrid during normal operations, and disconnect from the microgrid to preserve the ability to serve local loads during a microgrid disruption.
DoN and other navies have experience operating shipboard power systems that are similar in scope and goal to nanogrids in the form of zonal distribution systems that localize generation and consumption of power aboard a ship. One of the goals of zonal distribution is providing uninterrupted power to critical loads and/or zones in a ship so that the ship’s mission may continue even after a disruptive event (e.g., equipment failure, battle damage and compartment flooding, cyber-attacks, etc.) has occurred. The surface Navy has implemented zonal distribution systems where Direct Current (DC) zonal shipboard electrical systems are configured on ships with the sole purpose of ship survivability which is a similar concept to resilience in shore-side electrical systems. System survivability of zonal distribution focuses on detection and isolation of disturbances which is done by reconfiguration management [11]. Because of the success of zonal distribution, DoN and DOD are both interested in implementing the concept ashore using nanogrids.
Specific Contributions
This paper contributes a systems engineering method to analyze existing military installation (e.g., a DoN ashore installation, an Army base, etc.) microgrid infrastructure from the perspective of improving energy resilience for critical loads specifically using nanogrid technology. The method helps to elucidate potential benefits of targeted nanogrid deployments to critical loads at military installations which are important to national security. Additional benefits may be realized by implementing nanogrids such as improving installation energy independence among others.
2. Background and Related Research
This section provides background on several topics that are needed to understand the contribution of this paper. Further, related research is discussed and gaps are identified which this paper aims to fill.
2.1. Military Microgrids
Many military bases and other critical facilities have or are in the process of implementing microgrids, at least in part in an attempt to provide reliable energy to critical loads. Microgrids on many military bases generally perform six key functions for the attached critical loads including: (1) stepping down high voltage power received from the main utility grid to intermediate and/or low voltage, (2) distribute energy to critical and non-critical loads, and connect other electrical hardware, (3) generate energy locally (e.g., diesel gensets, Photovoltaic (PV) arrays, wind turbines, etc.), (4) store energy (e.g., battery banks, pump-storage hydro, etc.), (5) control the flow of energy, the generation, the storage, and the loads throughout the microgrid using one or more controllers to automatically operate electrical equipment, (6) step up and down voltage (transformers) and convert energy from AC to DC or vice versa (inverters and converters) [12,13]. The main components of a microgrid often include diesel generators and other fossil fuel generators; PV, wind turbines, and other renewable energy sources; energy storage systems such as battery banks; Points of Common Coupling (PCC) where the microgrid connects to the utility grid (generally with a switch to allow for operation of the microgrid while disconnected from the utility); one or more control systems (often involving Supervisory Control and Data Acquisition (SCADA) systems); and switches, converters, inverters, relays, transformers, power lines (above ground, underground, etc.), and other related hardware.
An established PCC and other requisite hardware (grid-forming generation and/or storage, generation, local controller(s), etc.) provides one of the primary benefits of microgrids for military bases and other critical facilities. The PCC provides the ability to disconnect from the main utility grid, called “island-mode” [14], and continue uninterrupted service of critical loads. In island-mode, loads critical to a military base’s primary mission functions (the critical loads) are still provided power from local generation and storage sources [14]. Issuances and instructions from organizations within militaries such as the NAVFAC generally state that in order for military bases to perform their missions, energy security of critical loads must be ensured regardless of the state of the grid beyond the PCC and outside of the microgrid system boundary [8]. One way of identifying critical loads in the United States military is the Mission Assurance and Continuity of Operations plan for DOD installations which instructs that the essential buildings needed to conduct national security missions based on criteria identified by the individual branches of the military (e.g, DoN, etc.) and the installation mission must continue to receive power even during utility disruptions (e.g., external power to a base is cut) [8].
Military microgrids have found several benefits in use including integrating smart grid technologies, reducing peak load and losses by enhancing integration of Distributed Energy Resources (DERs) (often including diesel gensets, wind turbines, micro hydro generation, fuel cells, PV, and other generation sources), localizing power quality and reliability for end-user satisfaction, and supporting the utility grid by managing sensitive loads and variability of DERs [10,15]. Currently military microgrids are allowing the interconnection of loads and DER that can replace duplicitive and expensive-to-maintain small Uninterrupted Power Supply (UPS) and stand-alone backup generators [10]. The flexible architecture of microgrids eases the employment of DER in conjunction with controllable loads and storage devices [15,16].
2.2. Nanogrids
Nanogrids are generally much smaller than microgrids. While an average military microgrid may serve several dozens or hundreds of loads and operate in the 5–500 megawatt range, nanogrids often serve on the order of one to five loads and a few kilowatts up to 5–10 megawatts. Nanogrids generally are technologically simpler than microgrids because they only serve a single building or a few loads [17]. The smaller, simpler design of nanogrids usually allows power production to occur much closer to the point of consumption versus grid infrastructure and even military microgrids which sometimes can encompass many hundreds of square kilometers of service territory. Generation occurring at the point of use significantly reduces the potential negative effects of transmission and distribution lines such as loss of efficiency, single point of failure, etc. [18]. Certain nanogrid configurations (discussed later) where the nanogrid is connected to a microgrid or grid via its own PCC can be very fault-tolerant where they are able to successfully transition to island-mode and continue serving critical loads until microgrid and/or grid power is restored. Many of the same benefits found with the implementation of military microgrids are expected to be realized with the deployment of nanogrids on military bases.
It is important to note common technical characteristics of nanogrids. Nanogrid voltage levels are often lower than microgrids and often are in the 100–500 volt range for both AC and DC nanogrids. Power generation and consumption is often much smaller in a nanogrid than a microgrid with ranges from 1 watt for the smallest nanogrids powering extremely small loads up to 1 megawatt; however, the upper limit can vary and is defined by the entity implementing the nanogrid [19]. Typical nanogrid loads are on the scale of a single appliance or computer up to a building [17]. Nanogrids can sometimes be used to improve electrical efficiency by 5–13% in some residential applications versus other options [19]. A common nanogrid system architecture uses DC because using DC can be more efficient due to many nanogrid power sources producing DC power and many storage systems (Energy Storage System (ESS)) using DC power which results in fewer inverters and converters [18,19]. However, while DC nanogrids can increase efficiency, they also come with the consequence of needing enhanced protection against short circuit line faults and ground faults [18]. The mitigation of faults is done with arching-type circuit breakers or more advance tactics that involve special mechanical circuit breakers that open against fault currents by forcing currents to zero by external means to extinguish arcs [20].
2.3. Energy Resilience
The focus of this paper is on improving energy resilience of military bases, and specifically for critical loads, through the implementation of nanogrids. In order to understand the amount of improvement in resilience a proposed nanogrid may have over existing microgrid infrastructure, a working definition of resilience in this context and a quantitative means of measuring resilience must be defined.
Rather than adopting a civilian-focused energy resilience definition and quantification, it is important to first understand the value of and difference in resilience from a military perspective. Civilian grid systems often focus on defining resilience in terms of real dollars lost when energy supply does not meet demand and a facility stops production of something that is easily monetized (e.g., steel, automobiles, computer chips, processed food, vaccines, etc.) [21]. Conversely, military energy systems such as nanogrids and microgrids produce something less tangible: national security [22]. National security is intangible and has no easily defined value [22,23]. The cost to national security due to lack of energy resilience becomes subjective and theoretical [24].
There are a variety of definitions of energy resilience within military communities although they all focus on several commonalities: preparing for an event, riding out the event, stabilizing after the event, and recovering from the event in order to continue to support mission essential operations and maintain readiness [5,25]. The military definitions of energy resilience generally align with civilian definitions although the military definitions always tie back to the mission of national security [5,26]. Thus, this paper adopts the definition of energy resilience from a military perspective as encompassing the ability of an energy system to support critical loads before an event, during an event, immediately after an event, and in the recovery from an event back to a normal operating state.
There have been several attempts to quantify energy resilience for military purposes from a financial perspective. For instance, a cost benefit analysis of stand-alone diesel generators attached to critical loads on installations was performed to calculate a Customer Damage Function (CDF) which is representative of the cost of interruption as a function of the duration of an outage [21,27]. However, in most situations it is very difficult to quantify national security in a dollar amount. Instead, within the United States military, the value of resilience is sometimes defined using the Mission Dependency Index (MDI) where MDI captures the relative criticality of various infrastructure on a base with respect to the mission of the tenant organizations on a base on a 0–100 scale with 100 being absolutely critical [28]. In contrast, some researchers have criticized the use of MDI when directly ranking criticality of loads to their overall role in national security missions. These researchers claim existence of inaccuracies in addressing time dependency of corrective actions, and misrepresentation of mission interdependence and intradependence in the MDI equation [29]. Recently the DoN has begun using Resilient Energy Program Office (REPO) (an attempt to address the shortcomings of MDI with similar objectives and using aspects of Energy Security Assessment Tool (ESAT)) as a replacement in some of the roles that MDI has been previously employed [30]. However, many organizations across the United States federal government retain MDI and some issues with REPO are currently being identified. Thus, this paper adopts MDI as the base measure of a unit of energy resilience.
In order to use MDI to quantify energy resilience for the military, a method of quantifying resilience over time is needed. Several exist or are in development [5,22,26,31,32]. This paper adopts the approach proposed by Peterson et al. [22] where the Expected Electrical Distribution Mission Impact (EEDMI) quantifies the resilience of an energy system versus all expected initiating events, threats, disruptions, etc. In Peterson et al.’s approach, MDI is used to understand the value of each critical load to national security where it provides the input to Mission Impact (MI) on a per unit time (T) basis. MI is the impact to a mission on a per unit time basis for if a specific electrical load is not served. A single scenario (specific initiating event, threat, etc.), , is defined by the MI per unit time (T) that is not served electricity throughout the duration of the scenario [22],
During normal operations and with no electrical interruptions, is zero. During a scenario where MDI = 50, the unit of time is hours, and power is not delivered for 2 h, . In scenarios where not enough power is available to serve all loads, load shedding occurs. The details of how load shedding occurs (e.g., which loads are shed first, rotating blackouts, etc.) is dependent upon behavior of the energy system and controller(s). In such situations where load shedding occurs, which indicates an impact to national security and thus warrants further investigation.
The aggregate of all scenarios (S) calculated in Equation (1) is EEDMI which includes the probability () of the specific threat or initiating event occurring over the course of a year:
The total EEDMI value for a specific electrical system configuration is used as a way to compare between different potential electrical system architectures from the perspective of energy resilience. A lower EEDMI value is more desirable because it means that the electrical system is less susceptible to initiating events and threats disrupting power to critical loads [26]. The process of developing EEDMI is the same whether analyzing a very small nanogrid or a very large microgrid on a military base.
2.4. Mission Threats
Threats to the uninterrupted delivery of energy to critical loads on a military base are called a variety of terms such as initiating events, mission threats or threats, disruptions, etc. While there are well-understood and well-quantified initiating events available for external threats (events that occur outside a facility) and internal threats (events that occur inside a facility) [33], many threats of specific interest to the military are unique to military installations and not included in existing resources. For instance, a nation-state adversary conducting a coordinated cyber-attack and physical attack against a variety of electrical infrastructure both internal and external to a facility is generally not considered in most existing initiating event handbooks. In the Methodology section of this paper we propose a minimum list of potential initiating events of interest to the military.
2.5. Nanogrid System Design
A variety of nanogrid system designs are proposed in the literature and have seen limited implementation in the real world. Different nanogrid designs can serve different purposes and will have different impacts on the energy resilience of an electrical system. From a systems engineering perspective, Giachetti et al. advances six criteria for understanding electrical systems used to power military loads: (1) System Purpose (2) Stakeholders (3) System Boundaries (4) Functional Requirements (5) System Architecture (6) Operating Modes [2].
In this paper, the nanogrid system’s purpose is to improve resilience, transmission efficiency, and ease of integration of renewable resource and energy storage. Though nanogrid resilience has not been validated, our analyses (detailed in subsequent sections) indicate that nanogrids do improve resilience over baseline microgrid infrastructure in many situations.
Military nanogrid stakeholders include base commanders, tenant commands, local energy companies, microgrid providers and contractors, and maintenance and funding organizations. Higher authorities that base commands report to (e.g., The Pentagon) are also impacted by nanogrids.
We view the physical and functional boundaries of a microgrid from a holistic perspective. The system includes physical equipment, processes, software, and people who sustaining operational effectiveness (e.g., maintenance, operations, supply chain, etc.). Nanogrid system boundaries differ from microgrid system boundaries in that nanogrids are much smaller than microgrids. However, individual nanogrids can be part of a larger microgrid from the perspective of a Systems of Systems (SoS). By considering several nanogrids as part of a SoS, individual nanogrids can be placed on various critical loads within a microgrid to work together to improve the microgrid’s energy resilience. Nanogrids generally have external inputs from maintenance organizations, fuel providers, operator organization, a microgrid, and the external grid.
The primary functional requirements from a systems engineering perspective of nanogrids are to generate, distribute, control distribution, and store energy. Where lower level functions under generate energy include generate electrical energy and adjust energy production. Distribute energy includes transmit energy, control energy flow, and convert energy. Controlling a nanogrid includes measure nanogrid state, process measurements for control decisions, and send control signals. Energy storage provides the benefit of stability of the nanogrid system when energy demand exceeds energy generation capacity. This includes store energy, release energy, and adjust energy flow.
System Architecture for a nanogrid differs from a microgrid due to its complexity and potential configurations. We suggest specific system architecture details of any individual nanogrid be determined after an analysis of alternative existing nanogrid architectures is conducted in order to identify which type(s) of nanogrid architecture(s) best benefit the energy resilience of any specific military installation.
Nanogrid operating modes include four primary modes of operation: microgrid-connected, transition-to-island, island, and re-connection. Microgrid-connected mode establishes normal parallel operations with the microgrid and (assuming a microgrid-to-grid PCC) utility grid while all distributed resources in the grid operate within IEEE standards and information is exchanged with the nanogrid controller. Transition-to-island mode represents the nanogrid’s transient state of transition between being connected to the microgrid and being fully islanded. The nanogrid must have sufficient energy storage available in addition to the ability to stabilize voltage and frequency (in the case of an AC or AC/DC nanogrid) for successful transition. A major concern of this mode is the dampening of transients in the nanogrid to avoid tripping protective devices [2]. Island mode is when the nanogrid is operating independent of any outside energy sources, and loads are solely supported by DER and ESS with the responsibility to maintain set frequency and voltage parameters [2]. Re-connection mode is the transition period where the nanogrid is reconnected to the microgrid. Before synchronization can occur, the frequency, voltage, and phase angle between the two must be within acceptable parameters in order for the nanogrid and microgrid to resume unified operations [2].
2.6. Nanogrid Architectural Configurations from a Resilience Perspective
A number of major architectural configurations have been proposed in the literature and some have been implemented on a limited basis. This section discusses some of the considerations of nanogrid architectural configurations from a resilience perspective and from the perspective of other important military requirements such as efficiency and renewable energy.
The conflict is that many authors design nanogrid infrastructure differently: with centralized and decentralized control systems, the sole use of DC power, or a hybrid of DC-AC\AC-DC power conversions. Currently no actionable guidance exits on potential nanogrid configurations that may improve resilience of critical loads to outages on military installations. However, commercial solutions that stem from the demand for electrical power for space applications have led to similar refinement of existing technologies for nanogrid-like solutions. Similar to nanogrids, these new technologies address power conversion from PV arrays with management, regulation, and monitoring of electrical demand. Though these power systems are not specifically called nanogrids, their basic elements are similar: energy storage, power conversion, power management and distribution, and use by spacecraft systems [34]. Further, the details of critical loads vary from installation to installation; thus, there is no one size fits all solution.
Research has investigated the benefits and drawbacks of implementing both AC and DC nanogrids which highlights the difference in cost between DC nanogrids (high up-front costs) and AC nanogrids (low up-front costs) [18]. Though we explicitly do not consider cost within our research, it is important to note the added cost to augment existing military microgrid infrastructure with DC nanogrids. Some research has recently been focused on understanding the cost of increasing energy resilience from a military perspective [26,35]. While some military energy organizations are primarily driven by cost, we expect that cost will soon be balanced with energy resilience to better align with the high-level desire to assure that important national security missions can continue in spite of disruptions to grid and microgrid infrastructure.
Safety is another concern with military requirements and therefore protection concerns arise when choosing DC nanogrid architecture. Short circuit line and ground faults are more common at output terminals for DC nanogrid architecture then Alternating Current (AC) nanogrid [18]. Examples of this are seen in Okinawa, Japan with experimentation done by researchers to stabilize DC power on nanogrids with three sets of bidirectional DC to DC converters (used in current and voltage regulated mode) to maintain a constant bus voltage [17]. In addition, mitigation of these potential failure modes can occur with the use of arcing-type circuit breakers or more advanced strategies [18]. Control strategies and control system design can have a large impact on a variety of important nanogrid requirements. Nanogrid architectures using either centralized or decentralized control provide different solutions to optimize power production and consumption to better match a load’s supply and load curves, and reduce the negative effects of intermittency [18]. Centralized control at the microgrid level (controlling the microgrid plus any constituent nanogrids) enables a cohesive control strategy of system dynamics but provides a potential single point of failure. Though cohesion is important, militaries are generally more concerned about reliability and resilience. In addition, when a microgrid is under stress, the purpose of the nanogrid is to independently disconnect from the microgrid at its PCC and operate as an independent system in island mode. Therefore, centralized control strategies are undesirable for most military applications and decentralized nanogrid control systems that can react to threats to the uninterrupted delivery of power to critical loads is important for energy security and improves resilience. However, decentralized control of nanogrids can inhibit overall microgrid reliability due to there being many more potential independent failures of distributed nanogrid controllers over time [18,36].
A benefit of a DC nanogrid is the commonality of PV array and ESS output power generally being DC power [18]. This commonality of a DC based nanogrid would allow for a smoother and efficient transition of power amongst renewable energy sources to battery storage. Though an AC based nanogrid will save money on initial cost upfront with no necessary retrofitting, added efficiency benefits of a DC based nanogrid will outweigh initial capital required criteria and benefit the military’s mission-focused requirements.
2.7. Related Research
Existing research into and deployment of nanogrid technologies to date have generally not directly focused on the ability of nanogrids to support critical loads from the perspective of energy resilience and especially for military base applications. As far as we are aware, no one has proposed using nanogrids from the perspective of improving resilience of critical loads that support national security. The majority of current nanogrid research focuses on conceptual nanogrid design and defining nanogrid infrastructure. Only a few publications have reported on nanogrids successfully implemented in real-world conditions. For instance, a nanogrid was implemented in a housing community in Okinawa, Japan where it was found that a decentralized DC-DC solution was beneficial [17]. However, the authors noted that additional research is needed to explore limitations of decentralization and the development of higher level intelligent exchange strategies that enhance efficiency [17].
Enhancing efficiency of nanogrids (an important aspect of energy security for militaries) occupies a significant portion of the existing literature where identified challenges include protocols, demand-side management, security, and the self-control of the overall system [37]. One promising area of research is fully DC-based nanogrids where higher efficiency, better power quality, and better stability is achieved versus other options and may contribute significantly to energy security as a result [18].
As mentioned previously, a similar concept to DC nanogrids is zonal distribution (sometimes referred to as zonal shipboard power) which is implemented on a growing number of vessels in many Surface Navies. Zonal distribution uses DC power architecture in order to avoid some of the issues associated with AC power architecture such as generator sets working at fixed speed that limit fuel efficiency, reactive power flow and power quality problems, bulky conventional transformers, and challenges associated with supporting pulsed electric loads which will become increasingly common on Navy ships [38].
In addition, current research in nanogrids fails to support a mission-focused objective for DOD shore installations and instead supports a commercial cost effective mission with an ease of integration to existing infrastructure. Current research suggested the pursuit of future work in resilience of smart load configurations, networks and connections, and fast response to disasters [18,39]. This segues into the uniqueness of our research where we propose a methodological approach to enhance resilience of mission critical loads to create greater energy security that in turn supports the mission of national security.
3. Methodology
This section introduces a systems engineering method to investigate if nanogrids can increase the resilience of critical loads on military installations and lower the mission impact from potential threats. Figure 1 illustrates the method.
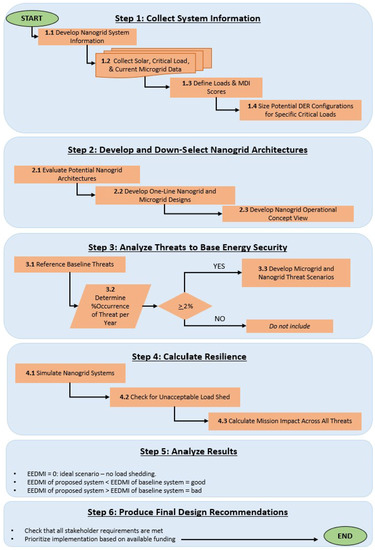
Figure 1.
Overview of Methodology. This methodology is created for base energy managers to follow, starting with the collection of system information and ending with final design recommendations.
3.1. Step 1: Collect System Information
The first step in the proposed methodology is to collect system information that is necessary for subsequent steps. The requisite information is generally readily available to base energy managers and others involved with energy systems at military installations.
3.1.1. Step 1.1: Develop Nanogrid System Information
Basic information about potential nanogrids must first be developed following Giachetti et al.’s six criteria for understanding electrical systems that power military loads including: (1) System Purpose (2) Stakeholders (3) System Boundaries (4) Functional Requirements (5) System Architecture (6) Operating Modes [2]. This information is useful to ensure accurate and explicit communications between all stakeholders (e.g., base energy managers, tenant commands, critical load owners, etc.) and helps to elucidate the architectural process to find weaknesses and validate checkpoints within the grid development [40]. We advocate that this information is captured in a MBSE tool such as Papyrus, Magic Draw, Innoslate, etc. which helps with later analysis.
As part of developing the information for Giachetti et al.’s six criteria, stakeholder needs are elicited. The stakeholder needs are then developed into requirements which will be used later in a decision matrix to help judge different nanogrid configurations for suitability. Potential requirements include but are not limited to efficiency, reliability, ease of integration, and communication cohesion.
3.1.2. Step 1.2: Collect Solar, Critical Load, and Current Microgrid Data
Next, site-specific information is collected which will help a base energy manager to understand the feasibility of implementing nanogrids on specific critical loads. Data collected include load profile data, solar irradiance data, existing energy generation and storage systems including support infrastructure (e.g., fuel storage tanks, etc.), existing microgrid power infrastructure (e.g., transmission lines, switches, protection equipment, transformers, feeder lines, PCC, etc.), and other related information.
Data such as site-specific historical solar irradiance information is used in later steps to better size PV generation assets for nanogrids. Load profile data is used to understand the average and peak loads, and how much energy is needed over the course of a potential outage scenario. We recommend that load data be collected over at least the course of one year and indeed these data are often available for many years from existing SCADA systems.
3.1.3. Step 1.3: Define Critical Loads and MDI Scores
The next step is to define the importance of various loads in relation to national security. We suggest using MDI [28] which is a unitless measure that can be tied to the importance of a specific load to national security in spite of the imperfections in the measure [29]. As other better measures become available, they can be substituted for MDI. These scores become the MI used in Peterson et al.’s method [22] which is implemented later in this methodology.
It is important to note that all loads within this case study are considered critical. Further, the responsibility of assigning an MDI value lies with the base energy manager and installation leadership. When a base energy manager or installation leadership deem that a load has no or very low MDI, it can likely be ignored as being unimportant to national security. We do not recommend a specific cutoff value for low MDI scores; however, in some situations where there are many loads and challenges exist identifying true critical loads, a pre-established cutoff value may be justified. For instance, the loads associated with a recreational facility are likely not critical to national security and thus will have a very low MDI score while the loads associated with a radar system may be very critical to national security and then are expected to have a very high MDI score. The loads that are deemed critical can then be carried forward through the rest of the methodology.
3.1.4. Step 1.4: Size Potential DER Configurations for Specific Critical Loads
Next a preliminary high-level DER sizing study is performed for each critical load with the assumption that each critical load will be placed on its own nanogrid. This includes sizing both energy generation and storage (e.g., how large of a diesel generator? How large of a PV array? How much diesel storage? How large of a battery storage system? etc.) to meet the maximum outage duration a military base is mandated to be able to sustain (e.g., 7 days, 14 days, etc.) which often indicates how long a mission must continue at a specific military base before a different base elsewhere that is not impacted by the initiating event or realized threat can start performing the mission.
We suggest picking a time period with very low solar irradiance and very high load if such a period exists for a specific site location and a specific load profile. For instance, in northern hemisphere locations, the December-January period often combines very low solar irradiance due to short, cloudy days and higher load profiles due to systems needing more energy to function in cold, dark conditions. However, it is possible that summer conditions in very hot climates may have high enough load profiles due to cooling needs (i.e., chillers and air conditioners to keep electronics within operating temperatures, etc.) that even with more solar irradiance to generate more PV energy, this time period is the most extreme load versus generation scenario.
3.2. Step 2: Develop and Down-Select Nanogrid Architectures
In this step, potential nanogrid architectures are developed and down-selected based on site-specific and stakeholder-specific conditions.
3.2.1. Step 2.1: Evaluate Potential Nanogrid Architectures
As discussed above, there are a variety of nanogrid architectures available. In this step, evaluation of potential nanogrid architectures to serve critical loads at a specific military base is performed. We suggest using a Pugh matrix approach although a variety of other Analysis of Alternatives (AoA) methods are available to the practitioner. The Pugh matrix criteria map to the requirements developed in Step 1.1. The Pugh matrix is a type of tool that uses a scoring system of plus and minus to determine if the base energy manager’s intuition of a baseline grid structure is the best decision. An example Pugh matrix is provided in Section 4.2.
3.2.2. Step 2.2: Develop One-Line Nanogrid and Microgrid Designs
Once the AoA is conducted a high-level one-line diagram of the microgrid and proposed nanogrids can be developed. All critical loads, existing DER, other existing power infrastructure (e.g., power lines, transformers, etc.), and proposed nanogrids should be included. This one-line diagram serves as the basis for further analysis within this method. Note that at this point, we are interested in including all potential nanogrids as a down-select step to choose which nanogrids should be implemented occurs later.
3.2.3. Step 2.3: Develop Nanogrid Operational Concept View
In order to understand how various threats may impact the operation of a microgrid and associated nanogrids, we advocate developing an operational concept view that is commonly used throughout many military organizations [41]. The operational concept view combines information such as geographic location of energy infrastructure and critical loads, the one-line diagram of the microgrid and associated nanogrids, locations of perimeter fences and entry control points, and other site-specific information into one figure that allows for better communication with stakeholders and permits more rapid human analysis of potential threats. An example operational concept view is provided in the Case Study (Section 4).
3.3. Step 3: Analyze Threats to Base Energy Security
The method now proceeds to analyze potential threats to base energy security. These threats comprise the initiating events that are used in subsequent methodology steps.
3.3.1. Step 3.1: Reference Baseline Threats
An analysis of threats is important for the base energy manager to ensure that the microgrid and associated nanogrids are resilient against a variety of potential threats. Currently DOD and NAVFAC consider island mode as a primary threat from an energy resilience standpoint. Island mode, where the base is cutoff from outside electrical energy for 14 days, serves as the baseline threat scenario in subsequent steps of this methodology. In addition to island mode, we advocate for inclusion a variety of additional internal and external threats of specific interest to military installations that are subsequently discussed. While we believe this is a reasonable minimum list of threats to consider, specific locations and specific global and regional threat protection postures may require additional threats to be included in subsequent methodology steps where they serve as initiating events.
The following internal threats are the minimum set that we recommend a base energy manager use:
Loss of Generator(s): This threat is the loss of one or more generators simultaneously. Simultaneous failure (a common cause event) can happen due to contaminated diesel fuel being delivered to all generator fuel bunkers or incorrect maintenance being performed on all generators, for instance.
Loss of PV Array(s): Similar to the loss of generators threat, PV array maintenance could have been mismanaged or there could be a design flaw across all installed PV panels or controllers. Other ways a loss of PV array can occur is dirt or avian organic material on the PV modules, shading, or incorrect incidence angle among others [42].
Maintenance Personnel Insider Threat: The DOD defines insider threat as “the threat that an insider will use her or their authorized access, wittingly or unwittingly, to do harm to the security of the United States” [43]. All militaries face a similar insider threat that can compromise national security mission success. Two incidents of insider threats at United States military bases include include Fort Hood in 2009 where an lone Army officer shot and killed 13 people and in 2013 when an Navy contractor shot and killed 12 civilian employees [43]. It is understood that military installations are not a perfectly safe sanctuary and therefore it must be taken into consideration that, for instance, damaging PV arrays or transformers with a gun, or generators by draining engine oil would be a potential occurrence [43]. This type of deliberate attack is likely to occur against critical loads that are most valuable to mission success.
The following external threats are the minimum set that we recommend a base energy manager use:
Natural Disasters: Site-specific natural disasters must be included in potential external threats. Such threats could include flooding, earthquake, tsunami, tornadoes, etc. We specifically focus on fire and severe storms in this article, and provide more detail below on the fire threat. Similar detail can be developed for each potential natural disaster based on site-specific considerations.
A 2013 study showed that the Northern California and Monterey Peninsula (where the military base we work at is located) has an estimated 31–40% chance that given a single source of ignition, a fire will grow to 100 plus acres in size [44]. This is the second highest ranking category for fire growth within the United States. Given the severity and likelihood of this natural disaster or ignition occurring by an attacker not only in the American west but globally anywhere that a wild-land urban interface exists [45], we advocate this threat be included. Indeed, the 2020 fire year saw three major fires within 30 miles of the military bases in the greater Monterey Peninsula area [46].
Explosion from Terrorists: Since 1997 the Joint Chiefs of Staff implemented the Combating Terrorism Readiness Initiative Fund which has allocated approximately $80 million to U.S. and overseas installations for Anti-Terrorism Force Protection improvements [47]. Today, the probability of an explosion by a vehicle-born IED or other means of explosives still exists. A heighten intent of disrupting military operations and comprising national security makes military installations more favorable to this type of external event in comparison to civilian grid facilities. Terrorist attacks such as Beirut in 1983, 11 September 2001, and most recently in 2019 a vehicle borne IED outside the U.S. Embassy in eastern Kabul have changed the paradigm of force protection on military installations [48,49].
Fuel Delivery Disruption with Low Probability of Resupply: Disruption of Fuel delivery may happen to any military installation. For instance, supply chain contracts and limited refining capacity within the United States limit the DOD’s fuel supply domestically with reliance on extensive supply chains from foreign suppliers [50]. A single natural disaster not directly impacting a base can cause delay in fuel supply to base installations, which is why this type of external event is considered as a more likely occurrence for military installations. Other potential disruptions to fuel delivery such as protests blocking shipments, adversary destruction of fuel tankers, and other scenarios are of particular concern to military installations. Many military installations are heavily reliant on fuel delivery to power generators that are expected to function in order to support critical loads during an island mode situation.
The above internal and external threats are the minimal list of threats that we believe base energy managers should use to assess their microgrid and proposed nanogrid architectures. We take this opportunity to vigorously remind the practitioner that location-specific threats either from a military installation itself or from natural or human-made phenomena locally or regionally must also be considered. For example, a military installation such as 29 Palms in the Mojave Desert has a higher probability of a rocket launched from the Mojave Spaceport crashing into microgrid infrastructure than Naval Support Activity Monterey which is far from any rocket launch trajectories. Another example is Camp Santiago in Puerto Rico and Camp Lejeune in North Carolina where both installations have a higher probability of a hurricane destroying microgrid and grid infrastructure due to the frequency of hurricanes in their locations versus North American west coast facilities.
3.3.2. Step 3.2: Determine Percent Occurrence of Threat per Year
After a final set of threats are determined, the probability of occurrence of these events initiating within any given year must be determined. In this methodology, probability of occurrence is the likelihood over a given time frame (often one year) that a threat will be realized. While natural disasters such as fires and floods have well-established probabilities of occurrence in the literature, it can be challenging to ascertain the probability of occurrence of human-caused threats such as insider threats or terrorist attacks [51].
While it maybe desirable for some military installations to examine rare threats, we recommend that a threat only be carried forward for further evaluation if the probability of occurrence on a yearly basis is greater than two percent ( 0.02). If the potential threat is below this threshold, then we suggest it can be disregarded based on our professional experience. Existing sources of data and quantification process for probability of occurrence for failure scenarios are challenging due to to information available for military installations. The base energy manager’s responsibility is to postulate probability of occurrence for specific threats on the location of their base [22]. A variety of useful resources to develop probability of occurrence of threats exists [52,53]. It is important to note the limitations on historical data due to climate change. Increasing climate changed has caused considerable changes in weather patterns and poses risk to military installations. For instance, in 2019 the Pentagon reported that a total of seventy-nine military installations were at risk of flooding due to rising sea levels induced by climate change. Norfolk, one of the Navy’s largest bases, is seeing the effects already. The main road to Norfolk Naval Station floods a few times a month with predictions that it will continue to flood more frequently up to two hours per day in the upcoming years [54,55].
3.3.3. Step 3.3: Develop Microgrid and Nanogrid Threat Scenarios
The operation concept view previously derived is beneficial when maturing microgrid and nanogrid threat scenarios. After a threat has been realized (e.g., a fire), the damage that threat inflicts on the microgrid and constituent nanogrid(s) must be catalogued for subsequent analysis. In most of the threats we advocated above that base energy managers evaluate, the location of the critical load and where the threat initiates can be used to determine what nanogrid(s) and microgrid components are impacted, and what DER are still operational when operating in island mode. We conservatively assume that when a threat is realized, the microgrid disconnects from the utility grid at the PCC. We assert this is a conservative and realistic assumption. Several tables in the Case Study (Section 4) demonstrate a tabulation of equipment expected to be functional or offline/disabled/destroyed in a variety of threat scenarios.
3.4. Step 4: Calculate Resilience
After sufficient information and models are constructed in the above steps, it is now possible to calculate the energy resilience of various nanogrid configurations to various threats. This will allow a comparison between nanogrid architectures, and against the baseline microgrid architecture in a future step.
3.4.1. Step 4.1: Simulate Nanogrid Systems
Using the equations developed by Peterson et al. [22], a simulation can be developed to examine various nanogrid configurations. We modified an existing MATLAB simulation tool [32] to develop the Case Study (Section 4). Other implementations of Peterson et al. have been developed [5].
The simulation implements a simple power flow analysis that matches generation and storage with loads to identify periods of time where insufficient capacity is available to support critical loads. Input parameters include sizing information for PV area, battery capacity and power output, generator power output, amount of fuel storage available, solar irradiance data, load data, and initial conditions of all electrical hardware. Output parameters include load shedding information (which load(s) is/are shed, and for how long) among others. The power flow analysis takes into account the charge state (modeling charge and discharge rates, capacity, etc.) of the ESS, the amount of fuel available for generators and when fuel resupply may occur, load profiles, load shedding strategies (which loads to shed first when insufficient power is available to support all loads), and other considerations. The output of the simulation is then used along with individual MI scores of the critical loads to calculate as shown in Equation (1).
We advocate using a one hour time step in the simulations which is sufficient for the high level systems engineering analysis of energy resilience conducted in our methodology. Practitioners can choose to develop higher fidelity models based on their individual situations although we have observed in our professional practice that most military installation energy managers can make decisions using data with one hour time steps.
While it is possible to simulate across one or multiple calendar years using a Monte Carlo approach or similar (as Peterson et al. did [22]) to develop a broader picture of load shedding under different load and solar irradiance conditions (e.g., diurnal temperature and solar irradiance swings, seasonal swings, etc.), we recommend that one particular time period with the highest loads and lowest solar irradience is specifically chosen. This greatly reduces computation time and also focuses the analysis on the worst case scenario of high load and low availability of solar power. The reason for this focus is that threats from adversaries are likely to choose the time of greatest electrical infrastructure vulnerability to attack. This is unique to military energy resilience and microgrids versus civilian energy systems that generally do not have nation-state or terrorist adversaries looking to cause damage to national security.
3.4.2. Step 4.2: Check for Unacceptable Load Shed
Once results for all threats have been developed, the results must be examined to determine if any particular threat scenarios have unacceptably high load shed hours. While we use to understand the overall contribution of a particular threat scenario to not completing national security missions, it is important to look at the raw load shed data to verify any particular load shed events of interest are not being obscured. If such a situation is found, we advise returning to Step 1.3 to re-examine the MI score (likely directly derived from MDI) to verify that information is correct. Occasionally, the MI may need to be manually adjusted to reflect intangible factors that were not captured in the MDI analysis or similar load-specific national security importance measure. Unacceptable load shed events may also indicate a need for an up-sized nanogrid design for a specific load – in this case, return to Step 1.4. If individual load shed events are all within acceptable parameters, then continue forward.
3.4.3. Step 4.3: Calculate Mission Impact Across All Threats
Next, mission impact across all threats is calculated using the EEDMI metric developed in Equation (2). This involves using the probability of occurrence for each threat developed in Step 3.2 and the results from Step 4.1. The EEDMI for each potential nanogrid architecture can be compared against the baseline microgrid EEDMI score to determine if specific architectures are better or worse than the baseline microgrid which is performed in the next step. EEDMI is a measure of resilience of electrical energy to threats so that critical loads at a military base can perform important national security missions.
3.5. Step 5: Analyze Results
Now EEDMI scores are analyzed to validate if adding nanogrids to an existing microgrid improves resilience. Three outcomes may occur comparing EEDMI scores including:
: The most ideal scenario from a military energy resilience perspective is when a specific system architecture returns a result of . This means that for all postulated threats, no load shedding occurs and there is no impact to the national security mission.
: In this case, the proposed nanogrid system design is superior to the baseline microgrid because the proposed design’s is less than the baseline microgrid.
: If the of the proposed nanogrid system design is greater than or equal to the baseline, it is worse than the baseline design with respect to energy resilience. Such an outcome may indicate undersized generation and storage capacity within the nanogrid(s). In this case, it may be worthwhile to double-check the sizing carried out in Step 1.4 and the designs produced in Step 2.2.
The proposed nanogrid designs that produce values below the baseline nanogrid can then be rank-ordered to understand which designs may be preferential to others. While the metric is useful in understanding which designs are more resilient and are more likely to protect critical loads from threats to energy security that could impact national security missions, resilience is only one of several important requirements that military installations often use when focusing on improving energy infrastructure.
3.6. Step 6: Produce Final Design Recommendations
Now that a list of potential nanogrid design options has been produced and ordered based on resilience, we turn our attention to producing final design recommendations that a base energy manager can use to promote upgrading existing microgrid infrastructure to include nanogrids. Two questions must be addressed to guide the final recommendations:
Are Stakeholder Requirements Met? It is important to ensure the requirements collected in Step 1 are validated as being met. While the methodology presented above develops an understanding of energy resilience, other important requirements must be verified to still be met. For instance, a proposed design may only include diesel generators with no other generation sources but a requirement for a certain percentage of renewable generation may be present [9]. In such a case, this would indicate that particular nanogrid system design is inappropriate for further consideration without extreme extenuating circumstances to violate the renewable energy requirement. If no proposed designs remain after validating other requirements are met, then the base energy manager should return to Step 1 and carefully re-evaluate the requirements before verifying that no other proposed designs exist which would meet requirements.
Is Funding Available? While a proposed nanogrid design may meet all requirements, there may not be funding available to fully implement the proposed design on the existing microgrid infrastructure. In this case, a base energy manager may choose to prioritize which critical loads receive a nanogrid first based upon available funds and cost of installing and commissioning the nanogrid(s). Depending upon the particulars of how military budgets are allocated for projects such as base energy infrastructure upgrades, it may be possible to fund a nanogrid for a critical load that is less critical than another critical load because of the specific configuration of the two different nanogrids. In other words, if there is money available to do a certain type of energy project (i.e., renewable energy projects [9], etc.) and one proposed nanogrid design meets the criteria for that funding source while another does not, then the nanogrid design that meets the funding source requirements should be pursued. When other funding becomes available, then other nanogrid designs can be pursued for other critical loads. The complexities of funding for military energy projects is largely unique to militaries and is not as pronounced in most civilian sectors.
4. Case Study
This section demonstrates how a practitioner such as a military base energy manager may use the proposed methodology by introducing a fictionalized version of the Northern California-located Naval Support Activity Monterey base where the Naval Postgraduate School is located. The case study uses a generic base structure and focuses on location and threat-specific initiating events. A potential nanogrid configuration is compared against an existing fictionalized generic microgrid design to demonstrate the potential usefulness of the method.
4.1. Step 1: Collect System Information
4.1.1. Step 1.1: Develop Nanogrid System Information
First, Giachetti et al.’s six criteria for understanding electrical systems from a systems engineering perspective are collected. The system purpose is to deliver reliable power to multiple critical loads on the Naval Support Activity Monterey military base. The stakeholders include base energy manager, DOD employees, high ranking officials within the base chain of command, NAVFAC, and the DOE. Figure 2 provides context to the base energy infrastructure from a systems engineering perspective where the system boundary is indicated by the dashed red line. Four external inputs to the internal system are the external grid, fuel provider, maintenance organization, and operator organization. This step in the systems engineering process aids in defining system boundaries to examine external interactions that may effect the internal system environment. Labeled in blue are what material or resource is provided by each external input.
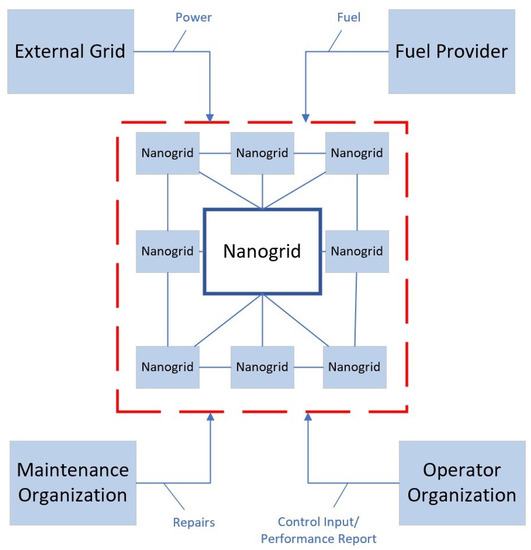
Figure 2.
Nanogrid Context Diagram [2]. This diagram is useful in the context of the systems engineering process to identify external interactions with the system and identify system boundaries.
The requirements analysis is illustrated in Figure 3 where top level functional requirements include: generate energy, distribute energy, control distribution, and store energy.
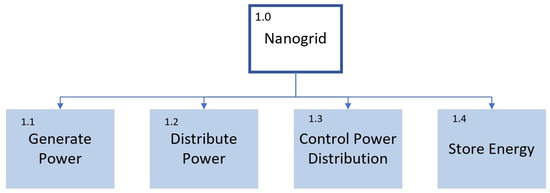
Figure 3.
Microgrid and Nanogrid Functional Decomposition [2]. The functional decomposition represents the high-level functions that the system must perform to meet system requirements.
Figure 4 outlines the operating modes for the microgrid and potential nanogrids illustrating the process of planned/unplanned disconnection and returning to a complete re-connection to the utility grid.
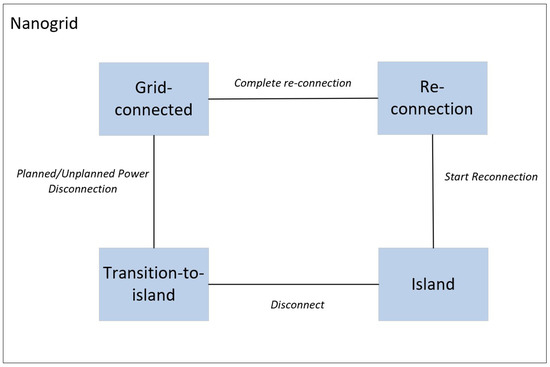
Figure 4.
Microgrid and Nanogrid Operating Modes [2]. The figure shows how a microgrid or nanogrids can move between different modes of operation.
4.1.2. Step 1.2: Collect Solar, Critical Load, and, Current Microgrid Data
Critical load energy consumption data is obtained from the DOE using hourly load data referencing 70% of the buildings within the United States used for building energy studies [56]. Historical solar incidence data is collected from 1991 to 2010 for climate conditions in Monterey, California [57]. We specifically use solar data from the year 2000 for illustrative purposes. Load data analysis indicates that the highest amount of electricity use occurs from January to March while simultaneously having the worst PV power output. This worst case scenario of high power demand and low solar output power is the time of year used for the rest of this Case Study. This ensures that energy resilience is evaluated in the worst conditions when adversaries are more likely to attempt hostile actions. Table 1 shows the summary of the critical loads within the existing microgrid. For the purposes of the case study, these values are derived from only taking into consideration the critical electricity needed to maintain mission operations at a military base such as Naval Support Activity Monterey which is assumed to be 50% of interior lighting and 67% of interior equipment [32]. This eliminates the use of auxiliary services of water heaters, fans, and electric cooling and heating systems among others that provide comfort service rather than mission-critical needs [56]. This critical load assumption is then used to calculate the hourly load (kW). The hourly load data is compiled to during the selected time of year to determine the maximum and average critical load values for each type of facility.

Table 1.
Building Load Data. This data is derived from the DOE Commercial Reference Building dataset hourly load data [56]. This data is used to extract the average maximum load and average normal load for associate facility types.
4.1.3. Step 1.3: Define Critical Loads and MDI Scores
Table 2 represents the scaling of loads developed from the NAVFAC, United States Coast Guard (USCG) Office of Civil Engineering, and National Aeronautics and Space Administration (NASA)’s MDI and modified to fit our design [58]. All the loads simulated within our design are deemed critical and therefore a relative scale was developed.
Table 2.
MDI Scores for Individual Loads. Information from USCG Office of Civil Engineering, and NASA are used to calculate the case study MDI scores. In the case study, all MDI scores are represented on a 0-100 scale and all loads shown are considered critical.
4.1.4. Step 1.4: Size Potential DER Configurations for Specific Critical Loads
It is apparent from Table 1 that appropriate sizing of DERs is needed to accommodate the various critical loads. Each proposed nanogrid within the microgrid will have an associated DER that favors the average normal load and withstands the maximum critical load. Table 3 lists the summary of each nanogrid configuration.
Table 3.
Nanogrid DER Sizing Data. Sizing of generator power output is derived from specification sheets from generator datasheets [59,60,61,62]. Fuel storage for each generator is calculated for a 7 day period based on fuel consumption rate. PV array size is determined by simulating PV power output from solar irradiance data based on each nanogrid relying solely on PV generation and ESS storage.
Generator power output values and fuel consumption are derived from the specification sheets from companies such as Cummins and GENERAC [59,60,61,62]. Fuel storage for each generator is calculated from fuel consumption in gallons per hour and provisioned for 7 days with expected refuel to endure the mission duration of 14 days (this is a common tactic to reduce stored on-site fuel at both civilian and military facilities [63]). PV array area is determined by simulating PV power output from the solar irradiance data based on each nanogrid solely relying on PV generation and ESS storage. However, many bases have limited land available for large PV installations. While not widely implemented yet at military bases, civilian facilities have begun placing solar canopies over parking lots both to increase solar generation area and also to shade cars from the sun. Thus, the total available area for PV often may not meet the goal of supporting critical loads entirely off of PV and ESS. In this case study, we assume approximately 6000 m is available for PV. This is close to reaching the goal of both the diesel generator and the PV and ESS independently supporting the critical load on each nanogrid.
Iterations are done on each nanogrid until the generation capacity is able to accommodate the maximum and average critical loads with no load shedding. The simulation model of the nanogrid uses hourly time steps in order to determine the mission impact, load shedding, and system response for each scenario through deterministic methods [32]. Load shedding in our simulation is a vital factor in determining the constraints of the system and facility behavior. Energy demands not met result in required load shedding which influences mission impact [22]. Load shedding can impact the critical loads which can in turn impact national security [64]. Ensuring nanogrid DERs are sized appropriately ensures we are meeting the active power balance equation at a steady state with all load demands being met [22].
4.2. Step 2: Develop and Down-Select Nanogrid Architectures
4.2.1. Step 2.1: Evaluate Potential Nanogrid Architectures
An analysis of potential nanogrid infrastructure is performed in order to determine the most beneficial system architectures for Naval Support Activity Monterey including the benefits and drawbacks of DC and AC based nanogrids, centralized and decentralized control systems, and other important metrics. The primary viable nanogrid structures are: (1) DC-based nanogrid with centralized control, (2) AC-based nanogrid with centralized control, (3) AC-based nanogrid with decentralized control, and (4) DC-based nanogrid with decentralized control. A Pugh Matrix is provided in Table 4 that shows the different potential nanogrid structures and their benefits and drawbacks.
Table 4.
Pugh Matrix for Nanogrid Design. The baseline (DATUM) design of the DC-based centralized controller nanogrid is compared against the alternatives. The +, -, and 0 symbols indicate “better,” “worse,” and “no difference” respectively for each criteria for each of the three alternatives to the DATUM. The criteria are summed for each alternative and the DATUM; this provides a ranking which a base energy manager can use to inform a final decision (the “revised ranking”). In the case study, while the ranking indicates the AC-Based/Centralized Controller is most preferred, the base energy manager has decided to overrule the ranking and instead has indicated preference for the DC/Decentralized Controller due to survivability concerns.
The analysis in Figure 4 indicates that an AC nanogrid would be better than a DC nanogrid with centralized control. However, the need for energy security and survivability is paramount to military installations. This outweighs the other existing criteria. Therefore, a DC nanogrid with a decentralized controller is chosen as the best design solution for the research objective and stakeholder concerns. This design optimizes power balance by independently controlling each load, DER, and ESS [65].
4.2.2. Step 2.2: Develop One-line Nanogrid and Microgrid Designs
Figure 5 represents the microgrid and proposed nanogrids for the Naval Support Activity Monterey case study.
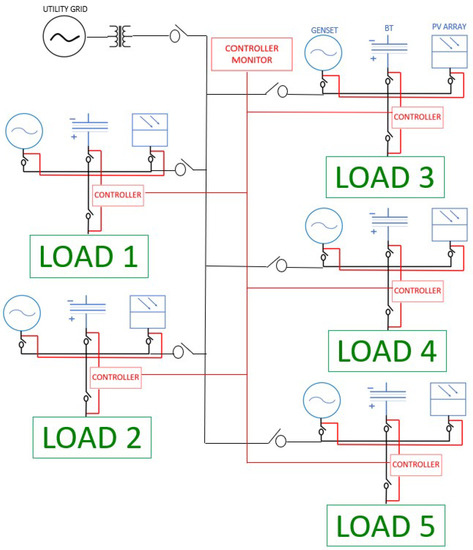
Figure 5.
Microgrid and Nanogrid Design. This one-line diagram represents the overview of the chosen nanogrid architecture highlighting the amount of loads, DERs, and controller architecture.
4.2.3. Step 2.3: Develop Nanogrid Operational Concept View
Next an operational concept view of the baseline (microgrid only) and proposed nanogrids for the fictionalized version of the Northern California-located Naval Support Activity Monterey base which is shown in Figure 6. The illustration highlights the infrastructure similarities and differences while also illustrating key generic elements of DOD installations (e.g., base perimeter which is often fenced, entry control points, utility grid connection (PCC), etc.
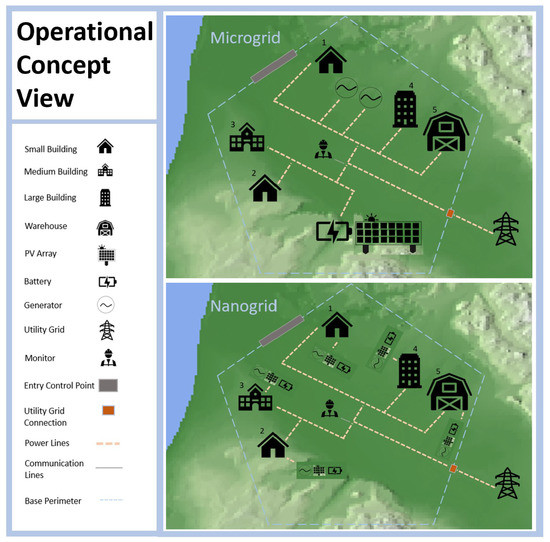
Figure 6.
Operational Concept View of Naval Support Activity Monterey. Baseline microgrid is represented in the top diagram while the proposed microgrid augmented with nanogrids is represented in the bottom diagram.
4.3. Step 3: Analyze Threats to Base Energy Security
4.3.1. Step 3.1: Reference Baseline Threats
In this case study, we use the baseline threats outlined in Step 3.1 in the Methodology (Section 3) above. We also include cyber attack because the fictionalized case study assumes that Naval Support Activity Monterey has extensive SCADA systems and automation (many military bases have not yet upgraded to SCADA systems and automated or remote-operated controls) which can be vulnerable to cyber attack [66,67,68], severe storms due to the installation’s proximity to the coastline, and plane crash due to proximity of runways and flight paths to critical loads. As opposed to civilian microgrids and nanogrids, militaries are often specifically concerned with plane crashes due to a variety of causes (training accident, intentional attack, equipment malfunction, etc.), and with the potential for much worse outcomes due to munitions and fuel loads [69]. We omit additional threats beyond these for brevity. However, a full analysis of a real military installation should ensure any additional location-specific threats are accounted for. The following threats are analyzed in the case study: loss of all generators, loss of all PV, insider threat, fire, explosion, fuel delivery disruption, cyber attack, severe storms, and plane crash.
4.3.2. Step 3.2: Determine Percent Occurrence of Threat per Year
Table 5 outlines the probability of occurrence of postulated threats. The probabilities for these threats are developed from historical weather data, familiarization with the location and threat dependency, and related research [22,52,53]. Because all applicable threats have a probability that is greater than or equal to two percent, the case study continues forward with all of the threats in Table 5.
Table 5.
Probability of Occurrence for Postulated Threats. The threats and probabilities are derived from a number of sources including natural disasters (e.g., fire, flood, fire, seismic, high winds, tornado, hurricane, etc.) and human-caused events [52,53]. It is important to note the limitations on historical data due to climate change. Increasing climate changed has caused considerable changes in weather patterns and poses risk to military installations.
4.3.3. Step 3.3: Develop Microgrid and Nanogrid Threat Scenarios
Table 6 and Table 7 matrices illustrate the scenarios that are connected to each threat in order to determine nanogrid resilience compared to current microgrid resilience. Each “X” in the tables is an indication of a specific piece of equipment being unavailable, offline, or destroyed within the specific threat scenario.
Table 6.
Microgrid Threat Scenarios. The microgrid components that are offline, unavailable, or destroyed in each threat scenario are represented by an “X.”
Table 7.
Nanogrid Threat Scenarios. The nanogrid components that are offline, unavailable, or destroyed in each threat scenario are represented by an “X.”
Figure 7 illustrates the operational concept view for a threat of a fire. This illustrates that a fire can effect more than just the loads compromised and is dependent on the situation. The fire threat scenario assumes that the spread of the fire was able to be stopped on the north-east side of base and did not impact any of the power lines to the rest of the base.
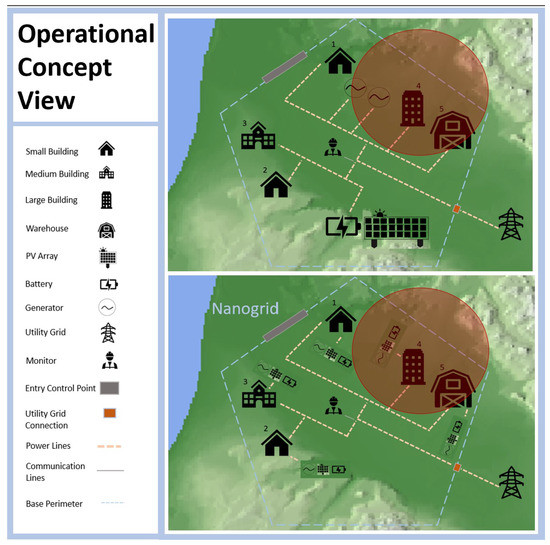
Figure 7.
Threat of Fire Operational Concept View. The large shaded red circle indicates area destroyed by fire. In the microgrid scenario (top), the fire destroys the warehouse and large office building (Critical Loads 4 and 5), and both diesel generators. In the nanogrid scenario, the same buildings and associated nanogrids are destroyed.
4.4. Step 4: Calculate Resilience
4.4.1. Step 4.1: Simulate Nanogrid Systems
The threat scenarios are then simulated in MATLAB. Referring back to Section 2.3 (Energy Resilience) all associated equations (Equations (1) and (2)) are embedded within the MATLAB code. While we used MATLAB, the simulations can be developed in almost any programming language desired.
4.4.2. Step 4.2: Check for Unacceptable Load Shed
The number of hours load shed for each threat scenario results in no risk to national security. All scenarios simulated within the proposed nanogrid only load shed the applicable loads that are directly impacted by the threat (e.g., the load is destroyed) and keeps the remaining critical loads online throughout the 14 day mission. The insider threat scenario shows the microgrid shedding all five critical loads for approximately 200 h of a 336 h mission. This places national security at risk. However, the proposed nanogrid architecture is able to maintain all critical loads not directly impacted in spite of the insider threat.
4.4.3. Step 4.3: Calculate Mission Impact Across All Threats
Table 8 shows the resulting mission impacts ().
Table 8.
Mission Impact Simulation Results. The Mission Impact () values for the nanogrid and microgrid architectures are shown for each threat. The bold values indicate the lower mission impact (less impactful, better) outcome. In all cases, the nanogrid either performs the same or better than the microgrid architecture.
We use Equation (3) to calculate the EEDMI of the proposed nanogrid to compare resilience against the existing microgrid. Table 9 shows the resulting EEDMI for the existing microgrid and proposed nanogrid.
Table 9.
EEDMI Simulation Results. These values are resilience measurements for each threat scenario and are compared between the existing microgrid and the potential nanogrid configuration. Bold values indicate lower (preferred) outcomes.
Overall the simulation results show that nanogrids improve EEDMIscores for a threat of an explosion, an insider threat, and plane crash, where both nanogrids and the baseline microgrid see similar resilience for all remaining threats. It is important to note that because of appropriate DER scaling for both existing microgrid and proposed nanogrid infrastructures, the loss of all diesel generators, the loss of all PV generation, and a disruption in fuel delivery do not impact resilience. However, if diesel generators, and PV and ESS were not appropriately sized to provide redundant generating capacity, this would not be the case. Having redundant generation capacity is realistic because many military bases already have redundant generation capacity already installed–in some cases redundant generation capacity can be an order of magnitude higher than average base loads.
4.5. Step 5: Analyze Results
Based on the results of Step 4, the case study moves forward and does not need iteration at this point. The proposed nanogrids are as or more resilient than the existing microgrid. Because of the SCADA system deployed at the military installation, and location of runways for military aircraft, cyber attacks and plane crashes can impact both the microgrid and proposed nanogrids. It is important for the base energy manager and stakeholders to stay one step ahead and test all vulnerable SCADA systems within any base energy system, and continually upgrade cyber security.
4.6. Step 6: Produce Final Design Recommendations
Are Stakeholder Requirements Met? Final recommendations for the case study conclude that stakeholders from the base command, tenant commands, local energy companies, microgrid provider, maintenance personnel, and chain of command all have their requirements met with the proposed nanogrid design. The nanogrid design validates top level functional requirements of: generate power, distribute power, control power, and store energy.
Is Funding Available? Improving resilience by implementing nanogrids on critical loads within the current base microgrid structure is determined to be effective for a majority of the threat scenarios. We make the assumption that funding is available to implement the nanogrids rapidly and that no selection of specific nanogrids based on available funding needs to occur. Note that we explicitly did not conduct cost analysis within the proposed methodology. However, base energy managers often conduct cost studies when choosing between different potential energy system upgrades. The case study does not mention if funding is available because this is often encountered in the acquisition process of program upgrades and is beyond the scope of this research. This research focuses on how to improve military installation energy resilience.
5. Discussion and Future Work
This paper presents a methodology that can be used to determine if supplementing existing microgrids on military bases with nanogrids may improve energy resilience. Through proper sizing of generation and storage resources, it is possible for nanogrids to eliminate or greatly reduce many of the energy disruptions to critical loads that can impact national security on military bases. We believe that the methodology will aid base energy managers in identifying which critical loads will benefit from implementing nanogrids for specific threats that are of concern to individual military bases. While we advocate for some threats to be analyzed in all cases, many threats are not universal across all bases. Thus, we assert that there is not universal guidance on which loads should or should not be outfitted with nanogrids.
The methodology is specifically meant as a high-level systems engineering analysis of existing microgrid infrastructure and proposed nanogrid infrastructure. The time step on the simulations in the case study is 1 h. This large time step and the simple power flow model ignore real concerns such as transients that can trip protection equipment; the ability of specific generation and storage equipment, and power electronics hardware to be grid-forming; and other issues. If implementing nanogrids at a specific military base proves promising based on the results produced by the methodology, then detailed electrical engineering analysis should be conducted to verify no other concerns exist.
Developing threat probabilities can be challenging especially for human-caused threats and even more so for situations where adversaries are involved. Producing detailed methods of estimating such probabilities are beyond the scope of this work. Natural disasters and other nature-caused threats have significant historical data available to estimate their probabilities of occurrence. However, climate change and other related factors may begin to call into question using historical data to estimate future probabilities of occurrence of natural threats.
We specifically do not address the cost of increasing energy resilience through the implementation of nanogrids. Other work has investigated the costs associated with increasing resilience and has attempted to produce energy resilience versus cost curves for decision-makers to understand how much resilience may be gained with a specific level of investment [35]. A potential future expansion of this work is to include cost analysis.
After recent events in Texas [3], we believe renewed focus will be placed on upgrading military microgrids to be more self-sufficient and not rely upon fossil fuels or regular fossil fuel delivery. Furthermore, price shocks in regional and global oil markets due to issues such as the closing of key sea lanes to tanker traffic have occurred in the past and are starting to occur as of writing this article due to things such as war and most recently a stuck cargo ship blocking a canal [70] can significantly impact military budgets. Removing highly variable diesel fuel bills from base energy manager budgets could be a significant stabilizing force on year-to-year management of energy infrastructure.
We use MDI scoring to understand the relative importance of critical loads to national defense. However, MDI has several significant flaws and other recently proposed metrics have their own issues. Future work needs to develop a new method of understanding how each load on a military base impacts national security. One potential avenue to explore is mission engineering where tying specific mission objectives to specific loads under specific force protection postures may help to produce a better measure.
6. Conclusions
We present a systems engineering methodology that is useful for conducting high level energy resilience analysis of military base energy infrastructure to determine if implementing nanogrids within an existing microgrid helps to protect electrical loads critical to national security from power outages. The methodology takes into account threats that are of specific interest to the military such as adversary actions and terrorist attacks. Rather than focusing on reducing energy cost during nominal conditions (as most civilian energy analyses attempt to achieve), our method focuses on improving resilience to threats.
A case study is presented of a fictionalized Naval Support Activity Monterey military base where the Naval Postgraduate School is located. Several threats of interest to all military bases and of specific interest to military bases located on coastal California are analyzed against a proposed microgrid with nanogrid augmentation using the method. This case study demonstrates how the methodology can help a base energy manager to select an appropriate nanogrid and show the feasibility of the nanogrid in improving energy resilience of specific critical loads from a national security perspective as compared to existing microgrid infrastructure.
Author Contributions
Conceptualization, A.K., D.L.V.B., and A.P.; methodology, A.K., D.L.V.B., and A.P.; software, A.K.; validation, A.K., D.L.V.B., and A.P.; formal analysis, A.K., D.L.V.B., and A.P.; investigation, A.K., D.L.V.B., and A.P.; resources, D.L.V.B. and A.P.; data curation, D.L.V.B. and A.P.; original draft preparation, A.K.; writing—review and editing, A.K., D.L.V.B., and A.P.; visualization, A.K.; supervision, D.L.V.B. and A.P.; project administration, D.L.V.B.; funding acquisition, D.L.V.B. and A.P. All authors have read and agreed to the published version of the manuscript.
Funding
This research received no external funding.
Acknowledgments
This research is partially supported by the Naval Postgraduate School. Any opinions or findings of this work are the responsibility of the authors, and do not necessarily reflect the views of the sponsors or collaborators. Approved for Public Release; distribution is unlimited.
Conflicts of Interest
The authors declare no conflict of interest.
References
- Vine, D. Where in theWorld Is the U.S. Military? Available online: https://www.politico.com/magazine/story/2015/06/us-military-bases-around-the-world-119321.html (accessed on 25 August 2020).
- Giachetti, R.; Van Bossuyt, D.; Parker, G.; Peterson, C. Systems Engineering Issues in Microgrids for Military Installations. Incose Int. Symp. 2020, 1–16. [Google Scholar] [CrossRef]
- Douglas, E. ERCOT: Texas Was “Seconds and Minutes” away from Catastrophic Months-Long Blackouts. Texas Tribune, 18 February 2021. Available online: https://www.texastribune.org/2021/02/18/texas-power-outages-ercot (accessed on 1 March 2021).
- Goss, M.; Swain, D.L.; Abatzoglou, J.T.; Sarhadi, A.; Kolden, C.A.; Williams, A.P.; Diffenbaugh, N.S. Climate change is increasing the likelihood of extreme autumn wildfire conditions across California. Environ. Res. Lett. 2020, 15, 094016. [Google Scholar] [CrossRef]
- Beaton, D. Testing Whether Distributed Energy Storage Results in Greater Resilience of Microgrids. Master’s Thesis, Naval Postgraduate School, Monterey, CA, USA, 2021. [Google Scholar]
- Naval Facilities Engineering Command. NAVFAC P-602 Instruction: 3 Pillars of Energy Security; Naval Facilities Engineering Command: Washington Navy Yard, DC, USA, 2017.
- Conger, J. An Overview of the DOD Installations Enterprise. Herit. Found. 2019, 47–59. Available online: https://www.heritage.org/military-strength-topical-essays/2019-essays/overview-the-dod-installations-enterprise (accessed on 20 November 2020).
- Savena, M. P-601 Microgrid Design Guide; Naval Facilities Engineering Command: Washington Navy Yard, DC, USA, 2016. [Google Scholar]
- Department of Defense. Title 10 Armed Forces; United States Government Publishing Office: Washington, DC, USA, 2011; Volume 17, pp. 1759–1763. [Google Scholar]
- Ton, D.; Smith, M. The U.S. Department of Energy’s Microgrid Initiative. Electr. J. 2012, 25, 84–94. [Google Scholar] [CrossRef]
- Baran, M.; Mahajan, N. System Reconfiguration on Shipboard DC Zonal Electrical System. IEEE Electr. Ship Technol. Symp. 2005, 14, 86–92. [Google Scholar]
- Díaz-González, F.; Sumper, A.; Gomis-Bellmunt, O. Energy Storage in Power Systems; John Wiley & Sons: Chichester, UK, 2016. [Google Scholar]
- Hatziargyriou, N. Microgrids: Architectures and Control; John Wiley & Sons: Athens, Greece, 2014. [Google Scholar]
- Guerrero, J.; Chandorkar, M.; Lee, T.; Chiang Loh, P. Advanced Control Architectures for Intelligent Microgrids-Part 1: Decentralized and Hierarchical Control. IEEE Trans. Ind. Electron. 2013, 60, 1254–1262. [Google Scholar] [CrossRef]
- Jiayi, H.; Chuanwen, J.; Rong, X. A review on distributed energy resources and Microgrid. Renew. Sustain. Energy Rev. 2007, 12, 2472–2483. [Google Scholar] [CrossRef]
- Hirsch, A.; Parag, Y.; Guerrero, J. Microgrids: A review of technologies, key drivers, and outstanding issues. Renew. Sustain. Energy Rev. 2018, 90, 402–411. [Google Scholar] [CrossRef]
- Werth, A.; Kitamura, N.; Tanaka, K. Conceptual Study for Open Energy Systems: Distributed Energy Network Using Interconnected DC Nanogrids. IEEE Trans. Smart Grid. 2015, 6, 1621–1630. [Google Scholar] [CrossRef]
- Burmester, D.; Rayudu, R.; Seah, W.; Akinyele, D. A review of nanogrid topologies and technologies. Renew. Sustain. Energy Rev. 2017, 67, 760–775. [Google Scholar] [CrossRef]
- Nordman, B.; Christensen, K. Local power distribution with nanogrids. In Proceedings of the 2013 International Green Computing Conference Proceedings, Arlington, VA, USA, 27–29 June 2013. [Google Scholar] [CrossRef]
- Airoli, P.; Kondratiev, I.; Dougal, R.A. Controlled power sequencing for fault protection in DC nanogrids. In Proceedings of the 2011 International Conference on Clean Electrical Power (ICCEP 2011), Ischia, Italy, 14–16 June 2011. [Google Scholar] [CrossRef]
- Rickerson, W.; Gillis, J.; Bulkeley, M. The Value of Resilience for Distributed Energy Resources: An Overview of Current Analytical Practices; National Association of Regulatory Utility Commissioners: Washington, DC, USA, 2019. [Google Scholar]
- Peterson, C.; Van Bossuyt, D.; Giachetti, R.; Oriti, G. Analyzing Mission Impact of Military Installations Microgrid for Resilience. J. Syst. Eng. 2021. In Review. [Google Scholar]
- Rusco, F.; Lepore, B.J. DOD Renewable Energy Projects: Improved Guidance Needed for Analyzing and Documenting Costs and Benefits; United States Government Accountability Office: Washington, DC, USA, 2016. [Google Scholar]
- Hathaway, T. Microgrid Knowledge: Putting a Dollar Value on Energy Resiliency for US Military. Microgrid Knowledge, 1 July 2019. Available online: https://microgridknowledge.com/value-energy-resiliency-military/ (accessed on 28 February 2021).
- Cornell Law School Legal Information Institute. 10 U.S. Code 101 Definitions. Available online: https://www.law.cornell.edu/uscode/text/10/101#e_6 (accessed on 22 February 2021).
- Giachetti, R.; Van Bossuyt, D.L.; Oriti, G.; Anderson, W. Resilience and Cost Tradespace for Microgrids on Islands. IEEE Syst. J. 2021. In Review. [Google Scholar]
- Giraldez, J.; Booth, S.; Anderson, K.; Massey, K. Valuing Energy Security: Customer Damage Function Methodology and Case Studies at DOD Installations; National Renewable Energy Laboratory: Golden, CO, USA, 2012. [Google Scholar]
- Smith, C.W. Mission Dependency Index of Air Force Built Infrastructure: Knowledge Discovery with Machine Learning. Master’s Thesis, Department of the Air Force Air University, Montgomery, AL, USA, 2016. [Google Scholar]
- Kujawski, E.; Miller, G. The Mission Dependency Index: Fallacies and Misuses. Incose Int. Symp. 2009, 19, 1565–1580. [Google Scholar] [CrossRef]
- Call, S. Navy’s Energy Mission Integration Group (EMIG) Overview. 2019. Available online: https://www.energy.gov/sites/prod/files/2019/05/f62/17-fupwg-spring-2019-call.pdf (accessed on 20 January 2021).
- Herster-Dudley, M.R. Building Resilience Within DoD Microgrids by Considering Human Factors in Recovery Procedures. Master’s Thesis, Naval Postgraduate School, Monterey, CA, USA, 2021. [Google Scholar]
- Peterson, C. Systems Architecture Design and Validation Methods for Microgrid Systems. Master’s Thesis, Naval Postgraduate School, Monterey, CA, USA, 2019. [Google Scholar]
- International Atomic Energy Agency. Defining Initiating Events for Purposes of Probabilistic Safety Assessment; International Atomic Energy Agency: Vienna, Austria, 1993. [Google Scholar]
- Hyder, A.K.; Wiley, R.L. Spacecraft Power Technologies: Chapter 1; Imperial College Press: London, UK, 2000. [Google Scholar]
- Hildebrand, J. Estimating the Life Cycle Cost of Microgrid Resilience. Master’s Thesis, Naval Postgraduate School, Monterey, CA, USA, 2020. [Google Scholar]
- Schonbergerschonberger, J.; Duke, R.; Round, S.D. DC-Bus Signal.: A Distrib. Control Strategy A Hybrid Renew. Nanogrid. IEEE Trans. Ind. Electron. 2006, 1453–1460. [Google Scholar] [CrossRef]
- Antonysamy, S.; Murugasan, S.; Simon, E. Future Nano-grid technologies and its implementation challenges for Smart Cities. IOP Conf. Ser. Mater. Sci. Eng. 2020, 955, 012002. [Google Scholar] [CrossRef]
- Jin, Z.; Sulligoi, G.; Cuzner, R.; Meng, L.; Vasquez, J.; Guerrero, J. Next-Generation Shipboard DC Power System: Introducing Smart Grid and DC Micgrogrid Technologies into Maritime Electrical Networks. IEEE Electrif. Mag. 2016, 4, 45–57. [Google Scholar] [CrossRef]
- Pilehvar, M.; Shadmand, M.; Mirafzal, B. Analysis of Smart Loads in Nanogrids. IEEE Access 2018, 7, 548–562. [Google Scholar] [CrossRef]
- Shevchenko, J. An Introduction to Model-Based Systems Engineering (MBSE). 2020. Available online: https://insights.sei.cmu.edu/sei_blog/2020/12/an-introduction-to-model-based-systems-engineering-mbse.html (accessed on 15 January 2021).
- Ertaul, L.; Hao, J. Enterprise security planning with department of defense architecture framework (DODAF). In Proceedings of the International Conference on Security and Management (SAM), Citeseer, Las Vegas, NV, USA, 12–15 July 2011; p. 1. [Google Scholar]
- Derevyanko, V. Array Losses, General Considerations. Available online: https://www.pvsyst.com/help/index.html?array_losses.htm (accessed on 5 January 2021).
- Thornberry, M.; Smith, A. Insider Threats: DOD Should Improve Information Sharing and Oversight to Protect U.S. Installations; Technical Report; U.S. Government Accountability Office: Washington, DC, USA, 2015. [Google Scholar]
- Nelson, K. Fire Danger Forecast: Map of Large Fire Probability. Available online: https://www.usgs.gov/ecosystems/lcsp/fire-danger-forecast/map-large-fire-probability (accessed on 2 February 2021).
- Litzenberg, E. America Wildland–Urban Interface Burning: A Modern Application of A Historic Success. Master’s Thesis, Naval Postgraduate School, Monterey, CA, USA, 2020. [Google Scholar]
- Monterey County Weekly Staff. 2020 Wildfires in Monterey County; Monterey County Weekly: Seaside, CA, USA, 2020. [Google Scholar]
- Skelton, I. Combating Terrorism: Action Taken but Considerable Risks Remain for Overseas; U.S. Government Accountability Office: Washington, DC, USA, 2000. [Google Scholar]
- Rempfer, K. Paratrooper Killed by Vehicle-Borne IED Has Been Identified. 2019. Available online: https://www.armytimes.com/news/your-army/2019/09/06/paratrooper-killed-by-vehicle-borne-ied-has-been-identified/ (accessed on 6 January 2021).
- CNN Editorial Research. Beirut Marine Barracks Bombing Fast Facts; CNN Editorial Research: Atlanta, GA, USA, 2020. [Google Scholar]
- Andrews, A. Department of Defense Fuel Spending, Supply, Acquisition, and Policy; Technical Report; U.S. Government Accountability Office: Washington, DC, USA, 2009. [Google Scholar]
- Papakonstantinou, N.; Van Bossuyt, D.; Linnosmaa, J.; Hale, B.; O’Halloran, B. A Zero Trust Hybrid Security and Safety Risk Analysis Method. Am. Soc. Mech. Eng. 2021. [Google Scholar] [CrossRef]
- Sancaktar, S.; Ng, C. Risk Assessment of Operational Events: External Events; United States Nuclear Regulatory Commission: Washington, DC, USA, 2017. [Google Scholar]
- Wielenberg, A.; Alzbutas, R.; Apostol, M.; Bareith, A.; Brac, P.; Burgazzi, L.; Cazzoli, E.; Cizelj, L.; Hage, M.; Hashimoto, K.; et al. Methodology for Selecting Initiating Events and Hazards for Consideration in an Extended PSA; Technical Report; ASAMPSA E and EURATOM: Brussels, Belgium, 2016. [Google Scholar]
- Goldman, D. The U.S. Military Is Terrified of Climate Change. It’s Done More Damage than Iranian Missiles. NBC News, 2020. Available online: https://www.nbcnews.com/think/opinion/u-s-military-terrified-climate-change-it-s-done-more-ncna1240484 (accessed on 22 March 2021).
- Conger, J. Prioritizing Climate & Security in DoD. In Proceedings of the NPS Climate & Security Speaker Series, Monterey, CA, USA, 7 April 2021. [Google Scholar]
- Office of Energy Efficiency and Renewable Energy. DOE Commercial Reference Building; Office of Energy Efficiency and Renewable Energy: Washington, DC, USA, 2012.
- National Renewable Energy Laboratory. National Solar Raidation Data Base 1991–2010; National Renewable Energy Laboratory: Golden, CO, USA, 2019.
- Antelman, A.; Dempsey, J.; Brodt, B. Mission Dependency Index: A Metric for Determining Infrastructure Criticality. In Infrastructure Reporting and Asset Management: Best Practices and Opportunities; Amekudzi, A., McNeil, S., Eds.; American Society of Civil Engineers: Reston, WV, USA, 2008; Chapter 19; pp. 141–146. [Google Scholar] [CrossRef]
- Cummins. Quiet Connect Series-RS13A, RS17A, RS20A, & RS20AC; Cummins: North Columbus, IN, USA, 2015. [Google Scholar]
- GENERAC Power Systems Inc. Standby Generators Liquid-Cooled Gaseous Engine (80kW); GENERAC Power Systems Inc.: Waukesha County, WI, USA, 2017. [Google Scholar]
- GENERAC Power Systems Inc. Industrial Diesel Generator Set: EPA Certified Stationary Emergency; GENERAC Power Systems Inc.: Waukesha County, WI, USA, 2016. [Google Scholar]
- GENERAC Power Systems Inc. Protector Series: Standby Generators Liquid-Cooled Gaseous Engine (60kW); GENERAC Power Systems Inc.: Waukesha County, WI, USA, 2017. [Google Scholar]
- Unified Facilities Criteria. Engine-Driven Generator Systems for Prime and Standby Power Applications; Technical Report; U.S. Department of Defense: Washington, DC, USA, 2019. [Google Scholar]
- Sanchez-Mateos, J. Reliability-Constrained Microgrid Design. Master’s Thesis, KTH School of Electrical Engineering, Stockholm, Sweden, 2016. [Google Scholar]
- Bryan, J.; Duke, R.; Round, S. Decentralized generator scheduling in a nanogrid using DC bus signaling. In Proceedings of the IEEE Power Engineering Society General Meeting, Denver, CO, USA, 6–10 June 2004. [Google Scholar] [CrossRef]
- Stouffer, K.; Pillitteri, V.; Lightman, S.; Abrams, M.; Hahn, A. Guide to Industrial Control Systems (ICS) Security; NIST Special Publications: Gaithersburg, MD, USA, 2015. [Google Scholar]
- Campbell, R. Electric Grid Cybersecurity; Technical Report; Congressional Research Service: Washington, DC, USA, 2018. [Google Scholar]
- Lee, R.; Assante, M.; Conway, T. Analysis of the Cyber Attack on the Ukrainian Power Grid; Technical Report; SANS Industrial Control Systems and Electricity Information Sharing and Analysis Center, E-ISSAC: Washington, DC, USA, 18 March 2016. [Google Scholar]
- The Associated Press. Hydraulic Failure Caused F-16 Crash into California Warehouse; Air Force Times: Vienna, VA, USA, 23 April 2020. [Google Scholar]
- Lee, J. What a Long Suez Canal Closure Means for the Oil Price. Bloomberg, 2021. Available online: https://www.bloomberg.com/opinion/articles/2021-03-25/suez-canal-blocked-what-a-lengthy-closure-will-mean-for-the-oil-price (accessed on 17 April 2021).


Publisher’s Note: MDPI stays neutral with regard to jurisdictional claims in published maps and institutional affiliations. |
© 2021 by the authors. Licensee MDPI, Basel, Switzerland. This article is an open access article distributed under the terms and conditions of the Creative Commons Attribution (CC BY) license (https://creativecommons.org/licenses/by/4.0/).