1. Introduction
In the past 40 years, the frequency and intensity of extreme weather have increased significantly due to global climate change, posing a huge threat to the survival and development of mankind. It has also become the consensus of the international community to reduce carbon emissions and reduce global climate change. In recent years, countries and intergovernmental organizations around the world have taken a series of measures to promote climate change governance, demonstrating the active efforts of all mankind in tackling climate change. On 22 September 2020, Chinese President Xi Jinping delivered an important speech at the general debate of the 75th United Nations General Assembly and announced that China will adopt more powerful policies and measures to strive to reach the peak of carbon dioxide emissions by 2030. Strive to achieve carbon neutrality by 2060 [
1]. This commitment by China is a milestone event in the global collaborative response to climate change, and it also ushered in a new era in which China’s energy system, economic system, and technological innovation system are driven towards a green transition with the goal of carbon neutrality.
As the second largest economy in the world, China’s economy was less than 10 trillion yuan 20 years ago. In 2018, the total economic volume exceeded 90 trillion yuan, and GDP grew by 6.6% year-on-year. At present, the current situation of China’s economy has been regarded as a medium-to-high-speed growth. Compared with developed countries such as Europe and the United States, China’s carbon neutralization process faces more severe challenges such as large carbon emissions, a high proportion of fossil energy in the energy structure, and a short time between carbon peak and carbon neutrality. China is currently the world’s largest carbon dioxide emitter. In 2019, China’s carbon dioxide emissions accounted for 29.4% of the world’s total emissions, more than the United States (14.4%), India (6.9%) and Russia (4.5%) combined [
2]. As shown in
Figure 1, China’s total primary energy production and total energy consumption are increasing year by year. Energy consumption has gradually exceeded the total primary energy production, and it needs to rely on imported energy and other secondary energy. In the current complex international situation, mastering the right to carbon emissions is essentially mastering the opportunity for future development. The development of any technology is inseparable from the support of energy. Old-brand capitalist countries such as Europe and the United States have revolutionized their productivity through the industrial revolution in recent centuries, and they have emitted carbon dioxide and become developed countries [
3]. At present, they have reached the peak of carbon and are gradually moving towards carbon neutrality. The country has not yet reached its carbon peak, and China’s annual carbon dioxide emissions are still increasing year by year. China faces more difficulties and challenges in achieving carbon neutrality than developed countries. China’s energy demand is large and has not reached its peak. The proportion of industrial energy consumption is high and the power supply structure is dominated by fossil energy such as coal. Transportation, construction, and big data The decarbonization technology of other industries has yet to be broken through [
4]. This is a problem that China has to solve in 30 years from carbon peak to carbon neutrality.
Liu Youbin, spokesperson of the Ministry of Ecology and Environment of China, announced at a press conference on 26 May 2021 that the national carbon market online trading will be launched before the end of June [
5]. China’s carbon market covers more than 4 billion tons of emissions, and will become the world’s largest carbon market covering greenhouse gas emissions [
5]. The establishment of a carbon trading system will form a signal for the price of carbon emissions throughout the society and lay the foundation for low-carbon transformation. Some organizations predict that with the financialization of the carbon trading market, carbon financial products such as carbon futures, carbon options, carbon funds, and carbon bonds will also appear on the basis of carbon asset spot such as carbon allowances and project emission reductions [
6]. As an indispensable chemical product in the construction and transportation fields, refrigerants will cause a large amount of carbon emissions during the life cycle of their production and use, and there is enough room for carbon reduction. In addition to optimizing different air-conditioning systems to reduce refrigerant leakage and loss, reducing the carbon emissions caused by the production of new refrigerants by recycling old refrigerants is also an important way to reduce carbon in the refrigerant industry. At the same time, through carbon quota management, companies can also get considerable returns from the carbon trading market and promote the development of low-carbon industries [
7].
The requirements for low-carbon development are not only closely related to the energy industry, but also inextricably linked to various industries in China’s industrial development. The direction of low-carbon development will have an incalculable impact on China’s economic development in the next few decades. Among them, the construction sector is one of the three major areas of energy consumption (industry, transportation, and construction). The hydrofluorocarbon and hydrochlorofluorocarbon refrigerants commonly used in building air conditioning are important components of non-carbon dioxide greenhouse gases. The greenhouse gas caused by the leakage of building-related refrigerants in China is equivalent to 100 million tons of carbon dioxide equivalent [
8]. Since the refrigerant used in vehicle air conditioners is in a moving and vibrating state for a long time, the leakage of refrigerant is more serious than that in building air conditioners.
China is currently the world’s largest producer and consumer of refrigeration equipment and refrigerants [
10]. Refrigeration and air conditioning are widely used in various industries in China’s national economy, national defense industry, and the improvement of people’s living standards. During the “13th Five-Year Plan” period, the average annual growth rate of the main business income of the refrigeration and air-conditioning industry is expected to reach 5% to 8% [
10]. More than one-third of the global demand for refrigerants comes from China. It is estimated that by 2030, the total refrigerant consumption of China’s refrigeration and air-conditioning industry will reach 154,000 to 178,000 tons [
11]. In the context of the vigorous development of refrigeration equipment and refrigerant production, the elimination and restriction of some refrigerants that have adverse effects on environmental pollution and climate warming are also underway [
12]. Refrigerants can only produce the greenhouse effect when they are discharged into the atmosphere. In order to meet people’s needs for a comfortable environment and the use of refrigerants, while reducing direct refrigerant emissions, the original waste refrigerant in the refrigeration system is recycled and regenerated. Refrigerant capacity quota is an effective means to reduce pressure and reduce refrigerant emissions [
13].
There are three main current carbon emission evaluation methods. Global warming potentials (GWP), to evaluate the greenhouse effect of refrigerants; Total equivalent warming impact (TEWI), to evaluate the climatic performance of refrigerants operating in a refrigeration system for a certain number of years; Life cycle climate performance (LCCP) is a comprehensive evaluation of the greenhouse effect during the operating life cycle of refrigerants and refrigeration systems. On the basis of TEWI, the LCCP evaluation index adds the influence of refrigerant and refrigeration system production and recovery process and refrigerant decomposition products on the greenhouse effect.
The refrigerant R134a is a common fluorinated greenhouse gas, which is widely used in automobile air-conditioning and refrigeration systems. The global warming potential (GWP) of 1 kg of R134a refrigerant directly discharged into the atmosphere without any treatment is equivalent to the greenhouse effect of releasing 1300 kg of carbon dioxide at the same time. CO
2 emission accounting is the basis for implementing emission reduction measures, formulating national emission reduction strategies, and conducting international verification and evaluation. CO
2 itself is not a pollutant that directly harms the atmosphere but a greenhouse gas. It harms the environment by causing the greenhouse effect. There is no universal detection system in the world now. International institutions such as the IPCC have developed methods to estimate national CO
2 emissions based on the consumption of carbon-containing fossil energy and the carbon content of the energy itself, and are widely used throughout the world [
14]. This article will focus on the production and recycling of refrigerants as the main research objects. Based on the survey data of a Chinese refrigerant manufacturer, the emission factor method will be used to calculate and analyze the carbon compensation benefits of refrigerant recycling compared to the production of new refrigerants.
2. Materials and Methods
2.1. Differences between This Study and Previous Studies
(1) The current calculation and research on greenhouse gas emissions in the refrigerant production process are mostly based on the maximum limit announced by the regulatory authority. Compared with the maximum limit of sanctions that will be taken by the regulatory authority, the greenhouse gas emissions in the actual production process of the factory are relatively low. Low. This article uses the actual production energy consumption data surveyed by a Chinese refrigerant manufacturer to conduct a more complete analysis of the raw materials and energy input and by-product emissions to the environment in the R134a production process.
(2) This study includes the energy required to convert raw materials into finished products, including all energy-related inputs and energy input in the production process of intermediate products, and includes efficiency losses, but does not include the energy of raw materials that are chemically converted into finished products.
2.2. Refrigerant Carbon Analysis Method
The CO
2 equivalent emissions caused by the consumption of a single fossil energy can be calculated using the emission factor method:
where C refers to the CO
2 equivalent emissions caused by the consumption of a single type of fossil energy, Q is the amount of fuel or gas that produces greenhouse gases, and R is the carbon emission factor, which represents the carbon content of the energy, and the quality, properties and combustion of the energy fuel. The efficiency of time is related [
14], and the carbon emission factor can be further decomposed as:
where EC is the energy content of the fuel used in the reactor or other machinery, GWP (kg CO
2 eq /J) is the carbon content of the unit calorific value of the fuel, and η is the oxidation rate level (combustion efficiency) of the fuel.
Using Formula (1), the carbon emissions caused by the consumption of a single type of fossil energy can be calculated. The global warming potential GWP can be calculated by adding the single GWP of carbon dioxide, methane, nitrous oxide and any other greenhouse gases emitted during the fuel combustion process.
The production process of chemical products involves the consumption of more than one type of fossil energy or secondary energy. The indirect greenhouse gas emissions caused by the consumption of various types of energy in the system can be calculated by the sum of the consumption and emissions of a single energy:
In the refrigerant production process, a variety of chemical raw materials and energy are involved in the reaction. The energy and different materials consumed in the reaction process are converted into the carbon emissions of the refrigerant production process by means of emission factors. At the same time, the production process of R134a is not directly synthesized from raw materials. It also involves the synthesis of a variety of common chemical products and intermediate products. The production process of intermediate products also consumes a lot of energy, which is converted into final products through the calculation of emission factors. Carbon emissions data.
The research method includes four steps: setting the system carbon emission boundary, determining the source of carbon emission, finding emission factors, and sorting out the carbon emission inventory. In the research process, it is necessary to determine the boundary of the system, that is, which parts of the refrigerant production process the system includes to determine the carbon emission process that needs to be calculated in the system, and appropriately simplify the system. Then determine the main source and emission form of carbon emissions according to the determined research system. Then find out the emission factors of each type of energy required according to the literature. Finally, a comprehensive calculation of carbon emission is carried out and a carbon emission inventory is compiled for analysis.
2.3. R134a Production Process
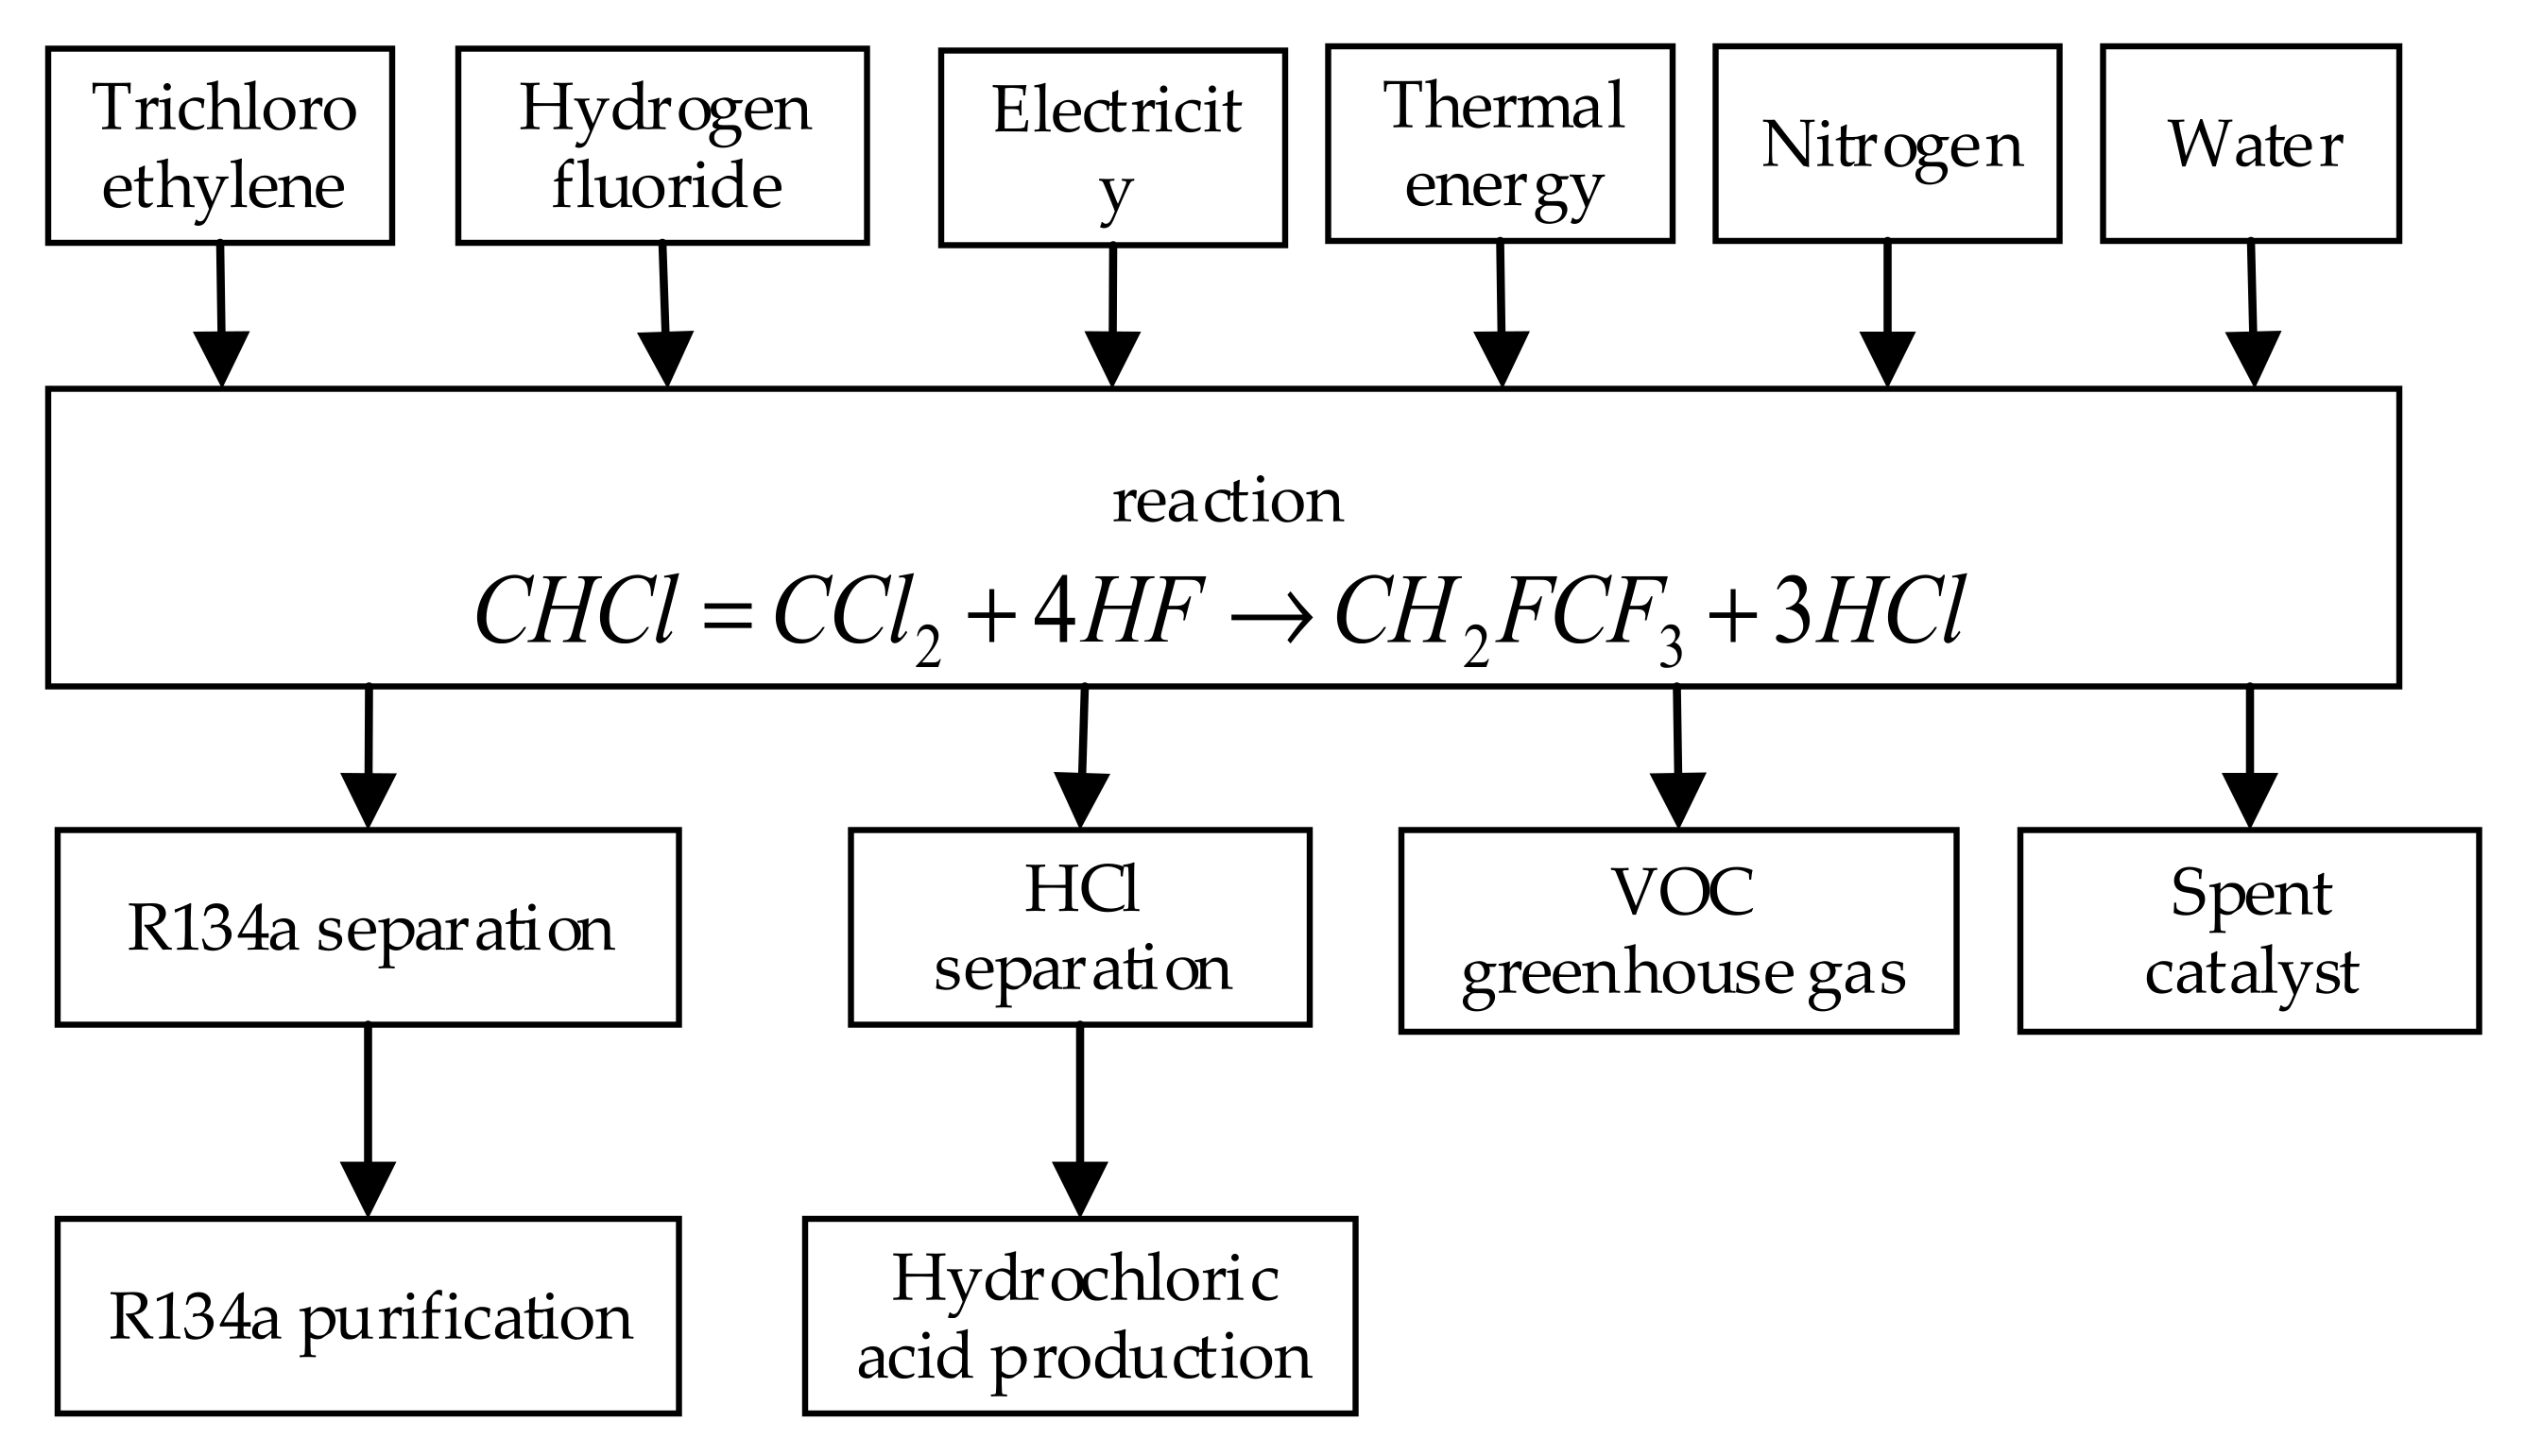
At present, most manufacturers of R134a use heterogeneous catalysts to fluorinate trichloroethylene with hydrogen fluoride in the gas phase process to produce R134a. The direct input and output of the R134a production process are shown in
Figure 2.
The direct reaction to produce R134a is divided into two stages and is completed under the action of solid metal oxide catalyst under high temperature and high pressure:
The first-stage reactor fluorinates the intermediate material trichloroethylene into R133a, and the conversion can be completed at one time. R133a does not need to be separated and stored in the reactor to wait for the next reaction. In the second stage, when fluorine is used to replace the last remaining chlorine substituent, the chemical reaction equilibrium will be biased toward the raw material end, so hydrogen chloride, the reaction product, needs to be removed, so that the reaction moves toward the product end equilibrium. The entire reaction process is completely closed, the intermediate product remains in the reactor, and the amount released into the atmosphere is very small, so it is not included in the calculation of greenhouse gas emissions. All gases that may enter the atmosphere will undergo thermal oxidation treatment. The gas emitted after the process will not contain ozone-depleting substances.
The main by-product of the reaction is hydrochloric acid, which can be sold directly. Other by-products that may be released into the environment are fluorinated volatile organic compounds (VOCs), including greenhouse gases and spent catalysts. The former is usually removed from the process exhaust gas stream by thermal oxidation treatment. Compared with the main raw materials, the amount of catalyst used in the reaction is very small, so it is not included in the calculation.
In the direct reaction, the sources of carbon raw materials are crude oil and natural gas, and ethylene is produced by pyrolyzing natural gas and refined oil products. Ethylene reacts with chlorine to be chlorinated into dichloroethane, which is then further chlorinated into trichloroethylene and tetrachloroethylene. Chlorine is produced by membrane electrolysis and mercury electrolysis in traditional chlor-alkali plants. The source of the fluorine raw material is fluorspar (a calcium fluoride mineral). Acid-grade fluorspar reacts with fuming sulfuric acid (a mixture of sulfuric acid and sulfur trioxide) to produce anhydrous hydrogen fluoride. Fuming sulfuric acid is made from mined sulfur ore. The production process of raw materials and intermediate products is shown in
Figure 3. Materials and energy input are taken into consideration in the production of these intermediate products.
In the literature, each ton of R134a requires about 1.3 tons of trichloroethylene and 0.8 tons of HF. It also requires electricity, heat (in the form of steam or natural gas), nitrogen, air, and water [
15]. Operation mode. The average production of R134a per ton requires 1.2 MWh of electricity, 28 GJ of thermal energy (from various sources), 0.5 ton of nitrogen, and 13 m
3 of water.
Different countries and factories have different production processes and raw material production methods and sources, resulting in certain differences in the energy consumption and carbon emissions of the final product. The source of the literature data referenced above is mainly Mcculloch A in 2003 The research results, the data is relatively old, and the research results are based on the global raw material trade in developed countries such as Europe and the United States. Based on this, this article cooperates with a well-known domestic refrigerant manufacturer to analyze the raw material consumption and electricity and heat input of the factory’s R134a refrigerant production workshop. The survey calculation is carried out, and the results are shown in
Section 3.1.
2.4. Determination of Carbon Emission Accounting Boundary and Emission Source
The production process of refrigerant R134a includes the direct production process and the production process of other intermediate products involved in the direct production. In each independent production process, there are inputs of various materials and energy in the system. Counting the energy input and material input in the entire system and analyzing and sorting can obtain the energy input status of the entire system.
System boundary: In the entire industrial chain of refrigerant production, not only the process of directly producing R134a by trichloroethylene and hydrogen fluoride through catalysis, but also the production process of all input materials and energy, the research system should include direct trichloroethylene, hydrogen fluoride, etc. The production process of materials, the production process of energy such as electricity and heat. At the same time, because the direct materials trichloroethylene and hydrogen fluoride are not produced by a single chemical process, the production process also includes other complex reactions, mineral exploration, and oil extraction. In the production process, other direct materials and energy input such as electricity and heat to produce other materials are also considered in the system. When the factory reaches the 20-year service life and the annual output of 10,000 tons [
16], the building energy input per ton of product and the environmental impact can be ignored. This article assumes that long-term operation or annual output is not less than 10,000 tons and building carbon emissions are not considered for the time being. At the same time, the carbon emissions caused by the transportation of intermediate products to factories and finished products to users are very small (less than 1%) [
15]. This article does not consider the carbon emissions of all raw materials, intermediate products and finished products emission.
Emission sources: The most important emission sources in chemical production are various types of energy consumption. Different processes require a large amount of energy input, and carbon emissions caused by various types of energy input and consumption account for a large proportion. In the direct and indirect production process of R134a, the main types of energy consumed include natural gas, electricity, coal, gas, fuel oil, water gas, etc. In addition to energy input, the system also inputs water, nitrogen, air, etc., because the production process of this part of the material consumes less energy, and the energy consumed by the input of water, nitrogen and air is not considered in the calculation process. The chemical energy contained in various raw materials is contained in the final product R134a through chemical reactions, and this part of the energy input is not considered.
The schematic diagram of the multi-level material and various energy inputs in the system is shown in
Figure 4.
In addition to the system included in
Figure 4, there are some other omitted factors, including the transportation energy consumption of various raw materials and energy used in refrigerant production, the transportation energy consumption of refrigerant products, and the building energy consumption of different equipment factories and chemical plants. Because the statistical difficulties of these factors have a low impact on the system, they are excluded from the system. The information used in the figure refers to
Table 1 and
Table 2.
4. Result: Emission List for the Whole Process of Refrigerant Production
Based on a typical monthly material and energy input data in a R134a production workshop of a refrigerant manufacturer in a cooperative investigation in
Section 3.1, this paper combines the energy consumption and material consumption of the intermediate product production process obtained by querying various documents in
Section 3.2 and sorts out and calculates the whole process of refrigerant R134a production. Energy consumption and carbon emissions are shown in
Table 3. Among them, different types of energy have different carbon emission factors R, and carbon emission factors are related to the quality, attributes and efficiency of energy fuels during combustion. Differences in the composition of energy fuels, energy utilization methods and energy utilization efficiency in different countries will lead to different countries. The difference in energy carbon emission factors between regions and regions. The emission factors used in this article refer to the data from the national greenhouse gas inventory report submitted by the Chinese government to the United Nations, which has a high degree of credibility. It should be noted that due to the limitation of the amount of data, the emission factors used in this article do not fully represent the types of energy consumed in the actual production process. For example, coal includes anthracite, bituminous coal, coking bituminous coal, lignite and other types. Only refer to the mean values of emission factors of various energy sources.
Table 1 shows the energy consumption and material consumption in the direct production process of R134a per ton.
Table 2 shows the material consumption and energy consumption in the production process of other intermediate materials.
Table 3 shows the energy consumption and carbon emissions per ton of R134a production process. This article uses the energy emission factor method to evaluate and calculate CO
2.
Table 3 uses the relevant energy consumption data of the substances in
Table 1 and
Table 2 are used for calculation. The data in
Table 3 uses the calculation methods in Formulas (1)–(3).
It can be seen from the data in the table that for every ton of R134a refrigerant produced, the direct and indirect energy consumption of the production process will cause 15.9 tons of CO
2 emissions, and the multi-stage composite carbon emission factor of the R134a production process is 15.9 kg CO
2 eq/kg. As shown in
Figure 5, the carbon emissions of various types of energy, in the production process of refrigerant R134a, the carbon emissions caused by the input of electrical energy accounted for the highest proportion, reaching 58.4%, and electrical energy is also one of the most widely used secondary energy sources.
5. Discussion: Refrigerant Recycling and Carbon Offset
The process of refrigerant treatment includes three parts: recovery, purification and regeneration. Refrigerant recovery refers to the process of extracting the refrigerant from the original equipment. Refrigerant purification refers to the process of removing impurities in the refrigerant one by one. Refrigerant regeneration refers to the process of recycling the refrigerant after recycling. The energy consumption of refrigerant recycling treatment equipment is mainly the power consumed by the heater and the power consumed by the compressor, and the main type of energy consumed is electric energy. Because there is no mature refrigerant recovery, purification and regeneration system available for experimentation, this article chooses the Beomseok refrigerant recovery machine (model BSE-1500A, an on-site refrigerant recovery machine) as a reference [
19]. The power marked on the nameplate is used as the energy consumption data for the refrigerant recovery and regeneration process. Reference source. The equipment weight of the recovery machine is 2420 kg, the recovery compressor power is 5.5125 kw, the condensing unit power is 5.5125 kw, and the basic power of the machine is 2.205 kw. When the machine starts the recovery mode, the recovery rate is 2100 kg/h (liquid refrigerant) and 164 kg/h (gas refrigerant), when the machine starts the regeneration mode, the regeneration rate is 90~100 kg/h. The calculation shows that it takes timeR = 10.5 h to regenerate 1 ton of refrigerant, and the total power consumption is 138.9kWh.
Calculate the emission factor with reference to the “US Greenhouse Gas Emission Inventory” issued by the US Environmental Protection Agency (EPA) [
20], the emission factor of electric energy is 1.35 kg CO
2 eq/kWh, and the regeneration of 1 ton of refrigerant will cause 0.188 CO
2 emissions per ton equivalent. From the calculation results, it can be seen that the use of recycling equipment to regenerate the refrigerant can reduce CO
2 emissions by 98.9% compared with re-production of the same amount of new refrigerant, which greatly reduces energy consumption and carbon emissions.
However, not all refrigerants produced in the year can be recycled and reused. Taking the refrigerant used in automobile air-conditioning systems as an example, referring to the relevant leakage data of the automobile air-conditioning system refrigerant R134a emission rating [
21], it is estimated that the average value of the regular leakage of R134a is 11.5 g/y, 17 g/y for unconventional refrigerant leakage [
22], the leakage caused by professional maintenance is about 35 g [
23], and the leakage caused by user maintenance is about 52 g [
23]. The amount of refrigerant leakage in the recycling process of each scrapped car is 100–450 g, and the remaining recyclable portion of the refrigerant in the actual air conditioner of each vehicle accounts for about 42.8% of the total refrigerant used in the life cycle of the refrigeration system. In 2019, the annual output of R134a refrigerant was 153,000 tons [
24]. If the production quota is entirely composed of newly produced refrigerants, the carbon emissions are estimated to be 2.432 million tons; if the annual output of R134a refrigerant is composed of newly produced refrigerants and recycled refrigerants. The two parts are composed of 107,000 tons of new refrigerants and 46,000 tons of recycled refrigerants. As shown in
Figure 6, the estimated carbon emissions are 1.849 million tons, and the emission reduction rate is 29.7%.


