Abstract
Three-dimensional finite element (FE) simulations were performed to further develop the Swedish design guidelines for geogrid-reinforced timber pile-supported embankments, also known as lightly piled embankments. Lightly piled embankments are constructed mainly in areas which typically have highly compressible soils, and the method utilises untreated timber piles as its key feature. The timber piles are installed in a triangular arrangement instead of the more common square arrangement, with a centre-to-centre distance of 0.8–1.2 m. The aim of this study was to evaluate the current standard using FE modelling setups with square and triangular pile arrangements with varying centre-to-centre distances, based on a typical road foundation case. The evaluation mainly focused on comparing the embankment settlements, as well as the load and stress distribution in the embankment, the piles and the geosynthetic reinforcement. As part of the evaluation, a state-of-the-art study was done on international design guidelines and analytical models. From the FE simulations, no evident difference in mechanical behaviour was found between the triangular and square piling patterns. The maximum allowed centre-to-centre distance between piles can potentially be increased to 1.4 m, decreasing the number of piles by as much as one third.
1. Introduction
Piled embankments with basal reinforcement are widely used as a foundation method for roads and railways on soft soils. This foundation method, known as geosynthetic-reinforced pile-supported embankment (GRPSE), has a short construction time and creates an efficient reduction of both the vertical and the horizontal displacements. The geosynthetic reinforcement used in GRPSE consists of one or more layers of woven textiles or synthetic polymeric textiles or grids. Currently there is some uncertainty in the Swedish industry concerning the optimum design of GRPSE with untreated timber piles, also called the lightly piled embankment method. The uncertainty lies in the optimal centre-to-centre pile spacing and pile arrangement, as well as the need for geosynthetic reinforcement to fulfil the serviceability state of the road or railway construction. The lightly piled embankment method is currently used in Sweden mainly for loose clays and silts, with untreated timber piles as its key feature. The method is used solely for settlement reduction, as the increase in stability is not considered in current Swedish practice. The goal of the Swedish Transport Administration is to make the method an accepted and widely used road and railway foundation option for soft soils, as timber piles are more sustainable than steel and concrete piles.
Aside from Sweden, timber piles are also widely used in the US, Canada, Australia, and the Netherlands [1]. Notable GRPSE projects with timber piles include the Kyoto Road in Giessenburg, the Netherlands [2] and the Port Mann Highway 1 Improvement Project in Vancouver, British Columbia, Canada [3]. However, Sweden is the only country with an explicit standard or recommendation for GRPSE with untreated timber piles. In Indonesia, there exist guidelines for thinner timber piles (8–10 cm in diameter) or bamboo piles [4].
The aims of the main project, of which the present study is part, are to clarify the mechanical behaviour of lightly piled embankments and to create a guide for optimal design for different conditions that involve road or railway embankments on soft subsoil. The focus of this project is on Swedish conditions with soft clay or silt layers on glacial till. However, similar conditions are frequently found globally, making the results of the project applicable outside of Sweden as well. A theoretical analysis of the construction was performed based on three-dimensional (3D) finite element (FE) modelling, verified by field and laboratory experiments.
The aims of the present study in this paper are: (1) to find the key mechanisms of load transfer in GRPSE; (2) to make a first evaluation of the efficiency of a triangular pile arrangement in comparison with a square pile arrangement; and (3) to evaluate appropriate centre-to-centre pile spacing. To accomplish these aims, 3D FE simulations were primarily used. The numerical results from FE simulations were compared and validated against results from analytical models. A state-of-the-art study was carried out on the mechanisms of the load transfer in GRPSE, as well as the GRPSE standards and analytical models used in practice. The FE simulations done in this study were based on a lightly piled road embankment northwest of Luleå in northern Sweden, 110 km south of the Arctic Circle. The road was initially constructed in 1993 as an unreinforced embankment and was later reinforced in 2013–2014 with timber piles and GR after it suffered from large settlements (2 m at the most). The subsoil consists of, on average, 13 m of loose sulphide soil on top of a silty glacial till. The groundwater is situated at a level of 0.5 m below the ground. Figure 1 shows a cross section of the modelled piled embankment, based on the blueprints of the constructed embankment.
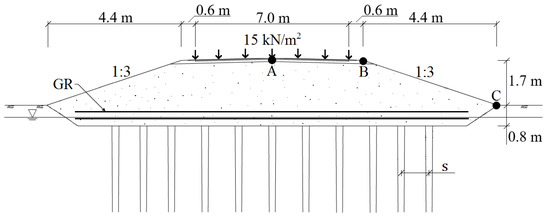
Figure 1.
Cross section of the modelled road embankment. Displacement evaluated in points A, B and C.
2. Geosynthetic-Reinforced Pile-Supported Embankments
The key concept of GRPSE and piled embankments in general is the “arching effect”, defined by Terzaghi [5] as the “transfer of pressure from a yielding mass of soil onto adjoining stationary parts”. This implies that the stress on the soil beneath the arch is reduced. The load is instead concentrated on the stationary parts (the piles), leading to the load being distributed on the shaft and toe of the pile instead of the soft subsoil.
The current common view on load distribution in GRPSE, according to the works by, e.g., Le Hello and Villard [6], Satibi [7], Van Eekelen [8], Zhang et al. [9] and Van Eekelen and Han [10], is illustrated in Figure 2. The resulting load on the pile heads () is the sum of the arching and membrane effects. The membrane effect is the ability of the GR to support (or absorb) forces that act perpendicular to its surface through tension from deformation [11]. The load distribution in Figure 2 is a simplification, e.g., the soil beneath the arches interacts with the upper structure and the actual shape of the arches is debated, as discussed later in this paper.

Figure 2.
Illustration of the load distribution in a geosynthetic-reinforced pile-supported embankment (GRPSE).
The current knowledge on GRPSE lacks extensive comparisons of square and triangular pile arrangements. To the best of the authors’ knowledge, the small-scale experiment by Esmaeili and Khajehei [12] and the FE analysis by Wijerathna and Liyanapathirana [13] are the only studies which compare square and triangular arrangements of piles or columns. Esmaeili and Khajehei [12] observed similar embankment support in terms of tolerated vertical load and settlement reduction between the two arrangements of deep mixing columns. The experiment was performed with an unreinforced embankment, i.e., no GR was used. For a geosynthetic-reinforced embankment on concrete columns, Wijerathna and Liyanapathirana [13] showed lower settlements in the case of triangular arrangement. It should be noted that the tributary area in both studies was smaller for the triangular arrangement than for the square arrangement, resulting in a larger column-to-soil ratio in the triangular case.
3. Light Embankment Piling
Light embankment piling is often used along the northern coast of Sweden as a foundation method for roads and railways on sulphide soil. The sulphide soil types range mostly from clay to silt and can be found worldwide in coastal floodplains and intertidal swamps [14]. Sulphide silts and clays pose a geotechnical problem, as they are loose to very loose and highly compressible, with a low shear strength of 10–20 kPa [15]. The organic material binds water, typically increasing the water content above 100%.
In the early 1990s, the method of timber piled embankments had an upswing as a competitive measure for reducing settlements along the northern coast of Sweden. A simple and cost-effective foundation method was needed to counter the sulphide soil’s high compressibility and its impracticality to handle, considering that the soil oxidises if it is excavated and placed above the groundwater table. Since sulphide soil is environmentally hazardous to excavate and the large coastal forests provide a renewable source of the softwoods Scots pine (Pinus sylvetris) and Norway spruce (Pinus resinosa), timber pile embankments proved to be one of the most sustainable foundation methods for roads and railways in the area.
The light embankment pile groups contain numerous piles. According to the current Swedish design criteria for road and railway construction, TK Geo 13 [16], centre-to-centre pile spacing () should be 0.8–1.2 m for lightly piled embankments. For a two-lane road (16 m wide embankment at the ground) this would amount to 9000–20,000 piles per kilometre. There is an interest in the possibility of reducing the number of piles to save natural and economical resources. A main concern, however, is whether the piles should be installed in a square or a triangular arrangement (Figure 3). TK Geo 13 states that a triangular pile arrangement should be used, instead of the square pile arrangement prescribed in the previous standard TK Geo 11 [17], as the shorter diagonal distance between the piles results in more stable arches. The diagonal distance between the piles () in the square pile arrangement, , is longer than the longest distance between two piles in the triangular pile arrangement, . There is, however, a lack of research supporting this statement, and the question also involves the optimum value of . However, the tributary area is equal to for both the studied square and triangular pile arrangement, as the triangular arrangement is comprised of isosceles triangles. Esmaeili and Khajehei [12] and Wijerathna and Liyanapathirana [13] studied triangular arrangements comprised of equilateral triangles, for which . A geotextile filter fabric can be fitted along the timber piles to increase the vertical drainage of the less permeable subsoil [18]. For this purpose, a triangular arrangement is preferrable as it provides a more uniform consolidation between drains than a square arrangement [19].
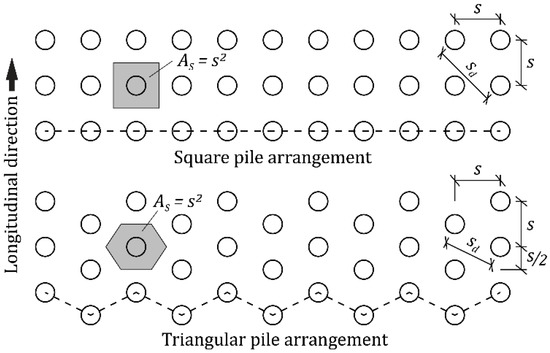
Figure 3.
Square (previous standard) and triangular (current standard) pile arrangements. Pile rows in x- and y-directions are marked with dashed lines.
Timber is highly suitable as a pile material due to its high strength-to-weight ratio. The piles can be easily handled and trimmed to a preferred length. In comparison with steel and concrete, however, a timber pile risks fracturing or brooming (splitting at the toe) due its low strength if driven in too hard during installation. To avoid this, the piles are either driven with a low practical refusal blow count limit or, if possible, pushed down to a known firmer soil layer, which is most often a glacial till. The firm soil layer should allow the pile group to settle to some extent, so that there is enough mobilised shaft friction to maintain a lower resulting force at the toe. This keeps the timber from fracturing or brooming.
With the thin end installed downwards, an active axial load on the naturally tapered timber pile creates an upward component of the normal force (reaction force) acting on the shaft. This upward component yields a greater bearing capacity with a timber pile than with a regular steel or concrete pile with a constant cross section. The taper also reduces the drag load on the timber pile [20]. The tapering of Norway spruce and Scots pine is 7–8 mm in diameter per metre [21].
The installed untreated timber piles need to be kept in an anaerobic environment to avoid rotting. Following TK Geo 13 [16], an anaerobic zone is created around the pile group by the saturated subsoil and a 10 cm layer of dense soil with high capillarity placed on top of the pile heads. The life expectancy of an untreated timber pile encased within a permanently fully saturated soil can be almost indefinite. As per common international practice, if the groundwater level is too deep, the timber piles are extended by a precast concrete upper section such that the concrete section reaches below the lowest predicted ground water level after driving.
What sets the Swedish design criteria for timber piling apart from other GRPSE national standards, e.g., the British BS8006 [22], is the exclusion of pile caps in favor of reliance on the GR. Figure 4 shows a vertical cross section of an embankment according to the TK Geo 13 design criteria. The embankment is reinforced with two layers of GR spaced 20 cm apart, with the lower layer 20 cm above the dense soil. A layer of geotextile (e.g., woven geotextile) is added between the dense soil and the load distribution layer (the reinforced lower part and the upper part of the embankment) to separate the dense and granular soil. It is assumed that the two layers of GR interlock the soil particles. Horizontal stresses are built in during the compaction of the embankment, causing the lower part of the embankment to act like a beam resting on top of the timber piles. This maintains the arches between the piles without the need for pile caps, while reducing the risk of punching failure through the embankment. Although two layers of GR are required by TK Geo 13, the Swedish Transport Administration believes that the maximum allowed of 1.2 m is too narrow for the GR to be cost-efficient.
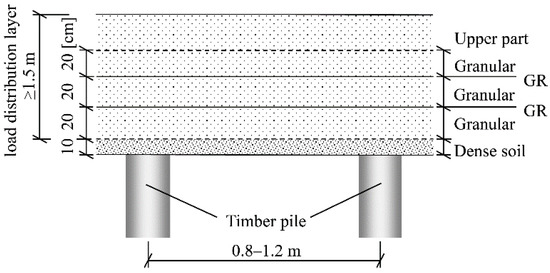
Figure 4.
Embankment design criteria (vertical cross section) when using timber piles according to TK Geo 13 [16].
4. Related International Guidelines and Research
As part of evaluating the design criteria for lightly piled embankments, an assessment of related international guidelines and research is provided in this chapter. The load transfer onto the piles and subsoil is complex, as the yielding soil creates a reorganisation of weight distribution and stresses. Many studies have discussed the load transfer mechanism and optimal GRPSE design. Several analytical models on this issue have been developed and adopted in national standards for design purposes. By studying the lessons learned from the research field of GRPSE and timber piling, improvements can be made further down the line to the Swedish design criteria for lightly piled embankments.
The use of GRPSE is increasing worldwide, with Europe as the leading field of practice. GRPSE is a common method in the Nordic countries. The Nordic geotechnical societies joined together to create the Nordic guidelines for reinforced soils and fills, as presented by Rogbeck et al. [23]. The analytical model recommended by the Swedish guidelines for designing lightly piled embankments and GRPSE in general, TR Geo 13 [24], are based on the model developed by Carlsson [25]. The Carlsson model is a two-dimensional rigid arch model used to determine the tensile load () in the GR (see Figure 2). The model assumes a wedge (equilateral triangle with 30° apex angle) of soil in movement between the piles, with the rest of the embankment being stationary. This applies even if the embankment height is lower than the wedge height [23]. The load directly transferred onto the piles corresponds to the weight of the stationary soil. The GR supports the entire weight of the soil wedge, assuming no subsoil support and = 0. The weight is indirectly transferred onto the pile heads as the GR is suspended between the piles. Thus, the piles are assumed to carry the sum of the embankment and traffic load. The model focuses primarily on the membrane effect, and secondarily on the arching effect. Rogbeck et al. [26] added a multiplier to the Carlsson model for the calculation of in three dimensions, i.e., per pile instead of per metre. This Extended Carlsson model is the recommended analytical model in Sweden for the design of GRPSE and lightly piled embankments [24].
As an alternative to the Extended Carlsson model, the Nordic guidelines mention a model developed by the Foundation for Scientific and Industrial Research (SINTEF) in Norway and published in Svanø et al. [27]. As in the Extended Carlsson model, the SINTEF model assumes a rigid wedge-shaped arch of soil in movement between the piles and no subsoil support. The main difference between the Extended Carlsson model and the SINTEF model is that the SINTEF model focuses primarily on the arching effect and only secondarily on the membrane effect, while the Extended Carlsson model focuses on them in the reverse order. In the SINTEF model, the arched soil acting directly on a pile cap is assumed to form as an upside-down truncated square pyramid. To calculate the weight of the soil wedge between the piles, the wedge apex angle can be varied between roughly 30° and 45°. Svanø et al. [27] recommends an apex angle closer to 30° for small pile caps, the same as the fixed apex angle for the Extended Carlsson model. The Extended Carlsson and SINTEF models agree well when the embankment height is higher than the wedge height, i.e., when both models assume full arching [27]. In case of partial arching, i.e., when the arch (wedge) height is higher than the embankment height, the SINTEF model excludes the top part of the wedge that is higher than the embankment height, and an eventual surcharge load is instead added over this area. The SINTEF model is not implemented as a national standard. In accordance with the Nordic guidelines, the Norwegian Public Roads Administration (NPRA) prescribes the Extended Carlsson model in the Norwegian guidelines, Håndbok V221 [28].
Among the other European national standards and recommendations for geotechnical engineering, there exist several limit equilibrium (LE) models for the design of GRPSE. To the best of the authors’ knowledge, aside from the Extended Carlsson model the three most commonly used models for GRPSE design are: (1) The H&R model by Hewlett and Randolph [29], used in the British BS8006 [22] and the French ASIRI [30]; (2) the Zaeske [31] model, used in the German EBGEO [32]; and (3) the Concentric Arches (CA) model by Van Eekelen [8], implemented in the Dutch CUR226 [33,34]. All three models consider the transfer of the load through the arch in limit equilibrium, with the difference being the formation of the arch. The H&R model assumes a single semi-circular arch between the piles, the Zaeske model assumes nonconcentric semielliptical arches, and the CA model assumes concentric semicircular arches. The H&R model considers no subsoil support, whereas the Zaeske and CA models take subsoil support into consideration.
Numerical analyses of GRPSE have been performed more often in recent years, both in the design of single cases and in the verification of new analytical models. Le Hello and Villard [6] coupled discrete element (DE) and FE (DE modelled soil particles and FE modelled GR), with an emphasis on the membrane effect. Zaeske [31] and Van Eekelen [8] used the FE method to verify the shape of the arches assumed in the Zaeske and CA models. Lai et al. [35] studied the formation of soil arching in GRPSE using DE method simulations. Bhasi and Rajagopal [36] observed in their FE analysis that the arching effect is not instantaneous, and that the arches fully develop during the consolidation process after final construction. All of these studies show that it is possible to clearly visualise the formation of arches with numerical simulations. The effective major principal stress () vectors will align tangentially to the arch [8,31,36] and the effective vertical stress () will reduce underneath the arches and concentrate around the piles [37], as illustrated in Figure 5.
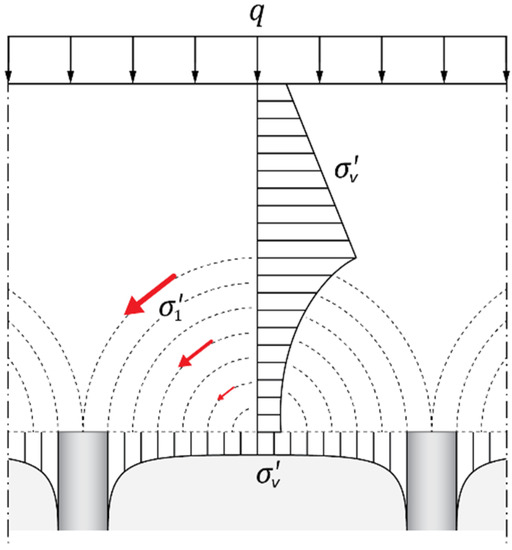
Figure 5.
Illustration of the vertical stress reduction due to arching, based on Zaeske [31], and the major principal effective stress () vectors. Arch shape according to the Concentric Arches model [8].
Rui et al. [38] observed a triangular arch in an unreinforced piled embankment, i.e., no GR, by geotechnical centrifuge trapdoor tests and DE analysis and assuming uniform displacement between the piles. Under similar conditions, da Silva et al. [39] also observed triangular arch formation. Iglesia et al. [40] also used centrifuge trapdoor tests, and showed that the arch in an unreinforced piled embankment changes from curved to triangular, with increasing settlement of the soil beneath the arch.
With one layer of GR lying directly on the pile heads, Van der Peet and Van Eekelen [41] observed the formation of arches in relation to the shear stresses in the load distribution layer in their FE analysis. They observed formation of triangular arches prior to reaching the maximum shear strength, i.e., at ultimate limit state (ULS). Concentric semi-elliptical arches were observed when the subsoil support was removed and the mobilised shear stress reached the maximum shear strength (ULS was reached). In practice, road and railway construction design aims to not reach ULS in order to avoid differential settlements at the surface of the embankment. Semi-elliptical concentric arches were also observed by da Silva et al. [39] in their geotechnical centrifuge trapdoor tests when placing one layer of GR at the base of the embankment and removing the subsoil support (by lowering the trapdoor). Nevertheless, no differential settlement developed at the surface. Rui et al. [37] concluded that the height of a geosynthetic-reinforced embankment needs to be at least 1.5 times the clear spacing between pile caps to avoid differential settlements at the surface. From the combined results of Van der Peet and Van Eekelen [41] and da Silva et al. [39], either triangular or semi-elliptical arches can form in a GRPSE without reaching ULS. The shape of the arch in a GRPSE depends on the displacement of the GR, which in turn is dependent on the subsoil support (and GR stiffness). Subsequently, both the arching and membrane effects depend on subsoil support. In both the FE analysis by Bhasi and Rajagopal [36] and the medium-scale experiment by Van Eekelen [8], the arching effect increased because of the increased GR displacement as the subsoil consolidated. In the tests by Van Eekelen [8], the membrane effect increased as a result of subsoil settlement. The results of the geotechnical centrifuge trapdoor tests by King et al. [42] showed that the maximum arching effect occurs between 2 and 4% GR deflection in relation to the pile spacing. Thus, the amount of required subsoil support depends on the stiffness and strength of the GR, and vice versa.
5. Numerical Modelling of Light Embankment Piling
A road embankment resting on a pile group with a square arrangement can be approximately modelled in a plane strain condition with out-of-plane pile columns as walls with equivalent rigidity. In the case of a triangular arrangement, the in-plane arrangement is repeated, but in cycles and in the out-of-plane direction, as shown in Figure 3. Triangular arrangements are therefore modelled as a three-dimensional problem. The square arrangement was primarily modelled in three dimensions in order to compare the two arrangements under the same conditions. The effects of freezing/thawing were not taken into consideration in the model.
The modelled square pile arrangement was based on the previous Swedish standard, TK Geo 11 [17], and the modelled triangular pile arrangement was based on the current Swedish standard, TK Geo 13 [16]. For both the floating and semi-floating pile group, a total of nine values for were modelled (see Table 1). The embankment width was constant, leading to a decreasing number of piles in each row () as s increases. The number of piles per metre of road () will accordingly decrease with increasing . The allowable range of s prescribed in TK Geo 13, i.e., 0.8 to 1.2 m, would, for the modelled road embankment, result in a ranging from 20 to 9.2, or 20,000 to 9200 piles per km road. Increasing the maximum allowable from 1.2 m to 1.5 m, for example, would decrease from 9.2 to 6.0, reducing the number of timber piles by 3200 piles per km road, or roughly one third.

Table 1.
Number of piles, 𝑛𝑝𝑖𝑙𝑒s, for each s.
The pile groups were modelled as purely floating (zero toe resistance) and as floating with a small toe resistance (semi-floating) to model the worst-case and the normal scenarios, respectively. The modelled square and triangular pile arrangements (Figure 3), with the range of s presented in Table 1 as floating and semi-floating groups, resulted in 36 modelled combinations. Two additional models were simulated without piles, each with the same soil profile as for the floating and semi-floating pile group cases. In total, 38 combinations were modelled.
5.1. The Finite Element Model
The numerical analysis was performed using the FE code PLAXIS 3D 2017 [43]. Figure 6 shows a cross section of half of the FE model. Note that the cross section shown in the figure is cut along the symmetrical vertical axis (left-hand side in the figure). The model width (transversal direction of the road) and depth were set to 100 and 31.7 m, respectively, in order to obtain realistic boundary conditions. The model length (longitudinal direction of the road) was equal to three pile rows (Figure 3), i.e., with an additional at each end for the square arrangement, and with an additional at each end for the triangular arrangement. The model length of three pile rows was chosen to model the stress distribution between the piles in both transversal and longitudinal road directions. The groundwater was allowed to flow due to consolidation through the upper horizontal boundary of the model as well as through the vertical outer model boundaries on either side of the road. All vertical boundaries were normally fixed. The ground surface boundary was fully free, and the bottom horizontal boundary fully fixed. A 10-node tetrahedral element mesh was refined in steps until there was no significant difference in the results. The final mesh, with soil layers, is shown in Figure 6. The final general target element dimension was 5.2 m, with 0.3 m and 0.5 m large elements in the embankment and in the pile group, respectively. The simulation of the piled embankment was divided into several stages of construction, in-situ conditions, excavation, pile installation, embankment and traffic load, and followed by a final consolidation simulation phase until the excess pore pressures reached 1 kPa (assumed as full consolidation). Note that no installation effect of the piles was simulated. The traffic load of 15 kN/m2, required by TK Geo 13 [16], was added as a static load after 45 days of consolidation. The settlements were reset to zero at the start of the consolidation.
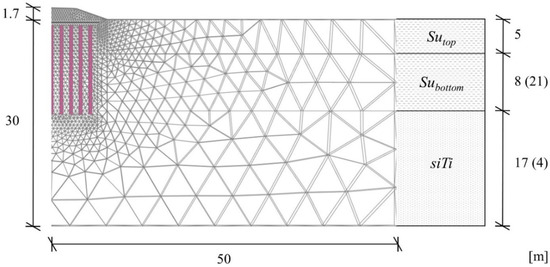
Figure 6.
Cross-section of the semi-floating pile group model and element mesh. Soil layer thickness for the floating pile group model is in parentheses.
5.1.1. The Piles
In FE modelling, piles are typically modelled as mesh element clusters with the actual geometry and properties of the real pile, referred to in this paper as “volume piles” (Figure 7d). Pile–soil interaction (toe resistance and shaft friction) is manually applied with an interface, permitting soil arching to be modelled locally along the pile. The interface simulates the thin zone of intensely shearing soil at the contact between the pile outer surface and the soil, as the pile is expected to settle relative to the soil during loading of the pile group. The use of volume piles is limited by the size of a pile in relation to the overall model size. The common practice in FE modelling is to use larger and fewer mesh elements when possible in order to keep the computation time shorter, since every mesh element requires computation. Volume piles require a small ratio between the mesh element size and the pile diameter to maintain sufficient simulation accuracy. The mesh element size is dependent on the model size.

Figure 7.
Illustration of ways of modelling piles: (a) embedded beam with pile head in level with the transition between embankment and subsoil; (b) embedded beam with an extension, length Lext, into the embankment with shaft resistance τext; (c) embedded beam with a plate fixed to the node at the pile head; and (d) volume pile. Lpile is the pile length.
In the work presented in this paper, the pile diameter was too small in relation to the model size to generate a time-efficient mesh for volume piles. Instead, each pile was modelled as an embedded beam (EB) (Figure 7a–c). An EB consists of a line element (beam) with a stiffness equivalent to, in this case, a timber pile. The pile–soil interface is modelled with a node-to-node interaction in the form of two linear elastic-perfectly plastic springs for each pair of nodes; one elastic-perfectly plastic spring models the gap displacement and the other models slip displacement. In addition, a region of the soil surrounding the EB is given elastic properties, to give an overall behaviour similar to that of a volume pile. This elastic region is divided into two parts: a cylindrical region around the pile shaft and a hemispherical region encasing the pile toe. Both geometrical parts have a diameter equal to that of the modelled pile. In contrast to volume piles, EBs go through the generated mesh, allowing a continuous mesh. Thus, EBs can be used for cases where the pile diameter is small in relation to the model size, saving computation time. The mesh size controls the resolution of springs in the pile–soil interface, not the line element itself. More information about EBs can be found in the study by Tschuchnigg and Schweiger [44].
Modelling a GRPSE and piled embankments in general requires realistic modelling of the load transferred directly onto the piles through the arches (). With no pile caps prescribed for lightly piled embankments [16], is carried directly by the pile head. As an EB has no true volume, and thus no pile head surface, the axial load is subsequently zero at the pile head ( = 0) when modelling in Figure 7a. In addition, any expected moment at the pile head is zero. Transferring a load onto the top node of an embedded beam (in this case the pile head) is done either by applying a point load on the top node or by attaching the top node to a structure, e.g., a plate element. A third option is to extend the pile into the embankment (Figure 7b) according to
where is the shaft resistance of the extension, is the circumference of the extension, and is the extension length. Each variable of Equation (1) is set to result in a pre-known value of , giving the correct load onto the pile heads in the FE model. This also allows moment forces in level with the pile head. However, neither the case shown in Figure 7a nor that in Figure 7b generates arching. The lack of arching in the case of Figure 7a was observed by Gunnvard et al. [45] in the FE simulations presented in the same road embankment case as simulated in this paper. For the simulations presented in this paper, the pile head was added as a rigid plate (Figure 7c) to generate arching. The rigid plate is defined as a completely rigid surface element that can move but cannot be deformed. Displacement and rotation of the rigid plate is based on the stiffness of the media connected to it (in this case the EB in the soft subsoil) and its moment of inertia, respectively. The connection between the top and the rigid plate is fully rigid. Thus, by modelling the embedded beams as in Figure 7c, the load is transferred through the pile head onto the pile in a similar fashion as for a volume pile, while also allowing arches to form. The rigid plate was modelled as an octagon to keep the contour as simple as possible for the meshing algorithm. The long diagonal of the octagonal rigid plate was equal to the pile diameter. An interface was added to the top of the rigid plate, with its thickness set equal to the height of an equilateral triangle of stationary soil on top of the pile head, with the apex angle equal to the friction angle of the embankment soil material [46].
To test the method of modelling each pile as an EB with a rigid plate, comparisons of the axial pile load as well as and the effective major principal stress () vectors were made for the methods of modelling in Figure 7. A separate simplified model of a single pile in a square pile group with = 1.4 m was simulated. The embankment height () was set to 2.0 m, the average height of the embankment in Figure 1, with a unit weight of 20 kN/m3. For the comparison, the maximum shaft and toe resistance of each EB was set equal to the shear strength of the modelled adjacent soil to equal the maximum shaft and toe resistances of the volume pile. The extension of the embedded beam with extension (Figure 7c) had a length () of 0.4 m and the shaft resistance () was set according to Equation (1) to give a load at the pile head () equal to the simulated of the volume pile. The embedded beam with extension (Figure 7b) and plate (Figure 7c) resulted in similar axial pile load over depth. Both techniques gave lower normal force at the toe compared to the volume pile (Figure 7d), while the total axial pile load was approximately equal. Figure 8 shows the direction of the -vectors and the value of for the four modelling techniques. The simulated was close to zero for the modelled EB (Figure 8a). For an EB with extension = 62.2 kN (Figure 8b) and an EB with rigid octagonal plate resulted in = 61.1 kN (Figure 8c), 2% lower than for the volume pile for which = 62.3 kN (Figure 8d). The arch formation for an EB came closest to that of a volume pile when adding a rigid plate, as shown by the direction of the -vectors in Figure 8. Based on the total axial load, and arch formation, an EB with a rigid plate as pile head can be seen as a valid approximation of a volume pile.
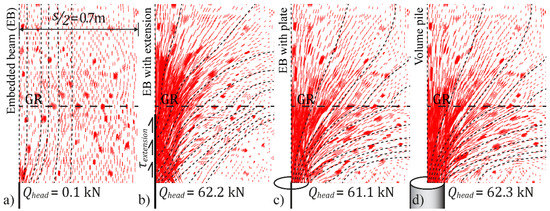
Figure 8.
Resulting pile head load () and -vectors (red lines) in the embankment above the pile head for a pile modelled as (a) an embedded beam (EB), (b) an EB with extension, (c) an EB with plate, and (d) a volume pile. Vertical cross-section halfway between two adjacent piles in a corresponding square pile arrangement ( = 1.4 m). The direction of the -vectors is outlined with dashed lines.
5.1.2. The Material Parameters
Field and laboratory test results from the site showed three main soil layers, as seen in Figure 6: a top layer of sulphide-bearing silt (Sutop) at a depth of 0 to 5 m, a middle layer of silty sulphide clay (Subottom) from 5 m, and a bottom layer of silty glacial till (siTi), typically from 13 m downwards. The semi-floating pile group was assumed to be driven 30 cm into the siTi-layer, resulting in a modelled pile length (siTi) of 13 m. For the floating pile group the same pile length was used, while the layer of Subottom was extended to a depth of 26 m.
The sulphide soil (Sutop and Subottom) was modelled using the Soft Soil (SS) model, as this model was developed for soft soils under large compression. Most of the deformations were expected to take place within the soft soil layers; thus, both the siTi and the granular embankment material (Granular) were modelled with the simpler Mohr–Coulomb (M-C) model. The values of the soil material parameters are shown in Table 2. Soil materials Sutop, Subottom and siTi were modelled taking excess pore pressure into account (“Undrained (A)”). For soil material Granular the excess pore pressure was assumed as zero (“Drained”). The shear strength of all soil materials was based on effective strength parameters. How each parameter value was evaluated is denoted in Table 2. The layers of Sutop, Subottom and siTi were assumed to be fully saturated due to the shallow groundwater level. Thus, the unsaturated unit weight was set to equal the saturated unit weight for the three soil materials. The preconsolidation pressure of the sulphide soil layers was almost constant over the examined depth. Thus, pre-overburden pressures were assigned to the sulphide soils instead of overconsolidation ratios.
Table 2.
Values of soil material parameter.
The embankment in the case study was reinforced with two biaxial geotextiles as GR, the bottom layer being stiffer in the transversal direction, and the upper one being stiffer in the longitudinal direction. The vertical distance between the two layers was too narrow in relation to the overall model size to maintain sufficient mesh quality. Thus, the two layers of GRs were combined in the numerical model to a single layer of linearly elastic GR and placed in the middle between the existing layers (0.45 m above the pile heads), with an equivalent stiffness of 2200 kN/m and 112 kN/m tensile strength. The stiffness and strength of the GR matched the material properties of the geotextile used in the case study. A 0.15 m thick interface was added to both sides of the modelled GR.
Timber piles have a naturally tapered shape; however, because the tool of embedded beams is limited to constant cross sections, the simulated timber piles were modelled with a constant diameter (). was set to 200 mm based on the minimum allowed toe diameter of 150 mm [16] and on the natural tapering of the Swedish timber piles. According to the survey in Björklund et al. [21], the natural tapering of Swedish spruce and pine is equal to 8 mm difference in diameter per metre.
The ultimate bearing capacity of the modelled piles was chosen as the smallest value of the geotechnical bearing capacity and the structural bearing capacity. The geotechnical bearing capacity of a pile is defined as the load that can be transferred from the pile onto the adjacent soil, i.e., the sum of the shaft and toe bearing capacity. The structural bearing capacity is the load at which the pile itself goes to failure. Failure of the pile in compression was taken into consideration in this paper.
The interaction of an embedded beam and the surrounding soil is described by a linear elastic behaviour with a finite strength (geotechnical bearing capacity). During elastic loading, the mobilised shaft and toe resistance are based on the shear modulus of the pile–soil-interface; in the simulated case, they are set equal to the shear modulus of the surrounding soil. At elastic loading the total axial load () equals the sum of the mobilised shaft and toe resistance. At plastic loading of the pile, i.e., the geotechnical bearing capacity, the shaft bearing capacity is either a direct input value or a computed value based on the shear strength of the surrounding soil. In this study, the shaft bearing capacity () of each pile was calculated based on the undrained shear strength according to Eriksson et al. [48] from CPT results. The value of () was assumed as linearly increasing over the pile length. The toe bearing capacity () was calculated based on the friction angle of the embankment material, according to Eriksson et al. [48]. The geotechnical bearing capacity () of an embedded beam with linearly increasing shaft resistance is calculated as
with set to 14.0 kN for the semi-floating pile group and set to zero for the floating pile group. is the shaft bearing capacity at the pile head, set to 14.4 kN/m, and is the shaft bearing capacity in level with the pile toe, set to 15.6 kN/m. Thus, the resulting becomes 209 kN for the semi-floating pile group and 195 kN for the floating pile group. For < the load response is elastic; with as a function of the currently mobilised , , and . When = , the load response is perfectly plastic.
The embedded beams are modelled as linear elastic or linear elastic-perfectly plastic. Elastic behaviour is described by Young’s modulus and perfectly plastic behaviour is initiated at a predefined yield stress. The embedded beam carries no additional load after reaching the yield stress. According to STA [16], the timber piles should, meet the criteria for the European strength class C14 [49], corresponding to a 5th percentile Yong’s modulus of 4700 MPa and a yield stress of 16 MPa (parallel to the fibres) at 12% moisture content. The moisture content () of wood is defined as the ratio of the mass of water in the wood to the mass of the wood itself. The strength class C14 is developed for sawn construction timber, e.g., wood beams. The classification of timber piles is, in practice, less accurate than the classification of sawn timber, since only the loose bark is removed from timber piles. In addition, the strength and stiffness of timber decrease with increasing moisture content until the fibre saturation point is reached [50]. For fully submerged timber, varies between 150% and 200% [51]. Thus, timber piles in the modelling were given a reduced stiffness of 2200 MPa. The unit weight of the timber was calculated as 12 kN/m3 by
where the dry unit weight was set to 400 kN/m3 [50] and 𝑢 was set to 200%. The structural bearing capacity was set as 106 kN based on a characteristic compressive strength of 6 MPa and a toe diameter of 150 mm. The geotechnical bearing capacity was 209 kN for the semi-floating pile group and 195 kN for the floating pile group. Thus, the structural bearing capacity was the ultimate bearing capacity. Modelling the piles as linear elastic-perfectly plastic would set a constant upper limit of equal to the structural bearing capacity, independent of the actual load on the pile. In this study, it was considered of interest to evaluate if and by how much the resulting would exceed the structural bearing capacity when modelling pile groups with centre-to-centre pile spacing from 0.8 m up to 2.0 m. Thus, the piles were modelled as linearly elastic, and the simulated value of was compared with the structural bearing capacity of 106 kN.
6. Results
A total of 38 simulations with the FE method were done to evaluate the efficiency of a triangular pile arrangement compared to a square pile arrangement, and to evaluate the most appropriate centre-to-centre pile spacing (). The evaluations were done on floating (the soft Subottom soil layer reaching down to 25 m) and semi-floating (the soft Subottom soil layer reaching down to 13 m) pile groups in both triangular and square pile arrangements, using the range of summarised in Table 1, which corresponds to 36 of the 38 simulations. The remaining two simulations were performed without piles, with the respective soil profiles of the semi-floating and floating pile groups, in order to assess the relative reduction of embankment settlement when reinforcing the embankment with a triangular and square pile arrangement. The results below are divided into total and differential settlements, the visualisation of arches, the load transfer in terms of axial pile load, and axial load in the geosynthetic reinforcement.
6.1. Settlements
The main reason for reinforcing a road or railway with piles, apart from stabilising the embankment, is to avoid excessive settlements (downward vertical displacements). The numerically simulated settlements on the road in this study were analysed and compared with the criteria for serviceability limit states set by the Swedish Transport Administration in TK Geo 13 [16]. The criteria of interest are the total settlements and the drainage gradient of the road pavement. The total settlement of the pavement is limited to 35 cm for the type of road studied in order to avoid seasonal flooding. The drainage gradient is defined as the inclination of the pavement between the crest and the side of the road. For the studied road, the design drainage gradient is 3.6%. The decrease in design drainage gradient due to settlements is limited to 1.1%, i.e., the final drainage gradient must be at least 2.5% to maintain sufficient water drainage of the pavement surface.
The settlements analysed were numerically computed on the crest of the road (point A), at the side of the road (point B), and at the embankment toe (point C), as shown in Figure 1. The differential settlement between points A and B gives a measurement of the change in drainage gradient. Heaving at point C could indicate a potential problem with the stability of the embankment. Differential settlements between point C and points A and B might lead to damage to the geosynthetic reinforcement due to large strains.
In Figure 9, the settlements at points A, B and C were plotted against increasing centre-to-centre pile spacing () from 0.8 to 2.0 m for floating and semi-floating pile groups with square and triangular pile arrangements. No significant difference in was found between the modelled square and triangular pile arrangements. Furthermore, in the pavement (points A and B) remained within the serviceability limit state of 35 cm. The maximum values of for floating and semi-floating pile groups were obtained on the crest (point A) of the embankment. As expected, the floating pile groups settled more than the semi-floating pile groups.

Figure 9.
Settlement () computed in points A, B and C (Figure 1) with increasing centre-to-centre spacing () for a square (Sq) and triangular (Tri) pile arrangements. Both floating and semi-floating pile groups.
The magnitude of the differential settlements in Figure 9 between the three points A, B and C did not vary much with the pile spacing s. The largest changes in the differential settlements were observed when increasing the value of s from 1.4 to 1.5 m and from 1.8 to 2.0 m. In both cases, increased less at point C than at points A and B. The reason is an unchanged number of piles in the two cases at the same time as s increased (see Table 1), bringing the outermost pile closer to the embankment toe. The differential settlement between points A and B was approximately the same (about 1.5 cm) for both types of pile group and for all values of . The decrease in drainage gradient was thus approximately 0.3% for all models, which is within the serviceability limit state of 1.1%. No local differential settlements (depressions) between the piles were observed in the pavement in the simulations. For the semi-floating pile group, the differential settlements between points B and C increased from 1.3 cm when = 0.8 m to 2.0 cm when = 2.0 m. For the floating pile group, it remained almost constant at 1.9 cm for the full range of . The differential settlements observed in Figure 9 are not of a magnitude that could damage the GR by plastic strains. No heaving was observed at point C, which is good from a stability point of view.
The results for 𝑢𝑣 shown in Figure 9 were compared with for the case of no piles in order to quantify the reduction in from pile-reinforcing the embankment. Two reference simulations were done without piles for the corresponding soil profiles of a floating and a semi-floating pile group; is the average value of the settlement reduction in points A, B and C defined as a percentage
where is at point A on the crest of a piled embankment, and is at point A on the crest of an embankment without pile reinforcement. The quantities , , , and follow the same notation for points B and C. For an embankment with no pile group support, at points A, B and C was 19, 18 and 12 cm, respectively, for the case of floating piles. The respective values were 17, 15 and 9 cm for the case of semi-floating piles. In Figure 10a, was plotted against for floating and semi-floating pile groups with square and triangular pile arrangements. As expected, a semi-floating pile group reduced settlements more than a floating pile group did. However, increasing the value of from 0.8 to 2.0 m had twice as large an influence on for semi-floating piles as compared to floating piles. For = 0.8 to 1.2 m, remained nearly constant at 43% for the floating piles. Furthermore, for the floating piles, an increase in s from 1.2 to 2.0 m reduced almost linearly from 43% to 28%. For the semi-floating pile groups, changed almost linearly over the range of modelled values of , decreasing from 79% at = 0.8 m to 45% at = 2.0 m.
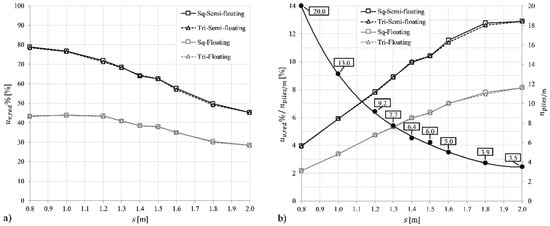
Figure 10.
(a) average settlement reduction as percentage () with increasing and (b) ratio of to the number of piles per metre of road () with increasing , as well as with increasing . Square (Sq) and triangular (Tri) pile arrangements.
The resource efficiency of each installed pile can be quantified by dividing with the number of piles per metre of road (see Table 1). The resulting ratio, , gives an indication of how much each installed pile contributes to the settlement reduction for a given value of . In Figure 10b, and were plotted on separate vertical axes against for floating and semi-floating pile groups with square and triangular pile arrangements. increased with the increasing value of , meaning that each individual pile contributed more to reducing the settlements as was reduced. For both the floating and semi-floating piles, increased almost linearly from = 0.8 to 1.4 m. For > 1.4 m, still increased, although more slowly than between the simulated values of . The gain in resource efficiency when increasing the value of was less for > 1.4 m compared to what was achieved in the interval 0.8 ≤ ≤ 1.4 m. Thus, the pile spacing where = 1.4 m is interesting as a design value. As previously mentioned, the pile spacing criterion in TK Geo 13 [16] is 0.8 ≤ ≤ 1.2 m. By increasing above the maximum value, from 1.2 to 1.4 m, the simulated value of increased by almost 1.3 times for both the floating and semi-floating piles. The value of decreased from 9.2 to 6.4 when increasing from 1.2 to 1.4 m, reducing the number of piles by almost one third.
Based on these results, it can be concluded that the pile arrangement, square or triangular, has no significant influence on the settlements in the road pavement or embankment toe of a lightly piled embankment. Furthermore, the serviceability limit state criteria in TK Geo 13 [16] regarding total settlements and drainage gradient were not exceeded for the modelled range of . It was also found that changes in had greater influence on the magnitude of the settlements if the pile group is semi-floating instead of floating. The settlements with a floating pile group were approximately the same for any within the pile spacing criterion 0.8 ≤ ≤ 1.2 m in TK Geo 13, as seen in Figure 9. Thus, it might only be beneficial to install the piles with < 1.2 m if the piles can be driven down to a firm soil layer or bedrock.
6.2. Arching
In order to evaluate the arch formation in the modelled lightly piled embankment, the direction of the major principal effective stress () and the distribution of the vertical effective stress () were both analysed. The analysis specifically focused on comparing the arches formed for the square and triangular pile arrangements. As discussed in the literature study and shown in Figure 5, the -vectors align tangentially to the formed arch, and the value of is lower underneath the arches and higher around the piles.
Figure 11 shows the distribution of in the lower part of the embankment for a semi-floating pile group with = 1.4 m. A detailed view of the distribution of and the -vectors, projected on a horizontal plane, are shown as red lines in Figure 12. The length of a line corresponds to the relative magnitude of a -vector projection. The greater the magnitude (i.e., the longer the line), the greater the stress rotation and arching. Figure 11a,c, and Figure 12a,c show the arch formation of the modelled piled road embankment, from now on referred to as the sloped embankment, for square and triangular pile arrangements, respectively. Figure 11b,d, and Figure 12b,d show the arch formation of an embankment with uniform embankment height for square and triangular pile arrangements, respectively. For all four cases, three horizontal planes were chosen at levels 1–3 marked in Figure 11: plane 1 just above the pile heads, plane 3 near the top of the formed arches, and plane 2 in the middle of planes 1 and 3. The values of presented in Figure 11 are the average of the values of on the three planes. Note that the legend in Figure 11 has a scale of 0 ≤ ≤ 150 kPa. The maximum value of was approximately 1500 kPa on top of the pile heads below the embankment crest. Increasing the value of above 1.4 m increased the value of on top of and near the piles, and vice versa when decreasing the value of below 1.4 m.
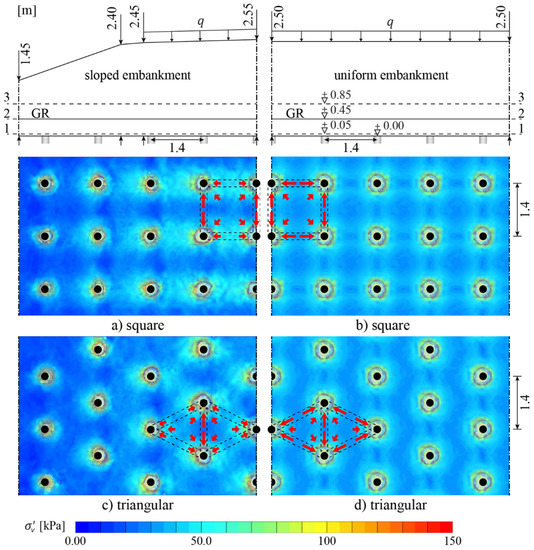
Figure 11.
Distribution of vertical effective stress (), as average values in the horizontal planes 1–3, in a pile group with square (a,b) and triangular (c,d) pile arrangement, with = 1.4 m for a sloped embankment (a,c) and an embankment with a uniform height of 2.50 m (b,d). The red arrows are the illustrative direction and magnitude of the major principal effective stress () vectors. The cross-section of the sloped embankment shows the left half of the modelled embankment.
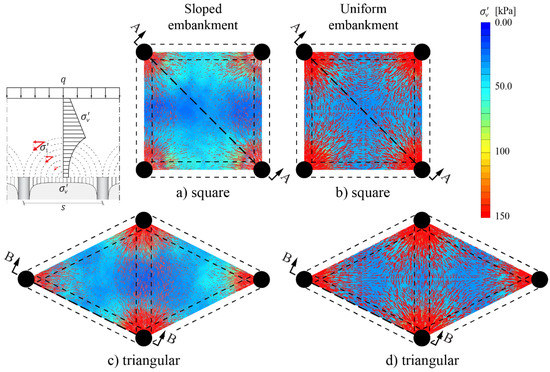
Figure 12.
Detailed view of the areas marked with dashed lines in Figure 11, showing the distribution of and -vectors, projected on a horizontal plane, as red lines for a pile group with square (a,b) and triangular (c,d) pile arrangements, with = 1.4 m for a sloped embankment (a,c) and an embankment with a uniform height of 2.50 m (b,d).
The two uniform embankments (Figure 11b,d) were modelled to compare the numerical results of a sloped embankment with what is generally assumed in analytical calculations. When analytically calculating the ratio of load carried by the piles to the total load analytically, the combined load of the embankment fill weight and the traffic load is, in general, assumed to act vertically on the pile group as a uniform load. The height of the embankment is usually set equal to the height between the pile heads (or pile caps) and the embankment crest. Thus, the GRPSE design is on the safe side by assuming the largest possible load on the pile group and GR. The height of the two modelled uniform embankments was set to 2.50 m, equal to the average height of the embankment subjected to the traffic load (see Figure 11). The uniform embankment was modelled on top of seven pile rows (each row was seven piles wide) to simulate an infinitely vast piled embankment.
Figure 11a,b and Figure 12a,b show the arch formation for the square pile arrangements. As expected, the arches formed symmetrically for the uniform embankment (Figure 11b and Figure 12b), with equal stresses in the transversal and the longitudinal road directions. The direction and magnitude of the -vector projections show significant stress rotation between the piles in the uniform embankment. Zones with reduced value of (destressed zones) formed between two adjacent piles, and a greater destressed zone formed between four piles, resulting in a square arch base (area under the arch). As seen in Figure 11a and Figure 12a, the resulting stress rotation between the piles in the longitudinal road direction for the sloped embankment was similar to the results for the uniform embankment. There was, however, a lack of stress rotation in the transversal road direction under the crest of the sloped embankment. Subsequently, the values of were significantly greater along each pile row than between pile rows, especially below the embankment crest. Thus, the arches formed asymmetrically for the sloped embankment with square pile arrangement, with arches forming primarily in the longitudinal road direction.
Figure 11c,d and Figure 12c,d show the arch formation for the triangular pile arrangements. As mentioned, the main reason the triangular pile arrangement was set as the design criterion for lightly piled embankments in TK Geo 13 [16] was that a triangular pile arrangement would, in theory, create more stable arches than a square pile arrangement, in particular due to a shorter longest diagonal between the piles as the arch base is assumed to be triangular. As shown in Figure 11d and Figure 12d, the uniform embankment height resulted in near equal arch formation between three piles and equilateral triangular arch base. The slightly rhombus-shaped arch formation was due to an isosceles triangular pile arrangement. For the sloped embankment (Figure 11c and Figure 12c), the base of the arch was distinctly rhombus-shaped instead. The destressed zone was concentrated in the middle of the four piles. Thus, the longest span of the arch formed between four piles in a triangular pile arrangement was the long diagonal of the resulting rhombus arch base (). This diagonal is longer than both the side of the expected triangular arch base () and the diagonal of the square arch base (). Similar to the results of the square pile arrangement, the arching was asymmetrical with the arches forming primarily in the longitudinal road direction, as seen in Figure 12c. Comparing Figure 12a,c, the arching along the diagonal between two piles in the square pile arrangement is greater or equal to the longest diagonal between two piles in the triangular pile arrangements.
In order to compare the stability and shape of the arch for the square and triangular pile arrangement, cross-sections were chosen along the diagonal between two adjacent piles (marked A-A and B-B in Figure 12). Figure 13 and Figure 14 show the distribution of and -vectors in the cross sections marked for the sloped and uniform embankments. As shown in Figure 13 and Figure 14, the shape of the arch was triangular for both the square and triangular pile arrangement, as well as for both sloped and uniform embankment. The shape of the arch in the uniform embankment was, for every modelled value of , similar to the geotechnical centrifuge trapdoor test results by Rui et al. [52] of an unreinforced embankment with = 3.0. The -vectors formed an enclosed triangular arch only for the triangular arrangement (Figure 13b and Figure 14b), translating to a more stable arch. However, the arching was similar for square and triangular pile arrangements in terms of the distribution near the subsoil. The distribution of in the embankment was more similar between the square and triangular pile arrangement for the uniform embankment (Figure 14) than for the sloped embankment (Figure 13). Furthermore, the results show that there was less overall arching in the sloped embankments than the uniform embankments. The value of was greater between the piles on top of the GR and the subsoil for the sloped embankment (Figure 13) than for the uniform embankment (Figure 14). The direction of the -vectors in Figure 13 and Figure 14 show that semi-circular arches formed underneath the GR in the uniform embankment, unlike in the sloped embankment.
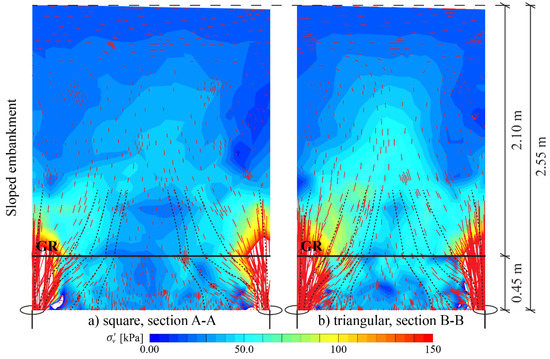
Figure 13.
Cross sections of the modelled sloped embankments with = 1.4 m (marked in Figure 12), showing the distribution of and -vectors. The -vectors, projected on a vertical plane, are marked as red lines and their directions are outlined with dashed lines.
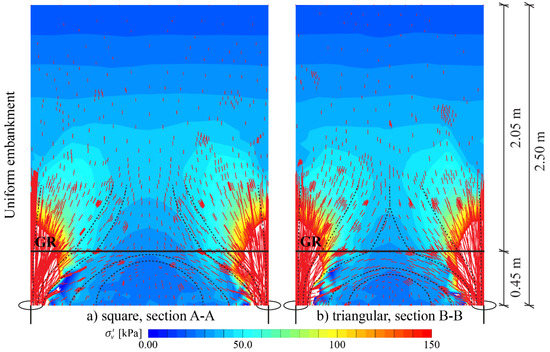
Figure 14.
Cross sections (marked in Figure 12) of the modelled embankments with uniform height of 2.50 m and = 1.4 m (marked in Figure 12), showing the distribution of and -vectors. The -vectors, projected on a vertical plane, are marked as red lines and their directions are outlined with dashed lines.
To determine the effects of embankment model size on arch formation, the modelled piled road embankment was lengthened by seven pile rows and the road was widened from two to four lanes (adding six piles to each row). Lengthening the embankment made no difference to the arch formation. Widening the embankment still resulted in asymmetrical arch formation. The arches formed asymmetrically for all simulated values of (Table 1). Modelling the pile group as floating gave similar stress distribution and arch formation as modelling the pile group as semi-floating.
The main contributing factor to the asymmetrical arch formation in the sloped embankment is believed to be the spreading effect of the slopes. The effect is caused by the horizontal component of the earth pressure and the horizontal spreading of the traffic load over depth. This creates a horizontal load component acting on the slope as well. Fahmi Farag [53] is one of many, and in particular one of the more detailed, studies of the spreading effect in geosynthetic-reinforced piled embankments (GRPSE). In the GRPSE design, the spreading effect is often taken into account when calculating the tensile force in the GR, but not when estimating the arch formation. This is also the case of the analytical methods presented in this paper. Thus, by assuming a uniform embankment, the spreading effect of the embankment slopes and subsequent asymmetrical arch formation is excluded in the GRPSE design.
6.3. Load Transfer
The piles in a GRPSE construction need to be able to carry the load that is transferred onto the piled heads by the arching and membrane effects (), as well as any load from negative shaft friction along the pile shaft. Thus, it is important to analyse at which value of s the total axial pile load () exceeds the structural bearing capacity of the timber piles; it is also of interest to analyse in order to quantify the arching and membrane effect.
The average distribution of in the three modelled pile rows (Figure 3) is summarised in Figure 15 for both the floating and semi-floating pile groups, with 0.8 ≤ ≤ 2.0 m. The difference in between the square and triangular pile arrangements was insignificant (<3%) for the range of . Thus, the values of shown in Figure 15 are the average results of the square and triangular pile arrangements. The difference in the value of between the floating and semi-floating pile groups is mostly due to a difference in maximum pile toe resistance, set to 0 kN for the floating pile group and 14 kN for the semi-floating pile group. In addition, due to the slope of the embankment the maximum value of in a pile row () was observed underneath the crest of the embankment, with the exception of = 0.8 m and = 1.0 m for the floating pile group. The distribution of along a pile row was irregular, with a larger force acting on the outermost piles than on the second-outermost piles, ≤ 1.4 m for the floating pile group and ≤ 1.0 m for the semi-floating pile group. As previously shown, the resource efficiency in terms of settlement reduction () was almost linear (Figure 10b) for ≤ 1.4 m, both for the floating and the semi-floating pile groups. Along with the distribution of in Figure 15, this suggests that the load bearing characteristics of the pile group were those of a combined unit for ≤ 1.4 m and those of single piles for > 1.4 m.

Figure 15.
Axial pile load (Npile) across a pile row (as an average of the three pile rows modelled) in the modelled floating and semi-floating pile groups, showing the results of the left and right half of each respective pile group. The horizontal axis denotes the horizontal distance from the embankment longitudinal centre line. The structural pile capacity of 106 kN, European strength class C14 [49], is marked with a dashed horizontal line.
The pile utilisation ratio as percentage (), defined as divided by the structural bearing capacity of 106 kN, is plotted against in Figure 16. changed almost linearly for 0.8 ≤ ≤ 2.0 m, increasing from approximately 33% at = 0.8 m for all pile groups to approximately 114 and 120% at = 2.0 m for the floating and semi-floating pile groups, respectively. The structural bearing capacity was reached ( ≥ 100%) in one or more piles, for > 1.6 m in the case of semi-floating piles and for > 1.7 m in the case of floating piles. The maximum allowable value of , in terms of structural bearing capacity, depends on the chosen factor of safety () defined as the ratio of the structural bearing capacity to . Setting equal to 1.2 or 1.3, for example, results in a maximum allowed of roughly 88 kN or 81 kN ( = 83% or 76%), respectively. This corresponds to an s equal to 1.5 m ( = 1.2) or 1.4 m ( = 1.3).

Figure 16.
Utilisation ratio of the piles as percentage () with increasing . The structural bearing capacity of 106 kN, European strength class C14 [49], is marked with a dashed line at = 100%.
The average load transferred onto the pile heads from arching and membrane effects () is plotted against in Figure 17a. The proportion of embankment weight and traffic load carried by the piles is often referred to as pile efficacy in the literature (Van Eekelen and Han, 2020). Pile efficacy can be seen as an efficiency of the GRPSE design. The average pile efficacy () plotted against is shown in Figure 17b and calculated as
where is the average load over the tributary area (), as seen in Figure 3. The difference in (Figure 17a) between the square and triangular pile arrangements was ≤3%, leading to the conclusion that the pile arrangement had no significant effect on pile head efficacy. For the modelled uniform embankment with a semi-floating pile group, used for comparison in the previous chapter, the difference in was <2% between the two pile arrangements. In addition, modelling the pile group as floating instead of semi-floating resulted in a <3.5% difference in (Figure 17a), and thus had no significant effect on pile head efficacy. The difference in is due to the larger relative displacement between the subsoil and pile head in the semi-floating pile group than in the floating pile group, which lead to a greater arching effect. This partly explains the observed difference in and between the floating and the semi-floating pile group in Figure 15 and Figure 16. From the results, it can be concluded that the stress distributions shown in Figure 11 and Figure 12 are comparable or deemed equal for the square and the triangular pile arrangements and for both the floating and semi-floating pile groups for a given value of .
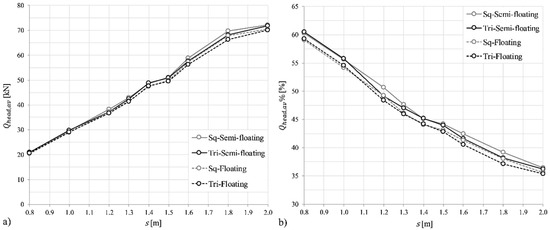
Figure 17.
(a) The average pile head load () and (b) the average pile efficacy as percentage () with increasing .
As seen in Figure 17b, decreased approximately linearly over the range of for all pile groups by almost 25%, from about 60% at = 0.8 m to above 35% at = 2.0 m. When = 100%, the sum of the embankment weight and traffic load is carried solely by the piles. When there is no arching or membrane effect, < 5% for the present study. It should be noted that the lightly piled embankment design with no pile caps results in a small pile coverage ratio (), defined as a percentage
where is the equivalent square side length of a circular pile head with diameter , and is calculated as
As previously mentioned, was set to 200 mm for the timber piles, resulting in a range of from 4.9% at = 0.8 m to 0.8% at = 2.0 m. Subsequently, ranged from about 60% at = 4.9% to above 35% at = 0.8%. Similarly, Lai et al. [35] performed DE simulations of a piled embankment with and without GR and for different values of , and obtained a result of roughly 60% pile efficacy for the simulation with GR and = 4.9% ( = 100 mm and = 0.45 m). Briançon and Simon [54] carried out a full-scale test on a piled embankment reinforced ( = 2.8%) with two layers of geogrid, similar to the load distribution layer in Figure 4, and measured 74% pile efficacy. The simulated in this study was about 55% at = 3.1% ( = 1.0 m), which is significantly less in comparison. However, in the Kyoto Road project by Van Eekelen et al. [2] on a monitored timber piled embankment ( = 4.4%), the pile efficacy was about 38%. Note that the Kyoto Road embankment fill material consisted of a sludge mixture with a friction angle lower than that of the embankment material simulated in this paper.
The results shown in Figure 18 are the maximum and average values of the GR tensile load ( and ) above the pile heads, plotted against the modelled range of . Modelling the piles in a triangular arrangement instead of a square arrangement increased by 6% and by 7% on average. The main reason for the difference is the choice of modelling the pile group as three pile rows. The offset in longitudinal road direction of every other pile (Figure 3) in each pile row resulted in larger GR deflection and tensile load along the borders of the model for the triangular pile arrangement than for the square pile arrangements. Subsequently, adding more pile rows would decrease the influence of the tensile load along the model border on the average tensile load of the entire model. As seen in Figure 18, , was well below the GR tensile strength of 112 kN/m for the modelled cases. The largest resulting value of for all modelled cases was almost 25 kN/m (1.1% strain), in the case of the triangularly arranged semi-floating pile group with = 2.0 m. Briançon and Simon [54] observed up to 0.7% strain in both geogrid layers at = 2.8%, similar to the maximum simulated strain of roughly 0.6% at = 3.1% ( = 1.0 m). The simulation results of and were larger on average by 20% and 23%, respectively, for the semi-floating pile groups than for the floating pile groups. The GR deflection and subsequent tensile load was greater for the semi-floating pile group than for the floating pile group due to the aforementioned difference in relative displacement between the two types of pile groups. Increased GR deflection leads to greater membrane effect and more load transferred onto the pile heads, as observed by Le Hello and Villard [6], adding to the difference in and in Figure 17 between the floating and semi-floating pile groups.

Figure 18.
The maximum GR tensile load () and average GR tensile load () plotted against .
These results lead to the conclusion that the maximum allowable value of in TK Geo 13 [16] can be increased from 1.2 to 1.6 m without reaching the characteristic pile bearing capacity. In addition, the arching and membrane effect in a lightly piled embankment is not significantly influenced by the pile arrangement (square or triangular).
6.4. Comparison with Analytical Models
The numerical results were compared with results from analytical calculations, as no field measurements were conducted on the studied lightly piled embankment. Although the Extended Carlsson model [23] is the analytical model recommended in TR Geo 13 [16] for the design of lightly piled embankments, more advanced models were also included in the comparison in order to investigate their suitability for this type of GRPSE. Several analytical models for the design of GRPSE exist, and several of them represent national standards or recommendations. The analytical models considered most interesting for the present study are presented in Table 3. The Swedish guidelines TR Geo 13 [24] in combination with the Nordic guidelines [23] were used for the calculations with the Extended Carlsson model [26] and the SINTEF model [27]. The British standards BS8006 [22] were used for calculations with the H&R model [29]. The French guidelines ASIRI [30] were taken into consideration as a complement to BS8006, as the H&R model is also incorporated into ASIRI. The German recommendations EBGEO [32] were used for the calculations with the Zaeske model [32]. The calculations with the Concentric Arches (CA) model were done according to the Dutch guidelines CUR226 [34]. The analytical models are ordered in Table 3 according to their complexity, with the Extended Carlsson model being the simplest and the CA model the most advanced. The results of the analytical calculations were compared to the numerical results on pile head load (), pile efficacy (), and maximum GR tensile load ().
Table 3.
Summary of the analytical models used for comparison and the guidelines (or standards) they are incorporated in.
Among the analytical models included in the comparison with the numerical model, the Zaeske model is the only one that supports a triangular pile arrangement. However, the only triangular pile arrangement supported in EBGEO is a square pile arrangement rotated 45 degrees. Thus, the formulas in Zaeske [31] for a triangular pile arrangement were used, as they support the geometry of the TK Geo 13 triangular pile arrangement utilised in this study. Note that ASIRI presents geometrical recommendations but no analytical models for triangular pile arrangements. Furthermore, the Zaeske model is the only one of the included analytical models that takes into consideration an elevated GR, i.e., a vertical distance between the pile head and the GR layer, when calculating the vertical stresses on the GR. The EBGEO [32] contains recommendations for GR elevations; however, no elevation is included as a variable when calculating the vertical stress on the GR. Thus, the vertical stresses on the GR were calculated using the formulas derived by Zaeske [31] for vertical stresses underneath the arch at metres above the pile heads (where = 0 m is in level with the pile heads), which are based on the same mechanical principles as the formulas prescribed in EBGEO. As previously mentioned, = 0.45 m for the numerically modelled lightly piled embankment.
According to the analytical models included in the comparison and the corresponding guidelines (Table 3), the calculated value of is the sum of the tensile load in the GR due to the membrane effect () and the added tensile load in the GR due to the spreading effect () in the transversal road direction. The calculation of differs between the included analytical models, and each method is briefly described further below. is calculated similarly for all of the analytical models. In the Extended Carlsson, SINTEF and H&R model, is calculated as
where is the coefficient of active earth pressure, is the embankment height of 2.5 m, is the unit weight of the embankment material (calculated as 21.7 kN/m3 for the partially saturated embankment), and is the surcharge (traffic) load of 15 kPa, resulting in = 18.1 kN/m. In the Zaeske and CA models, is subtracted from , which resulted to = 13.1 kN/m.
The Extended Carlsson, SINTEF, and H&R models, and their corresponding standards or recommendations consider no subsoil support. A void is assumed to form underneath the GR due to soil consolidation and creep strains. That means that the entire embankment weight and surcharge load are transferred onto the pile heads, directly through the arching effect and indirectly through the membrane effect. Thus, = 100% for the Extended Carlsson, SINTEF and H&R models. is based on the geometry, load on the GR, GR stiffness, and maximum GR strain (). The value of is chosen based on the allowed short- and long-term strains. was set to 6% for the calculations with the Extended Carlsson, SINTEF, and H&R model, in accordance with the long-term criteria in TR Geo 13, the Nordic guidelines, BS8006, and ASIRI. For the H&R model calculations, the load on the GR was set to the minimum load prescribed in BS8006, which is equivalent to 15% of the embankment weight and the surcharge load.
Both the Zaeske and the CA models take subsoil support into consideration. , is calculated in a fashion similar to the Extended Carlsson, SINTEF, and H&R models, except that is calculated instead of selected. The value of is determined at vertical equilibrium between the loads acting on the GR and the sum of the GR reaction force and the subsoil support. The subsoil support is based on the modulus of subgrade reaction () of the subsoil, which can be set to zero if a void is expected to form below the GR. Based on oedometer tests with a constant rate of strain, was set to 304 kN/m3 for the Zaeske model and 151 kN/m3 for the CA model. was greater for the Zaeske model, as the model considers the stiffness and thickness of the embankment fill under the elevated GR.
Figure 19 shows the analytically and numerically determined values of plotted against the pile centre-to-centre distance (). The numerical results are the average values of below the pavement for the square and triangular pile arrangements. The analytical results of the Zaeske model for the square and triangular pile arrangement are denoted as “Zaeske(Sq)” and “Zaeske(Tri)”, respectively. As previously mentioned, the analytical models included in this paper assume a uniform embankment height equal to the embankment crest height. Hence, the analytical models primarily estimate the load distribution below the pavement of the embankment. Thus, the numerical results shown in Figure 19 are based on the average embankment height below the pavement. The weight of the soil beneath the arches () is excluded from the calculation results shown in Figure 19 for the Extended Carlsson, SINTEF, and H&R models. Note that this underestimates the values of for these three models, since is normally set equal to the tributary load, defined as , according to the respective guideline in Table 3. For the Zaeske and CA models, in Figure 19 is the sum of the arched load () and the vertical component of () along the pile head perimeter. Unlike in CUR226, is not explicitly calculated in EBGEO. Thus, the Zaeske model results of were calculated using the methods in CUR226, combined with Zaeske (2001). As shown in Figure 19, the analytical results of for the Extended Carlsson, SINTEF, and CA models were larger than the numerical results for all values of . The results of the CA model almost followed the same trend as the numerical results, with an approximately 55% to 30% larger value of at = 0.8 to 2.0 m. The results of the Extended Carlsson and SINTEF models followed a similar trend as the numerical results, although the difference increased more than the CA results with increasing value of . The results of the SINTEF model were constant for ≥ 1.6 m due to the calculated arch becoming taller than the embankment. The results of the H&R and Zaeske(Sq) models showed a similar trend, and were the closest to the numerical results for the full range of . The results of the Zaeske(Tri) model of were the closest to the numerical results for ≤ 1.3 m. Contrary to the numerical results, the results of the Zaeske model showed much smaller values of in the triangular pile arrangement than in the square pile arrangement. In general, both of the numerical results of were lower than the analytical results for < 1.6 m. In the simulations, full arching or fully mobilised soil shear strength was not achieved, as the differential settlements between the pile heads and the subsoil were too small. In comparison, the analytical models assume full arching to be on the safe side with regard to the design axial load per pile. Thus, the numerical results were closer to the analytical results for ≥ 1.6 m, as the differential settlements between the pile heads and the subsoil became larger.
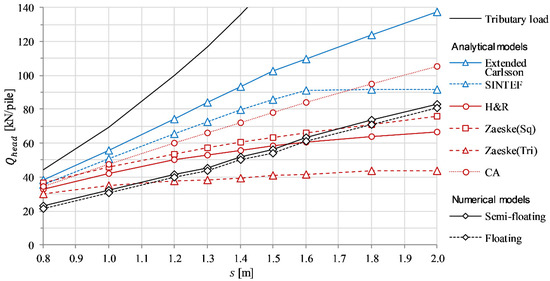
Figure 19.
Comparison of the pile head load () from the numerical and analytical results, as well as the tributary load, plotted against .
Figure 20 shows the resulting values of for the modelled range of . In the numerical results, is taken as the average value of the quantity above those pile heads that are located below the pavement. As seen in Figure 20, the Extended Carlsson, SINTEF, and H&R models give a much greater increase in than the numerical results for an increasing value of , which is due to the exclusion of subsoil support in these models. The results of the Zaeske(Sq) and CA models show a similar trend to the numerical results for the range of , with the results of the CA model being closer in magnitude to the numerical results. The values of were lower for Zaeske(Tri) than for Zaeske(Sq), since the sum of and in the transversal direction of the road was lower than in the longitudinal direction with the triangular pile arrangement. The Zaeske(Tri) results of decreased for > 1.5 m as the long diagonal of the rhombus-shaped arch base (length of ) became too great in relation to the embankment height to support a stable arch. However, the numerical results showed no arch instability for any value of s with the triangular pile arrangement. Overall, the numerical results of were significantly lower than the analytical results, with the exception of Zaeske(Tri) for = 2.0 m. This was firstly due to the active earth pressure not being fully mobilised in the numerical simulations, giving lower values of in the analytical models. Secondly, the magnitudes of GR deflection were less in the simulation than in the analytical calculations, and resulted in lower values of due to greater simulated subsoil support.
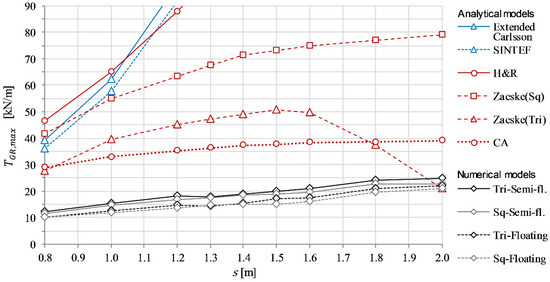
Figure 20.
Comparison of the maximum tensile load in the GR () from the numerical and analytical results, plotted against .
In conclusion, the results of the analytical calculations show that the numerical simulations are reliable in terms of load distribution in the embankment. The numerical and analytical results of were in good agreement overall. The numerical results of are deemed reasonable, though low compared with the analytical results. As expected, the more advanced analytical models (Zaeske and CA) were better at predicting the numerical results. The results of the Zaeske model came closest to the numerical results of . However, the difference in the results between the square and triangular pile arrangements was larger for the Zaeske model than for the numerical models. The CA model was the most consistent of the analytical models in the comparison, showing almost the same trend as the numerical results for not only but also . In contrast, the Extended Carlsson model greatly overestimated the numerical results, especially the results for . Thus, it would be more suitable to use the CA model instead of the Extended Carlsson model for the design of lightly piled embankments. However, due to its simplicity, the Extended Carlsson model could still be used for a first estimation if is substituted for .
The discussed guidelines (Table 3) present geometrical limits for stable arch formation in terms of , embankment height and square pile head width () or pile/pile head diameter (). These geometrical limits were compared with the hypothesis of an increased maximum allowable value of () in TK Geo 13 [16] for lightly piled embankments, currently at 1.2 m. EBGEO presents geometrical limits for both square and triangular pile arrangements. Table 4 shows a summary of for = 2.5 m according to each of the studied guidelines; is the diagonal centre-to-centre pile spacing, equal to for the square pile arrangements and for the triangular pile arrangements (longest diagonal between four piles). The results show that = 1.6 m satisfies all the geometrical limits in Table 4. For square and triangular pile arrangements, equals to 2.2 or 1.6 m, respectively. This supports the hypothesis that could be greater than 1.2 m for lightly piled embankments.
Table 4.
Maximum value of () for = 2.5 m, calculated using geometrical limits in the guidelines studied.
7. Concluding Remarks
The objective of the presented study was to evaluate the current design criteria in the Swedish national standards, TK Geo 13 [16], in terms of optimal pile arrangement (square or triangular) and centre-to-centre distance pile spacing (), in order to reduce the amount of timber piles used in light embankment piling. The hypothesis was that a triangular pile arrangement would result in the most stable arches and that the value of s could be greater than the upper limit of the TK Geo 13 design criteria of 0.8 ≤ ≤ 1.2 m. The evaluation of the design criteria was done by three-dimensional FE simulations of a typical lightly piled road embankment. The parameters used in the evaluation included the differential and total settlements, axial pile load, GR tensile load, and formation of arches, with a focus on resource efficiency. The modelled value of ranged from 0.8 to 2.0 m, including the TK Geo 13 design criterion of 0.8 ≤ ≤ 1.2 m. Both floating and semi-floating pile groups were modelled, with either square or triangular pile arrangements, resulting in 38 different cases in total. The limiting states were set as the maximum allowed total and differential settlements in TK Geo 13 as well as the structural bearing capacity of the piles and GR.
A state-of-the-art study was carried out on the mechanisms of load transfer in GRPSE, as well as the GRPSE guidelines and analytical models used in practice. The numerical results from FE simulations were compared and validated against results from five analytical models implemented in European national standards or recommendations, namely, the Extended Carlsson model by Rogbeck et al. [26] and the Concentric Arches (CA) model by Van Eekelen [8], the former being the prescribed analytical model in TR Geo 13 [24] for the design of lightly piled embankments. The results of the comparison show that the numerical simulations are reliable in terms of load distribution in the embankment. The numerical results of the GR tensile load were low in magnitude in comparison with the analytical results, but deemed reasonable. Overall, the Extended Carlsson model greatly overestimated the numerical results. Thus, it is recommended to use the CA model primarily instead of the Extended Carlsson model for the design of lightly piled embankments. However, the simpler Extended Carlsson model could still be used for a first estimation when designing them.
Mostly triangular arches were observed between the piles, due to lack of differential settlements between the piles and subsoil for semi-circular arches to form. Stable arches should in the present study form for ≤ 1.6 m, following the geometrical limits of the studied national standards and recommendations. The simulations showed no significant arch instabilities for the modelled range of , i.e., 0.8 ≤ ≤ 2.0 m. However, the slopes of the embankment had a significant influence on the overall arch formation. Due to the spreading effect of the embankment slopes arch formation was asymmetrical, with arches primarily forming in the longitudinal road direction. By modelling an embankment with uniform height instead, the arch formation was symmetrical in the transversal and the longitudinal road directions. The overall arching effect was also greater compared with the sloped embankment. In the GRPSE design, the embankments are in general assumed to be uniform when calculating the arching and membrane effect, and the spreading effect is only considered when calculating the tensile force in the GR. Thus, assuming a uniform embankment in GRPSE design may neglect asymmetrical arch formation caused by the spreading effect of the embankment slopes.
The simulations show that the pile arrangement, square or triangular, has no significant influence on the settlements of a lightly piled embankment, nor does the type of pile arrangement have any significant influence on the arching and the membrane effect. These results indicate that the maximum allowable value of in TK Geo 13 can increase from 1.2 to 1.6 m without reaching the characteristic bearing capacity of the timber piles. The structural bearing capacity of the GR was far from being exceeded for any value of s. Furthermore, the settlements did not exceed the serviceability limits in TK Geo 13 for the modelled range of . The settlements of embankments with a floating pile group remained almost constant for 0.8 ≤ ≤ 1.2 m. In contrast, the settlements increased by roughly 30% on average for the semi-floating pile groups when increasing s from 0.8 to 1.2 m. Thus, it might only be beneficial in terms of settlement reduction to install piles with < 1.2 m if the piles can be driven down to a firm soil layer or bedrock. By increasing from 1.2 to 1.4 m, the resource efficiency in terms of settlement reduction per pile increased by 30% for both the floating and semi-floating piles, and the number of piles was reduced by almost one third. Increasing above 1.4 m resulted in significantly less gain in resource efficiency. Based on the results, it is recommended to consider setting the TK Geo 13 design criterion of to 0.8 ≤ ≤ 1.4 m for lightly piled embankments. It should be noted that the geometry of the FE simulations is exact, which is not the case in reality. There are variations in pile head diameter, pile position and pile curvature, for example. No probabilistic model was used to take these variations into account. The piles can be expected to be driven within ±5 cm accuracy of the suggested design criterion of .
In the future, our research group is planning to examine the arching and membrane effect in lightly piled embankments for different embankment heights and locations of the GR, as well as to test the hypothesis of increased allowable to 1.4 m. A newly built three-lane motorway is currently being monitored. The monitoring results will be used to calibrate a physical model and an FE model of the motorway embankment.
Author Contributions
Conceptualization, P.G. and H.M.; methodology, P.G.; software, P.G.; validation, P.G. and H.M.; formal analysis, P.G.; investigation, P.G.; resources, H.M.; data curation, P.G.; writing—original draft preparation, P.G.; writing—review and editing, P.G., H.M. and J.L.; visualization, P.G.; supervision, H.M. and J.L.; project administration, H.M. and J.L.; funding acquisition, H.M. All authors have read and agreed to the published version of the manuscript.
Funding
This work was funded by the Swedish Transport Administration (STA) and the Swedish joint research program for road and railway geotechnology, Branschsamverkan i grunden (BIG) [grant number B2015-21].
Institutional Review Board Statement
Not applicable.
Informed Consent Statement
Not applicable.
Data Availability Statement
The data that support the findings of this study are available from the corresponding author upon reasonable request.
Conflicts of Interest
The authors declare no conflict of interest. The funders had no role in the design of the study; in the collection, analyses, or interpretation of data; in the writing of the manuscript, or in the decision to publish the results.
References
- Reynolds, T.N. Timber Piles and Foundations, BRE Digest 479; Building Research Establishment (BRE), BRE Bookshop: London, UK, 2003. [Google Scholar]
- Van Eekelen, S.J.M.; Meindert, A.V.; Bezuijen, A. The Kyoto Road, a full-scale test. Measurements and calculations. In Proceedings of the 14th European Conference on Soils Mechanics and Geotechnical Engineering, Madrid, Spain, 24–27 September 2007; Millpress: Rotterdam, The Netherland, 2007; Volume 1, pp. 1533–1538. [Google Scholar]
- Logheed, A. The Use of Geosynthetic Reinforced Pile-Supported Embankments on Port Mann Highway 1 Improvement Project. In Proceedings of the 6th International Young Geotechnical Engineers Conference, Seoul, Korea, 16–17 September 2017; International Society for Soil Mechanics and Geotechnical Engineering: London, UK, 2017; pp. 92–93. [Google Scholar] [CrossRef]
- Nurdin, S.; Sawada, K.; Moriguchi, S. Design Criterion of Reinforcement on Thick Soft Clay Foundations of Traditional Construction Method in Indonesia. MATEC Web Conf. 2019, 258, 03010. [Google Scholar] [CrossRef]
- Terzaghi, K. Theoretical Soil Mechanics; Wiley: New York, NY, USA, 1943. [Google Scholar]
- Le Hello, B.; Villard, P. Embankments reinforced by piles and geosynthetics—Numerical and experimental studies dealing with the transfer of load on the soil embankment. Eng. Geol. 2009, 106, 78–91. [Google Scholar] [CrossRef]
- Satibi, S. Numerical Analysis and Design Criteria of Embankments on Floating Piles. Ph.D. Thesis, Institute for Geotechnical Engineering, University of Stuttgart, Stuttgart, Germany, 2009. [Google Scholar]
- Van Eekelen, S.J.M. Basal Reinforced Piled Embankment—Experiments, Field Studies and the Development and Validation of a New Analytical Design Model. Ph.D. Thesis, Delft University of Technology, Delft, The Netherland, 2015. [Google Scholar] [CrossRef]
- Zhang, C.; Jiang, G.; Liu, X.; Buzzi, O. Arching in geogrid-reinforced pile-supported embankments over silty clay of medium compressibility: Field data and analytical solution. Comput. Geotech. 2016, 77, 11–25. [Google Scholar] [CrossRef]
- Van Eekelen, S.J.M.; Han, J. Geosynthetic-reinforced pile-supported embankments: State of the art. Geosynth. Int. 2020, 27, 112–141. [Google Scholar] [CrossRef]
- Gourc, J.P.; Villard, P. Reinforcement by membrane effect: Application to embankments on soil liable to subsidence. In Proceedings of the 2nd Asian Geosynthetics Conference, Kuala Lumpur, Malaysia, 29–31 May 2000; The Institution of Engineers Malaysia: Kuala Lumpur, Malaysia, 2000; Volume 1, pp. 55–72. [Google Scholar]
- Esmaeili, M.; Khajehei, H. Mechanical behavior of embankments overlying on loose subgrade stabilized by deep mixed columns. J. Rock Mech. Geotech. Eng. 2016, 8, 651–659. [Google Scholar] [CrossRef] [Green Version]
- Wijerathna, M.; Liyanapathirana, D.S. Load transfer mechanism in geosynthetic reinforced column-supported embankments. Geosynth. Int. 2020, 27, 236–248. [Google Scholar] [CrossRef]
- Dent, D. Acid Sulphate Soils: A Baseline for Research and Development; International Institute for Land Reclamation and Improvement (ILRI): Wageningen, The Netherlands, 1986. [Google Scholar]
- Pousette, K. Miljöteknisk Bedömning Och Hantering Av Sulfidjordsmassor (Environmental Assessment and Management of Sulfide Rich Soils); Luleå University of Technology: Luleå, Sweden, 2010. (In Swedish) [Google Scholar]
- STA. Trafikverkets Tekniska Krav för Geokonstruktioner-TK Geo 13; Publ. 2013:0667, Version 2.0; The Swedish Transport Administration (STA): Borlänge, Sweden, 2016. (In Swedish)
- STA. Trafikverkets Tekniska Krav för Geokonstruktioner-TK Geo 11; Publ. 2011:047; The Swedish Transport Administration (STA): Borlänge, Sweden, 2011. (In Swedish)
- Chai, X.J.; Deng, K.; He, C.F.; Xiong, Y.F. Laboratory Model Tests on Consolidation Performance of Soil Column with Drained-Timber Rod. Adv. Civ. Eng. 2021, 2021, 1–8. [Google Scholar] [CrossRef]
- Rixner, J.J.; Kraemer, S.R.; Smith, A.D. Prefabricated Vertical Drains; Federal Highway Administration: Washington, DC, USA, 1986; Volume I.
- Olson, S.J. Eisenhower Bridge North Abutment and Approach Settlement: A Case History of Timber Pile Downdrag and Comparative Downdrag Effect on Steel Piles. In Proceedings of the Geo-Congress 2020, Minneapolis, MN, USA, 25–28 February 2020; American Society of Civil Engineers (ASCE): Reston, VA, USA, 2020. [Google Scholar]
- Björklund, L.; Hesselman, J.; Lundgren, C.; Nylinder, M. Jämförelser Mellan Metoder för Fastvolymbestämning av Stockar; Institutionen för Skoglig Resurshållning (Department of Forest Resource Management) Report 15; Swedish University of Agricultural Sciences: Uppsala, Sweden, 2009. (In Swedish) [Google Scholar]
- BSI. British Standard BS8006-1; Code of Practice for Strengthened/Reinforced Soils and Other Fills. British Standards Institution (BSI): London, UK, 2010.
- Rogbeck, Y.; Alén, C.; Franzén, G.; Kjeld, A.; Odén, K.; Rathmayer, H.; Watn, A. Nordic Guidelines for Reinforced Soils and Fills; Revision B; The Nordic Geotechnical Societies and Nordic Industrial Fund: Linköping, Sweden, 2005. [Google Scholar]
- STA. Trafikverkets Tekniska Råd för Geokonstruktioner-TR Geo 13; Publ. 2013:0668, Version 2.0; The Swedish Transport Administration (STA): Borlänge, Sweden, 2016. (In Swedish)
- Carlsson, B. Armerad Jord Beräkningsprinciper för Vertikala Väggar, Branta Slänter, Bankar på Lös Undergrund, Bankar på Pålar; Terratema AB: Linköping, Sweden, 1987. (In Swedish) [Google Scholar]
- Rogbeck, Y.; Gustavsson, S.; Södergren, I.; Lindquist, D. Reinforced Piled Embankments in Sweden—Design Aspects. In Proceedings of the 6th International Conference on Geosynthetics, Atlanta, Georgia, 25–29 March 1998; International Geosynthetics Society: Jupiter, FL, USA, 1998; pp. 755–762. [Google Scholar]
- Svanø, G.; Ilstad, T.; Eiksund, G.; Want, A. Alternative calculation principle for design of piled embankments with base reinforcement. In Proceedings of the 4th International Conference on Ground Improvement Geosystems, Helsinki, Finland, 7–9 June 2000; International Geosynthetics Society: Jupiter, FL, USA, 2000; pp. 541–548. [Google Scholar]
- NPRA. Grunnforsterkning, Fyllinger og Skråninger, Håndbok V221, 2nd ed.; The Norwegian Public Roads Administration (NPRA): Oslo, Norway, 2014; (In Norwegian).
- Hewlett, W.J.; Randolph, M.F. Analysis of piled embankments. Ground Eng. 1988, 21, 12–18. [Google Scholar]
- IREX. ASIRI National Project—Recommendations for the Design, Construction and Control of Rigid Inclusion Ground Improvements; Institut Pour la Recherche Appliquée et L’expérimentation en Génie Civil (IREX): Paris, France, 2013. [Google Scholar]
- Zaeske, D. Zur Wirkungsweise von Unbewehrten und bewehrten Mineralischen Tragschichten Über Pfahlartigen Gründungselementen; University of Kassel: Kassel, Germany, 2001. (In German) [Google Scholar]
- DGGT. Recommendations for Design and Analysis of Earth Structures using Geosynthetic Reinforcements—EBGEO, 2nd ed.; English Translation; Reinforced Earth Structures over Point or Linear Bearing Elements; Wilhelm Ernst & Sohn: Berlin, Germany, 2011; pp. 151–200. [Google Scholar]
- Van Eekelen, S.J.M. The 2016-update of the Dutch Design Guidelines for Basal Reinforced Piled Embankments. In Proceedings of the 3rd International Conference on Transportation Geotechnics, Guimarães, Portugal, 4–7 September 2016; International Society for Soil Mechanics and Geotechnical Engineering: London, UK, 2016; Volume 143, pp. 582–589. [Google Scholar] [CrossRef] [Green Version]
- SBRCURnet. CUR226 Design Guideline Basal Reinforced Piled Embankments; Publ. CUR226:2016; SBRCURnet: Delft, The Netherland, 2016. [Google Scholar]
- Lai, H.-J.; Zheng, J.-J.; Zhang, J.; Zhang, R.-J.; Cui, L. DEM analysis of “soil”-arching within geogrid-reinforced and unreinforced pile-supported embankments. Comput. Geotech. 2014, 61, 13–23. [Google Scholar] [CrossRef]
- Bhasi, A.; Rajagopal, K. Numerical study of basal reinforced embankments supported on floating/end bearing piles considering pile–soil interaction. Geotext. Geomembranes 2015, 43, 524–536. [Google Scholar] [CrossRef]
- Rui, R.; Ye, Y.-Q.; Han, J.; Zhai, Y.-X.; Wan, Y.; Chen, C.; Zhang, L. Two-dimensional soil arching evolution in geosynthetic-reinforced pile-supported embankments over voids. Geotext. Geomembranes 2022, 50, 82–98. [Google Scholar] [CrossRef]
- Rui, R.; van Tol, F.; Xia, X.-L.; van Eekelen, S.; Hu, G.; Xia, Y.-Y. Evolution of soil arching; 2D DEM simulations. Comput. Geotech. 2016, 73, 199–209. [Google Scholar] [CrossRef]
- da Silva, T.S.; Elshafie, M.Z.E.B.; Madabhushi, G.S.P. Physical modelling of geosynthetic-reinforced soils spanning voids. In Proceedings of the 6th European Geosynthetics Congress, Ljubljana, Slovenia, 25–28 September 2016; Turkish Chapter of International Geosynthetics Society: Istanbul, Turkey, 2016; pp. 774–781. [Google Scholar]
- Iglesia, G.R.; Einstein, H.H.; Whitman, R.V. Investigation of Soil Arching with Centrifuge Tests. J. Geotech. Geoenviron. Eng. 2014, 140, 04013005. [Google Scholar] [CrossRef]
- Van der Peet, T.C.; Van Eekelen, S.J.M. 3D numerical analysis of basal reinforced piled embankments. In Proceedings of the 10th International Conference on Geosynthetics, Berlin, Germany, 21–25 September 2014; International Geosynthetics Society: Jupiter, FL, USA, 2014; Volume 3. [Google Scholar]
- King, D.; Bouazza, A.; Gniel, J.R.; Rowe, R.K.; Bui, H.H. Load-transfer platform behaviour in embankments supported on semi-rigid columns: Implications of the ground reaction curve. Can. Geotech. J. 2017, 54, 1158–1175. [Google Scholar] [CrossRef]
- Brinkgreve, R.B.J.; Kumarswarmy, S.; Swolfs, W.M.; Foria, F. PLAXIS 3D 2017—Manual; Plaxis bv: Delft, The Netherlands, 2017. [Google Scholar]
- Tschuchnigg, F.; Schweiger, H. The embedded pile concept—Verification of an efficient tool for modelling complex deep foundations. Comput. Geotech. 2015, 63, 244–254. [Google Scholar] [CrossRef]
- Gunnvard, P.; Mattsson, H.; Laue, J. Numerical Analysis of the Mechanical Behaviour of Light Embankment Piling. In Proceedings of the 19th International Conference on Soil Mechanics and Geotechnical Engineering, Seoul, Korea, 17–22 September 2017; Korean Geotechnical Society: Seoul, Korea, 2017; Volume 1, pp. 749–752. [Google Scholar]
- Hong, W.P.; Hong, S.; Song, J.S. Load Transfer by Punching Shear in Pile-Supported Embankments on Soft Grounds. Mar. Georesour. Geotechnol. 2011, 29, 279–298. [Google Scholar] [CrossRef]
- Larsson, R. Information 1—Jords Egenskaper, 5th ed.; Swedish Geotechnical Institute: Linköping, Sweden, 2008. (In Swedish) [Google Scholar]
- Eriksson, P.; Jendeby, L.; Olsson, T.; Svensson, T. Kohesionspålar; Report 100; Pålkommissionen (Commission on Pile Research): Linköping, Sweden, 2004. (In Swedish) [Google Scholar]
- SIS. SS-EN 338:2016; Structural Timber—Strength Classes. Swedish Standards Institute (SIS): Stockholm, Sweden, 2016.
- Dinwoodie, J.M. Timber; Its Nature and Behaviour; Taylor & Francis e-Library [e-book]: Milton Park, UK, 2004; ISBN 0-203-47787-1. [Google Scholar]
- Ingströmer, P.; Lindblad, E. Hygro-Mekaniskt Beteende Hos Trä Vid Olika Klimatförhållanden. Master’s Thesis, Lund Institute of Technology, Lund, Sweden, 1998. (In Swedish). [Google Scholar]
- Rui, R.; Zhai, Y.X.; Han, J.; Van Eekelen, S.J.M.; Chen, C. Deformations in trapdoor tests and piled embankments. Geosynth. Int. 2020, 27, 219–235. [Google Scholar] [CrossRef]
- Fahmi Farag, G.S. Lateral Spreading in Basal Reinforced Embankments Supported by Pile-Like Elements; University of Kassel: Kassel, Germany, 2008. [Google Scholar]
- Briançon, L.; Simon, B. Performance of Pile-Supported Embankment over Soft Soil: Full-Scale Experiment. J. Geotech. Geoenviron. Eng. 2012, 138, 551–561. [Google Scholar] [CrossRef]
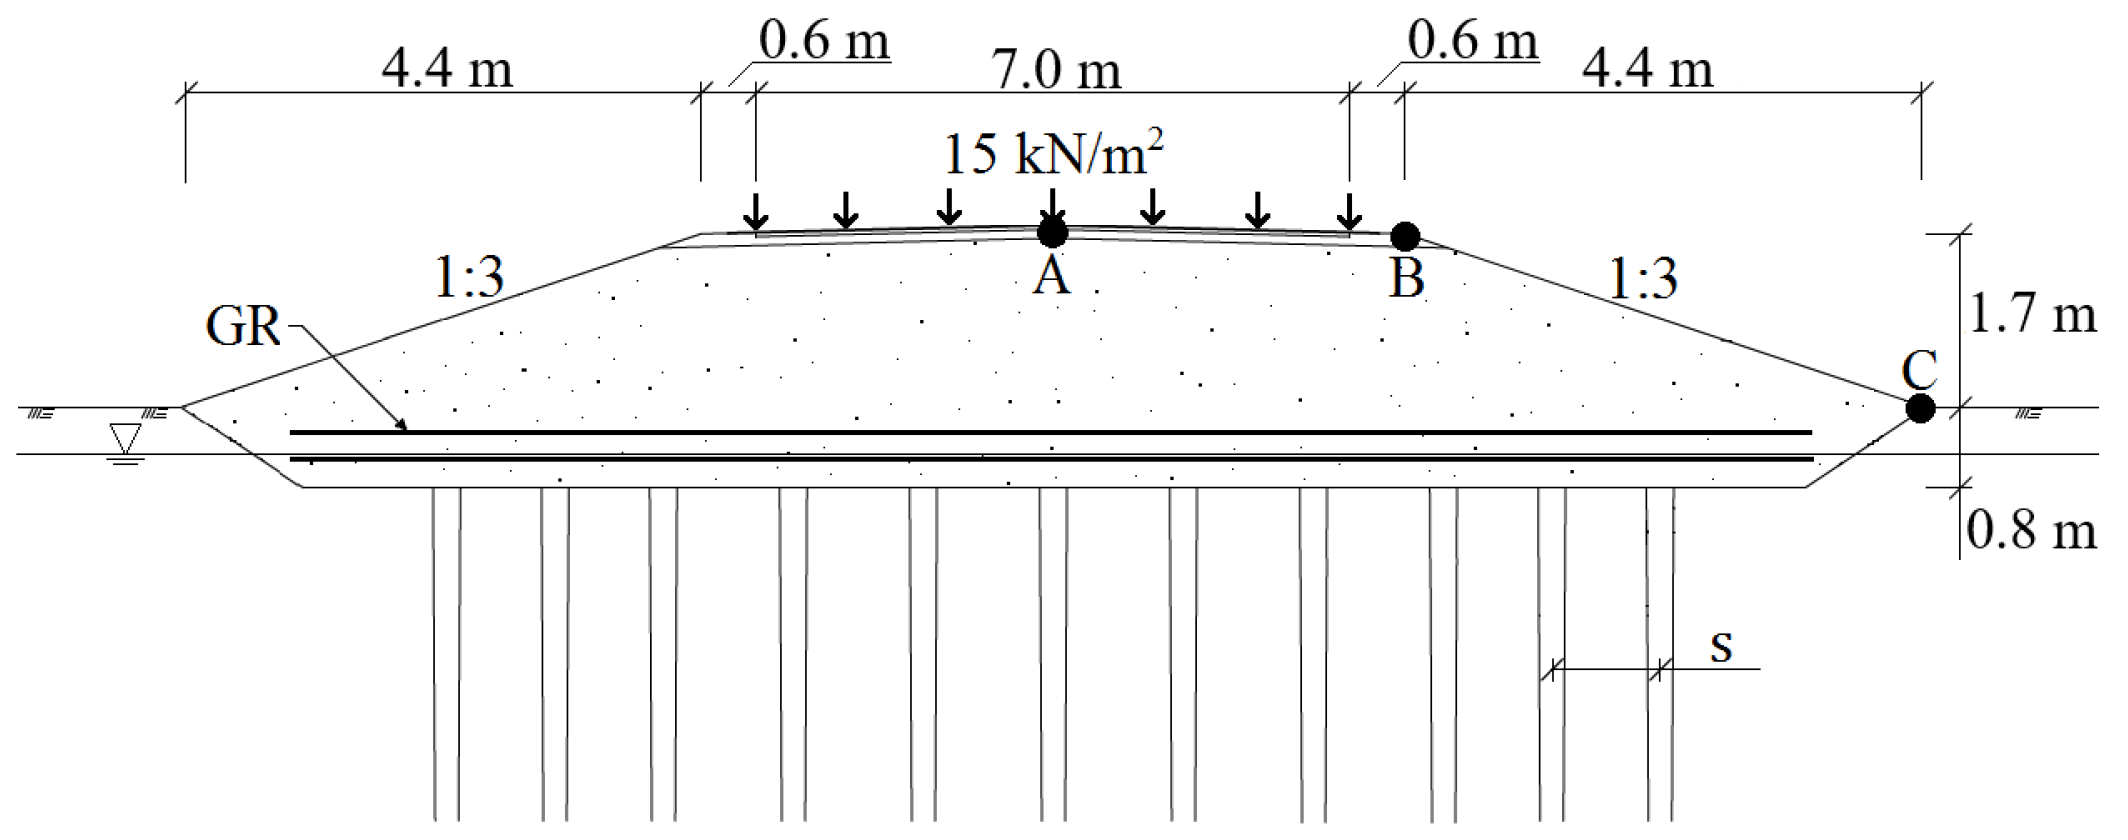
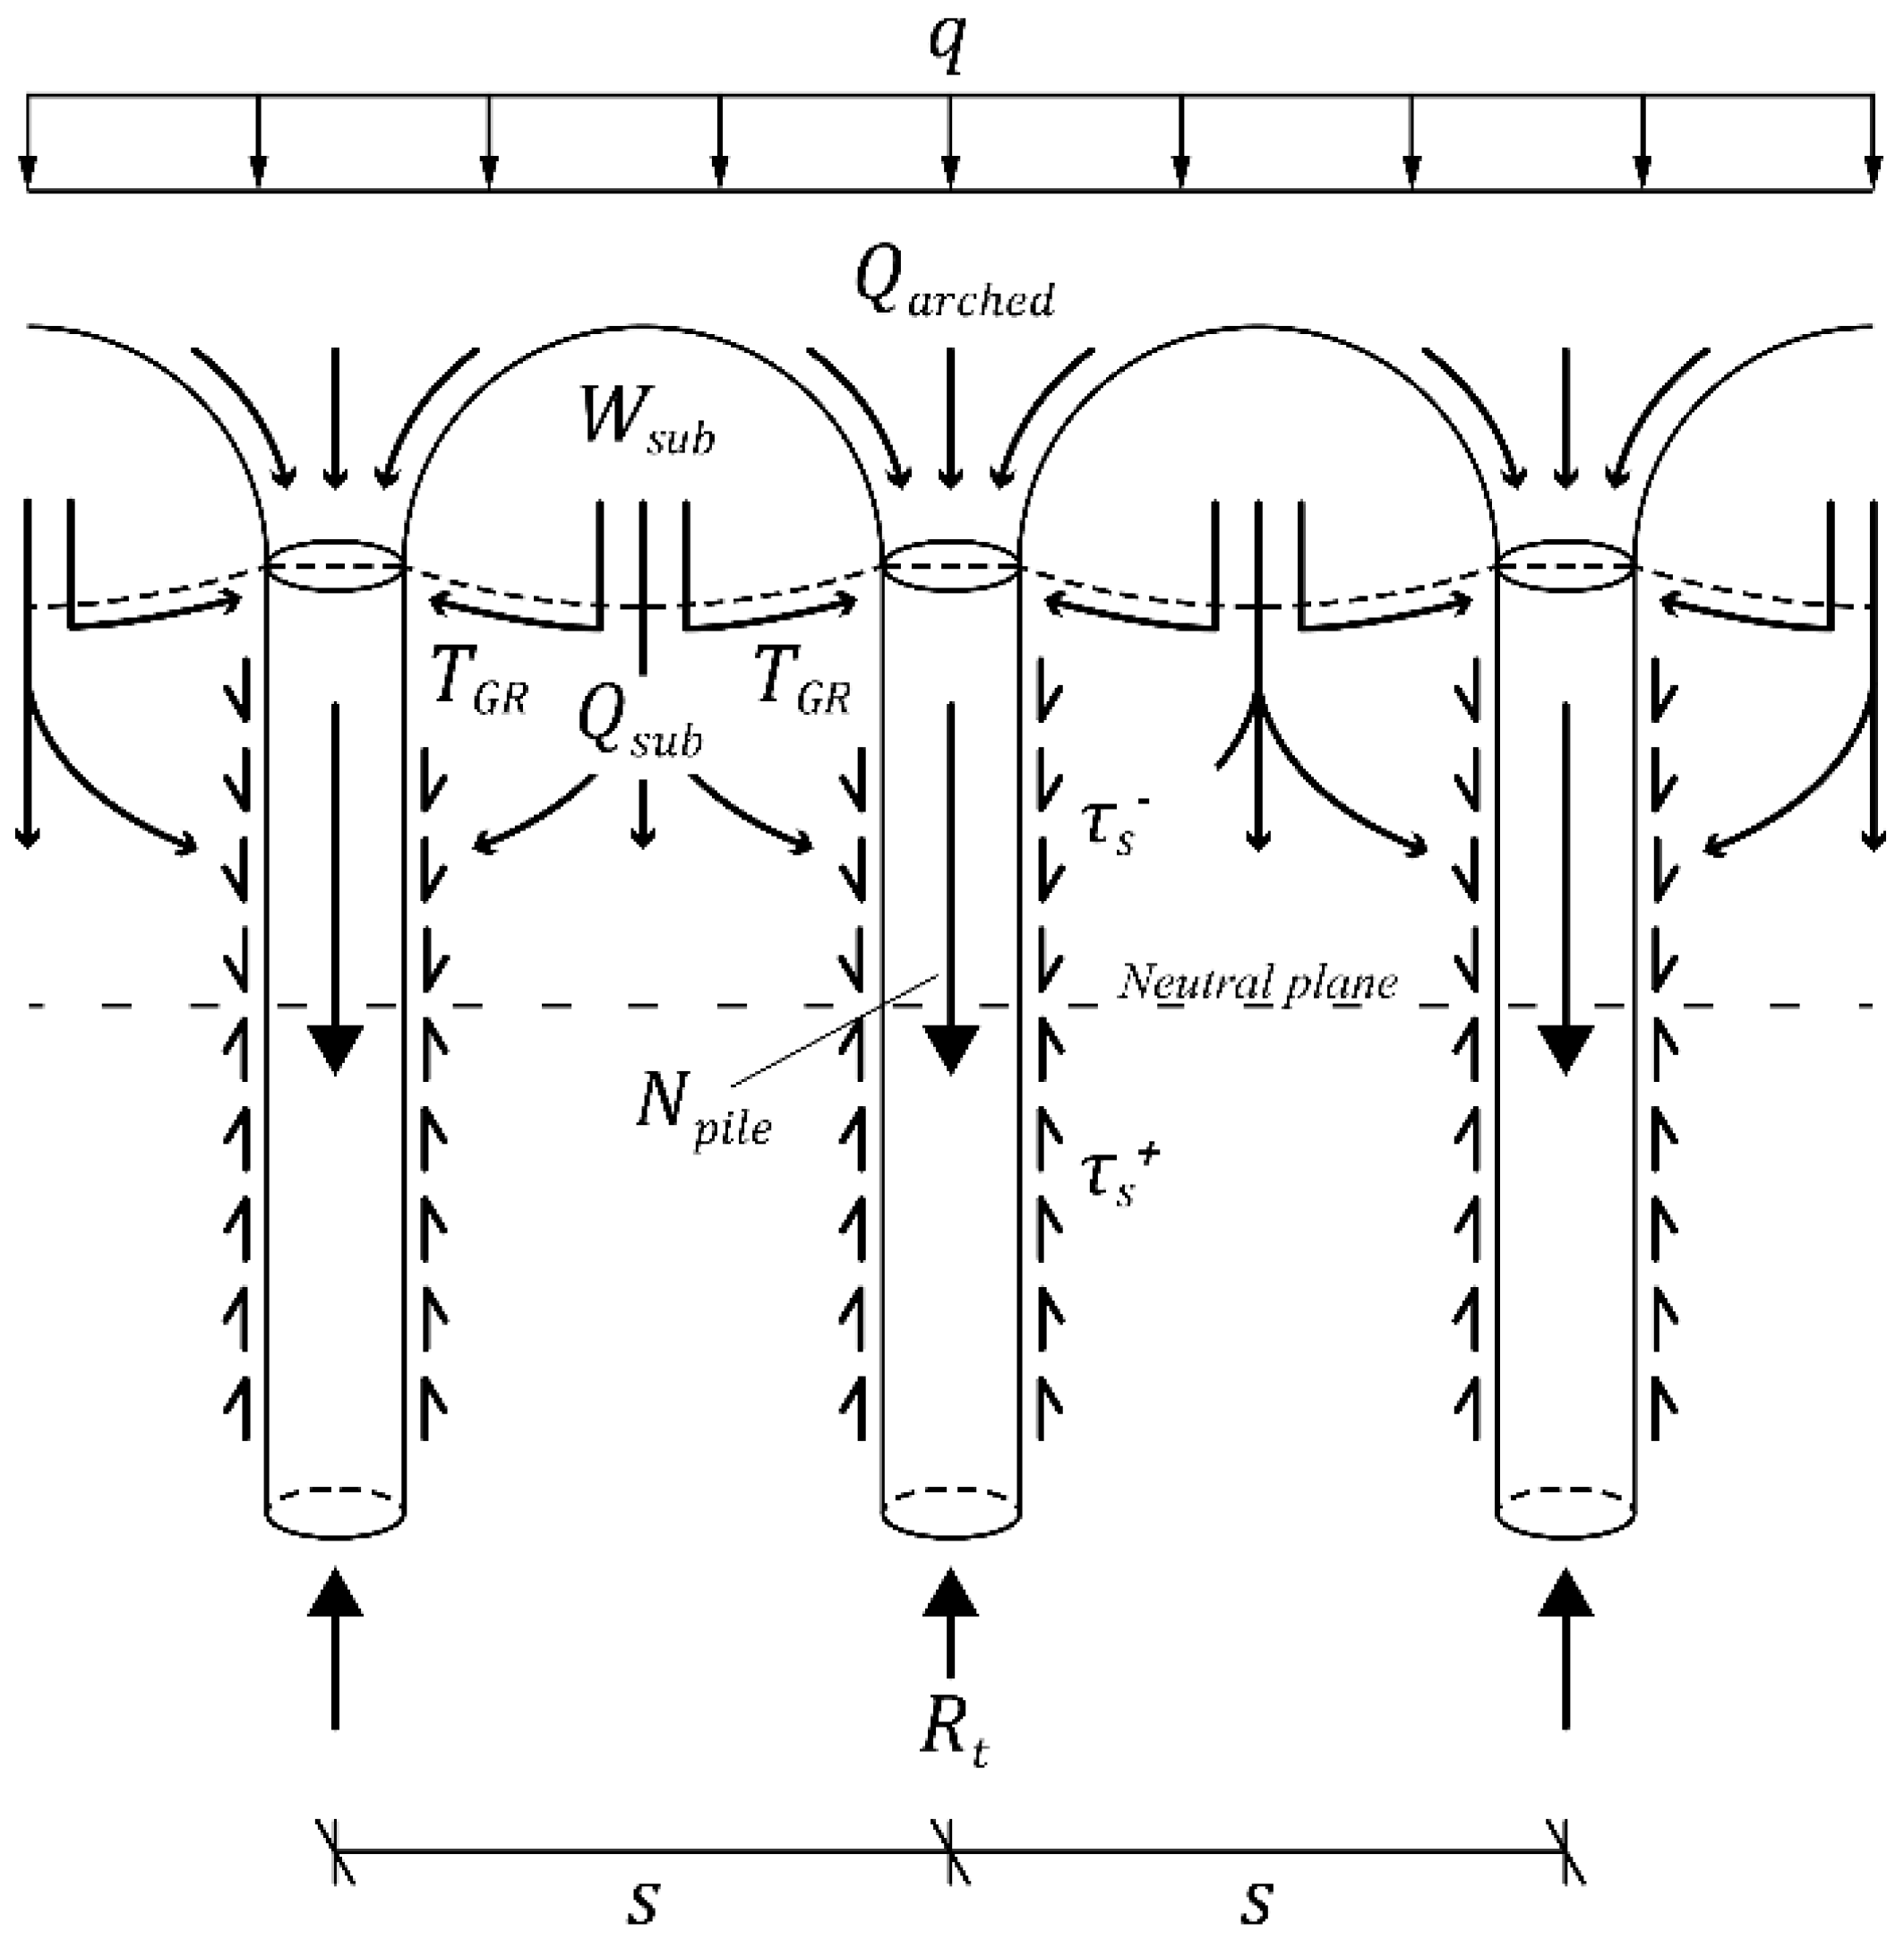
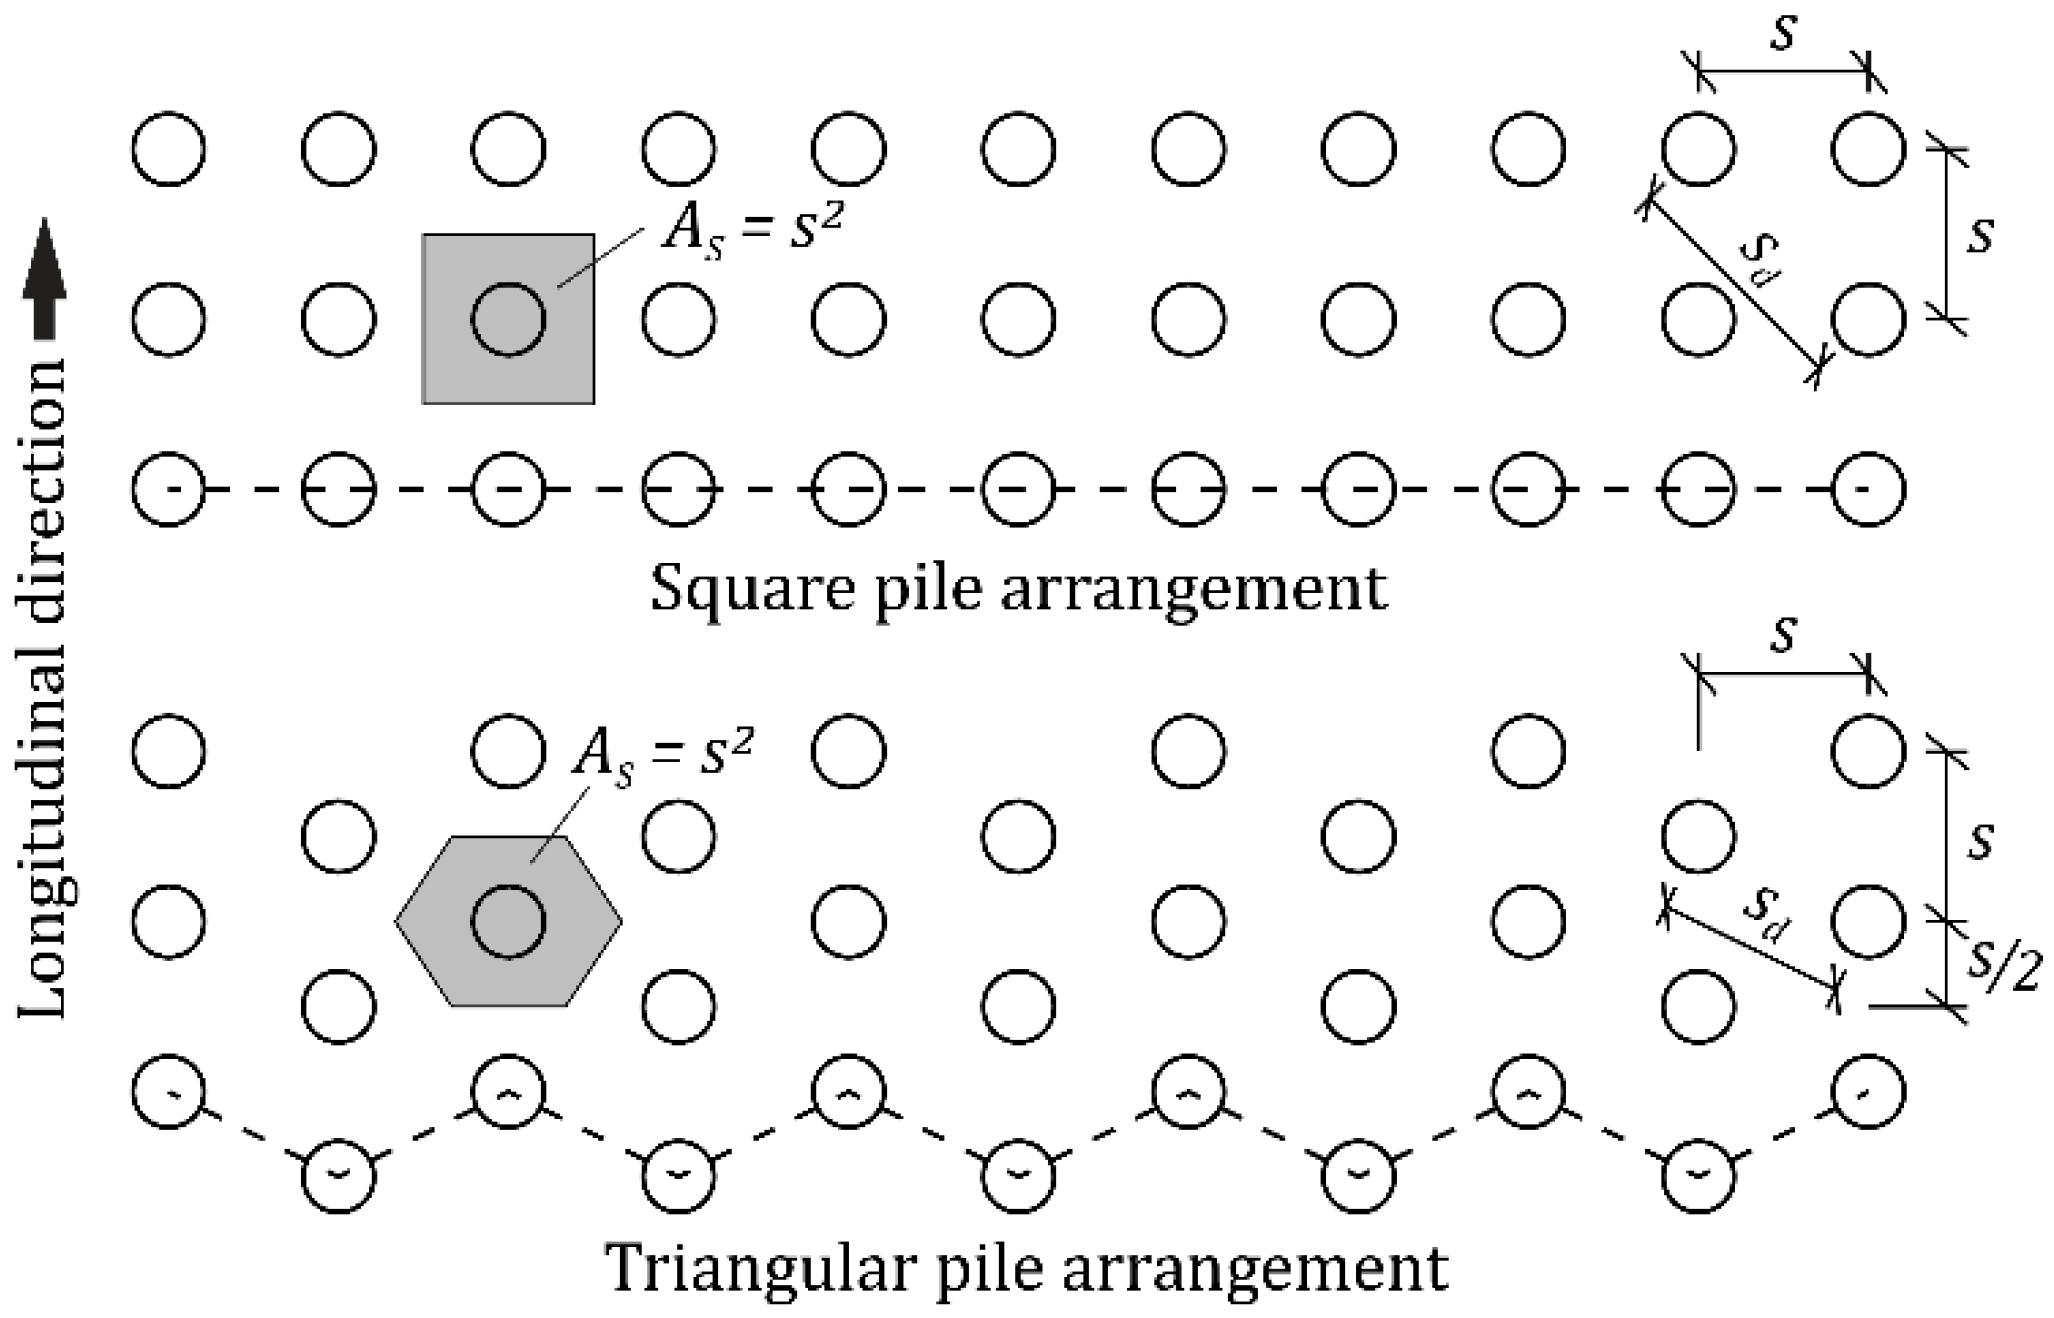
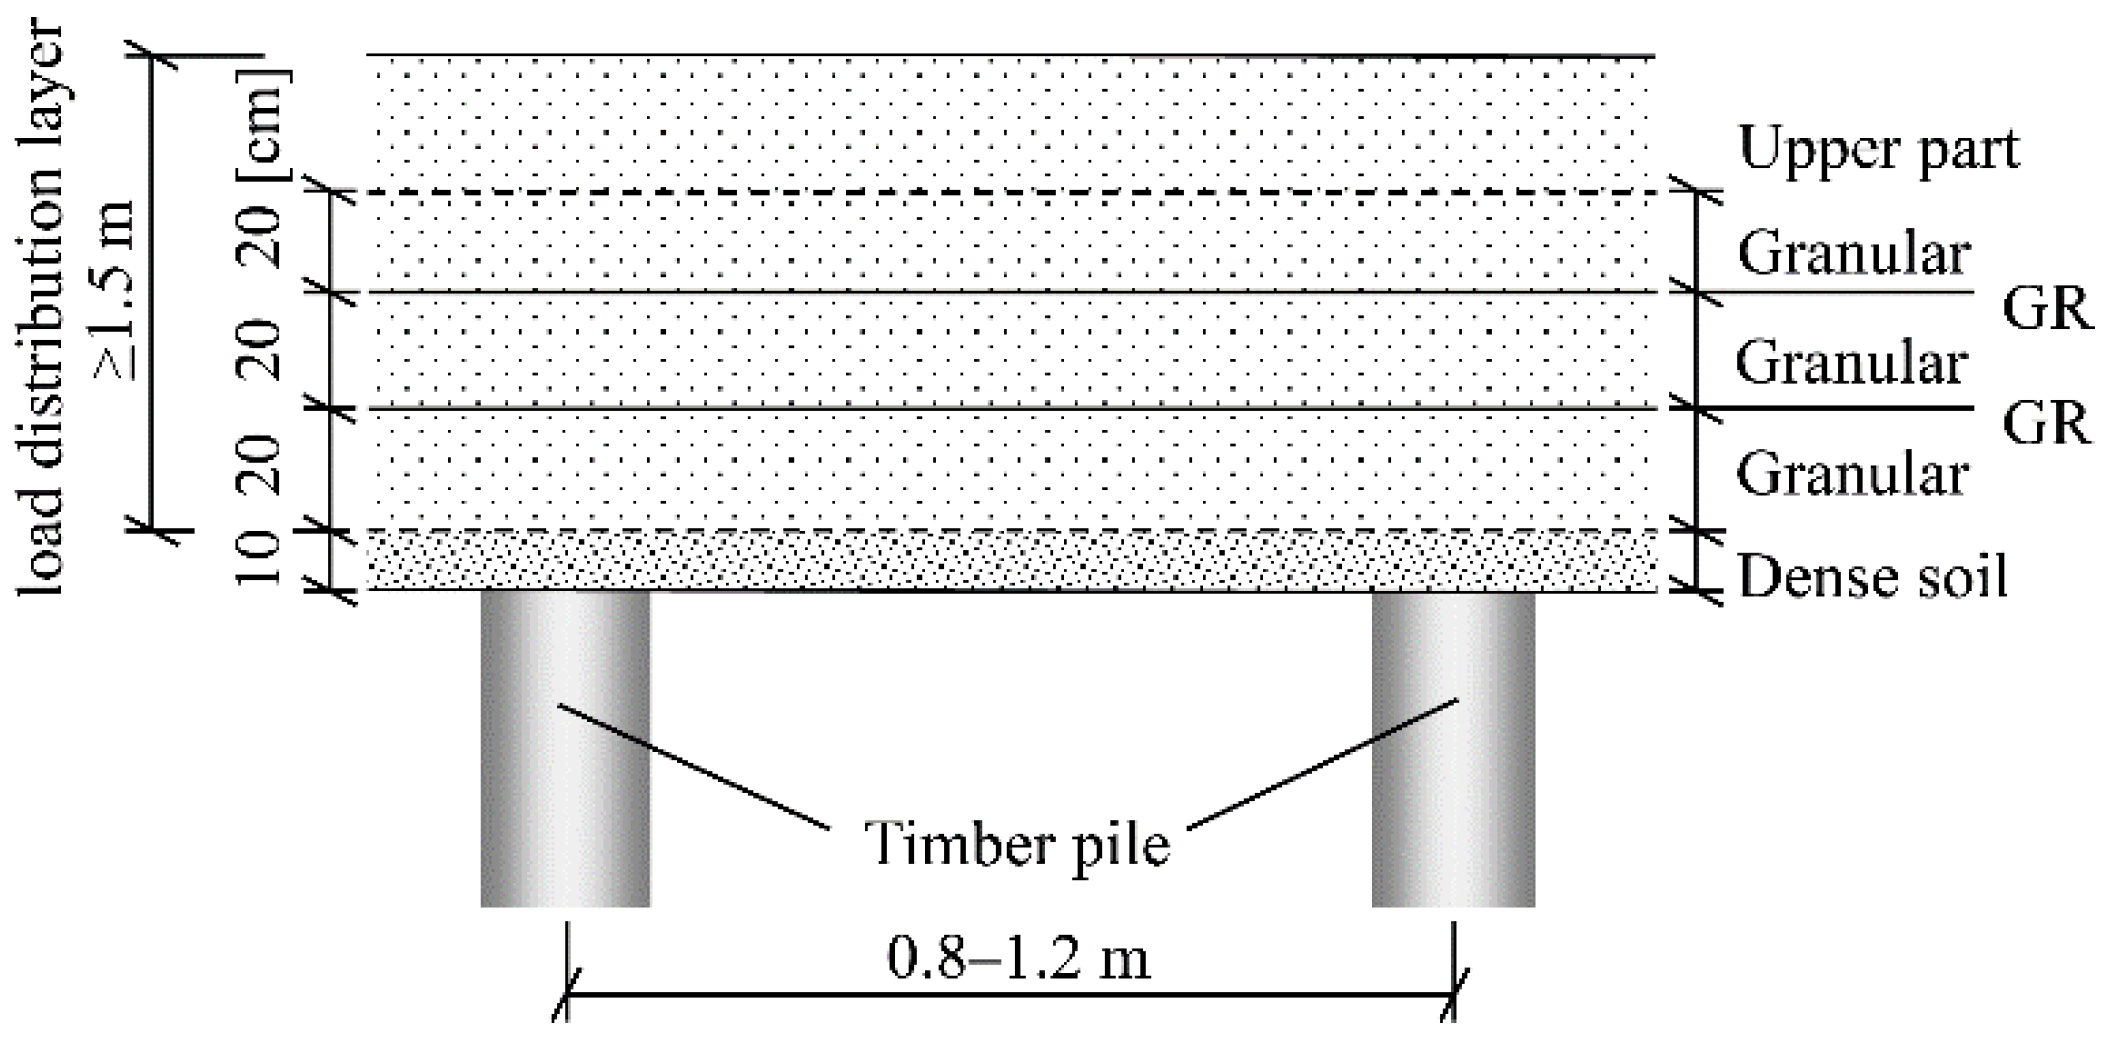
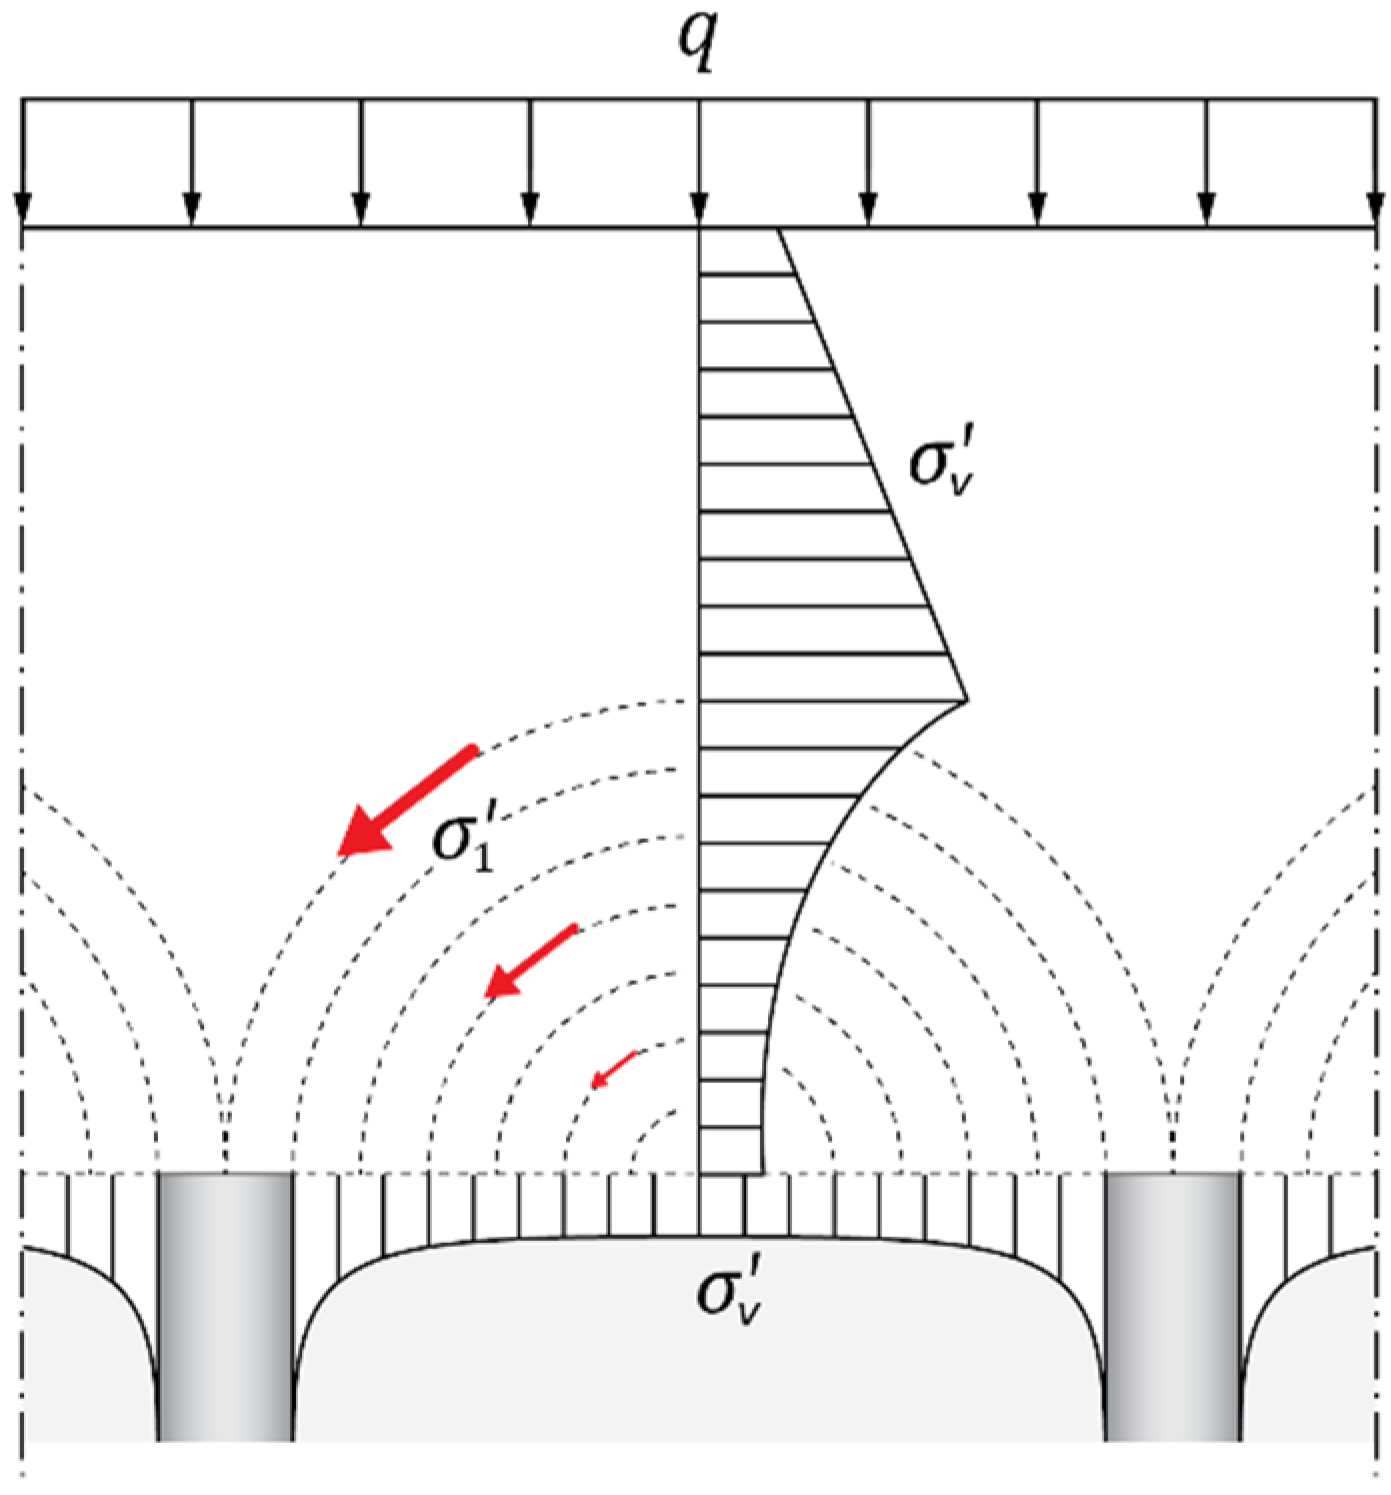

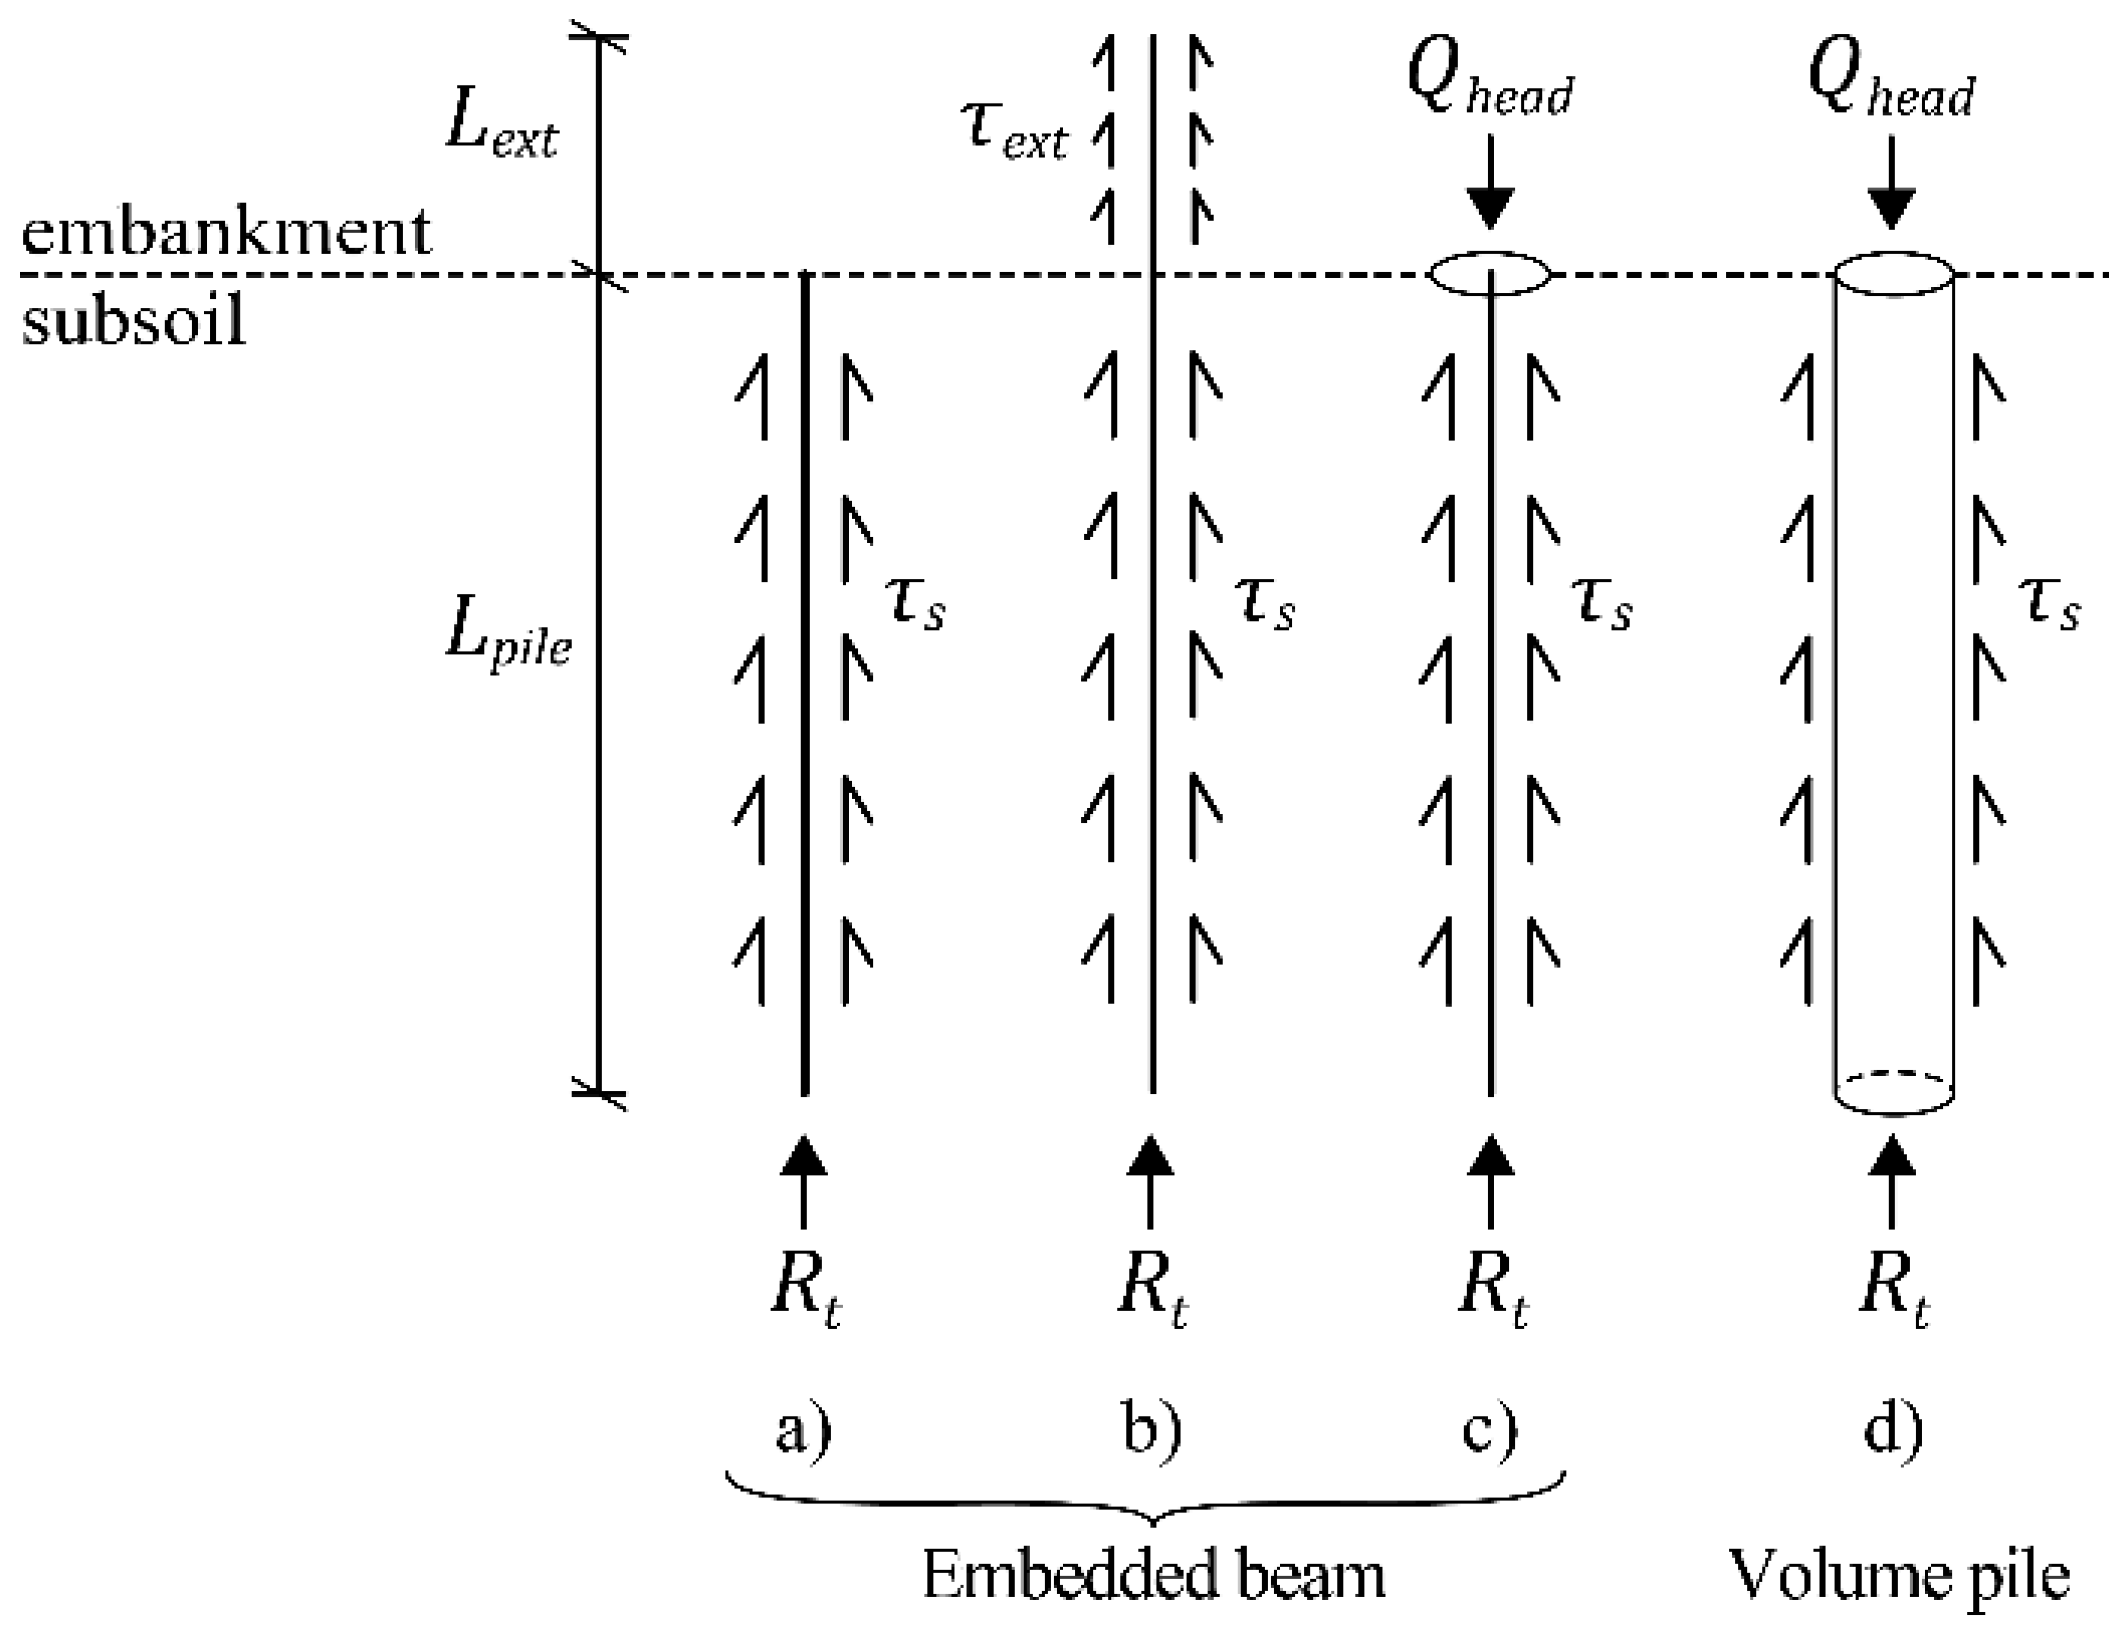
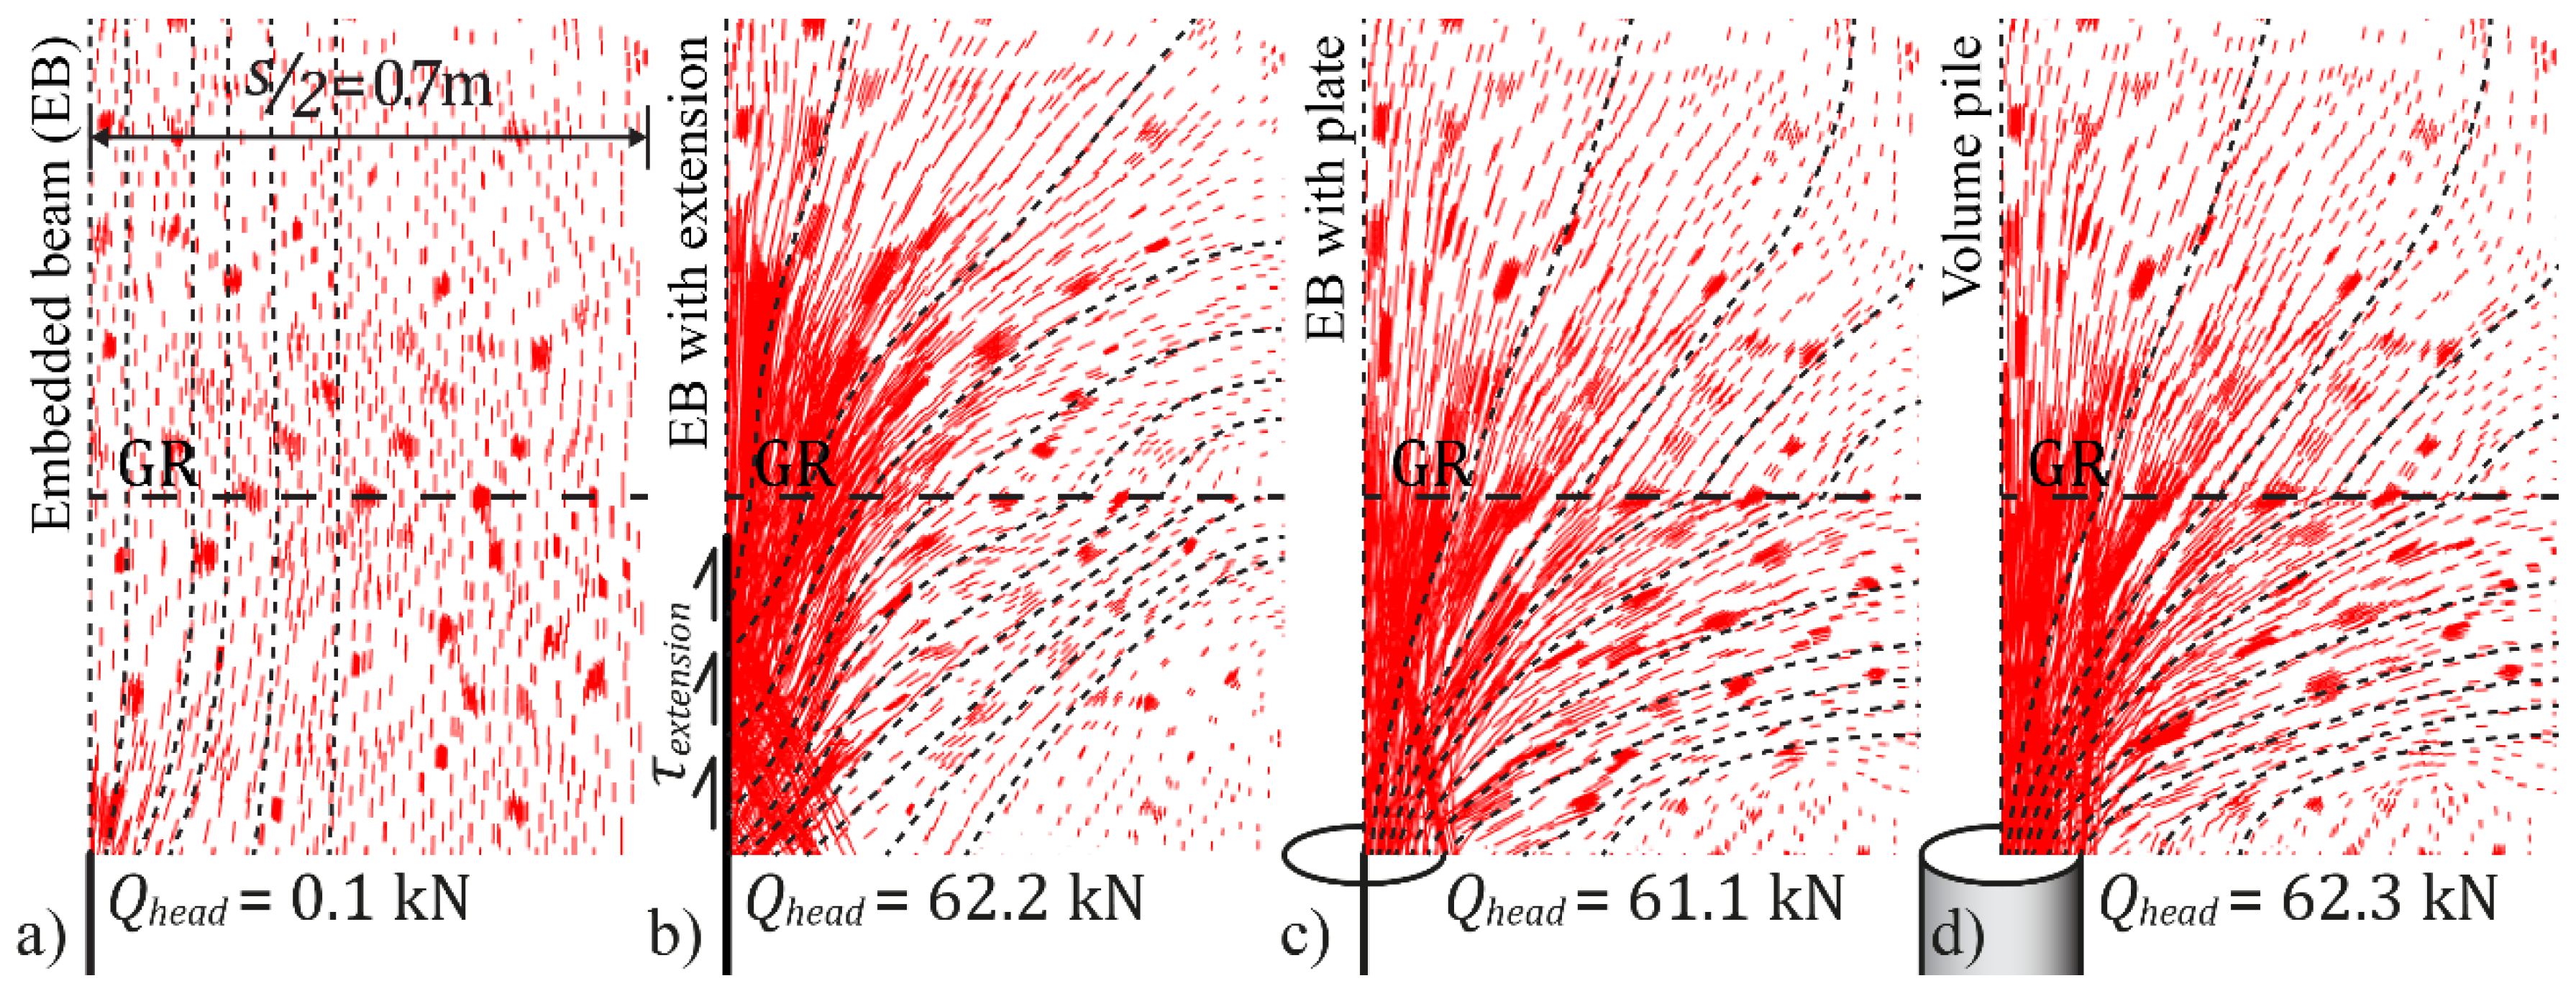
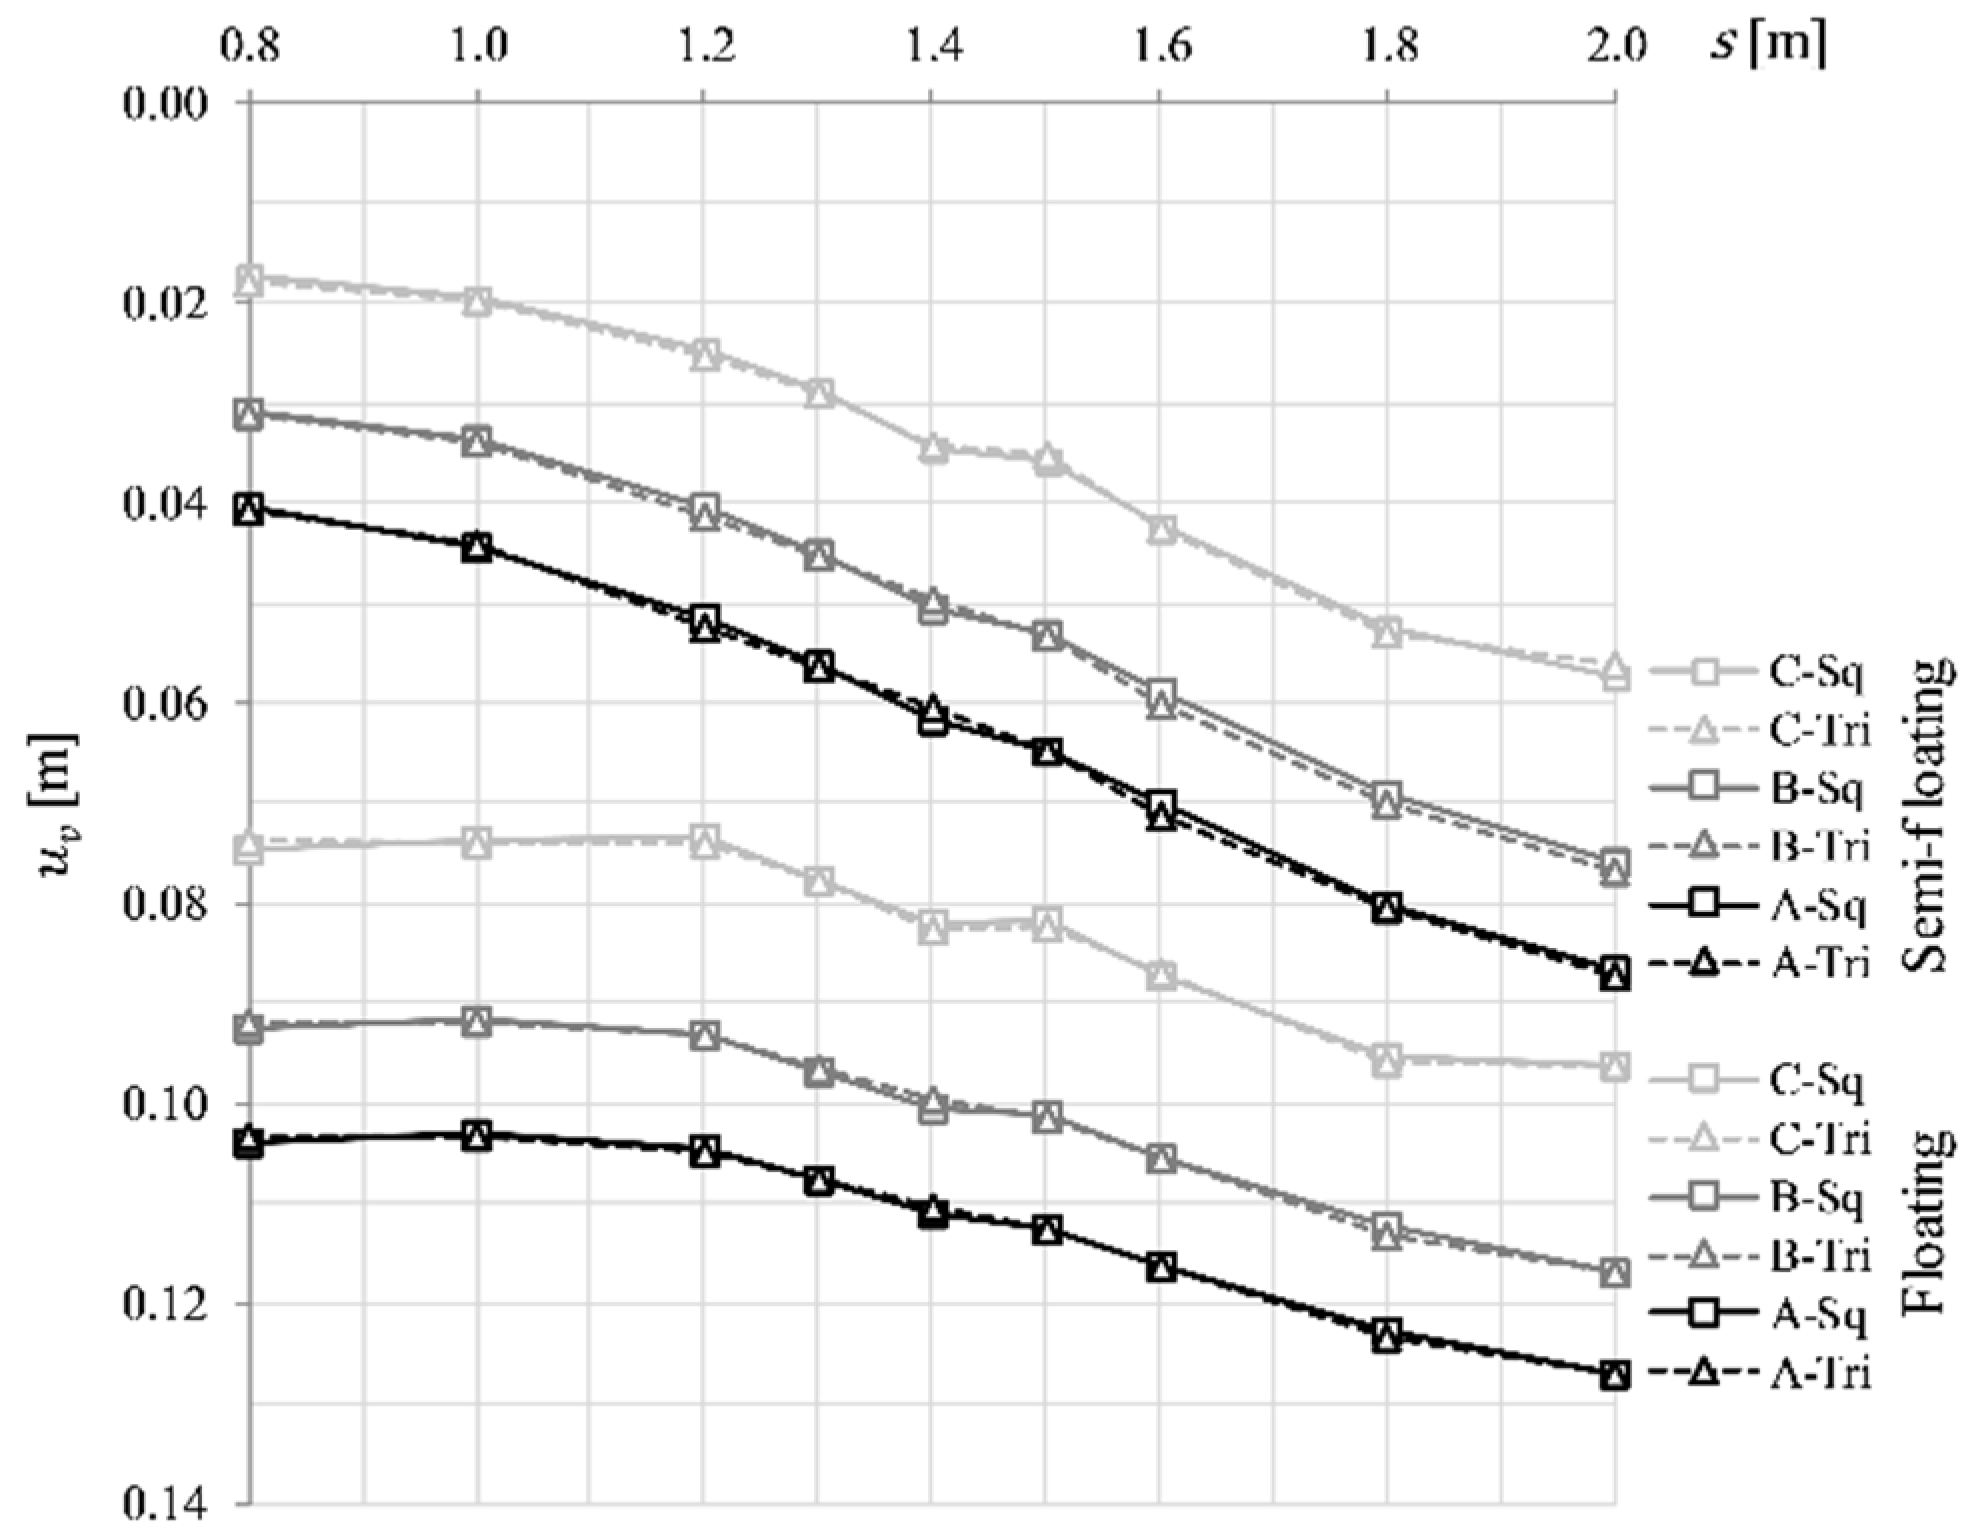

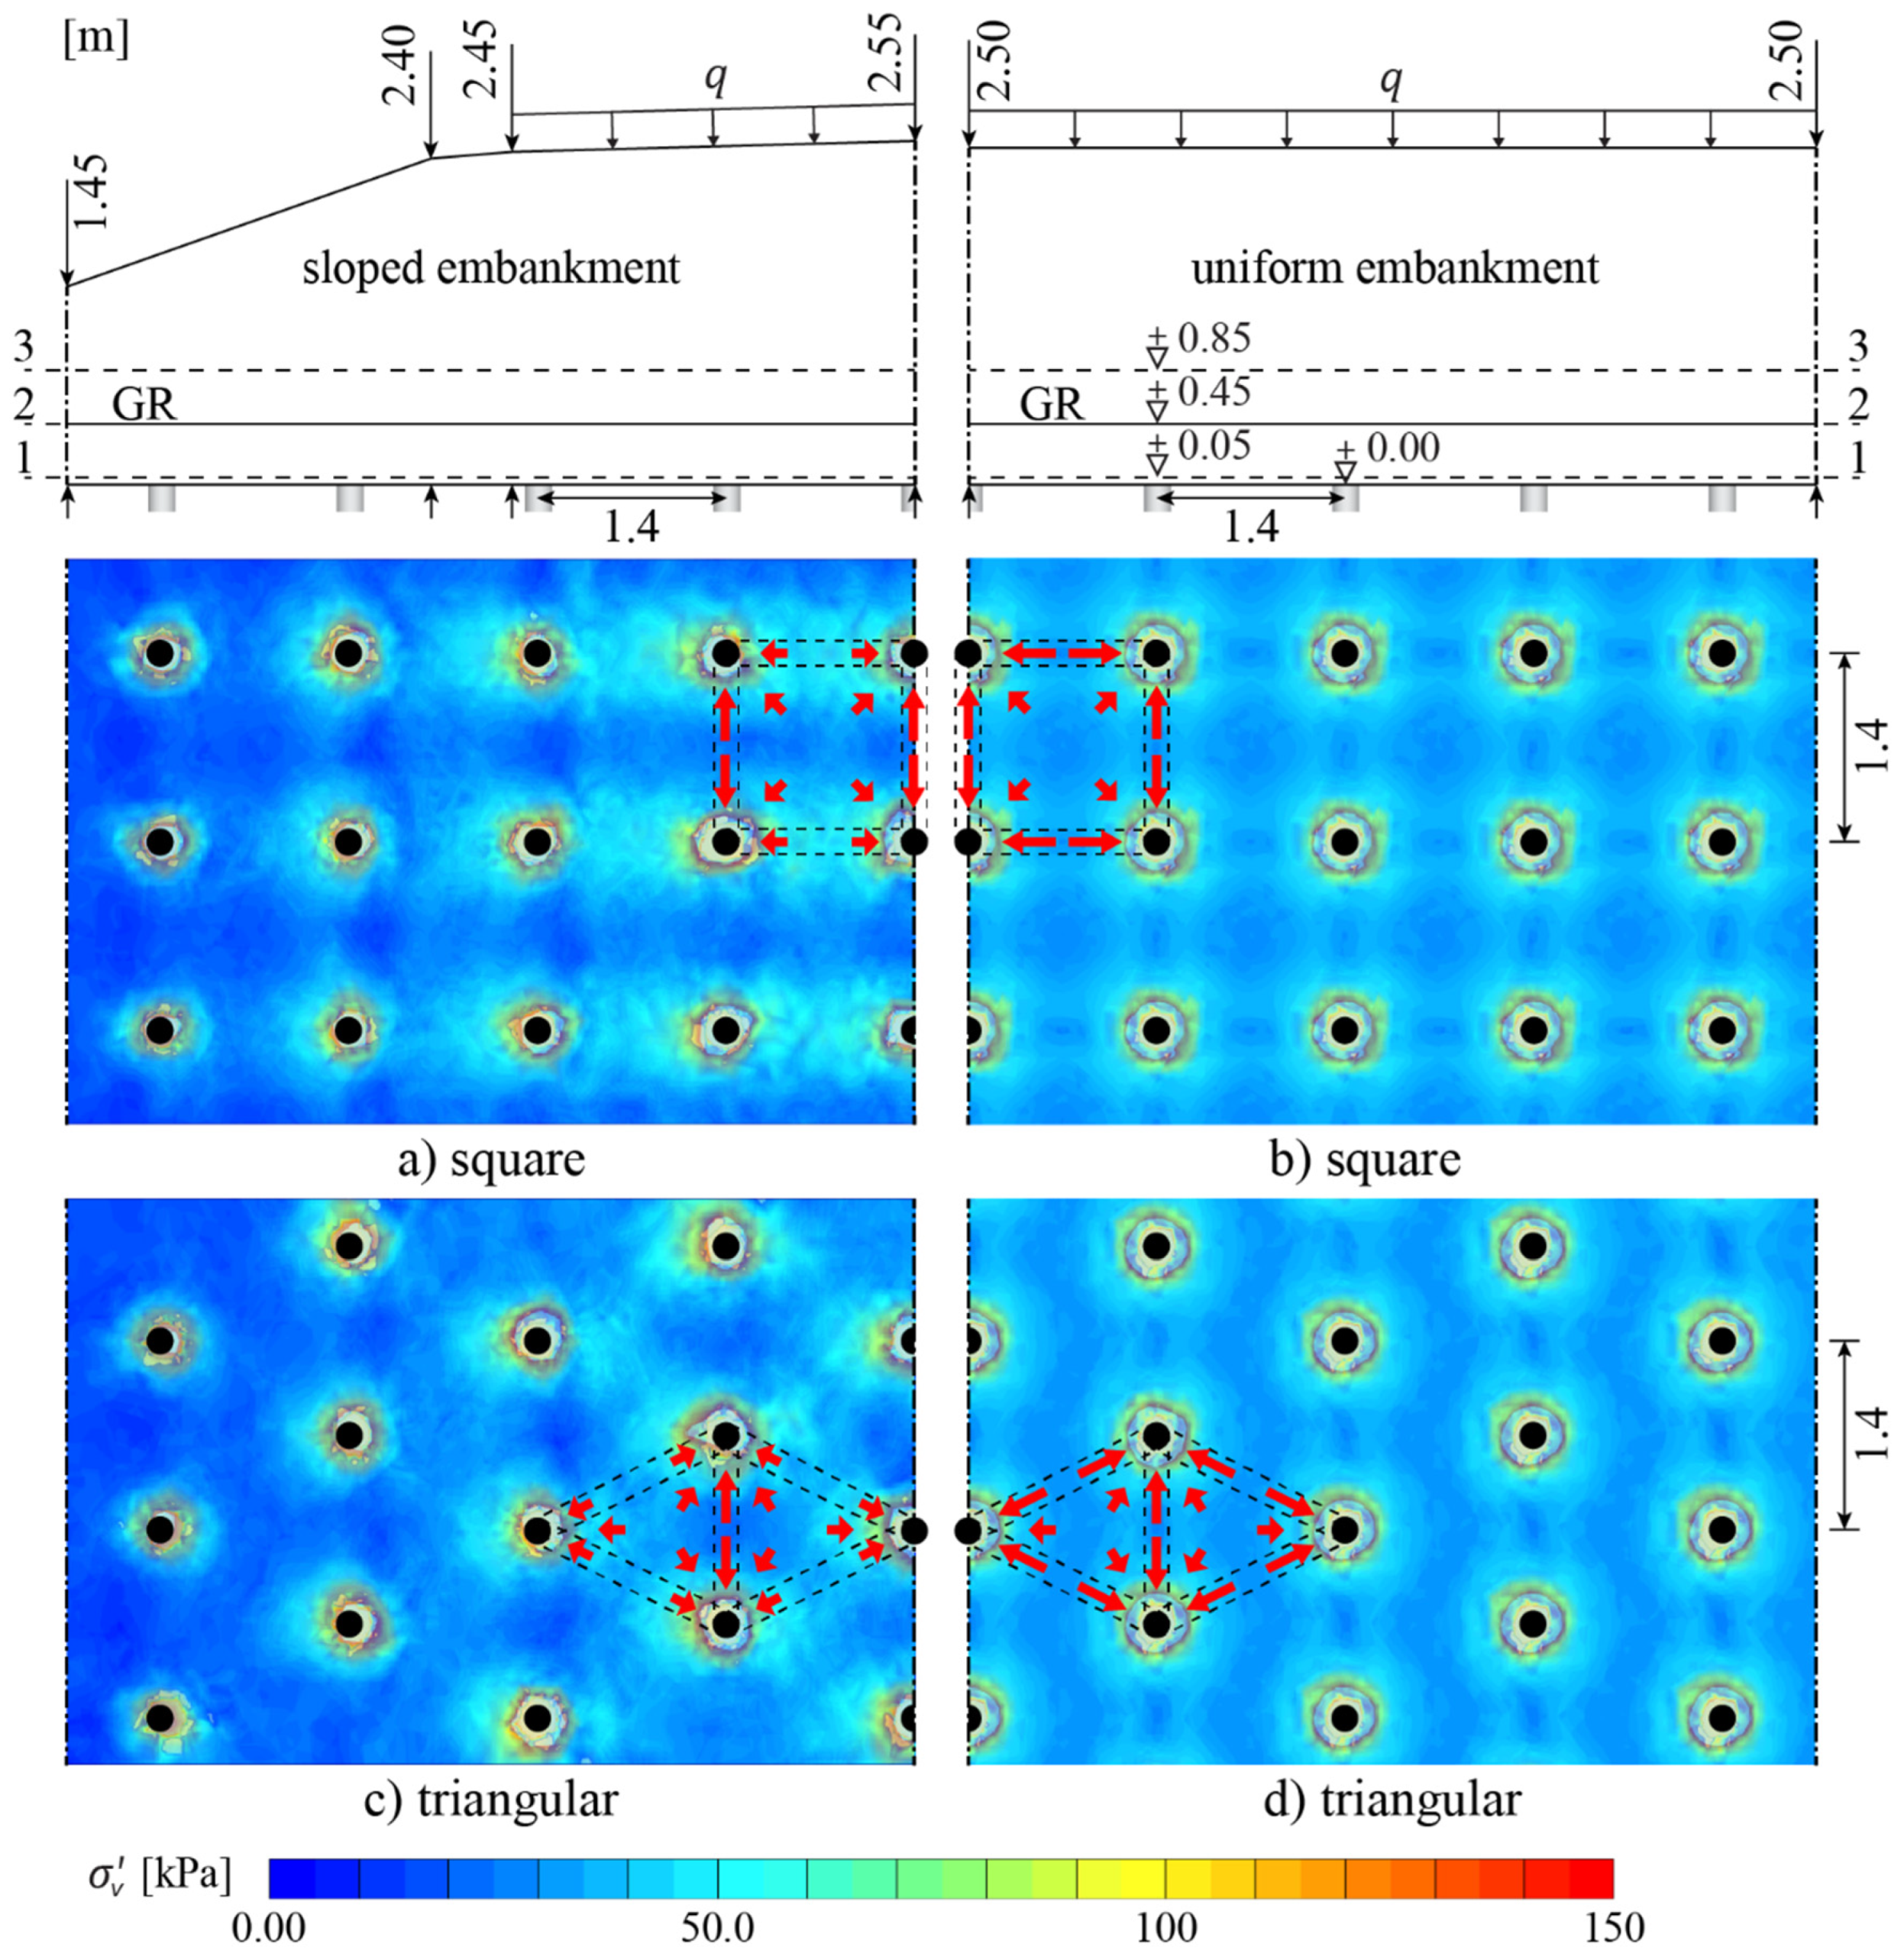

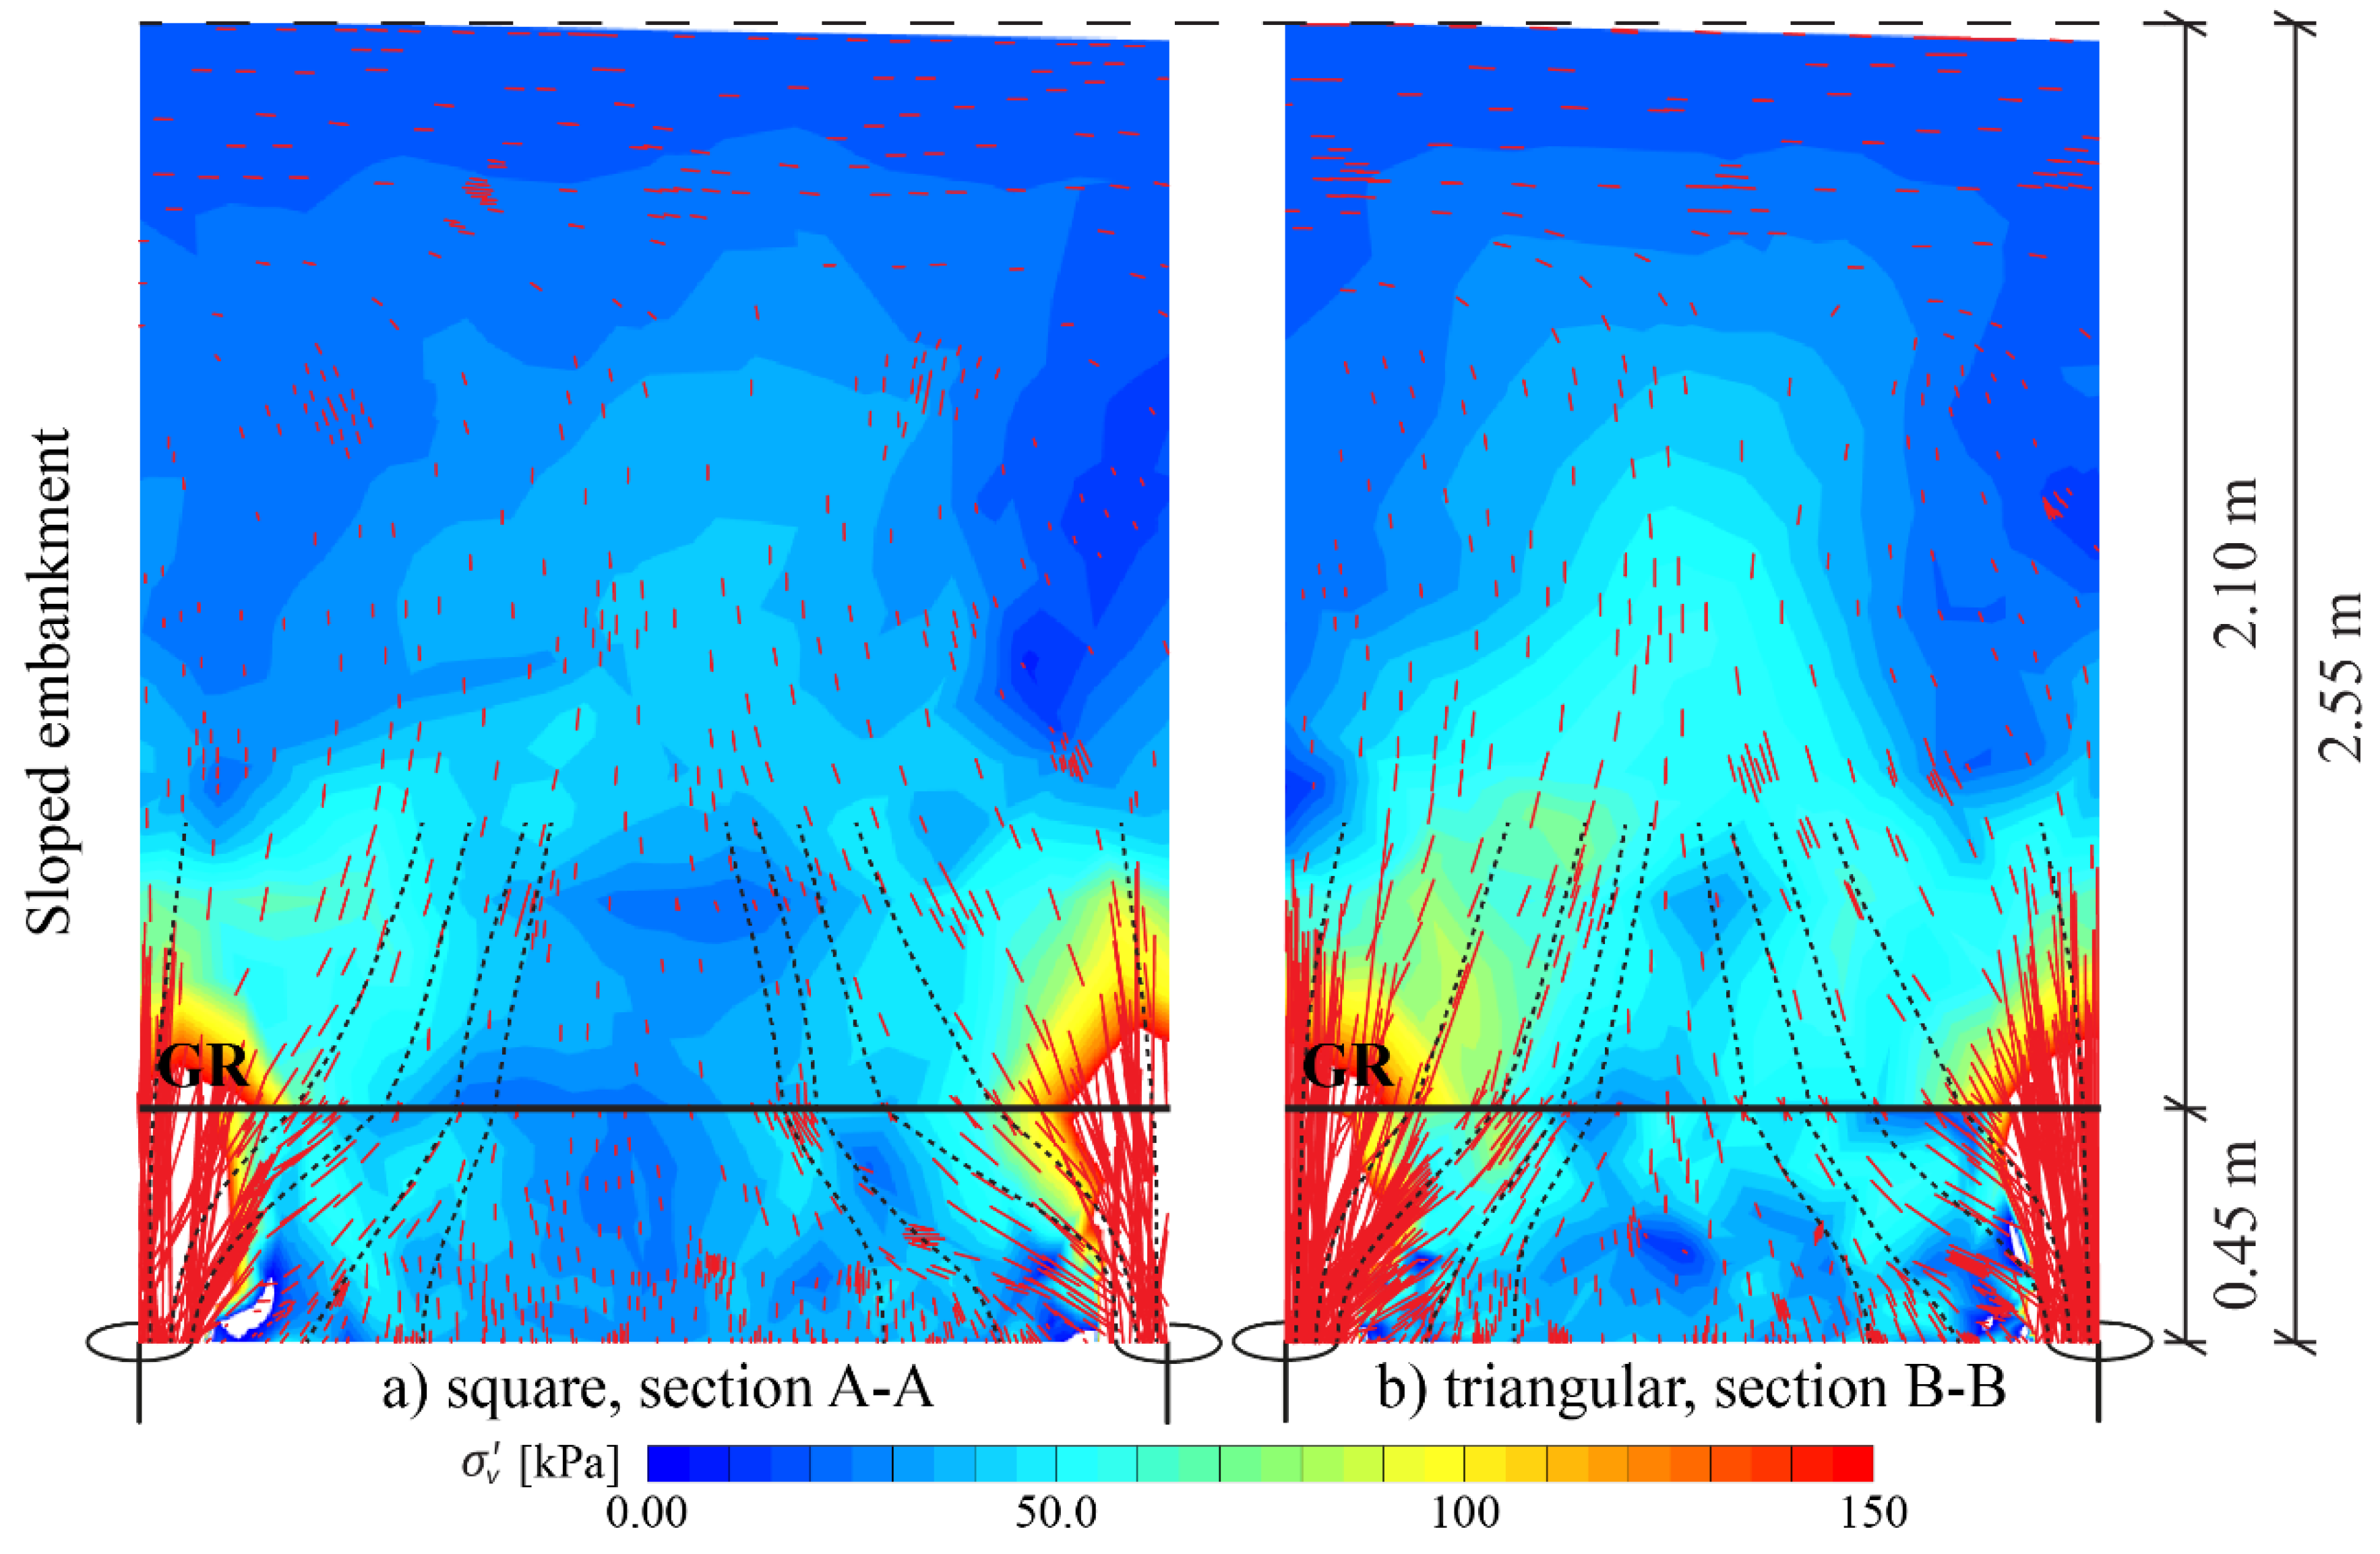
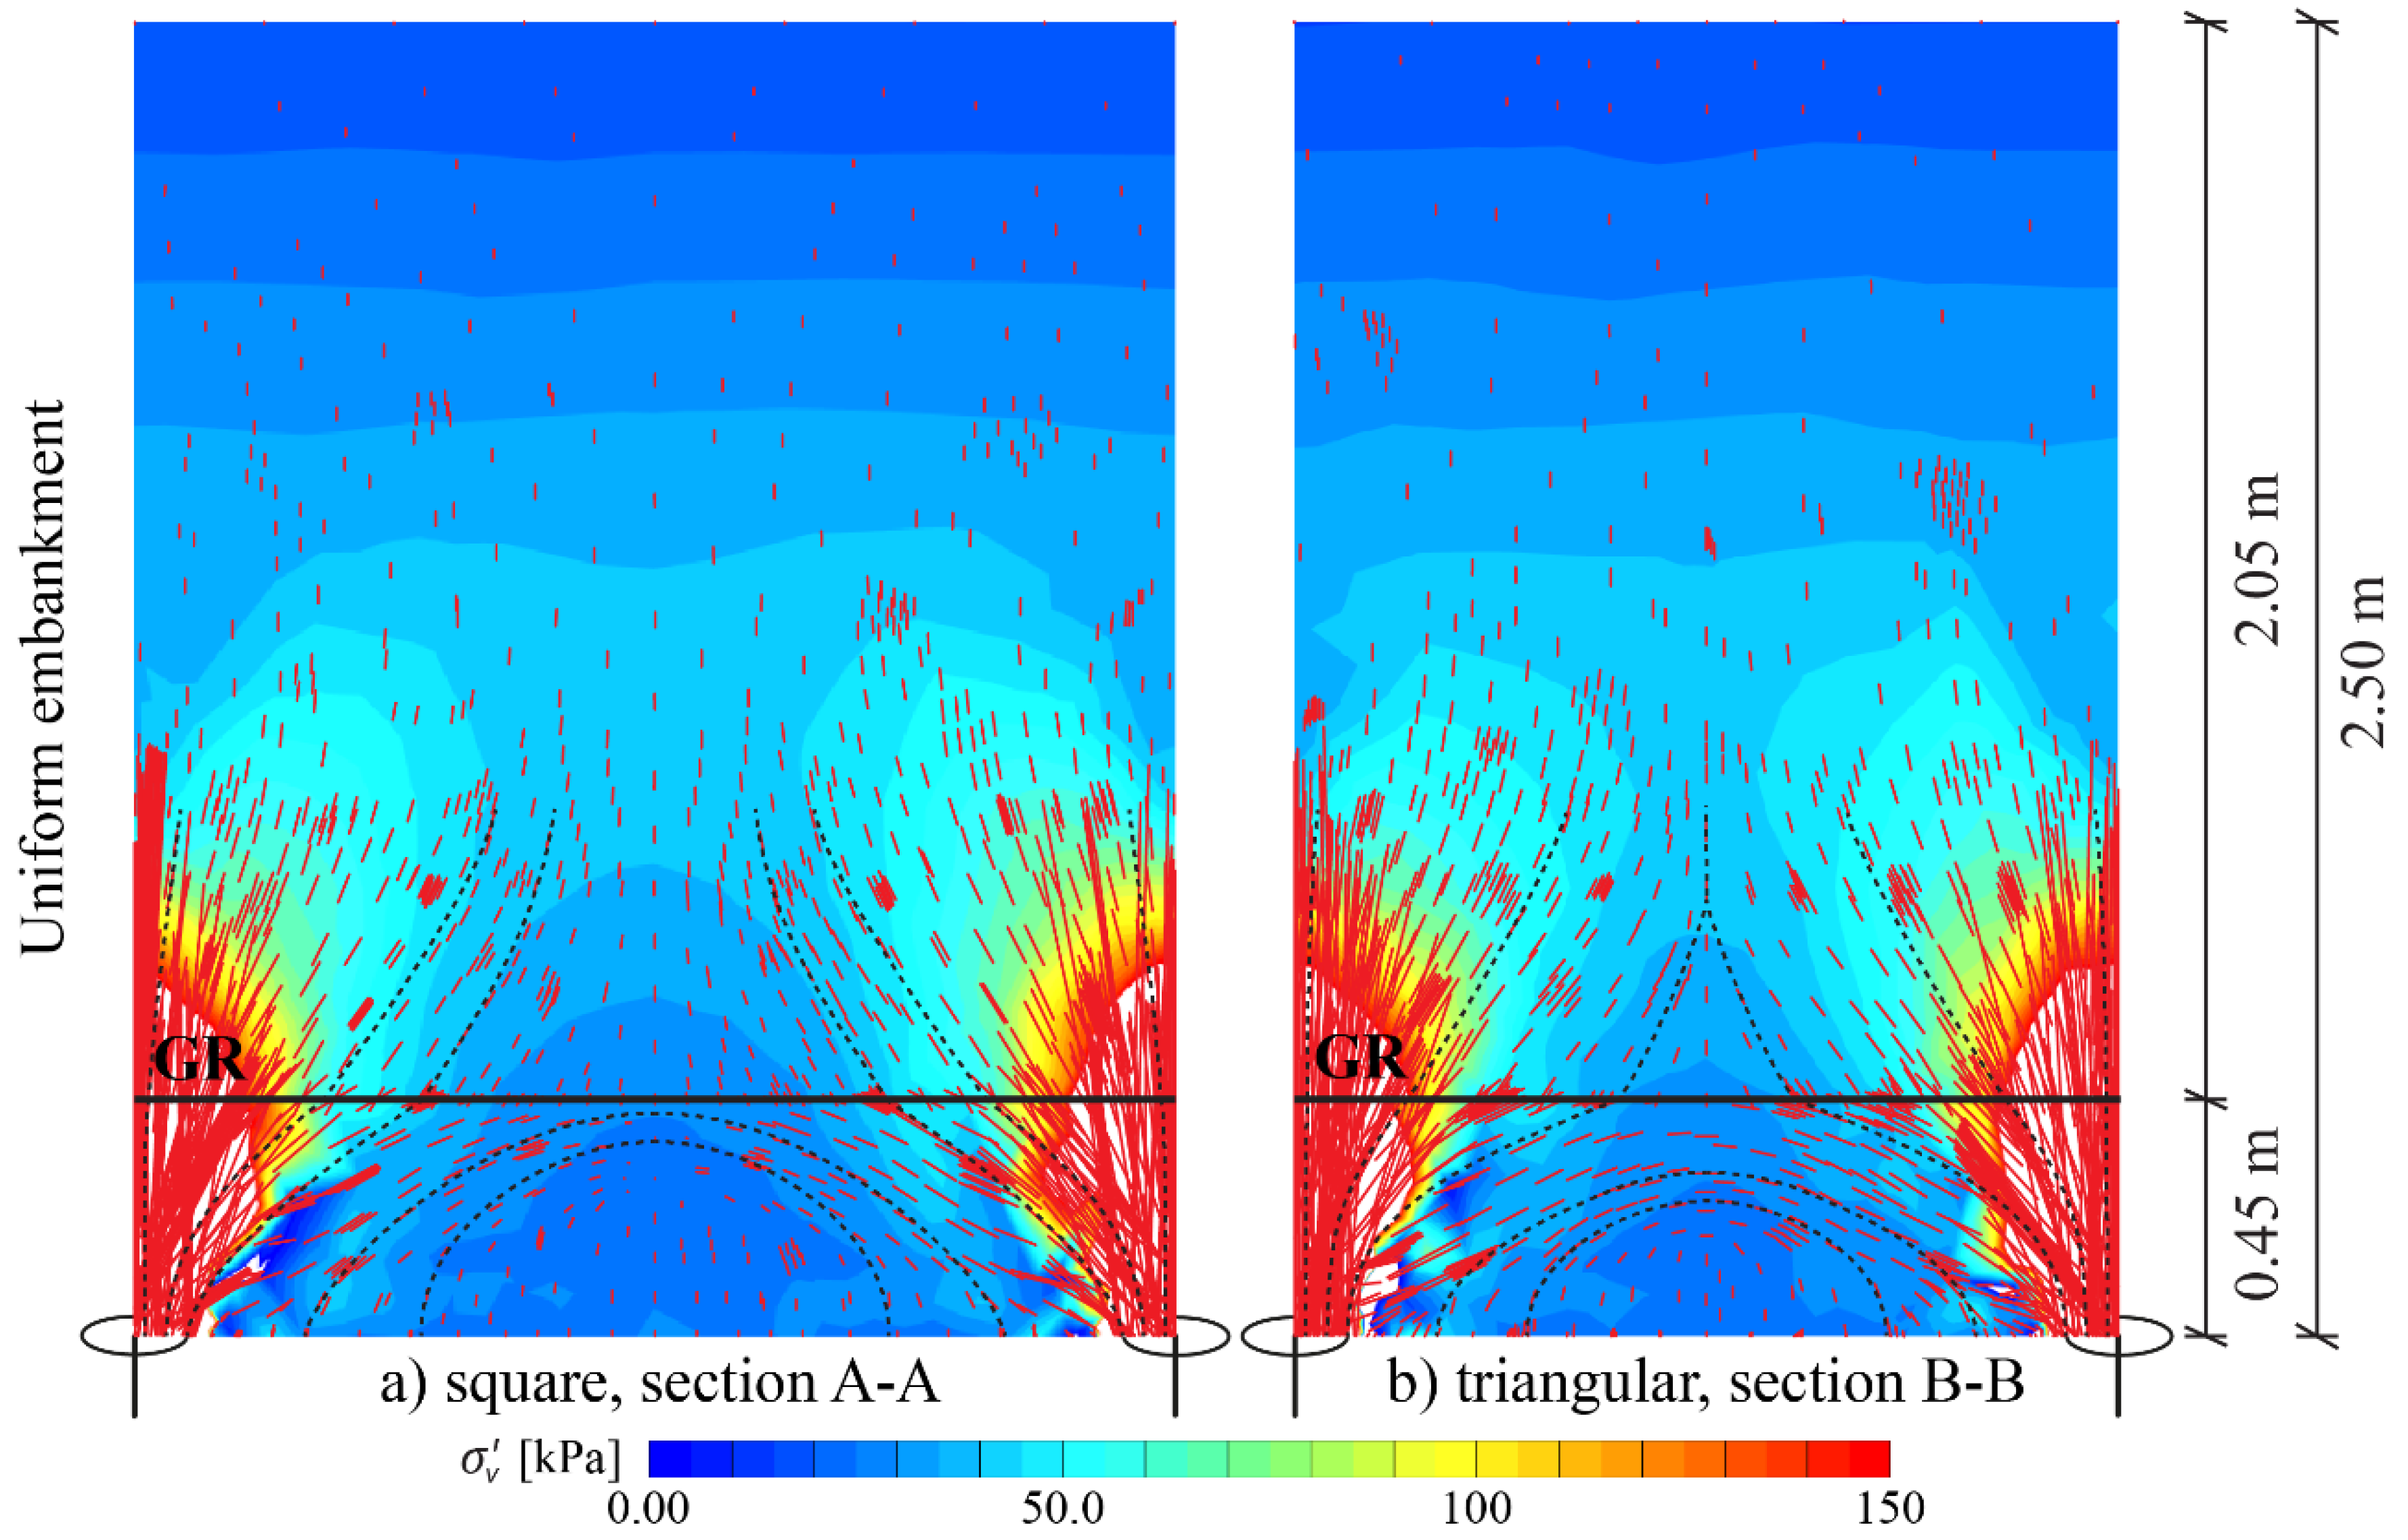
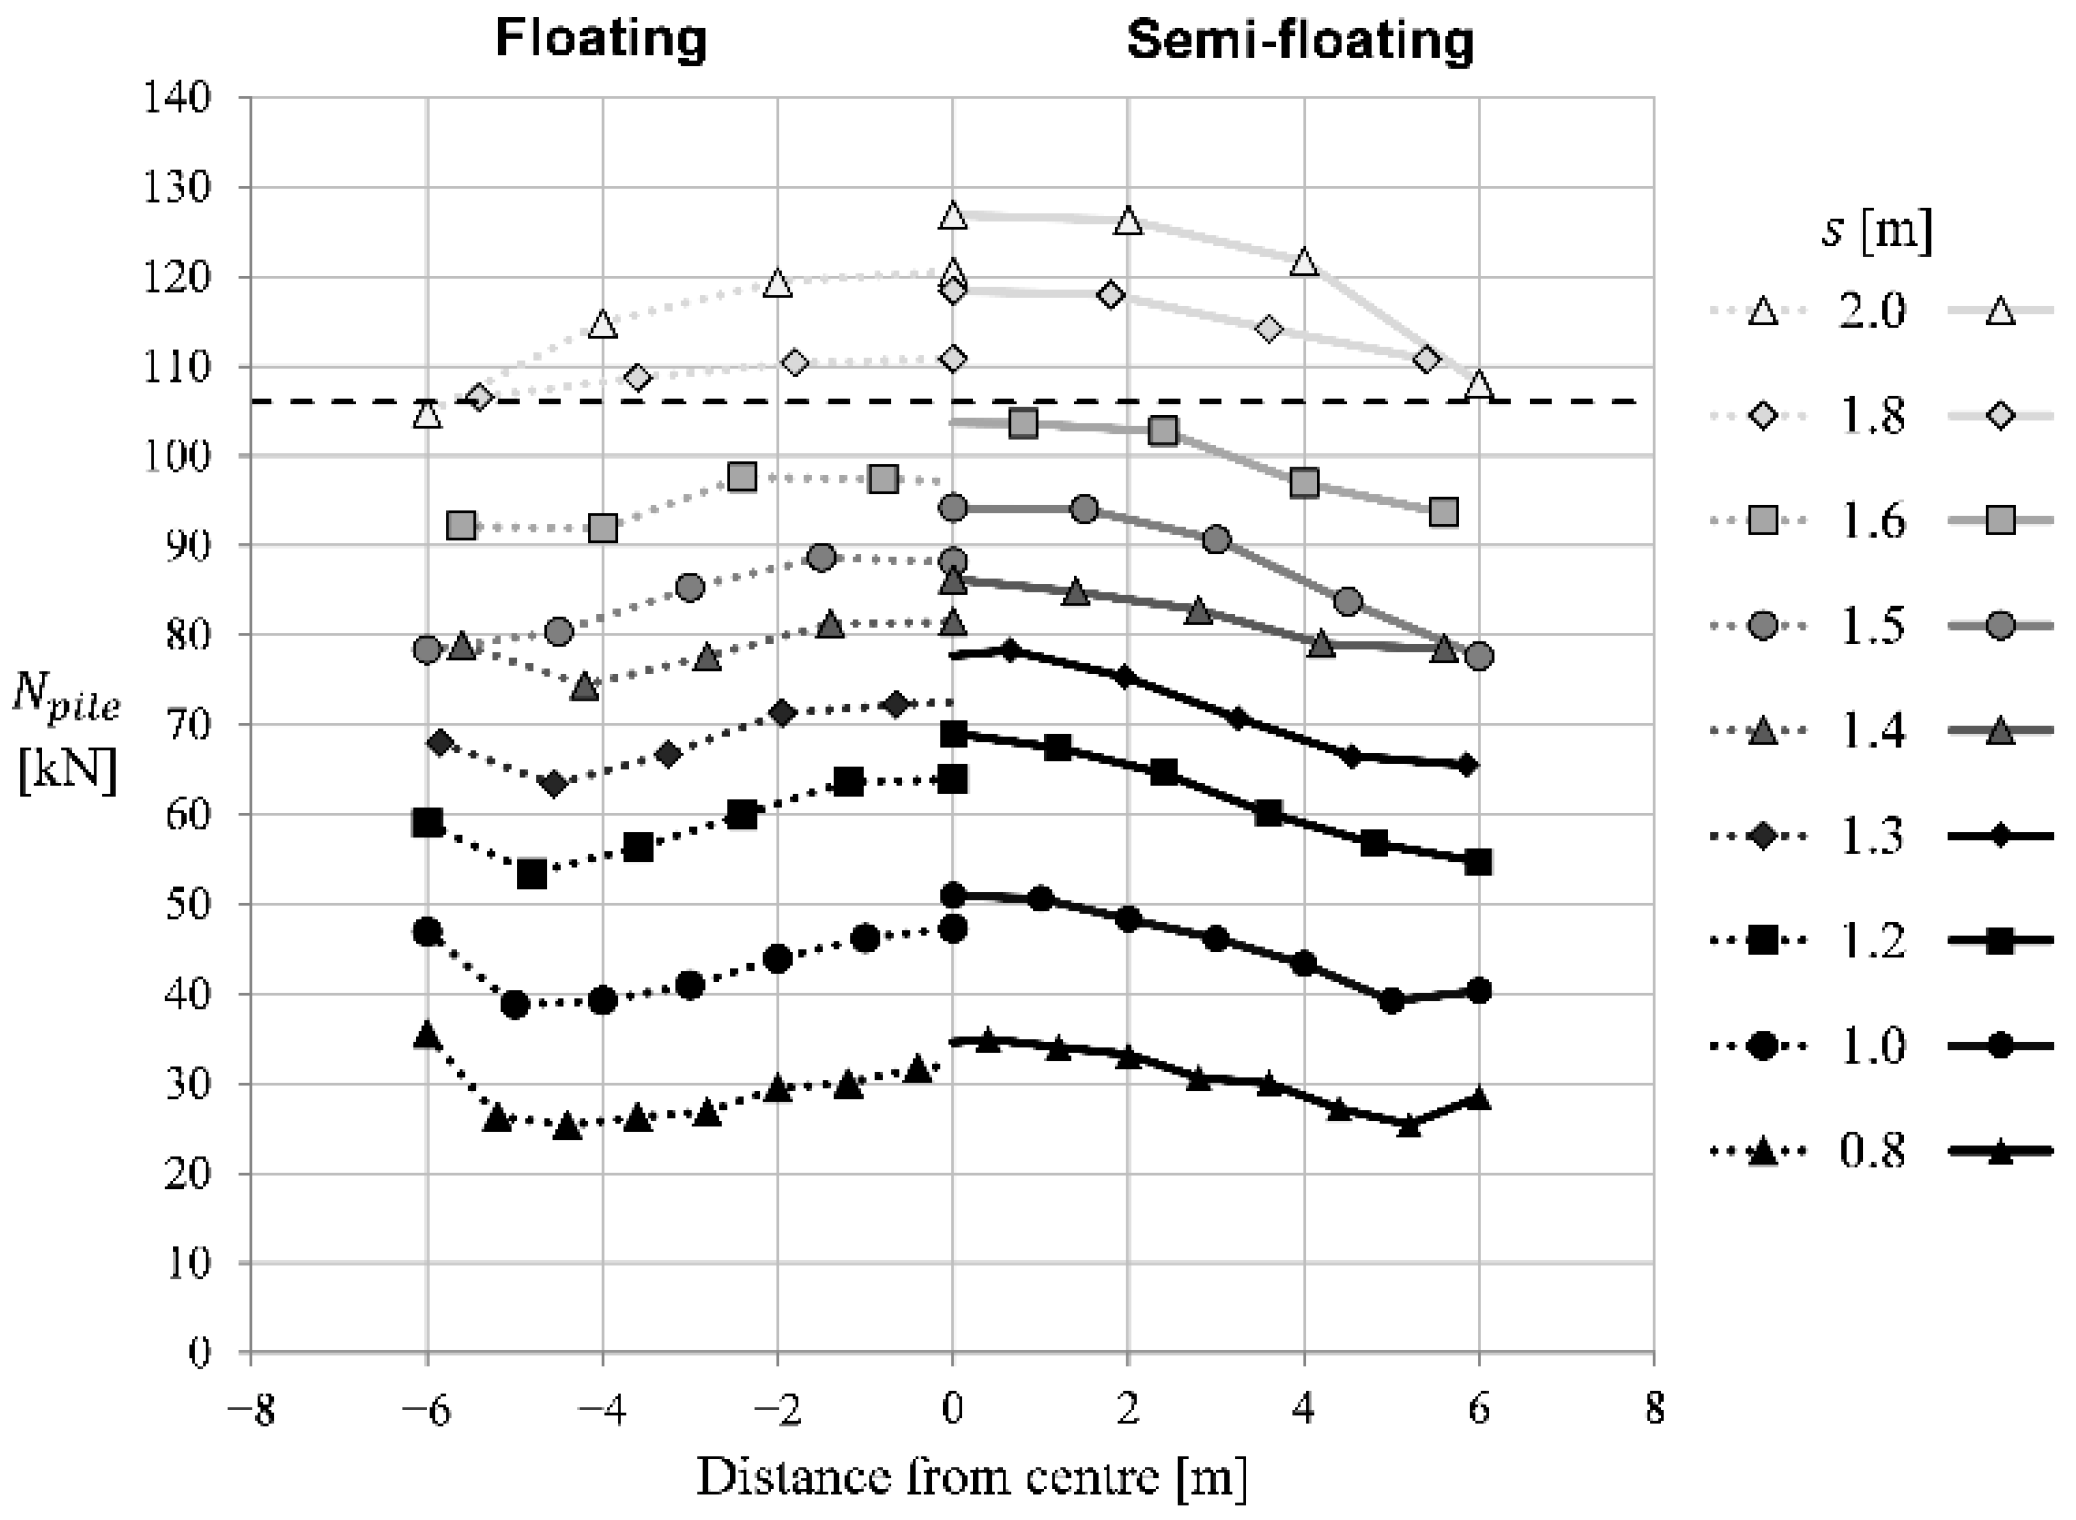
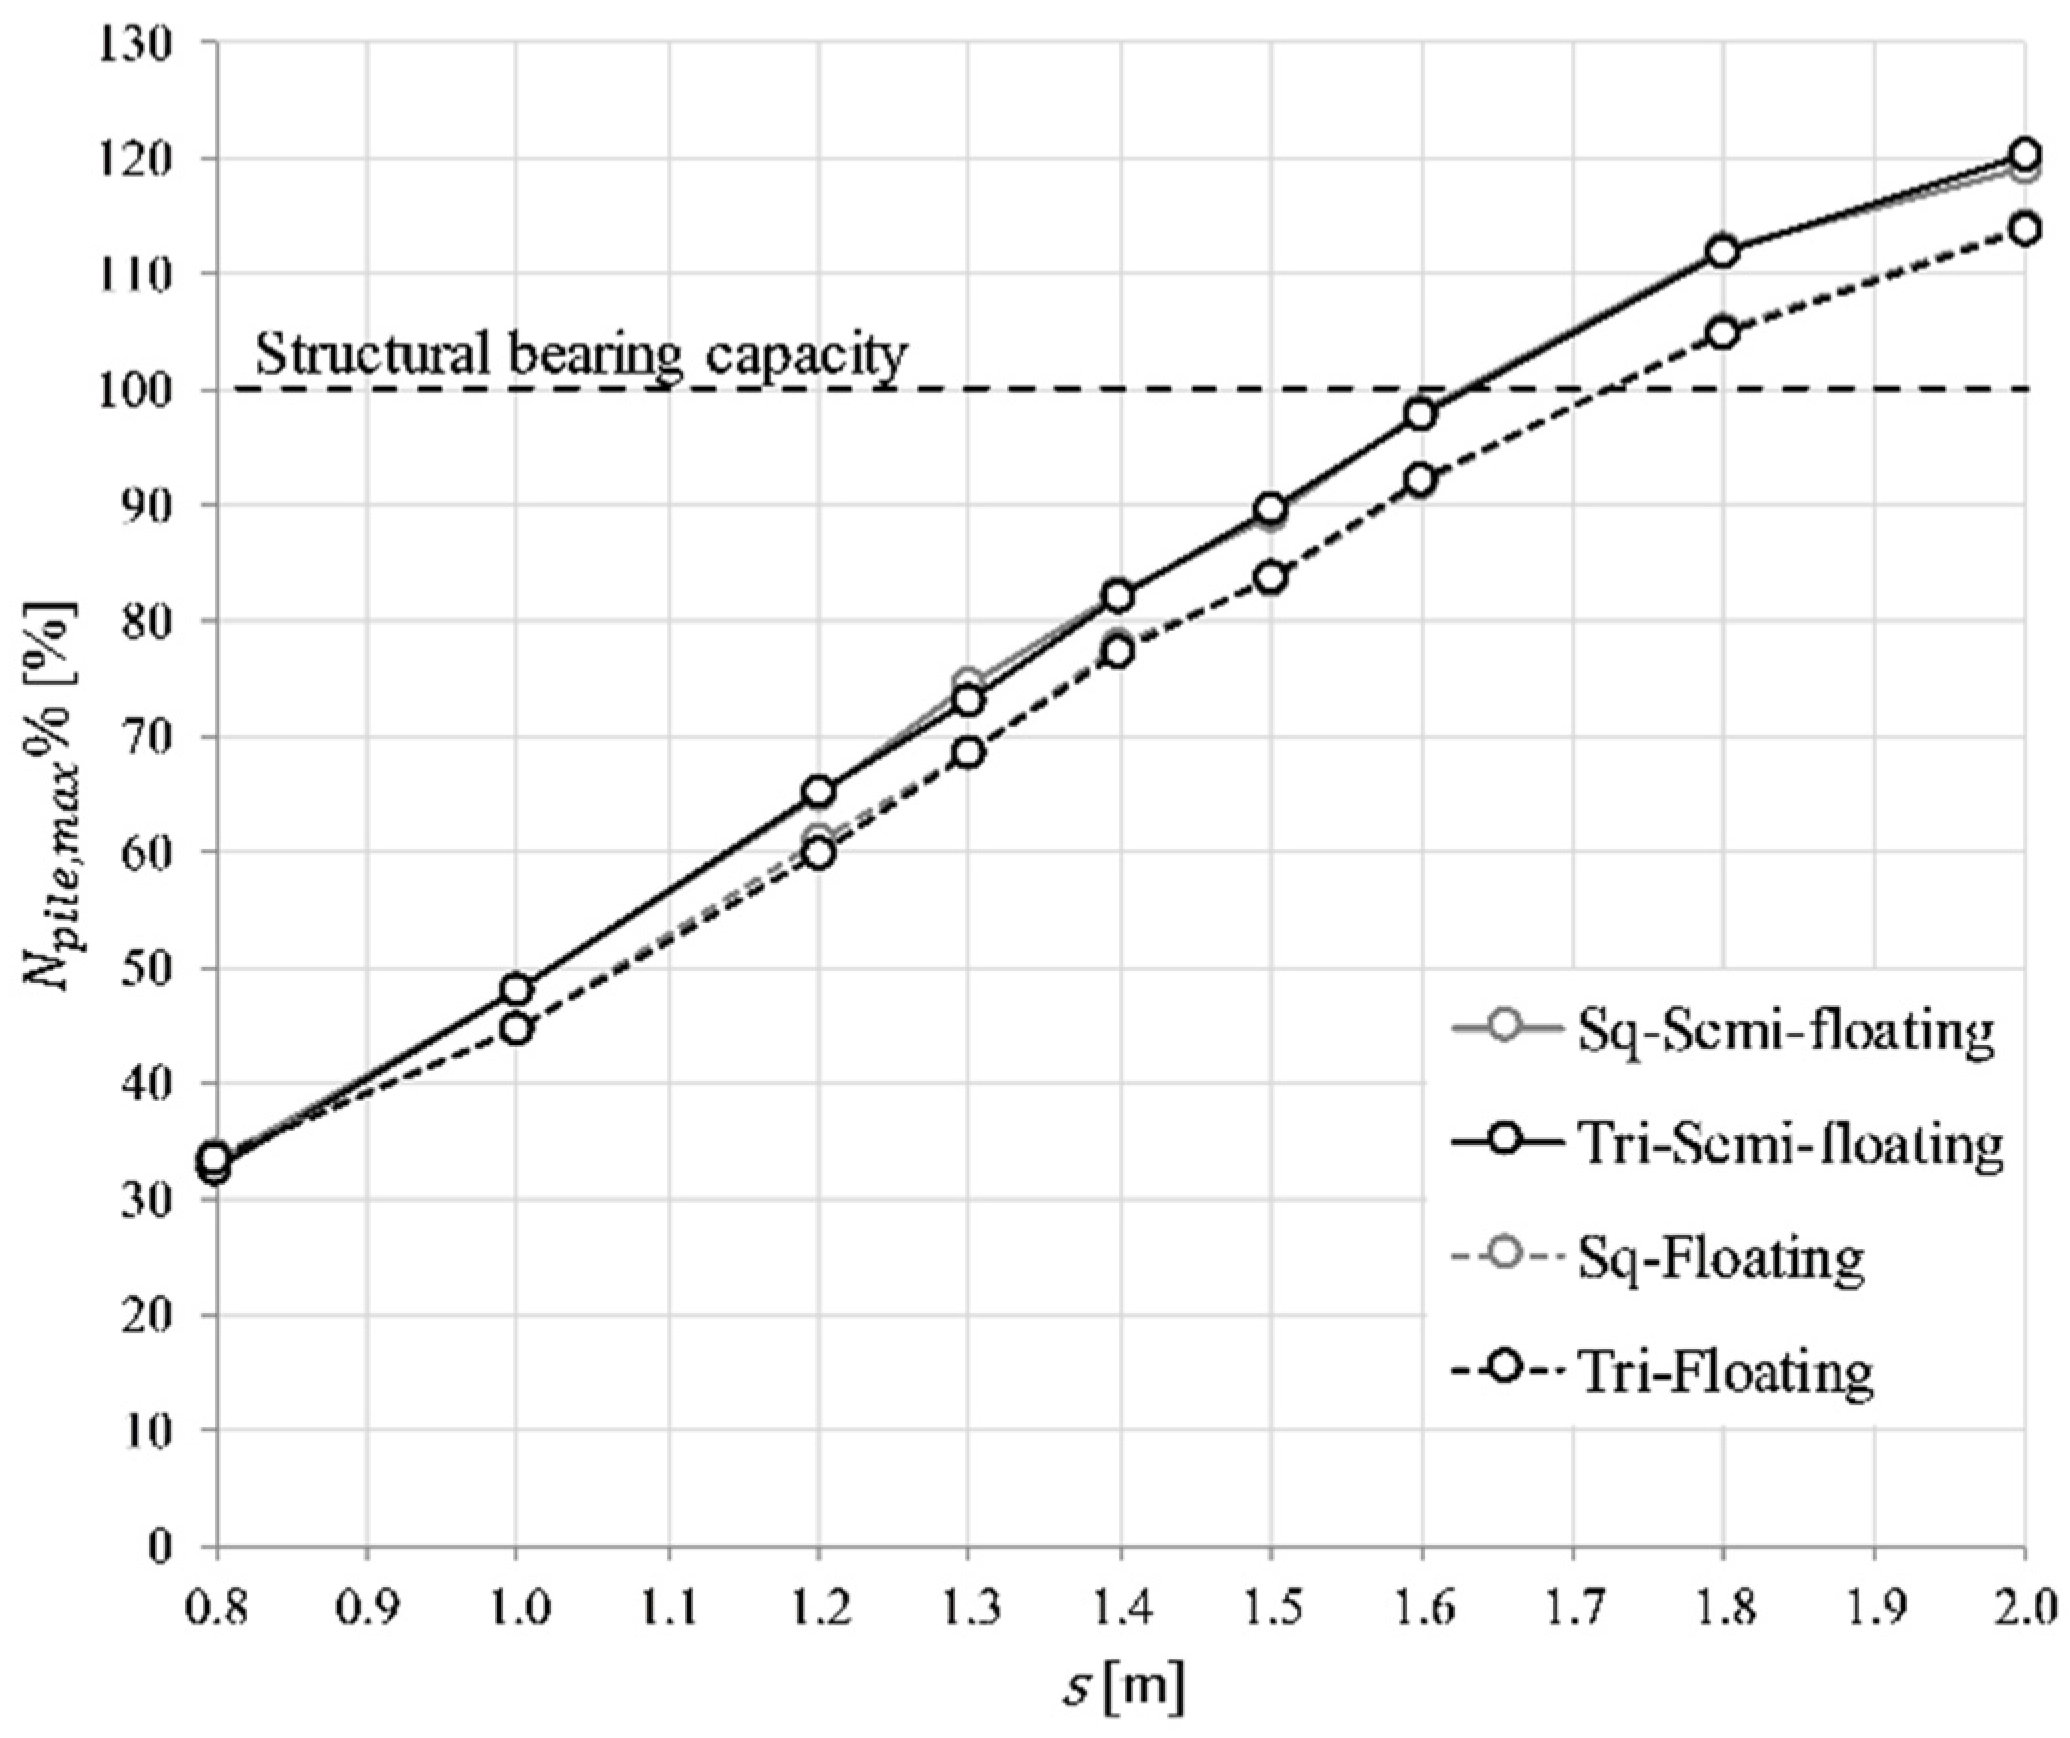

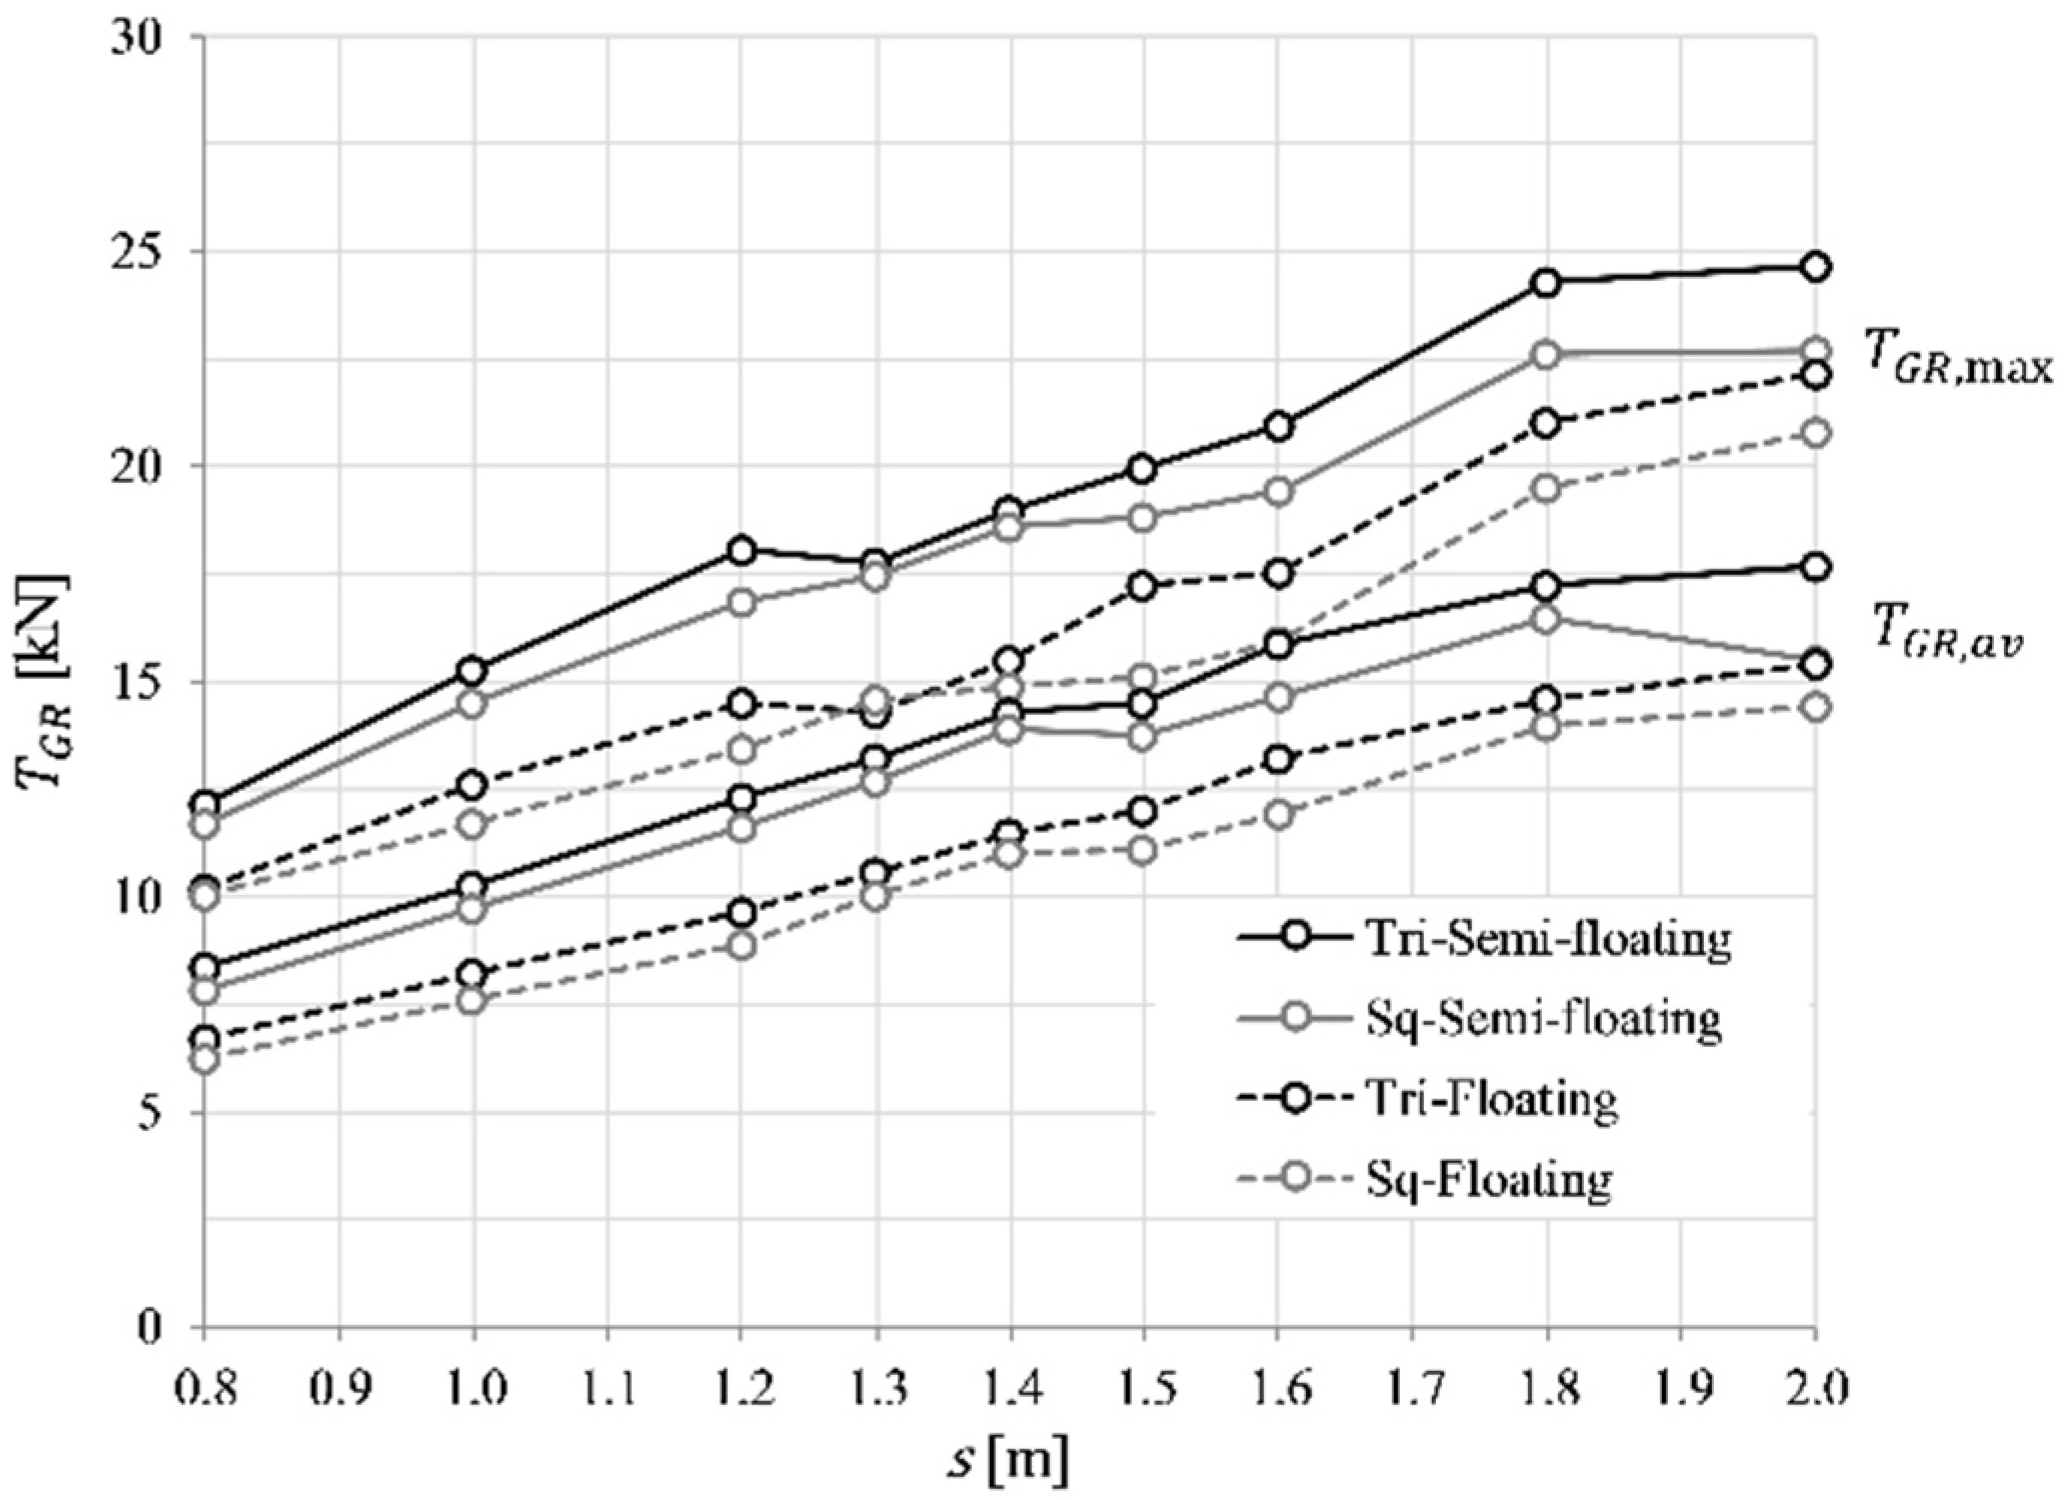
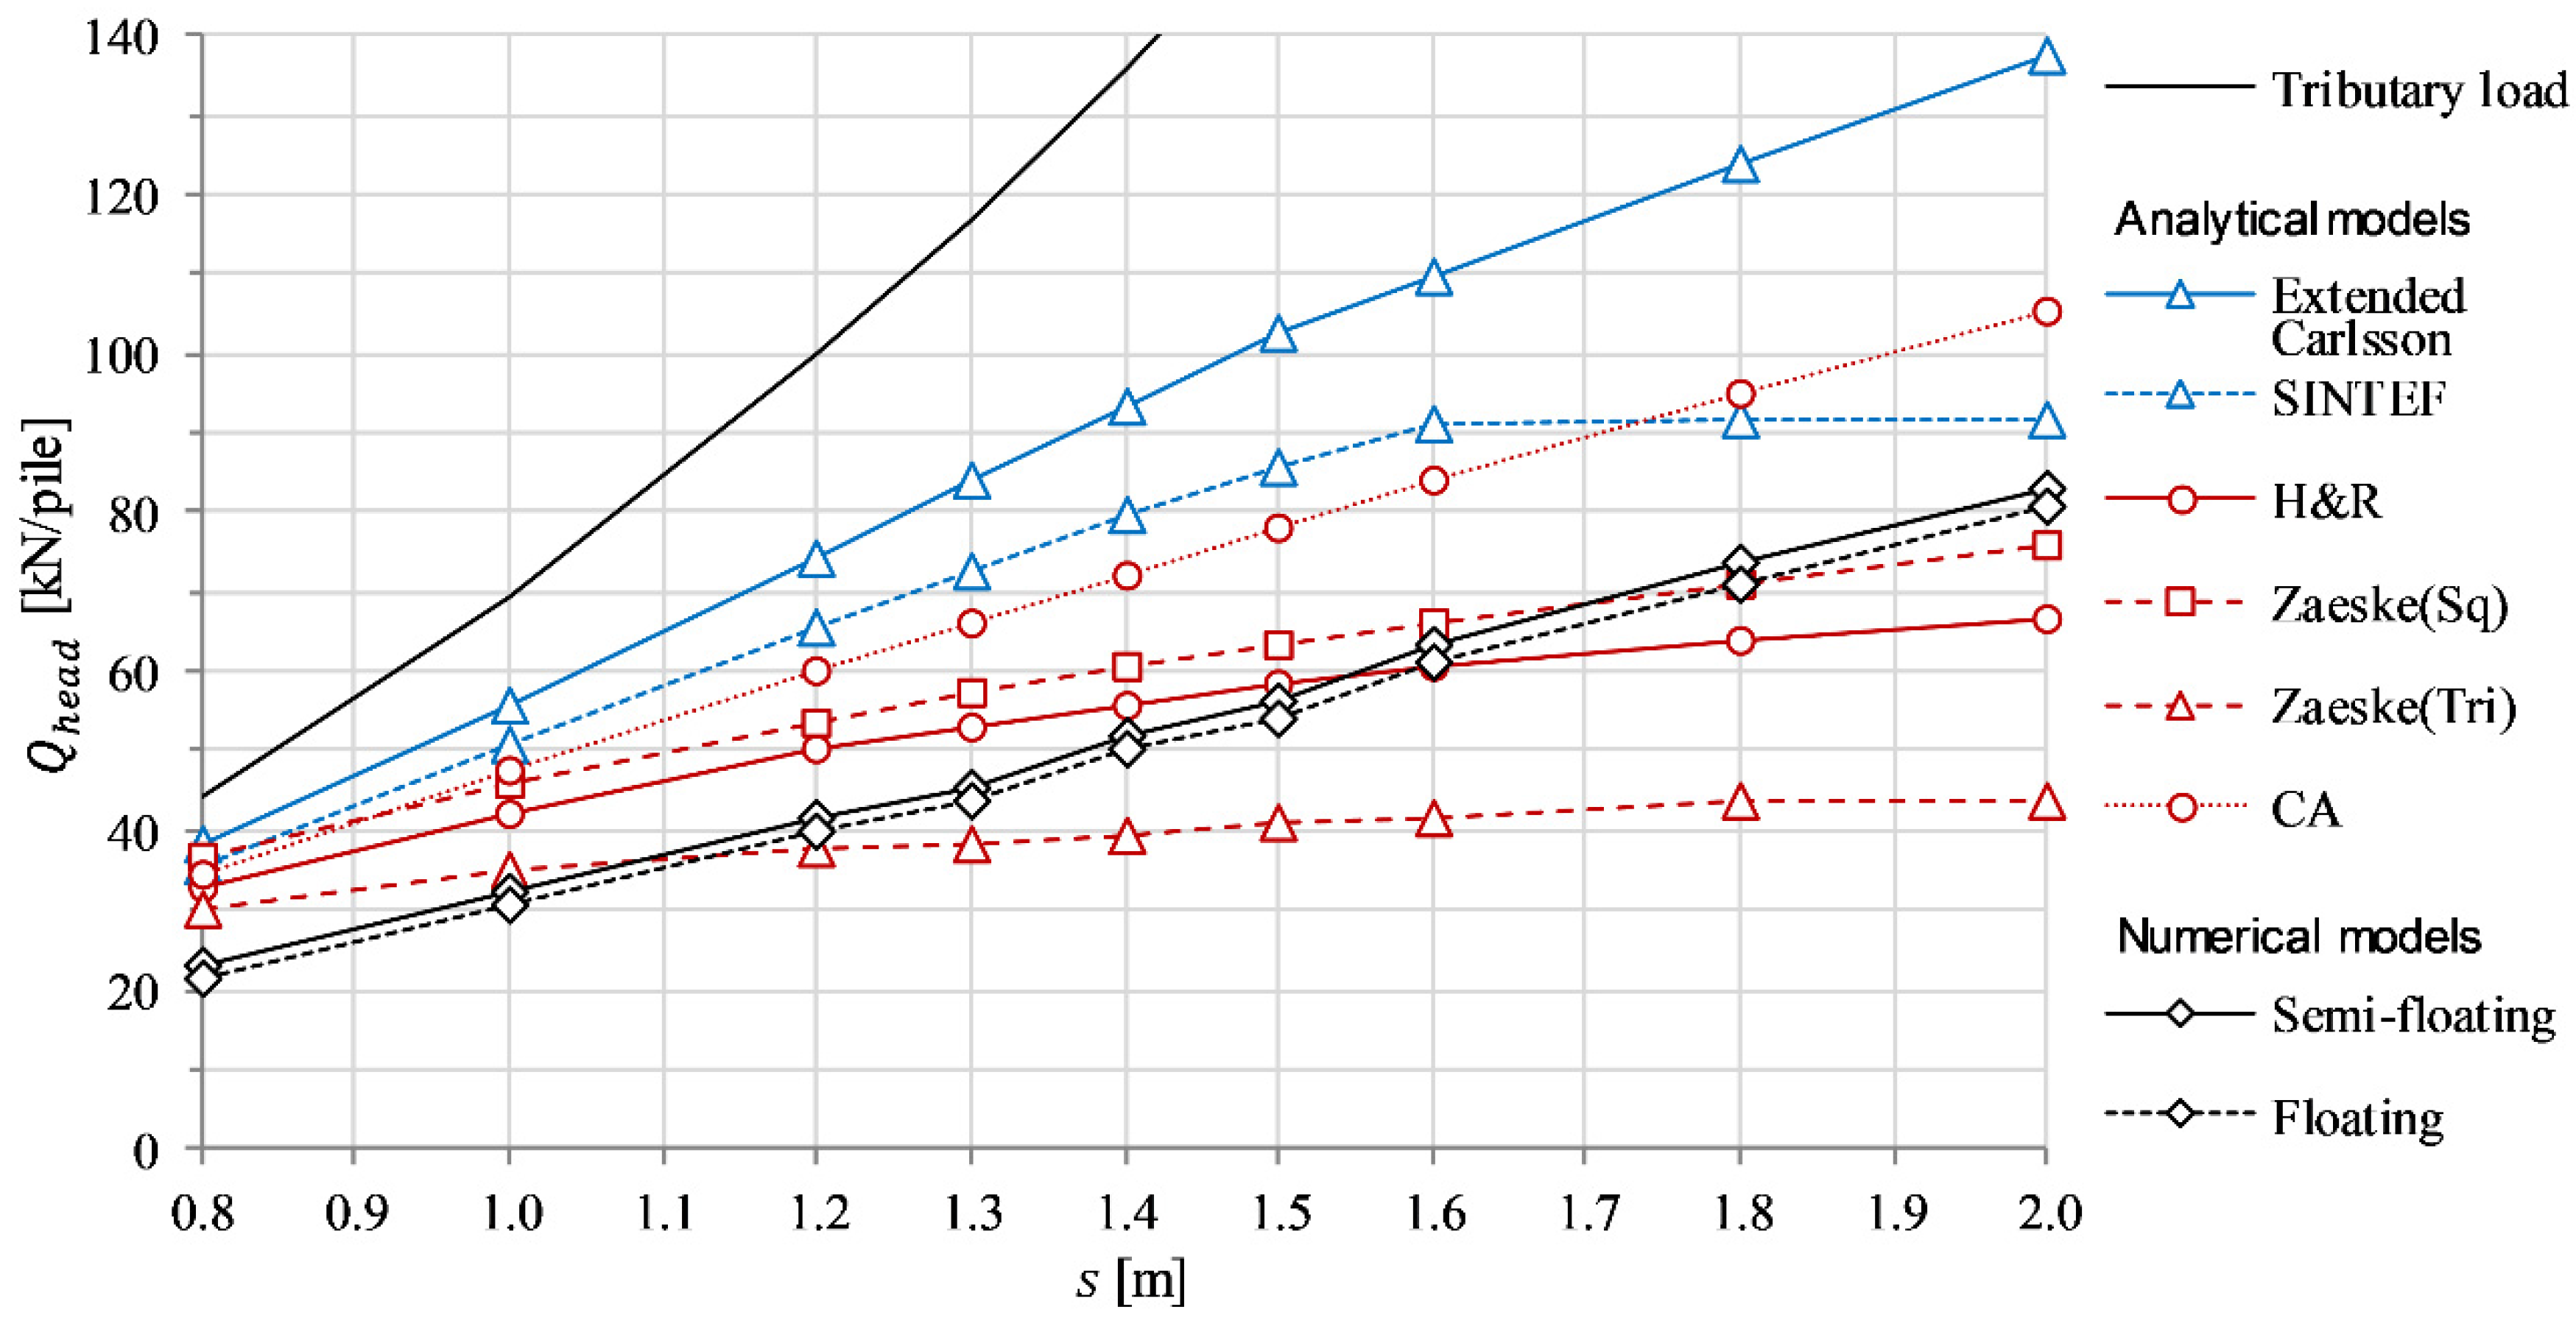
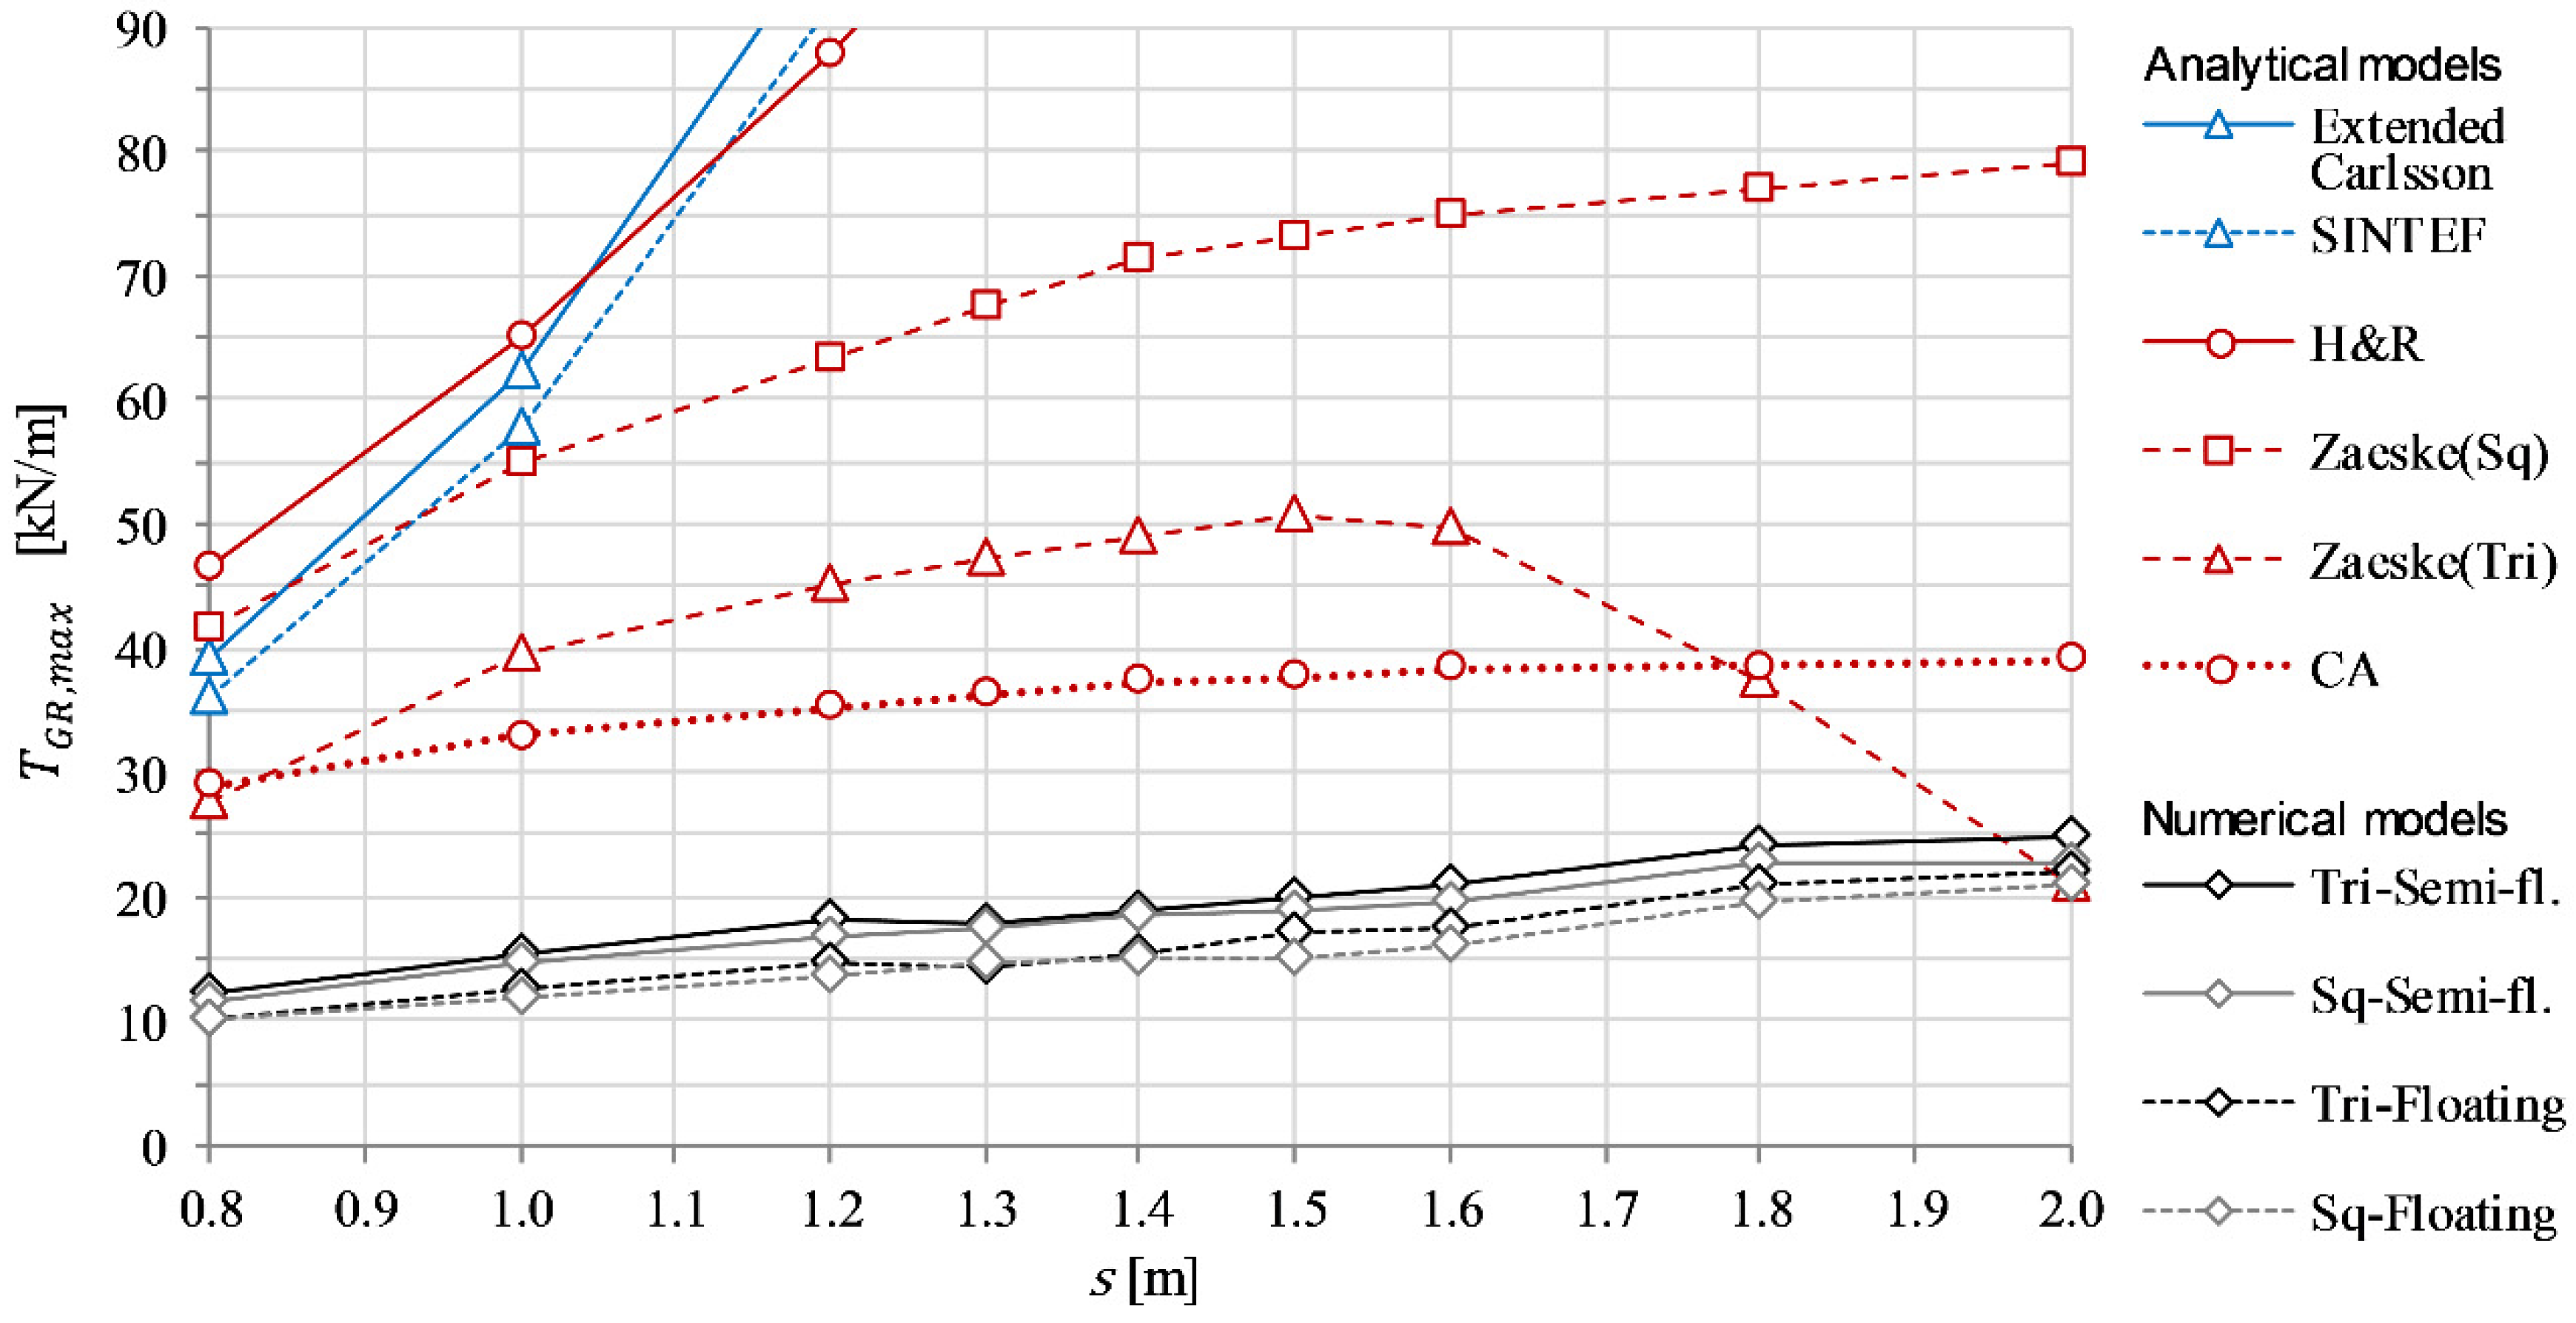
Publisher’s Note: MDPI stays neutral with regard to jurisdictional claims in published maps and institutional affiliations. |
© 2021 by the authors. Licensee MDPI, Basel, Switzerland. This article is an open access article distributed under the terms and conditions of the Creative Commons Attribution (CC BY) license (https://creativecommons.org/licenses/by/4.0/).