Article

Statistical Modelling for the Source Rock Parameters of the Montney Formation, NE British Columbia, Canada

Department of Geosciences, Universiti Teknologi PETRONAS, Seri Iskandar 32610, Perak Darul Ridzuan, Malaysia
*
Author to whom correspondence should be addressed.
Appl. Sci. 2022, 12(1), 267; https://doi.org/10.3390/app12010267
Submission received: 13 September 2021 / Revised: 23 October 2021 / Accepted: 1 November 2021 / Published: 28 December 2021

Abstract

:
Hydrocarbons in self-sourced reservoirs are determined by the concentration and maturation of organic matter in sediments. As a result, lowering risk in unconventional resource research and development requires knowledge of hydrocarbon potentiality factors. The geochemical data for the Montney Formation samples studied suggest that it is a fair to good source rock with type IV kerogen that can generate gas in general. The statistical modelling of the analyzed data reveals a valuable technique for identifying characteristics, clusters, and linkages that affect source rock assessment. The Spearman’s correlation coefficient showed a good positive correlation between the total organic carbon (TOC) and free hydrocarbons (S1), generating potential (S2), and potential yield (GP). There was a weak correlation with the maturity index (Tmax) and hydrogen index (HI) and a highly negative correlation between the TOC and oxygen index (OI). On the other hand, the principal component analysis (PCA) showed the presence of three factors affecting the source rock evaluation. Factor 1 included TOC, S1, and S2, which are related to organic richness and hydrocarbon potentiality; factor 2 contained the production index (PI), and the generated CO2 (S3) was related to the organic matter source. Factor 3 included the Tmax and HI related to the type of organic matter and thermal maturity. In addition, the TwoStep cluster analysis separated the source rock in the study area into two major groups. Cluster 1 is characterized relatively by high HI, TOC, S1, S2, and PI, with Tmax < 455 °C indicating good source rock in the mature level with the capability to generate little oil and condensate gas. Cluster 2 is characterized by relatively low HI, TOC, S1, S2, and PI, with Tmax > 455 °C, indicating an over-mature source rock in the dry gas window.

1. Introduction

The Triassic Montney Formation in northeastern British Columbia (BC) is classified as an unconventional hydrocarbon reservoir [1,2,3]. Tight gas, shale gas, and coalbed methane are unconventional hydrocarbon reservoirs [4,5]. Unconventional reservoirs have been studied intensively in the last two decades because they form cap rocks and are an important and direct source of hydrocarbons, especially after the production of conventional storage tanks began to decline and hence, the inability to produce enough to cover the growing market needs. However, these reservoirs need in-depth studies using different techniques to create models for proper understanding and determination of reservoir parameters. Sources of hydrocarbons serve as precursors for the accumulation of hydrocarbons and potential reservoirs. Source rocks, in general, are organic-rich sediments that have or may generate hydrocarbons [6] and are a vital component of any petroleum system [6,7].
Therefore, the evaluation of source rock relies on many parameters in which total organic carbon (TOC) and thermal maturation obtained by geochemical analysis are the most important, because they give critical information about the source rock’s potentiality [7,8]. The hydrocarbon potentiality of sediments is assessed by studying the sediment’s ability for hydrocarbon production, the type of organic matter, what hydrocarbon output might be formed, the sediment’s thermal maturity, and how it has influenced generation [9,10].
The considerable amount of data extracted from geochemical analyses, especially in the area under study, needs an analytical statistical survey to determine the most critical parameters to rely upon in classifying and evaluating the source rocks, and thus help to make crucial decisions by reducing risks. The use of formal statistical techniques can benefit both regional resource assessment and prospect evaluation, which are major petroleum exploration activities. Due to the high cost of exploration in untested areas of potential oil production, petroleum explorers are concerned about risk factors, conditional relationships, and probability distributions. As a result, they should use more rigorous statistical procedures in their assessments and decisions. In this study, statistical modelling for the geochemical results is used to group the parameters that affect the potentiality and maturity of the Montney Formation source rock to develop accurate indices for an integrated assessment.
Statistical approaches have rarely been used in previous research to process source rock data. The Pearson’s correlation coefficient was the primary statistical technique. Others have utilized hierarchical clustering and principal component analysis [10,11,12,13].
This study aims to define the variables that influence any source rock’s evaluation and uncover previously unknown correlations. For grouping the parameters, the principal component analysis (PCA) was highly effective. The Spearman correlation coefficient was then applied to determine how these categories influenced the source rock evaluation. Finally, the TwoStep clustering method, which had not previously been employed in similar investigations, was used to categorize the data based on parameter values.

2. Overview of Montney Formation

The Montney Formation has been considered an important hydrocarbon reservoir in Western Canada since the 1950s, and it was the target of oil and gas exploration by the National Energy Board of Canada by 2005. With horizontal drilling and fracturing techniques, the unconventional Montney play became the main gas reservoir [14]. Efforts to target production were previously limited to vertical drilling in conventional fine-grained sandstone deposits of poor quality. However, with the advent of horizontal drilling and advances in multistage horizontal fracturing techniques, the economic development of this extensive unconventional resource became possible in 2005. In the study region, the MF is a crucial target of unconventional gas reservoir exploration because it includes considerable volumes (Natural Gas Reserve = 271 TCF, LNG = 12,647 million barrels and oil reserve) (29 million barrels) [1]. The MF is an unconventional resource play with high potential in northeastern BC.

3. Geological Setting

The primary subbasin of the Peace River Embayment extended from the western ocean Panthalassa eastward to the North American craton [15]. It was a low minibasin associated with moderate fault block movement and a broad down dip that resulted in structural deformation in the Monias regions of southwest Fort St. John, BC, during the Triassic time [15]. The age of the Triassic Montney Formation ranges from the Griesbachian to the Spathian [16]. According to [15], in most locations, carbonate layers of Carboniferous to Permian age sit unconformably upon the Triassic succession [15,17,18,19].
The succession was deposited in a west-facing, arcuate basin of extension on the western edge of the Supercontinent Pangaea [20,21,22,23,24]. The thickness of the Triassic deposits is about 1200 m in the westernmost outcrop in the Rocky Mountain Foothills [25]. Desert and semiarid conditions are thought to have existed on land, so the Aeolian transport and deposition are commonly postulated as the dominant mechanism of sand and silt delivery to the coast [21,26]. However, ephemeral fluvial transport was the more important process in the Montney Formation than in most modern desert depositional systems [27,28]. The Early Triassic was a time of biologic recovery as it immediately followed the End-Permian extinction, the most severe biologic perturbation in history [29,30,31]. Regionally extensive shallow water anoxia/dysoxia in conjunction with increased oceanic acidity is thought to have played a significant role in the extinction [28,32,33].
These conditions are assumed to have continued into the Early Triassic based on the lack of preserved carbonate fossils and the diminished levels of bioturbation observed in the Montney Formation [28,33]. Comparing the Montney Formation with global Early Triassic sequences revealed three informal members (Figure 1): the lower member, of Griesbachian to Dienerian age, correlated with a third-order cycle; the middle member, of mixed Dienerian and Smithian ages; and the upper member, of Smithian to Spathian age, linked with two shorter-duration third-order cycles thought to have been deposited in neutral shallow marine conditions [21,34,35,36].

4. Materials and Methods

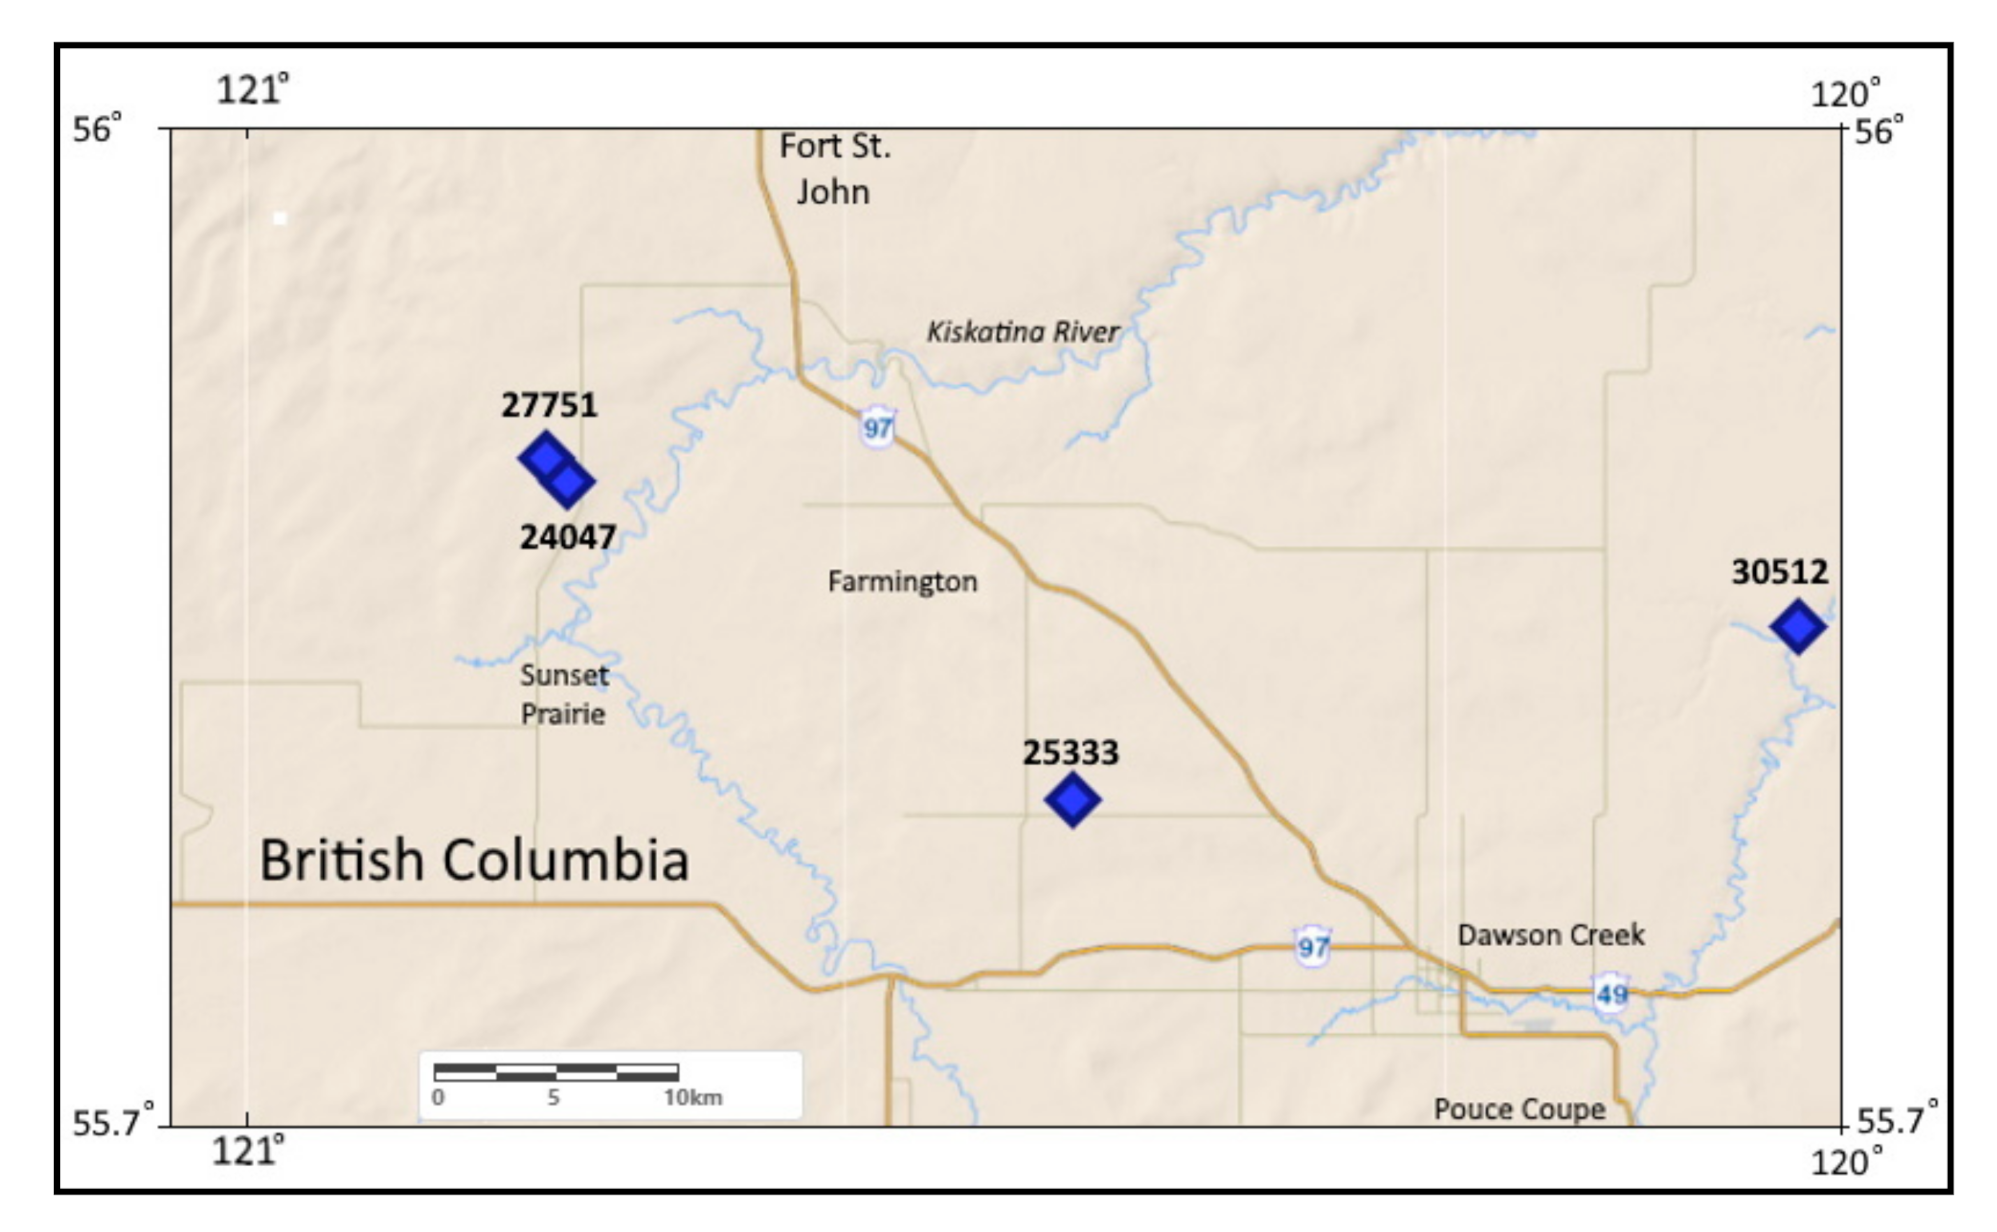
4.1. Sample Collection

A total of 58 core samples were obtained from 4 wells in the study area (Figure 2). These samples represent the Triassic Montney Formation source rock. About 15 g from each sample was pyrolyzed using the source rock analyzer (SAR) instrument to obtain S1, S2, S3, Tmax, and TOC (Table 1).

4.2. Methodology

4.2.1. Geochemical Analysis

Pyrolysis analysis is the most often used analytical technique for assessing the kerogen type, thermal maturation, and potential for production [38,39]. Pyrolysis analysis was established first to determine the age of coal macerals [40,41]. It is a highly successful technique for discriminating between source rock and kerogen quality and has developed into a critical tool for oil and gas exploration, giving geologists information about source rock attributes and reservoir potential. It is based on the progressive heating of crushed source rock in a source rock analyzer oven (SRA). At temperatures below 300 °C, the free hydrocarbons vaporize and are designated as the S1 peak. At temperatures between 300 and 600 °C, the kerogen begins to break down and releases its genetic potential at optimal maturity, which is designated as the S2 peak [42], which is also measured in milligrams of hydrocarbon per gram of rock (mg/g). The involved CO2 is designated as the S3 peak, which results from the breakdown of carboxyl groups and other oxygen-containing compounds in kerogen, obtained at 300–390 °C and measured by mg CO2/g rock [11]. The temperature at which the S2 peak occurs is referred to as the Tmax, which is a maturity indication [43]. The hydrogen index (HI = S2/TOC wt.%), the oxygen index (OI = S3/TOC wt.%), the production index (PI = S1/[S1 + S2]), and the generating potential (GP = S1 + S2) are four critical pyrolysis parameters. Tmax can be plotted against HI to assess the kerogen quality, against OI to determine the depositional environment and kerogen type, against PI to determine maturity, and against GP to determine potentiality.

4.2.2. Statistical Analyses

Spearman Correlation Coefficient (ρ)

The Spearman correlation determines if two continuous or ordinal variables have a monotonic connection. The variables in a monotonic connection tend to change simultaneously but not always at the same rate, which is suitable for our data. It is possible to have a perfect Spearman correlation of 1 or −1 when there are no repeated data values [44].

Principal Component Analysis

Large datasets are becoming more common across a wide range of fields. Methods for interpreting such datasets must dramatically reduce their dimensionality while keeping the majority of the information in the data. Several techniques have been created for this purpose, but PCA is one of the oldest and most commonly utilized [45]. The data set involved in this study was subjected to a PCA analysis to reduce dimensionality and arrange parameters within a lower group of factors.

Cluster Analysis

There are many clustering algorithms to choose from and no single best clustering algorithm for all cases. Instead, it is a good idea to explore a range of clustering algorithms and different configurations for each algorithm. This study used two main clustering algorithms, the hierarchical (HCA) and the TwoStep.
The HCA is a method of cluster analysis that seeks to build a hierarchy of clusters. Strategies for hierarchical clustering generally fall into two types [46]. This algorithm is the primary statistical method for finding relatively homogeneous clusters of cases based on measured characteristics. It starts with each case as a separate cluster, i.e., there are as many clusters as cases, and then combines the clusters sequentially, reducing the number of clusters at each step until only one cluster is left. The clustering method uses the dissimilarities or distances between objects when forming the clusters. The SPSS program calculates ‘distances’ between data points in terms of the specified variables. A hierarchical tree diagram, called a dendrogram on SPSS, can be produced to show the linkage points. The clusters are linked at increasing levels of dissimilarity [13].
Using the TwoStep Cluster Analysis process, one can discover naturally occurring groupings (or clusters) within a dataset that would otherwise be undetectable using traditional statistical methods. The algorithm used by this procedure has several beneficial characteristics that distinguish it from typical clustering algorithms [46], including the following: In the statistical software package SPSS, a method known as two-step cluster analysis is utilized to analyze massive databases [47]. TwoStep cluster analysis is a technique that takes only a single pass through the data set to be effective [48]. The method is divided into two essential steps: the first is the initial grouping of data into small subclusters, followed by the treatment of these subclusters as independent observations, and the second is the subsequent treatment of these subclusters as separate observations [46,48]. The distance criteria will determine whether the observation will be added to an existing cluster or whether a new cluster will be generated based on the observation. The hierarchical cluster approach is used to organize these new data into more manageable groups [48]. It is feasible for the algorithm of the TwoStep cluster analysis to determine the number of clusters that may be assigned or the number of clusters that can be determined by hand. The second stage is groping, in which the subclusters serve as the foundation for the analysis and are then sorted into the necessary number of clusters by the algorithm. Since the number of subclusters is less than the number of observations, it is simple to utilize the usual grouping methods to organize the data [46,48].
The technique becomes increasingly precise as the number of subclusters increases [49]. The dataset was subjected to a two-step cluster analysis. Although it is not considered to be a considerable dataset, its application yielded robust results that were highly consistent with the geochemical results.

5. Results and Discussion

5.1. TOC Quantity and Quality of Organic Matter

Refs [41,42,50] suggested a ranking of source rock and richness, with a TOC wt.% of around 0.5 being considered the least for an influential source rock, while 2% is regarded as the minimum for shale gas reservoirs. The results showed that the TOC values for studied samples from the Montney Formation source rock ranged between 0.5 and 2.86 wt.% (Table 1), indicating fair to very good source rock (Figure 3A), with minimum TOC wt.% that fulfilled the required amount for the effective source rock. Moreover, from the results, it was evident that S1 values were mostly greater than S2 values, indicating a distinction between non-indigenous and indigenous hydrocarbon origins. More than half of the analyzed samples indicated an indigenous source (Figure 3B).

5.2. Kerogen Type and Generating Potential

To obtain the generating potential (oil or gas), the organic matter must be determined. The HI and OI values should be computed as previously indicated to determine the type of organic matter present in the source rock. The results (Table 1) showed that the samples had low HI and OI values of less than 100 mg/g, classifying them as Type IV kerogen. These findings were supported by a cross plot of HI and OI on the pseudo van Krevelen plot (Figure 4A). The pyrolysis analysis results were used to determine the potential of the source rock. According to Hunt [7], the GP for the tested samples ranged from 0.25 to 6.26, indicating that the majority of the samples had a low generating potential. When graphing the GP vs. TOC, the samples from the well (B-093-I/094-B-09) fell mainly in the good generating potential since they had higher HI and OI than the other samples (Figure 4B).

5.3. Organic Matter Maturity

Petroleum evolves from organic material over time as part of the more extensive thermal conversion process of organic material [50]. The nature of the organic matter and the degree of thermal conversion determine the hydrocarbon concentration and distribution in a given source [6,51]. In this study, Tmax and PI are used as an index of thermal maturity. The key to efficiently using maturity parameters is to evaluate the obtained data carefully, and it is preferable to get many maturity parameters wherever available [40]. After that, a comparison will be made to ensure that the data are comparable or contrasted. By increasing maturity, the volume and content of hydrocarbons are produced by a specific kerogen change [41].
According to Peters [41] and Espitalie et al. [52], oil production from source rocks began at a Tmax of 435 to 465 °C and a PI of 0.2 to 0.4, organic matter is immature when Tmax is less than 435 °C and a PI less than 0.2, and gas generation from source rocks begins at a Tmax of 470 and a PI greater than 0.4. Tmax values in the examined samples ranged from 442 to 476 °C, while the PI values ranged from 0.22 to 0.93. (Table 1). Based on these findings, kerogen classification diagrams based on the HI versus Tmax plot [52] were created, which are used to determine kerogen type and maturity (Figure 5A). The results showed that the Montney Formation samples tested had a wide maturity range, spanning from immature to postmature type IV kerogen. The plot of Tmax vs. PI further supports this conclusion (Figure 5B).

5.4. Statistical Analysis Results

5.4.1. Spearman Correlation Coefficient (ρ)

The application of Spearman correlation coefficients (Table 2) revealed a positive correlation between TOC, S1, S2, and GP with a strong negative correlation with OI (Figure 6), indicating the influence of TOC on S1 and S2. Furthermore, the lack of a correlation between TOC and both Tmax and PI suggested that the maturity of the source rock was independent of the amount of organic matter [13]. S2 had a strong positive correlation with both S1 and HI (Figure 6). This correlation demonstrated that the highest HI occurred at specific maturity levels rather than at lower or higher maturity levels. Tmax and OI were also found to have a negative correlation (Figure 6).

5.4.2. Principal Component Analysis (PCA)

Using PCA on pyrolysis variables revealed three factors influencing source rock evaluation (Table 3). TOC, S1, and S2 were variables in Factor 1 that determined the organic richness and hydrocarbon potentiality of source rocks. S3 and PI, which represent the source of organic matter, were included in Factor 2. Factor 3 reflected the kerogen type and maturity of the source rock and had the parameters Tmax and HI.

5.4.3. Cluster Analysis

Applying HCA on the studied samples showed two clusters reflecting two types of source rocks (Figure 7). Cluster II was source rock that included the samples from well (b-65-J/94-B-16), Cluster I was the source rock that contained the rest of the samples. The results of this clustering technique were not consistent with the results of the geochemical analysis shown in (Figure 5B).
Applying the TwoStep cluster analysis on the pyrolysis results of the studied samples showed two clusters with a fair Silhouette measure of cohesion and separation (Figure 8). The two clusters reflected two different levels of maturity and generating potentials as the samples were related to the same source rock. The first cluster was characterized by TOC > 1.41 wt.%, S1 > 0.71 (mg HC/g rock), S2 > 0.48 (mg HC/g rock), S3 > 0.41 (mg CO2/g TOC), Tmax < 455 °C, HI > 39.5 mg HC/g TOC, and moderate OI (Figure 9), while the second cluster was characterized by TOC < 1.41 wt.%, S1 < 0.71 (mg HC/g rock), S2 < 0.48 (mg HC/g rock), S3 < 0.41 (mg CO2/g TOC), Tmax > 455 °C, HI > 39.5 mg HC/g TOC, and moderate OI (Figure 9); these results were consistent with the geochemical results shown in (Figure 5B).
The results of the TwoStep clustering method divided the samples into two main clusters. The first lay in the oil window zone with relatively high TOC, S1, S2, S3, HI, PI, and GP accompanied by low Tmax and neutral OI (Figure 9). The second cluster was in the dry gas window with relatively low TOC, S1, S2, S3, HI, PI, and GP accompanied by high Tmax and neutral OI (Figure 8).
The results indicated the efficiency of using this tool in distinguishing between the samples based on generating potential and maturity. Moreover, the clustering technique showed the predictor importance of the different parameters (Figure 10) where the HI forms the significant parameter in evaluating the source rocks followed by moderate to high effect for the S1 and S2 with low impact for the TOC and Tmax and neutral influence for the OI (Figure 9).

6. Conclusions

The examination of source-rock geochemistry and statistical modelling are critical elements in assessing hydrocarbon reserves. Geochemical parameters can be statistically represented to uncover the most essential common and affective qualities, which may take a long time to discover using conventional approaches. Thus, statistical modelling approaches make it quick and straightforward to gain a more detailed understanding of the results by simplifying access to the significance of residual elements and the extent of their interaction. This article examined both geochemical and statistical techniques for establishing the source rock’s composition, based on the Triassic Montney Formation samples from northeast British Columbia’s Western Canadian Sedimentary Basin. Our findings support the following assertions:
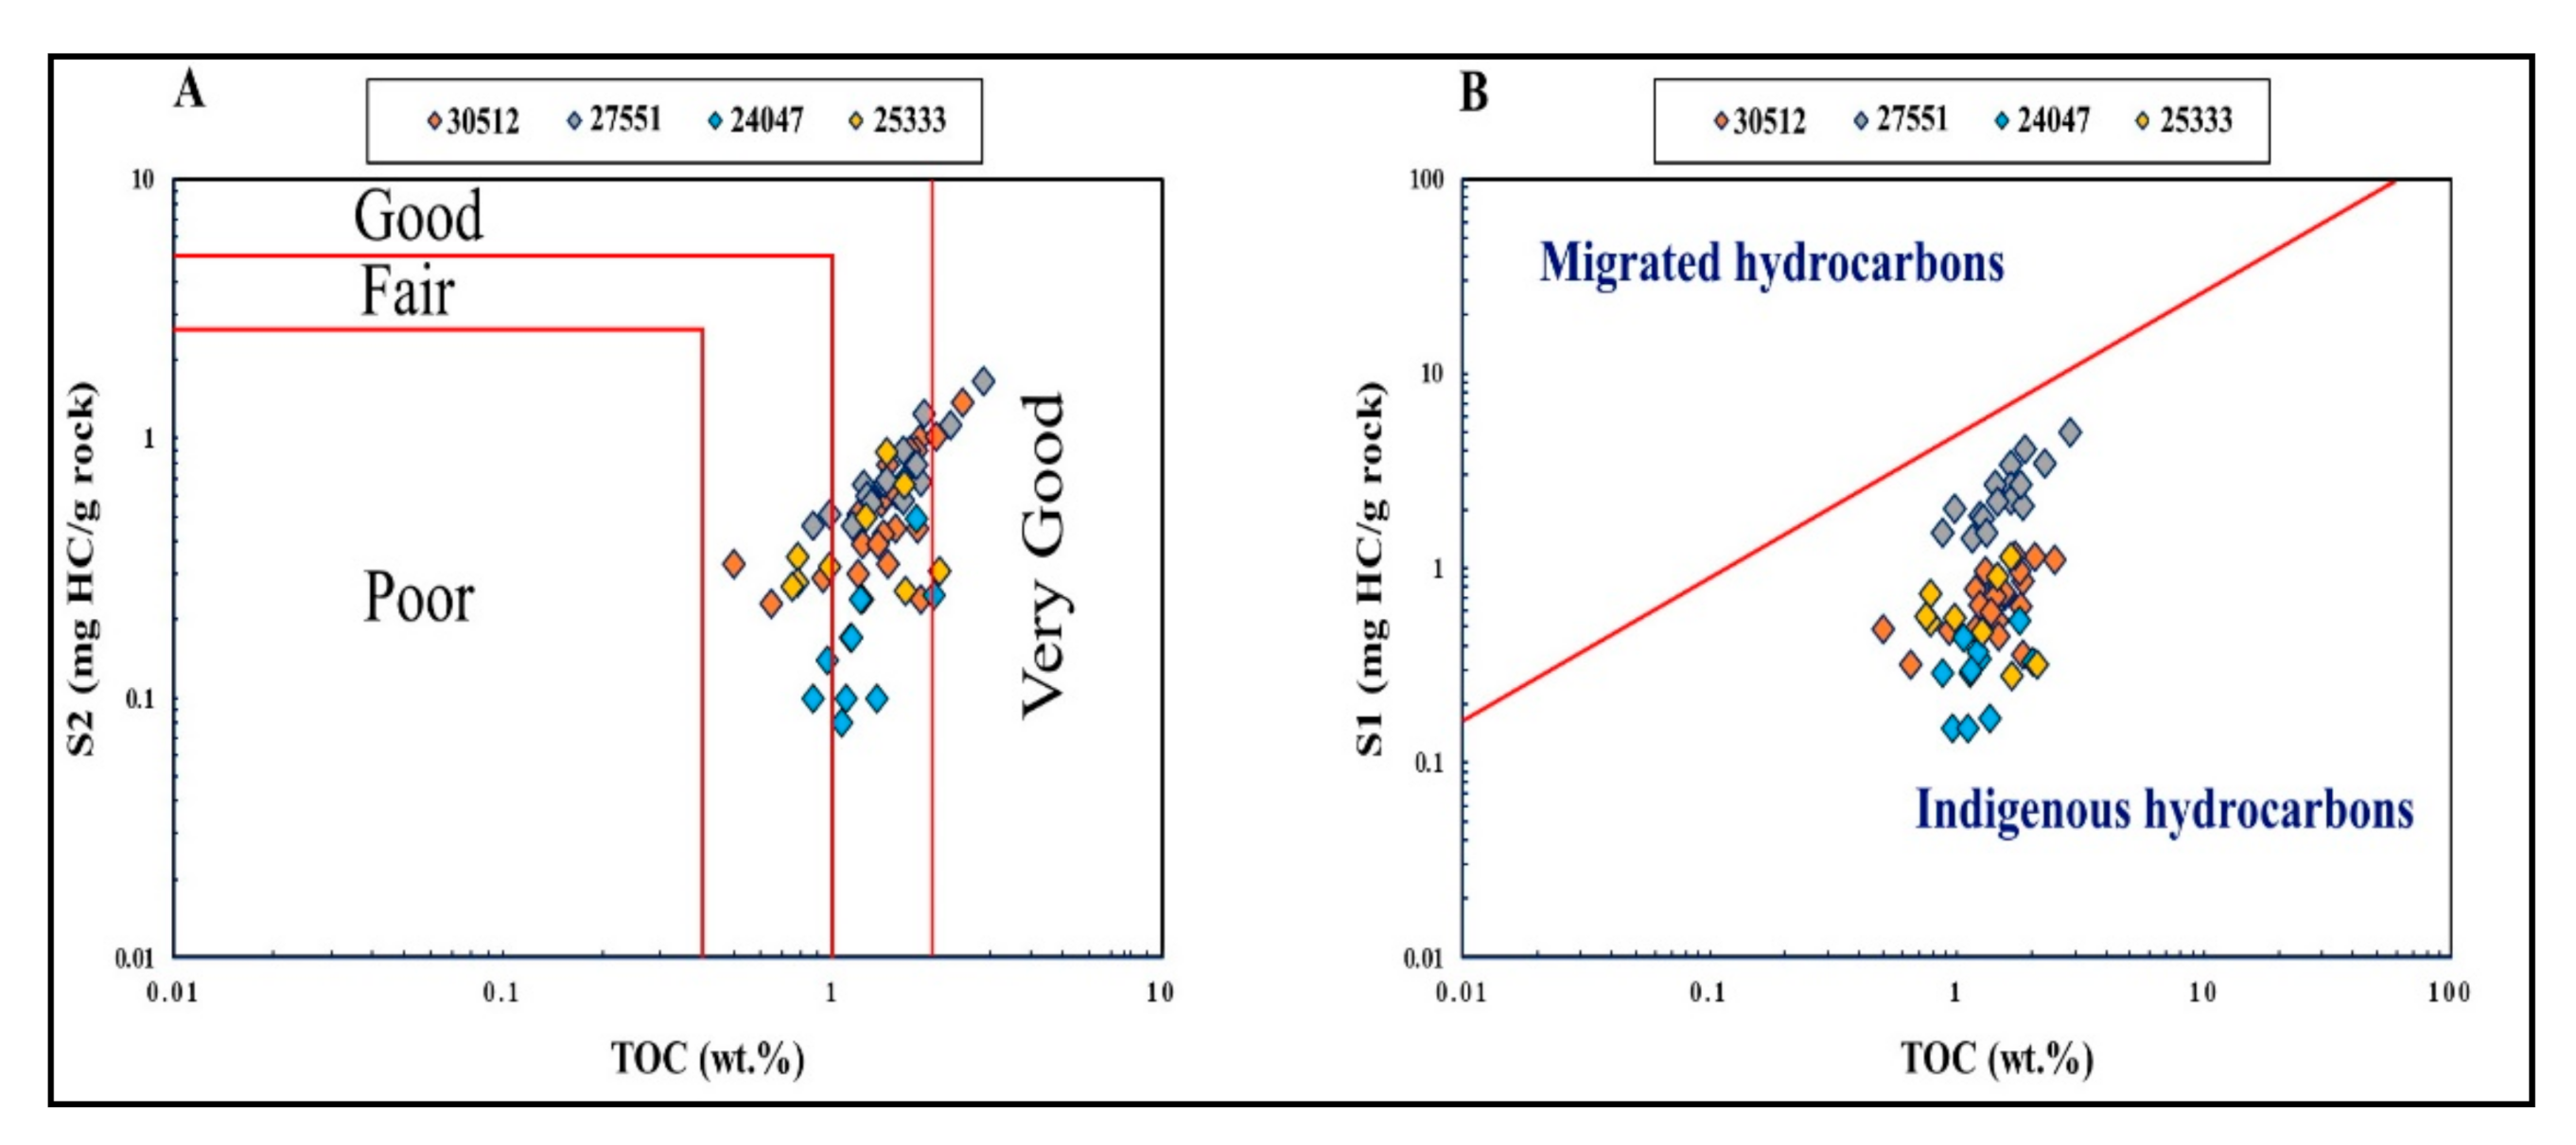
  • The TOC for the source rock presented in this study ranged from 0.5 to 2.86 wt.%, which was interpreted as fair to good source rock.
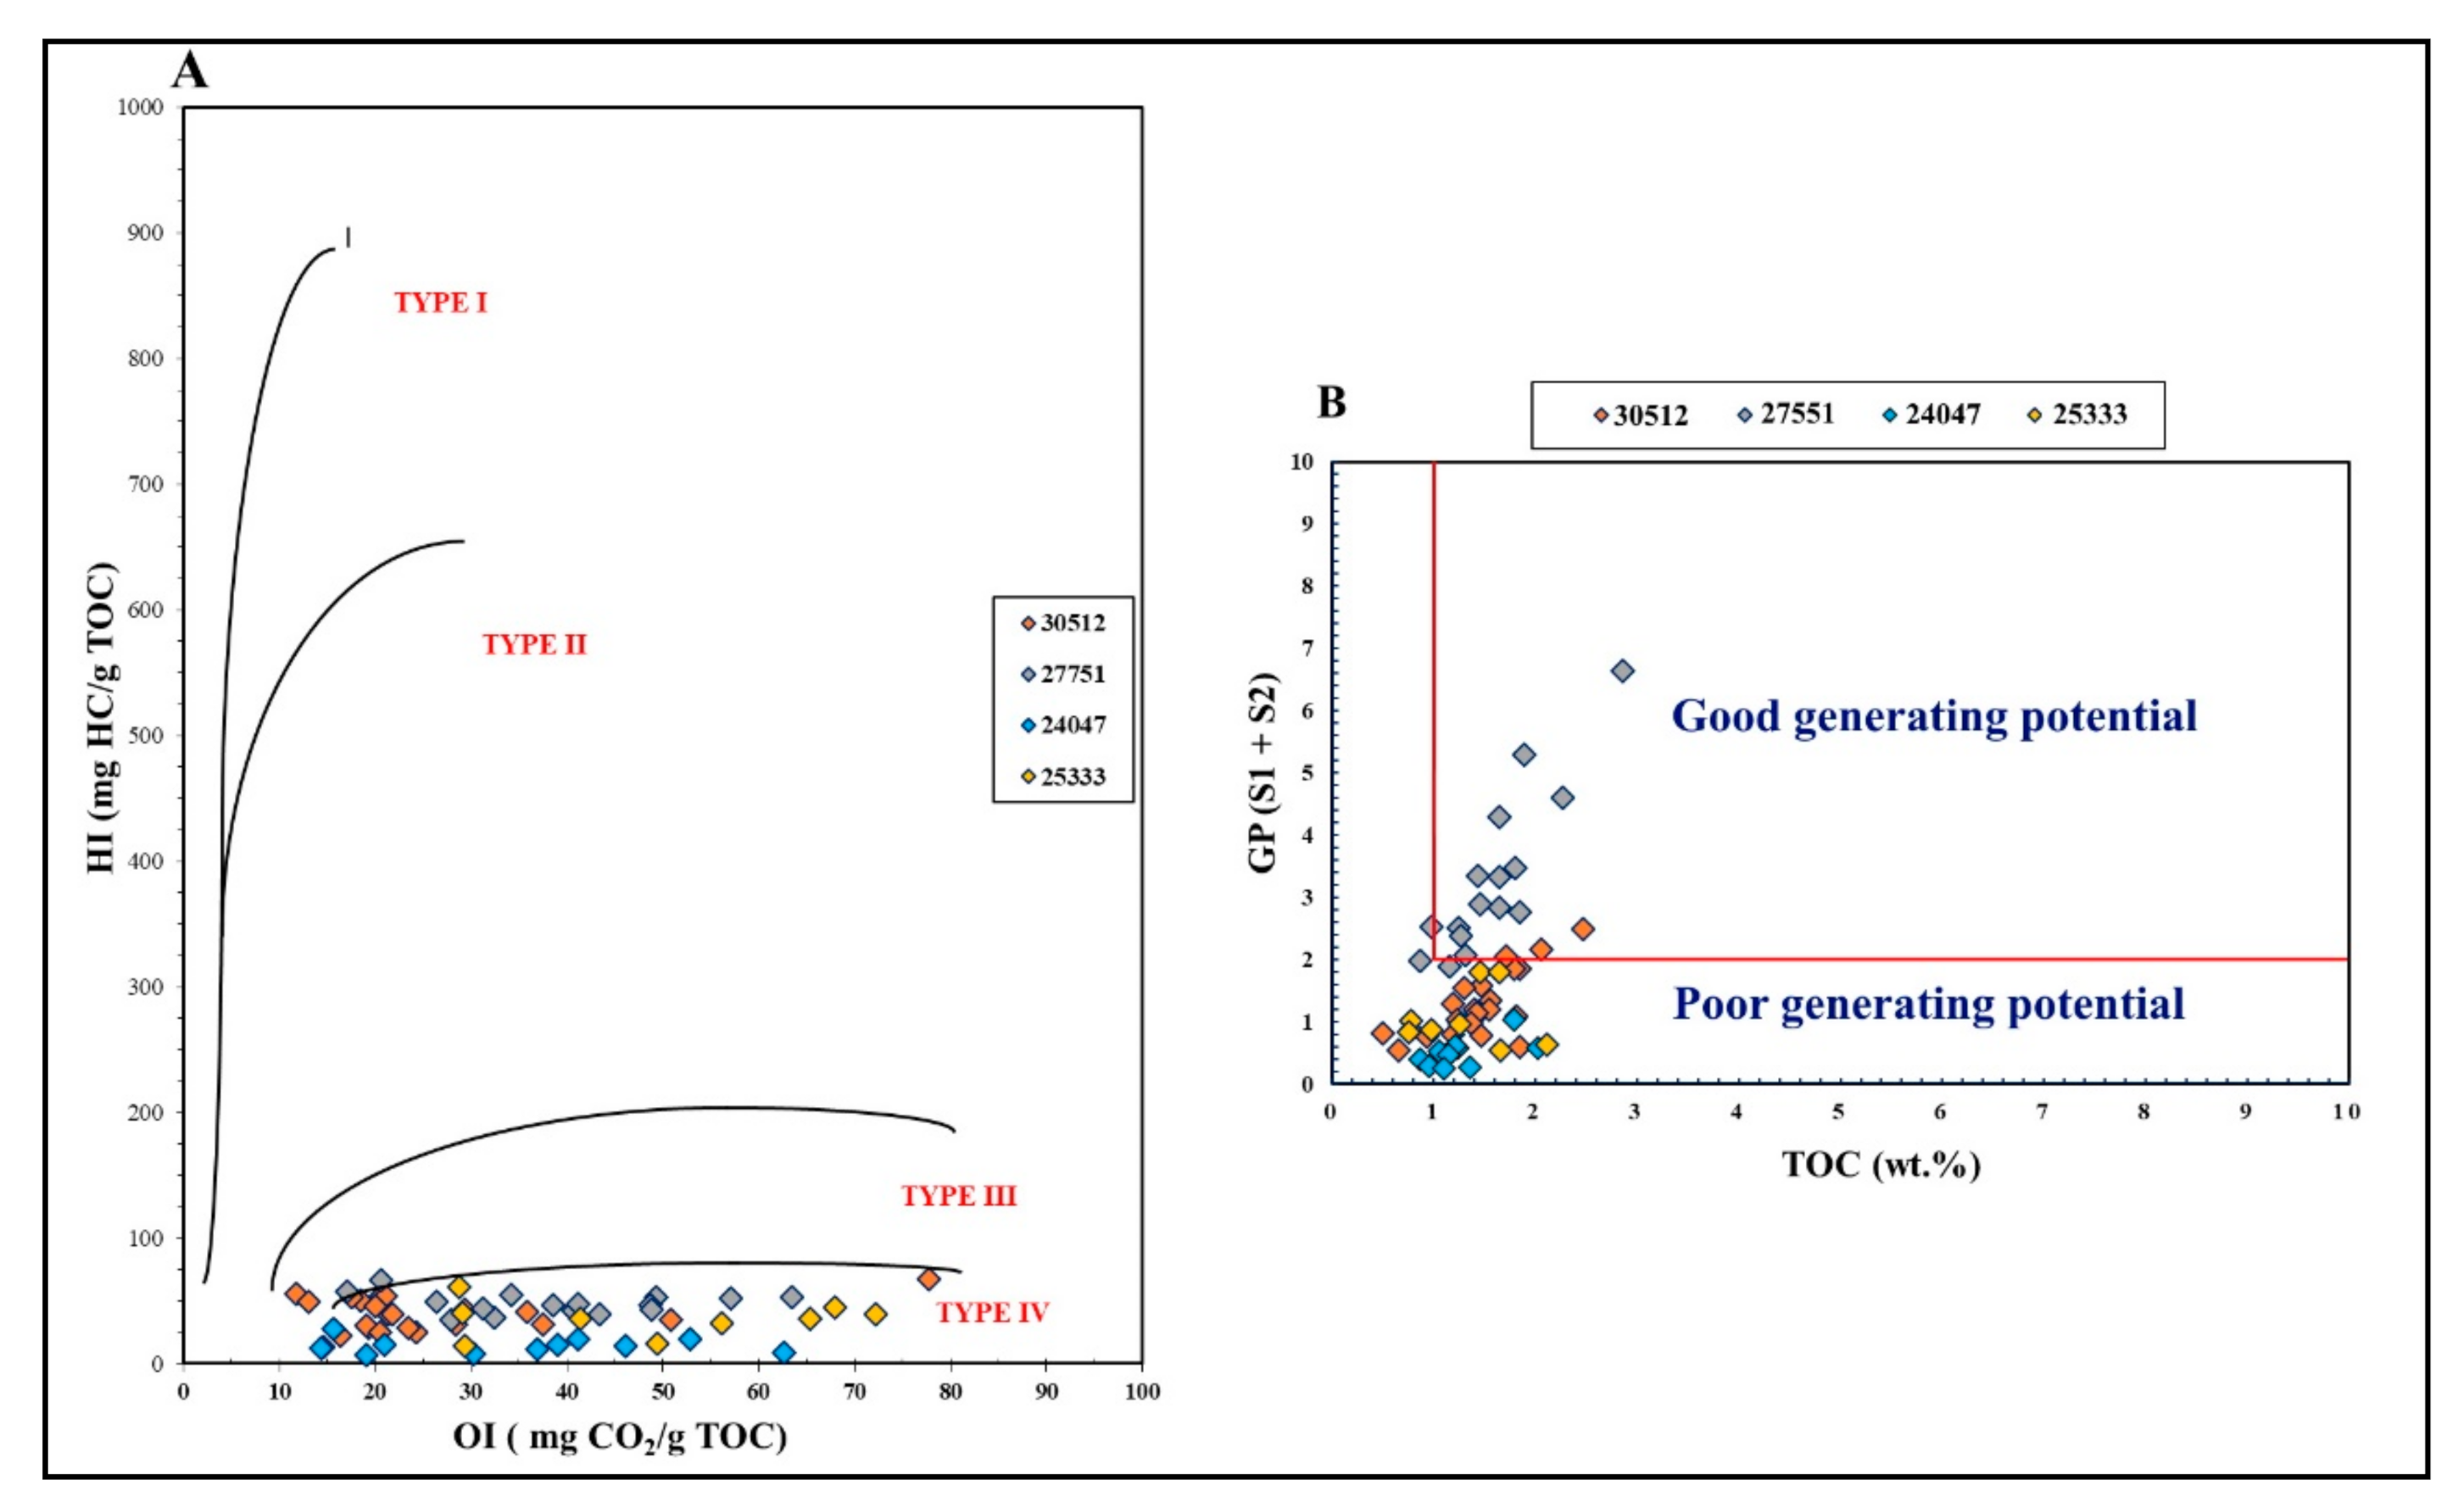
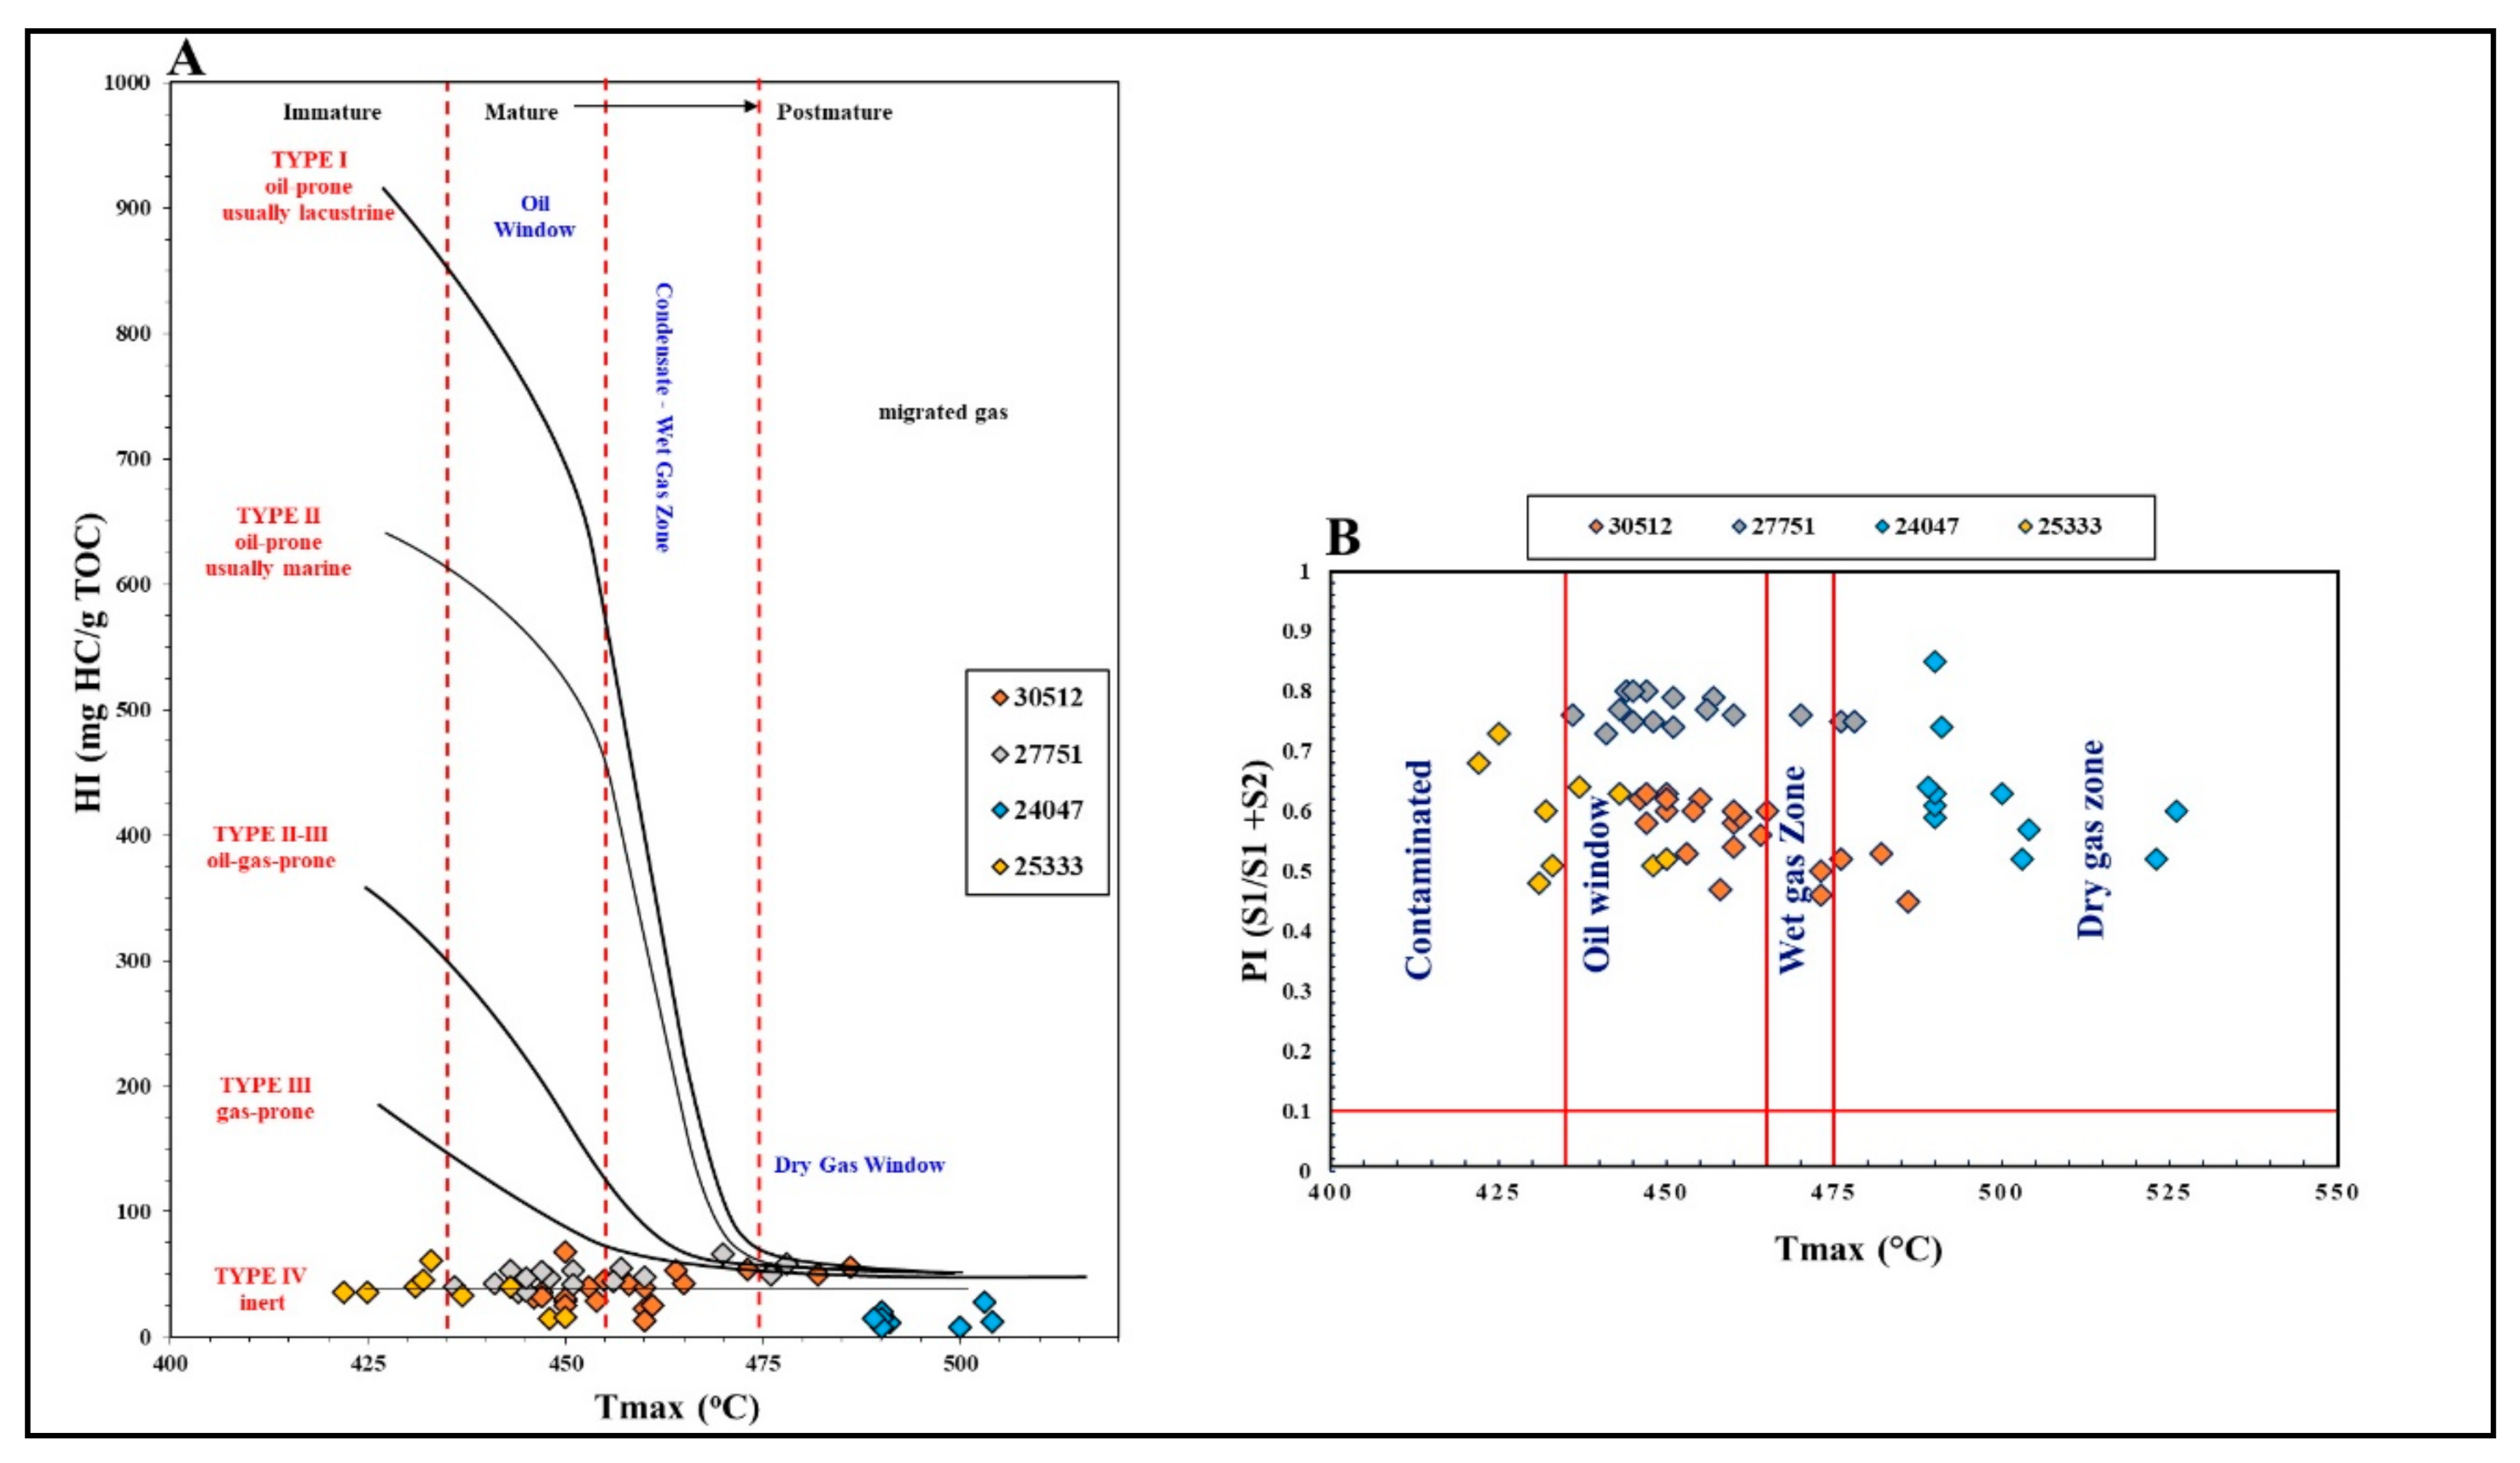
  • The hydrocarbon linked with the Montney Formation in the examined samples ranged from oil to dry gas with a medium to a high level of conversion depending on the Tmax and PI, originating from Type IV kerogen.
  • The higher values of the S1 compared with the S2 are likely to be interpreted as stained or contaminated source rock.
  • The Spearman’s correlation coefficient showed that the TOC had positive correlations with each of S1, S2, and GP, indicating that S1 and S2 contributed to TOC; additionally, the positive correlation with HI and negative correlation with OI, along with weak correlations with both Tmax and PI, indicated that the maturity of the source rocks was independent of the amount of organic matter.
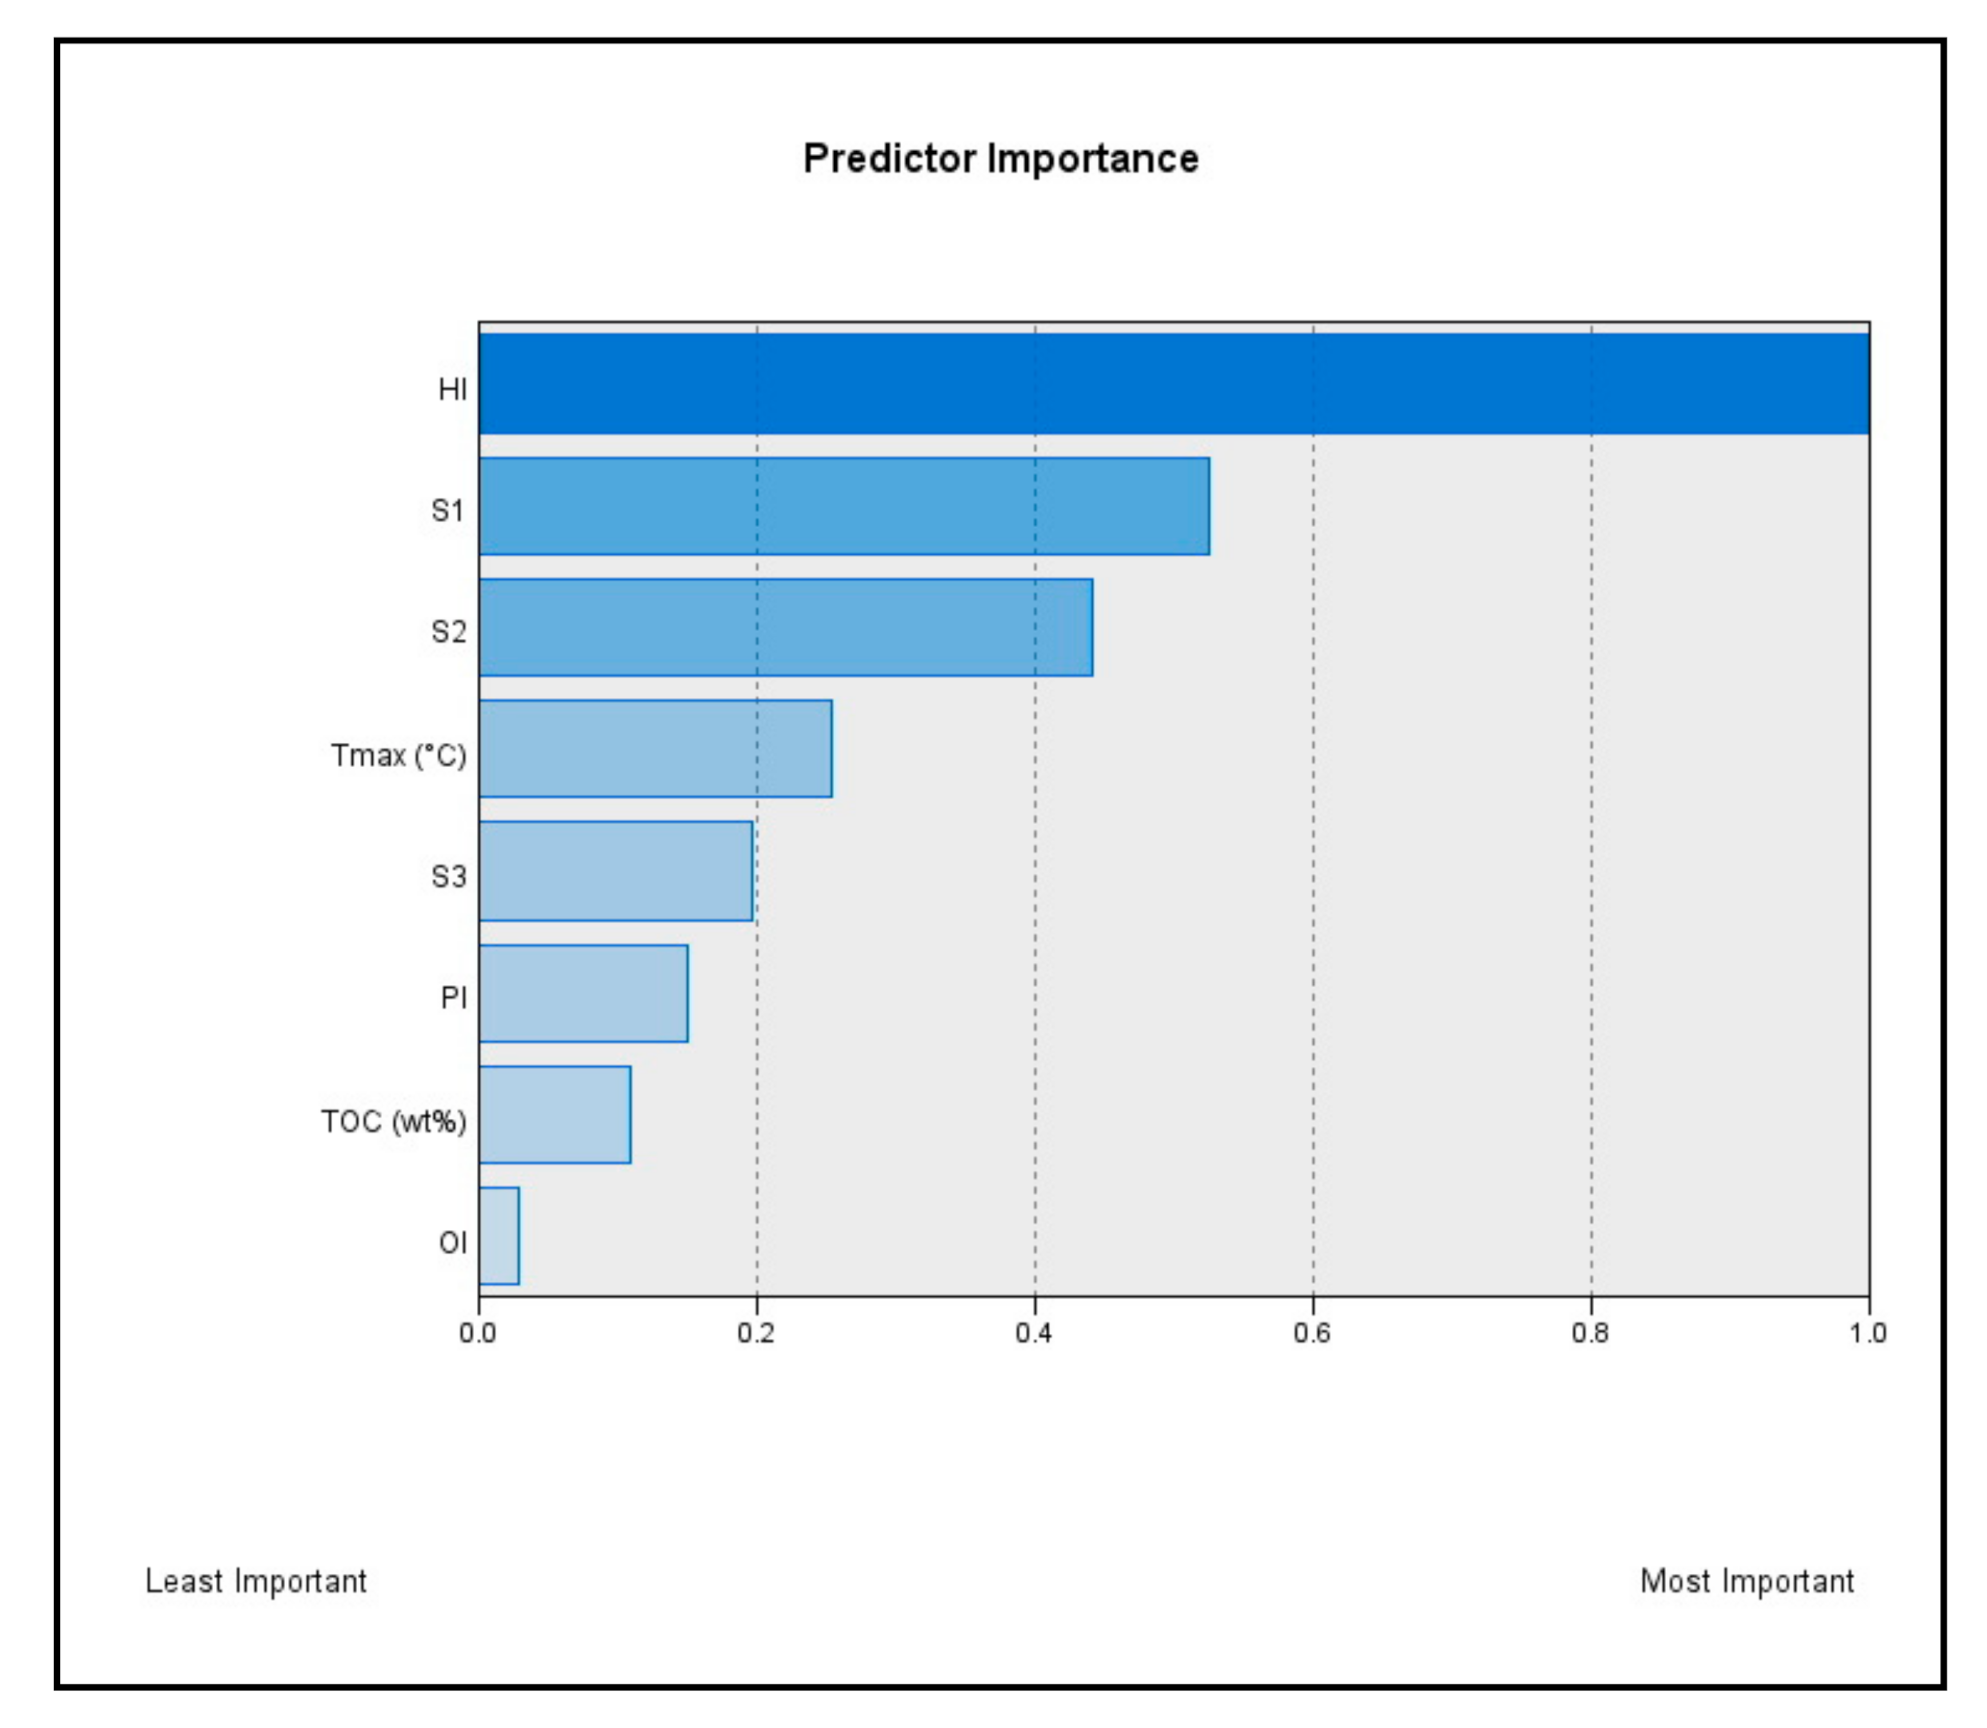
  • The PCA application categorized the pyrolysis parameters into three factors that influenced the source rock evaluation. TOC, S1, S2, and OI were all part of Factor 1, which determines the richness and potentiality. Factor 2 consisted of PI and S3, which reflected the maturity of the source rock. Tmax and HI of Factor 3 indicated the kerogen’s maturity level, source, and type.
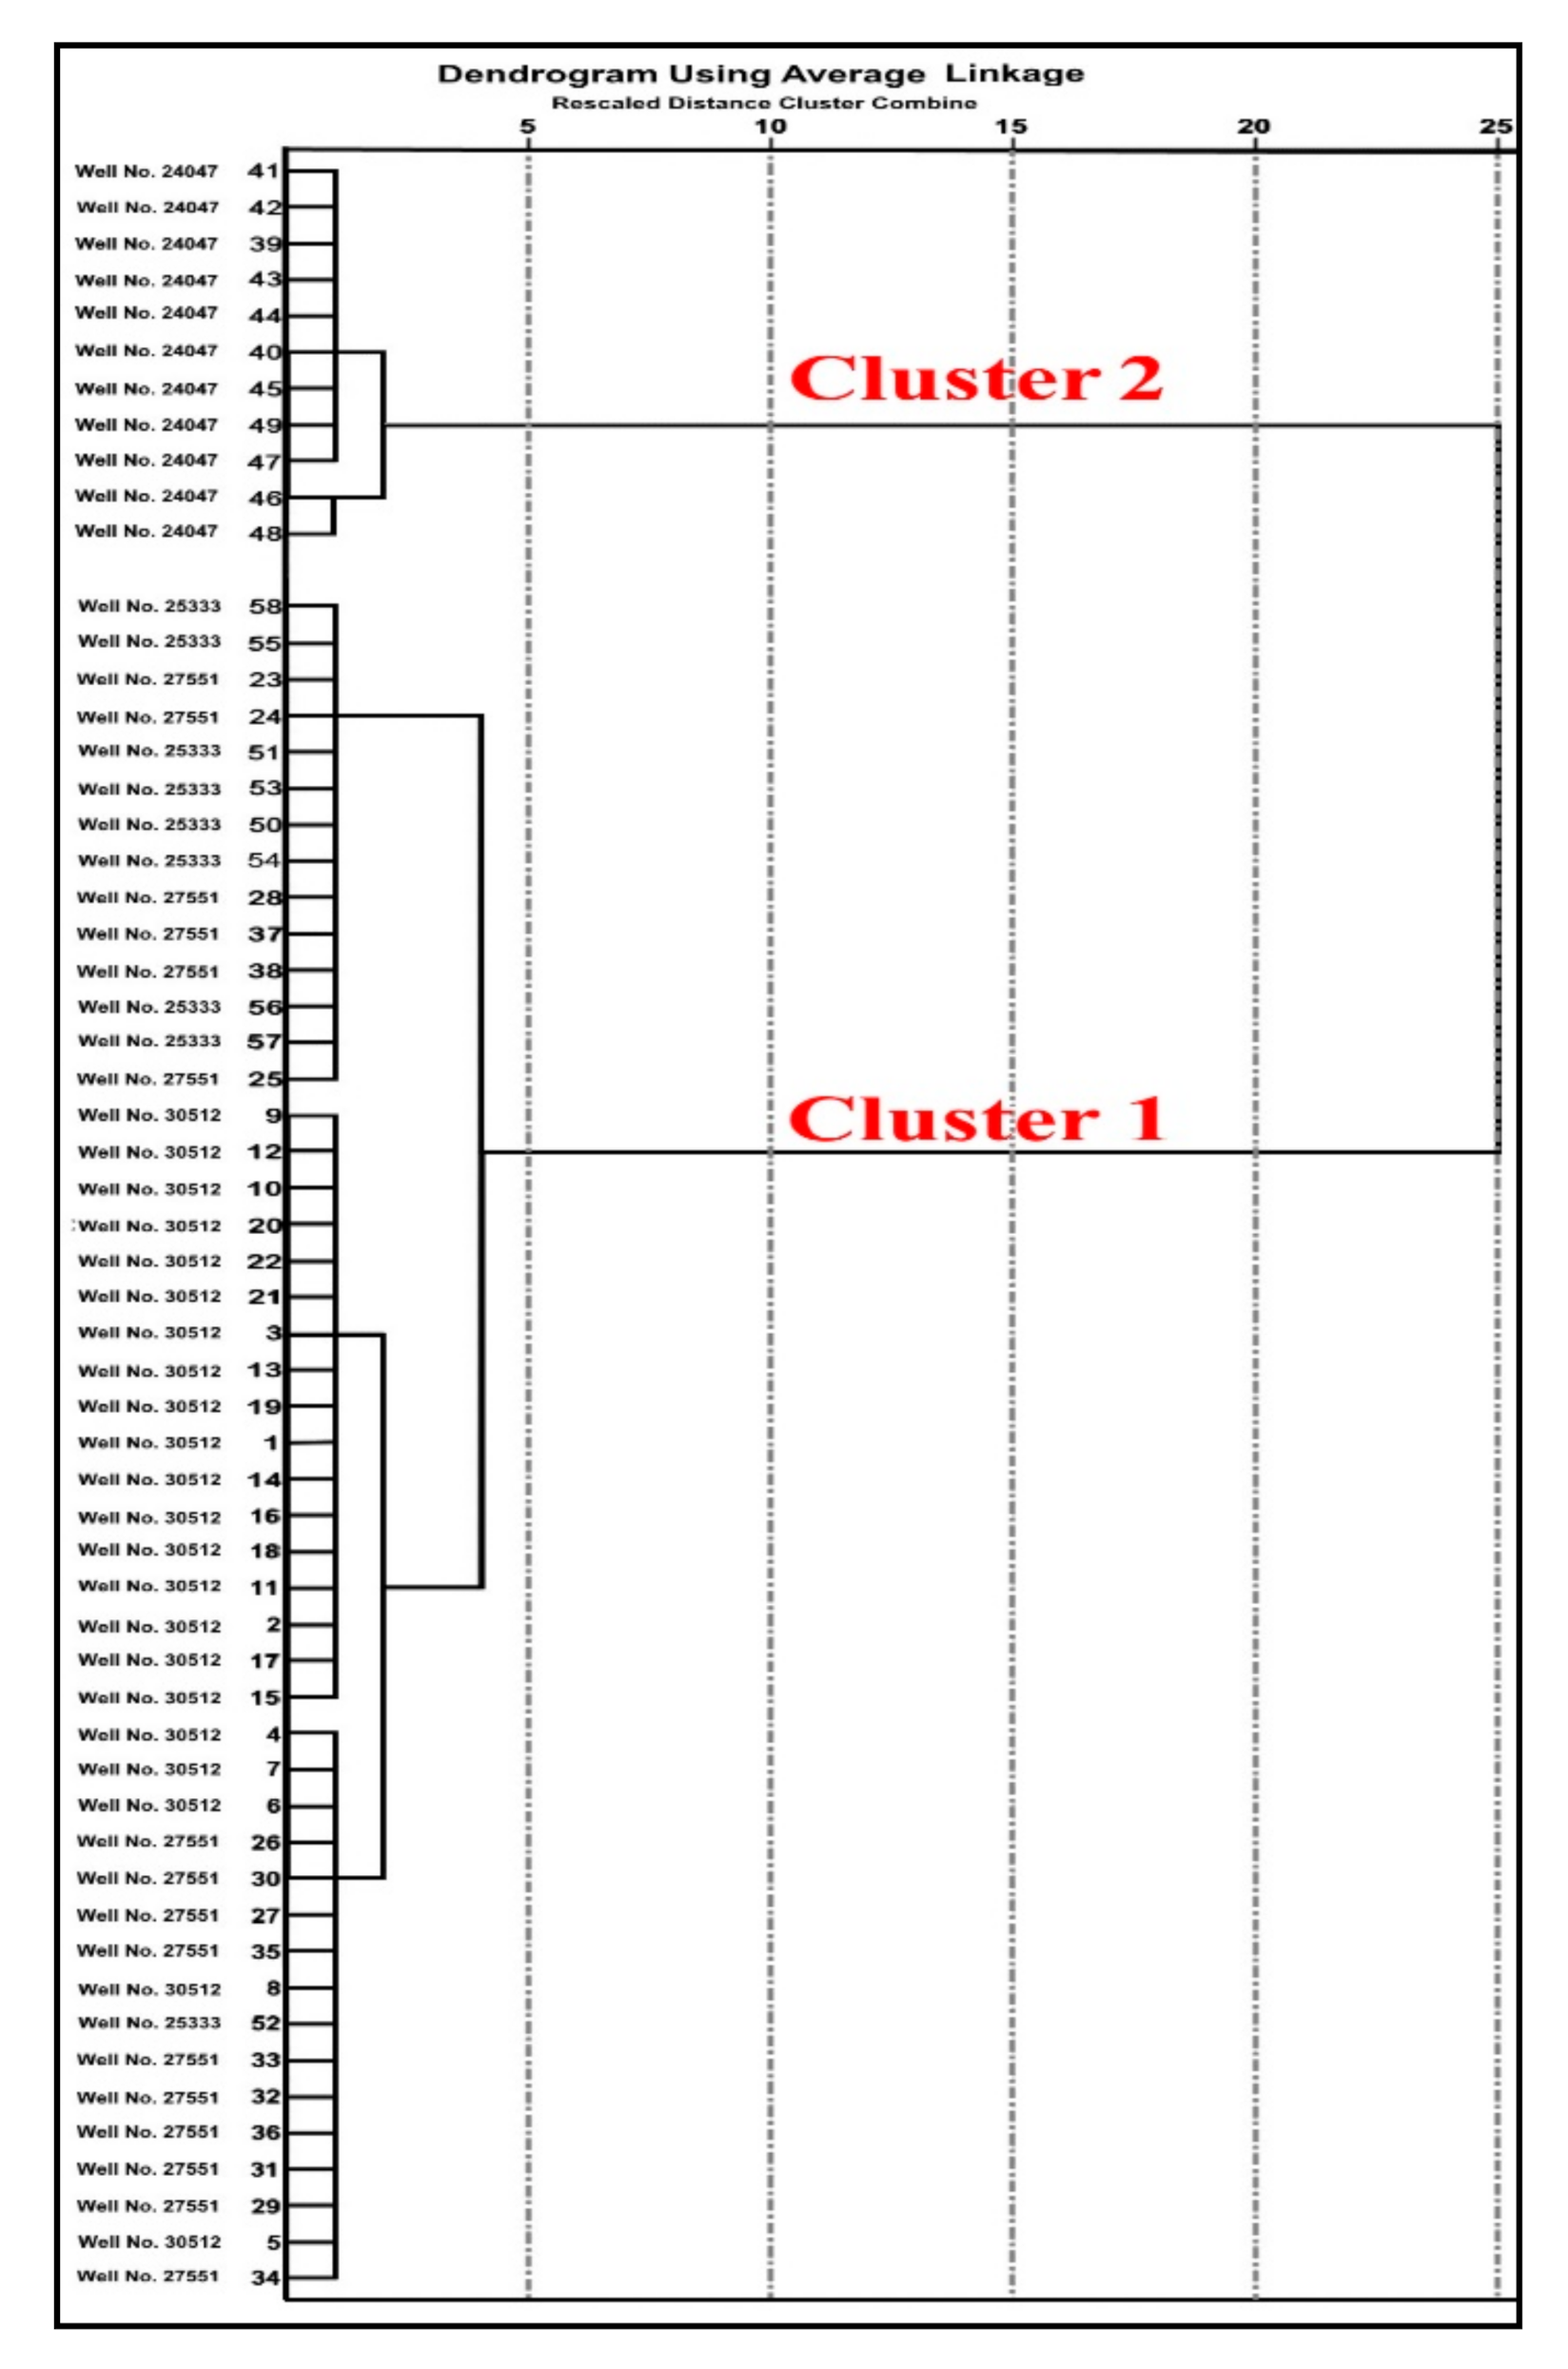
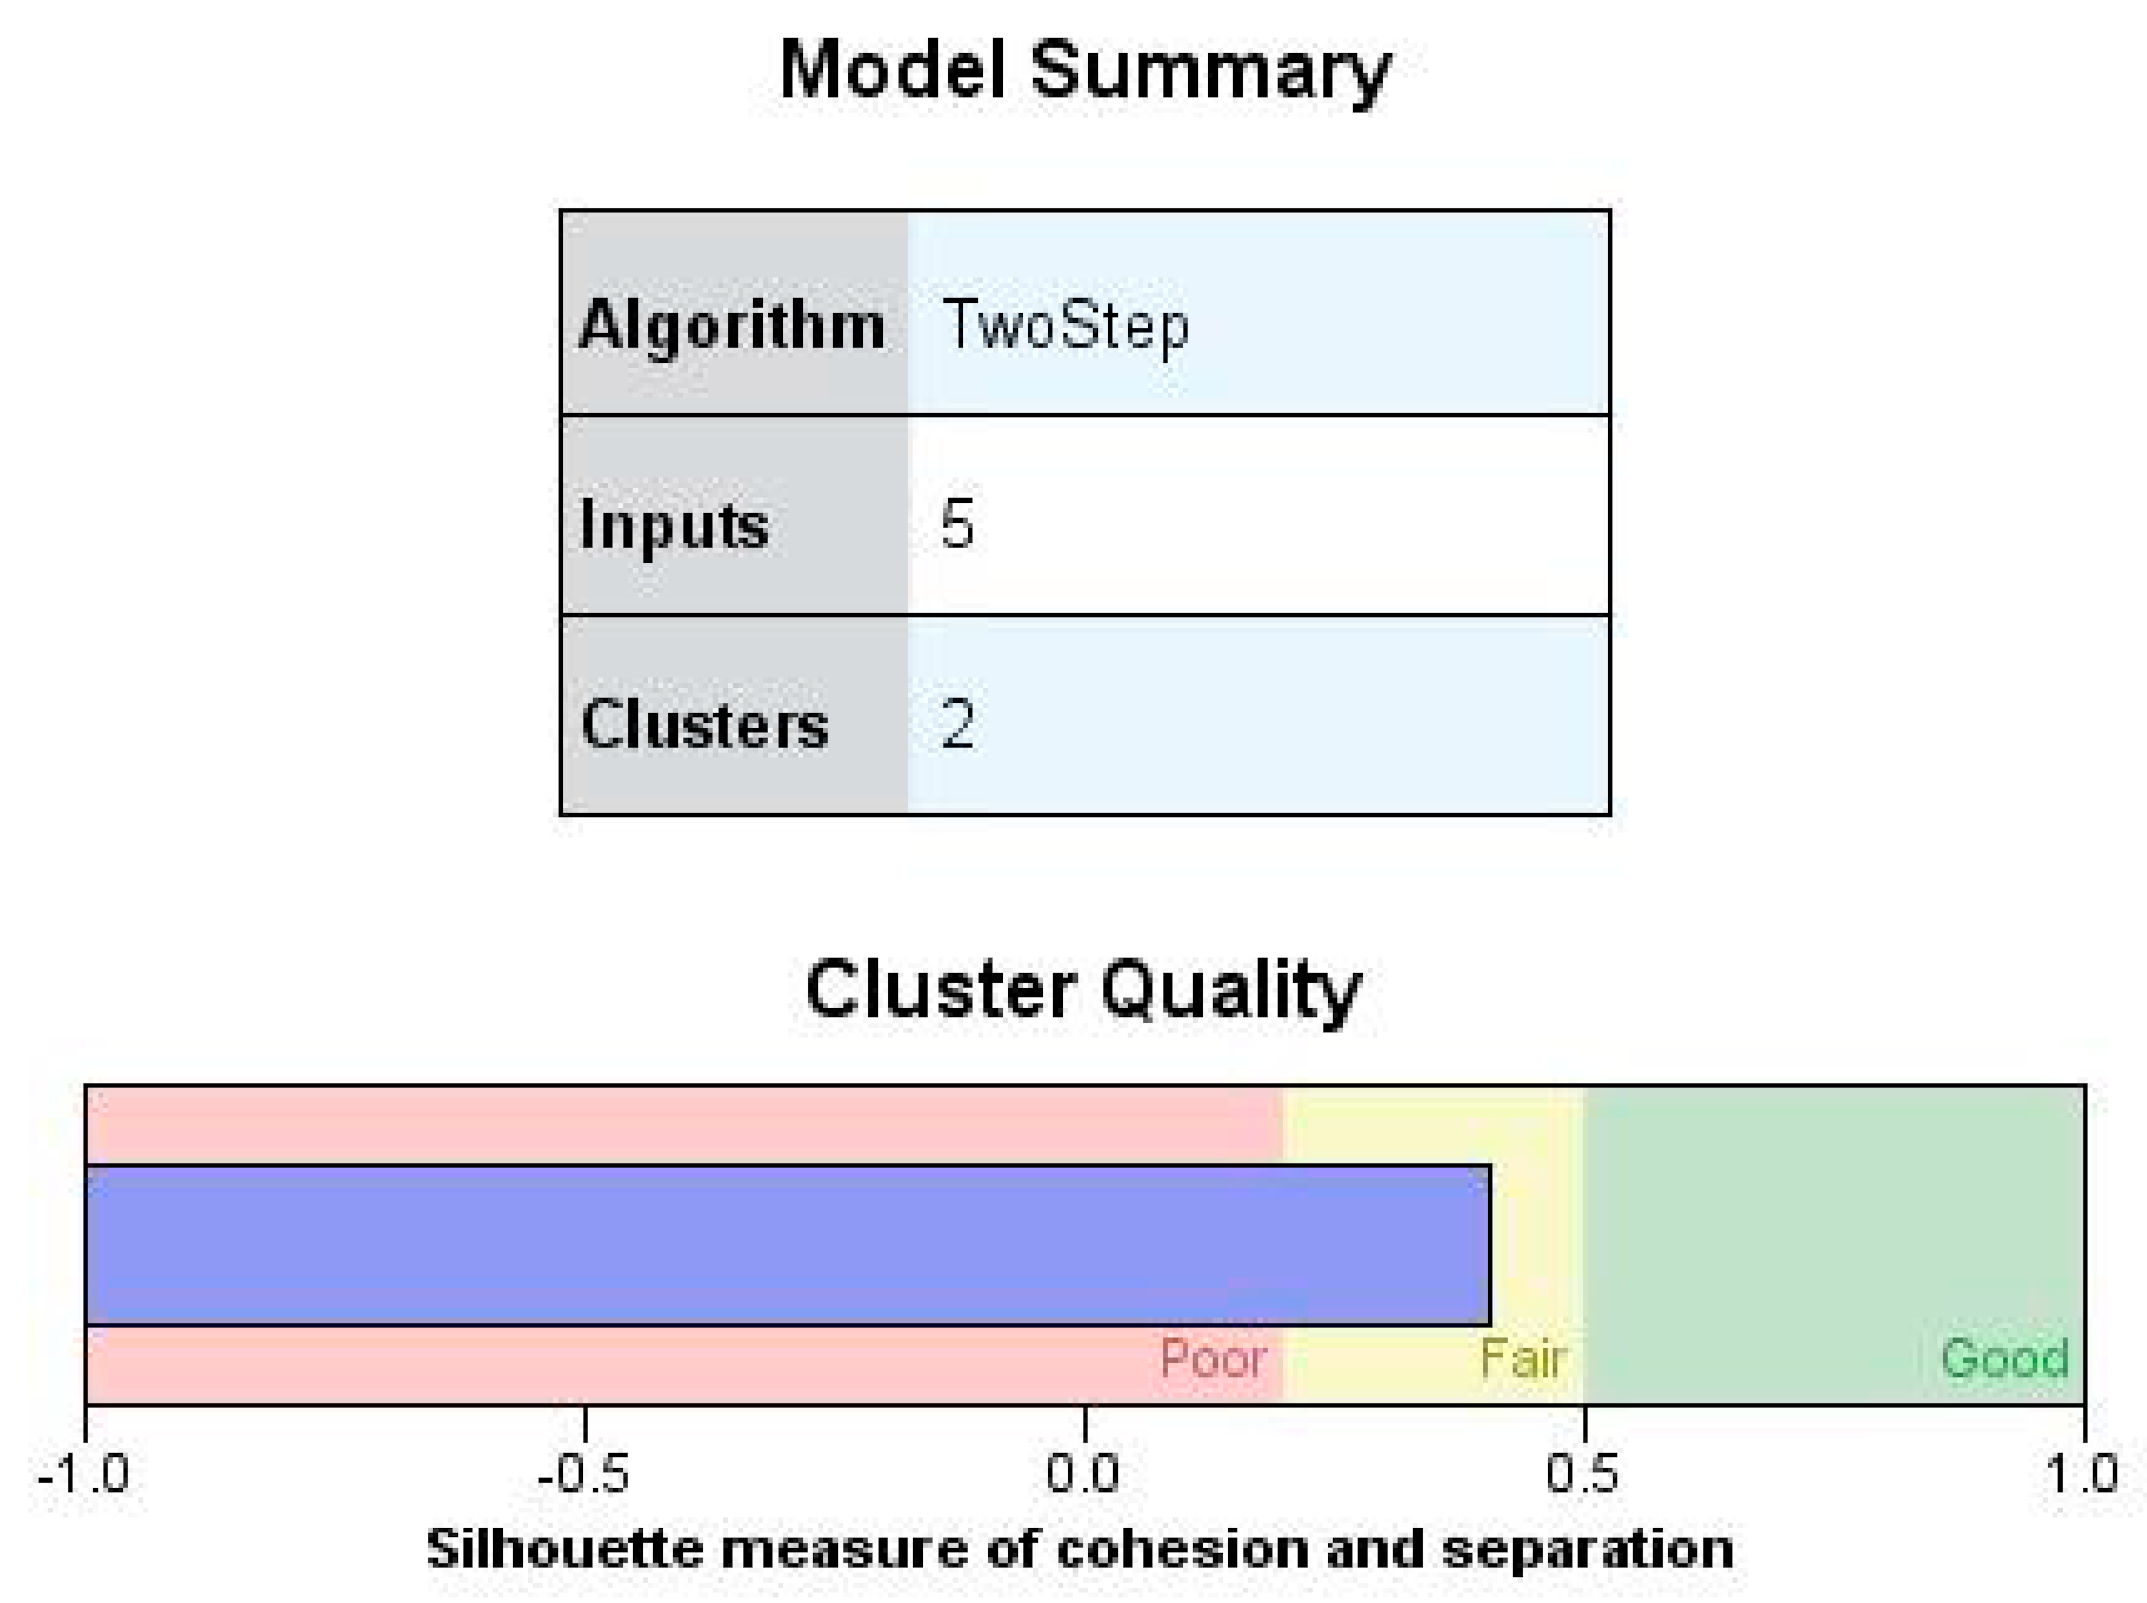
  • The clustering methods used in this study showed the efficiency and reliability of the TwoStep algorithm in contrast to the HCA algorithm.
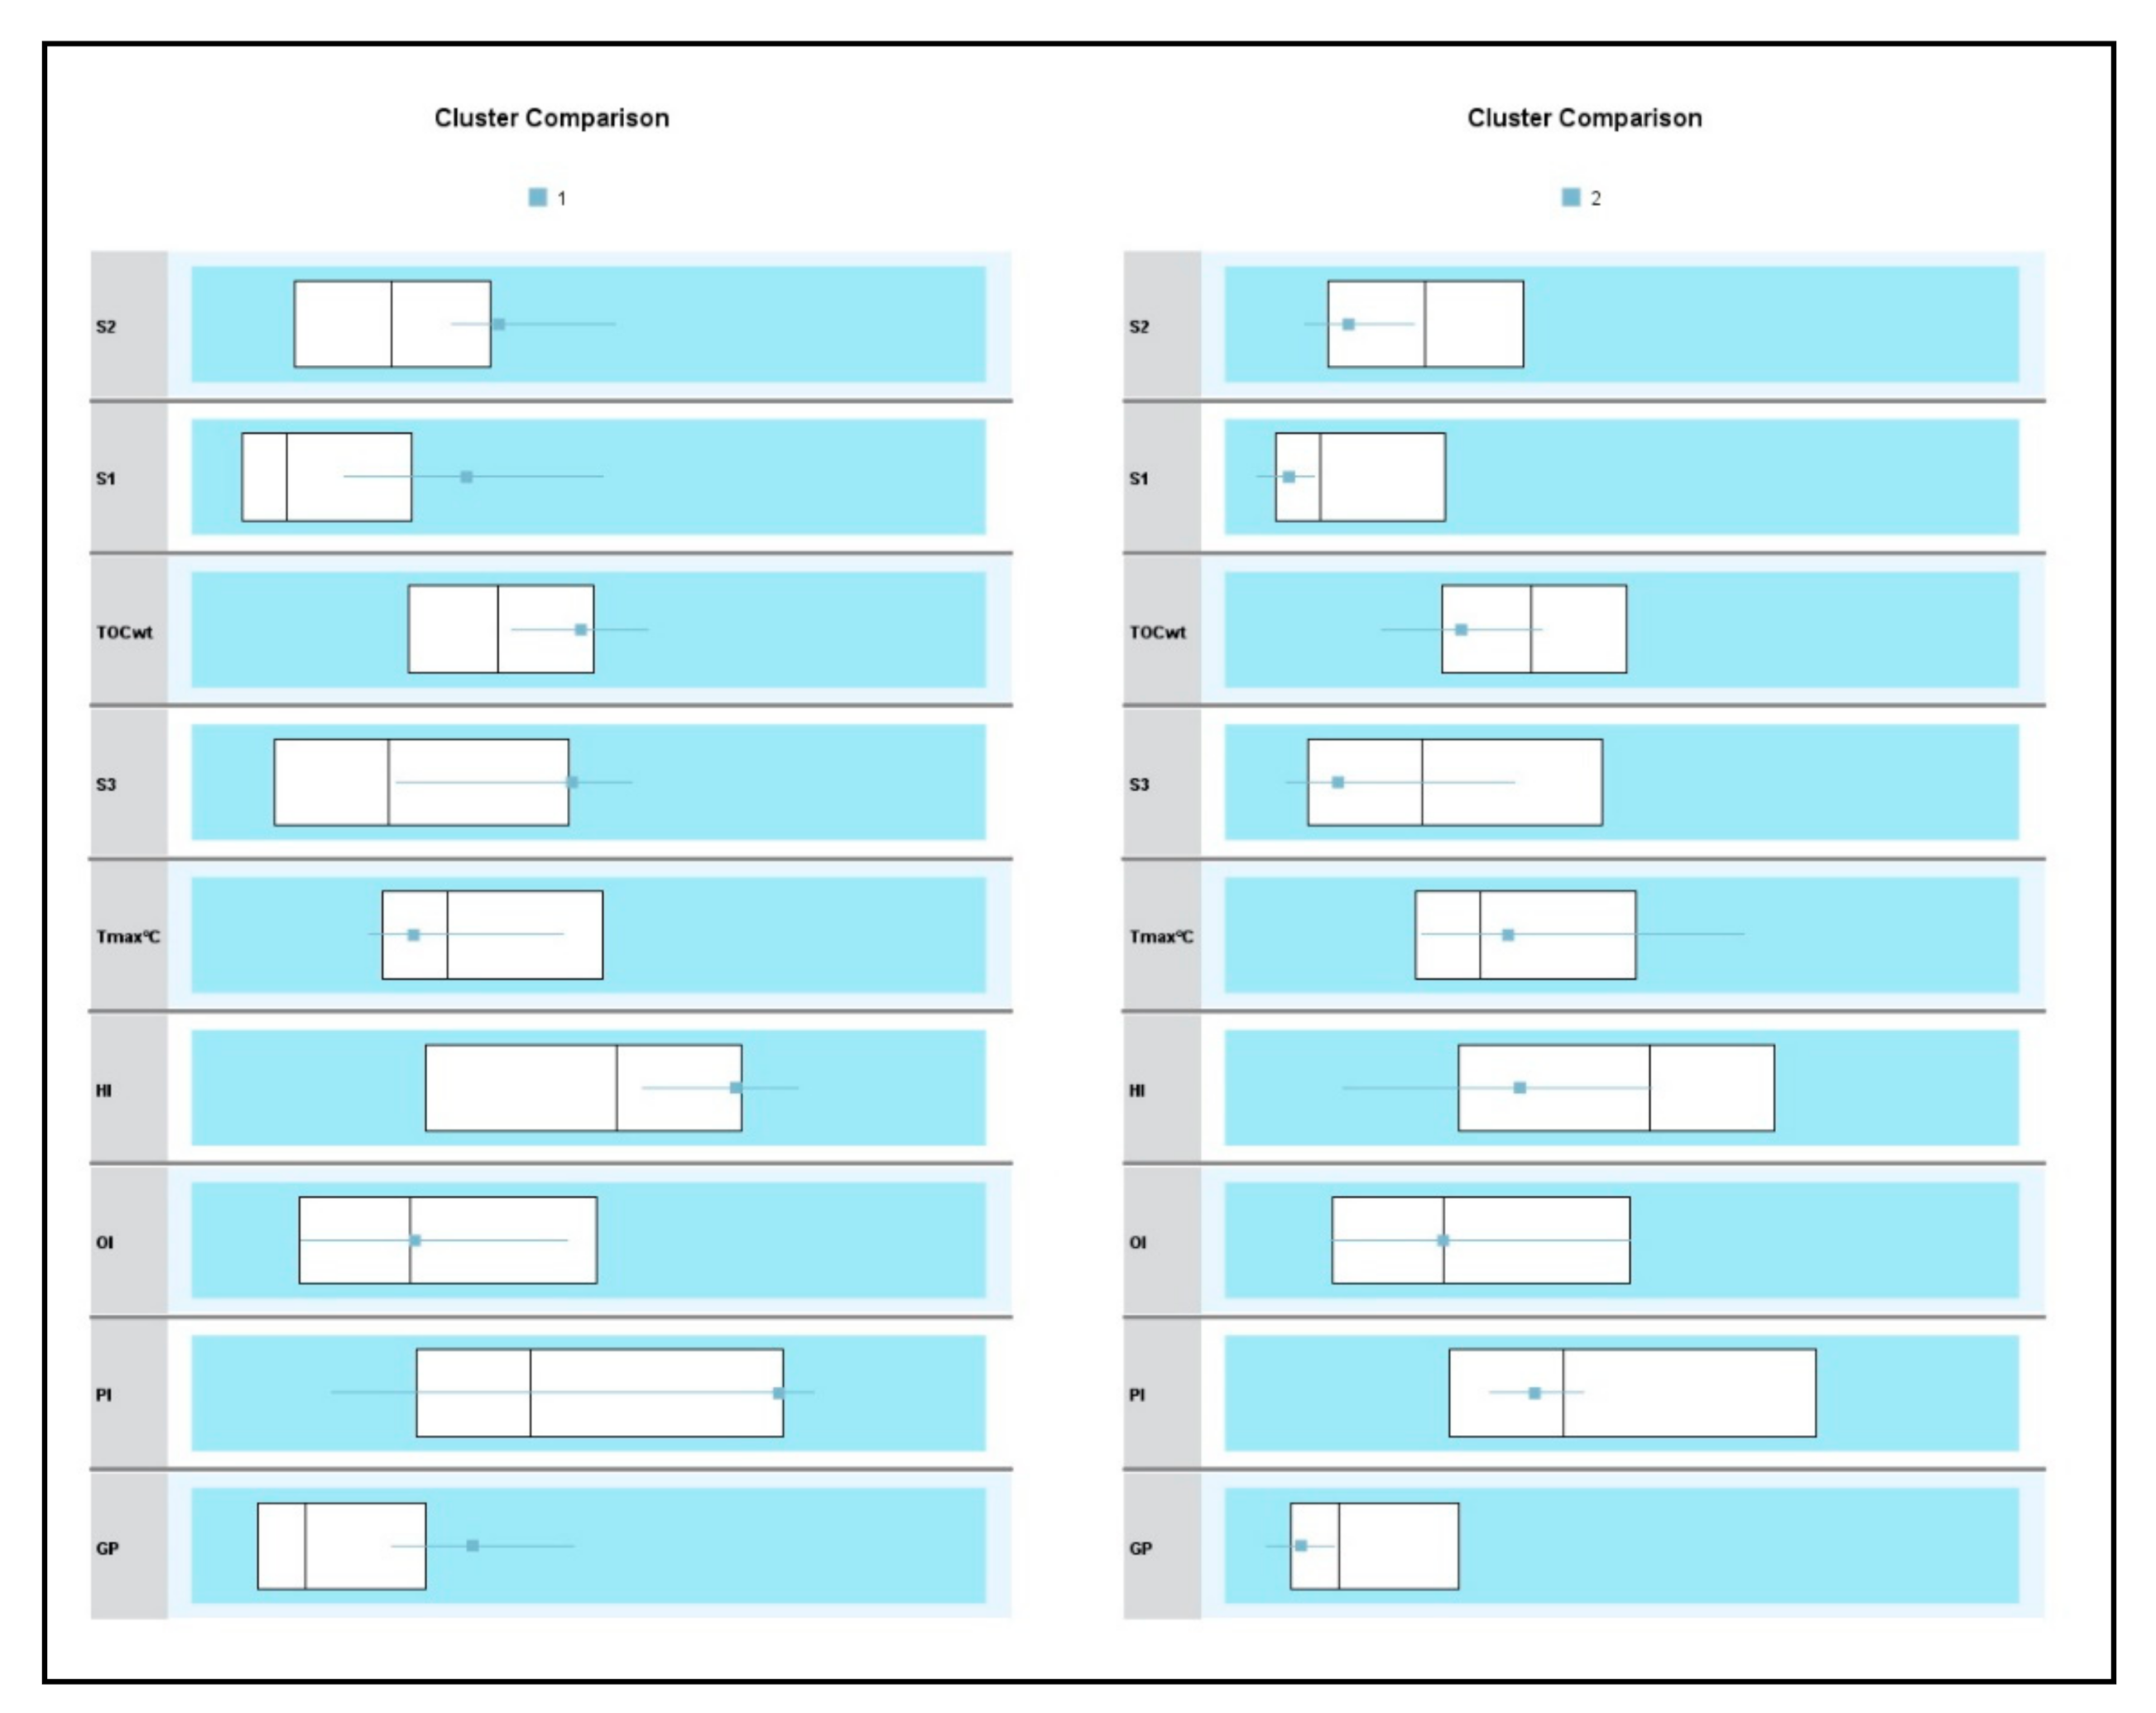
  • Using the TwoStep clustering method showed that there were two clusters within the Montney Formation. The first lay in the oil window zone with relatively high TOC, S1, S2, S3, HI, PI, and GP, accompanied by low Tmax and neutral OI (Figure 8). The second cluster was in the dry gas window with relatively low TOC, S1, S2, S3, HI, PI, and GP, accompanied by high Tmax and neutral OI.
  • Statistical modelling demonstrates that it is a valuable tool for uncovering previously unknown relationships between variables.

7. Recommendations, Applications and Future Work

The application of statistical analyses to geochemical parameters that determine the properties and capabilities of any source rock to create hydrocarbons allows us to take advantage of the vast amount of previously collected data. At the same time, it assists us in making the best judgments possible and so reduces risk. For our future work, we will require more data to ensure the success of conducting statistical analyses and raise the accuracy level of the results obtained.

Author Contributions

Conceptualization, A.B.; Data curation, A.B.; Formal analysis, A.B. and M.H.; Methodology, A.B., M.S.I. and M.H.; Project administration, M.S.I.; Software, A.B.; Supervision, M.S.I.; Validation, M.H.; Writing—original draft, A.B. All authors have read and agreed to the published version of the manuscript.

Funding

This research was funded by the Shale Gas Project Petroleum Research Fund (PRF:0153AB-A33-8).

Institutional Review Board Statement

Not applicable.

Informed Consent Statement

The data is from our own results.

Data Availability Statement

Results and data are all included in the manuscript.

Acknowledgments

The authors would like to thank the Shale Gas Project Petroleum Research Fund (PRF:0153AB-A33-8) project entitled Advanced Shale Gas Extraction Technology Using Electrochemical Methods; we also want to express our thanks to the shale gas research group (SGRG) at the Universiti Teknologi PETRONAS for their financial support. They are all consented to the acknowledgment.

Conflicts of Interest

The authors declare no conflict of interest.

References

  1. BC Oil & Gas Commission. British Columbia’s Oil and Gas Reserves and Production Report; BC Oil & Gas Commission: West Paris, ME, USA, 2015; Available online: http://www.bcogc.ca/node/13607/download (accessed on 5 October 2017).
  2. Walsh, W.; Adams, C.; Kerr, B.; Korol, J. Regional “Shale Gas” Potential of the Triassic Doig and Montney Formations, Northeastern British Columbia; British Columbia Ministry of Energy, Mines and Petroleum Resources, Resource Development and Geoscience Branch: Vancouver, BC, Canada, 2006; p. 2006-02.
  3. Adams, C.; Janicki, E.; Balogun, A. Summary of Shale Gas Activity in Northeast British Columbia 2011; BC Ministry of Natural Gas Development: Vancouver, BC, Canada, 2013; pp. 1–27.
  4. Haines, L.; Darbonne, N.; Barbee, M.A.; Williams, P.; Clouser, G.; Wagman, D.; Conly, M.; Grant, J. Tight Gas; Hart Energy Publishing: Houston, TX, USA, 2006; 14p. [Google Scholar]
  5. Schmoker, J.W. Method for Assessing Continuous-Type (Unconventional) Hydrocarbon Accumulations; Gautier, D.L., Dolton, G.L., Takahashi, K.I., Varnes, K.L., Eds.; National Assessment of United States Oil and Gas Resources—Results, Methodology, and Supporting Data: U.S. Geological Survey Digital Data Series, 30, CD-ROM; U.S. Geological Survey: Reston, VA, USA, 1995.
  6. Tissot, B.P.; Welte, D.H. Petroleum Formation and Occurrence; Springer Science & Business Media: Berlin/Heidelberg, Germany, 2013. [Google Scholar]
  7. Hunt, J.M. Petroleum Geochemistry and Geology; W.H. Freeman and Company: New York, NY, USA, 1995. [Google Scholar]
  8. Lecompte, B.; Hursan, G. Quantifying Source Rock Maturity from Logs: How to Get More than TOC from Delta Log R. In SPE Annual Technical Conference and Exhibition; Society of Petroleum Engineers: Richardson, TX, USA, 2010. [Google Scholar]
  9. Dembicki, H. Practical Petroleum Geochemistry for Exploration and Production; Elsevier: Amsterdam, The Netherlands, 2016. [Google Scholar]
  10. Peters, K.E.; Fowler, M.G. Applications of petroleum geochemistry to exploration and reservoir management. Org. Geochem. 2002, 33, 5–36. [Google Scholar] [CrossRef]
  11. El Nady, M.M.; Ramadan, F.S.; Hammad, M.M.; Lotfy, N.M. Evaluation of organic matters, hydrocarbon potential and thermal maturity of source rocks based on geochemical and statistical methods: Case study of source rocks in Ras Gharib oilfield, central Gulf of Suez, Egypt. Egypt. J. Pet. 2015, 24, 203–211. [Google Scholar] [CrossRef] [Green Version]
  12. Millayanti, A.; Aprianto, A.R.; Fauzan, R.F.; Anggara, M.U. Evaluation of Organic Matters, Hydrocarbon Potential and Thermal Maturity of Source Rocks Based on Geochemical and Statistical Methods: Case Study Miocene of the Seblat and Lemau Formation, Bengkulu Basin. IOP Conf. Ser. Earth Environ. Sci. 2019, 248, 012075. [Google Scholar] [CrossRef] [Green Version]
  13. Edwards, D.S.; Struckmeyer, H.I.M.; Bradshaw, M.T.; Skinner, J.E. Geochemical characteristics of Australia’s southern margin petroleum systems. APPEA J. 1999, 39, 297–321. [Google Scholar] [CrossRef]
  14. BC Oil & Gas Commission (BCOGC). Industry Bulletin 2011-33, Submission Information for Disclosure of Hydraulic Fracturing Fluids, British Columbia, Canada; BCOGC: Fort St. John, BC, Canada, 2011. [Google Scholar]
  15. Edwards, D.; Barclay, J.; Gibson, D.W.; Kvill, G.E.; Halton, E. Triassic strata of the Western Canada sedimentary basin. Bull. Can. Pet. Geol. 1990, 38, 163. [Google Scholar]
  16. Orchard, M.; Zonneveld, J.-P. The Lower Triassic Sulphur Mountain Formation in the Wapiti Lake area: Lithostratigraphy, conodont biostratigraphy, and a new biozonation for the lower Olenekian (Smithian) Earth Science Sector (ESS) Contribution 20080714. Can. J. Earth Sci. 2009, 46, 757–790. [Google Scholar] [CrossRef]
  17. Podruski, J.; Barclay, J.; Lee, P.J.; Osadetz, K.G.; Hamblin, A.P.; Procter, R.G.; Taylor, G.C. Conventional Oil Resources of Western Canada (Light and Medium); Geological Survey of Canada, Paper 87–26; Geological Survey of Canada: Ottawa, ON, Canada, 1988; pp. 1–125.
  18. Riediger, C.L.; Brooks, P.W.; Fowler, M.G.; Snowdon, L.R. Lower and Middle Triassic source rocks, thermal maturation, and oil-source rock correlations in the Peace River Embayment area, Alberta and British Columbia. Bull. Can. Pet. Geol. 1990, 38, 218–235. [Google Scholar]
  19. Gibson, D.; Edwards, D. An overview of Triassic stratigraphy and depositional environments in the Rocky Mountain foothills and western interior plains, Peace River arch area, northeastern British Columbia. Bull. Can. Pet. Geol. 1990, 38, 146–158. [Google Scholar]
  20. Barclay, J.E.; Krause, F.F.; Campbell, R.I.; Utting, J. Dynamic casting and growth faulting: Dawson Creek graben complex, Carboniferous-Permian Peace River embayment, western Canada. Bull. Can. Pet. Geol. 1990, 38, 115–145. [Google Scholar]
  21. Davies, G.R.; Moslow, T.F.; Sherwin, M.D. The lower Triassic Montney formation, west-central Alberta. Bull. Can. Pet. Geol. 1997, 45, 474–505. [Google Scholar]
  22. Orchard, M.; Tozer, E. Triassic conodont biochronology, its calibration with the ammonoid standard, and a biostratigraphic summary for the Western Canada Sedimentary Basin. Bull. Can. Pet. Geol. 1997, 45, 675–692. [Google Scholar]
  23. Zonneveld, J.-P. Sedimentology and Sequence Biostratigraphic Framework of a Mixed Siliciclastic-Carbonate Depositional System, Middle Triassic, Northeastern British Columbia. Ph.D. Thesis, University of Alberta, Edmonton, AB, Canada, 1999. [Google Scholar]
  24. Zonneveld, J.-P.; Gingras, M.; Pemberton, S. Trace fossil assemblages in a Middle Triassic mixed siliciclastic-carbonate marginal marine depositional system, British Columbia. Palaeogeogr. Palaeoclim. Palaeoecol. 2001, 166, 249–276. [Google Scholar] [CrossRef]
  25. Willis, A.J.; Moslow, T.F. Sedimentology and stratigraphy of tidal inlet reservoirs in the Triassic Halfway Formation, Wembley Field, Alberta. Bull. Can. Pet. Geol. 1994, 42, 245–262. [Google Scholar]
  26. Davies, G.R. The Triassic of the Western Canada Sedimentary Basin: Tectonic and stratigraphic framework, paleogeography, paleoclimate and biota. Bull. Can. Pet. Geol. 1997, 45, 434–460. [Google Scholar]
  27. Sellwood, B.W.; Valdes, P.J. Mesozoic climates: General circulation models and the rock record. Sediment. Geol. 2006, 190, 269–287. [Google Scholar] [CrossRef]
  28. Playter, T.L. Petrographic and X-ray Microtomographic Analysis of the Upper Montney Formation, Northeastern British Columbia, Canada; University of Alberta (Canada): Edmonton, AB, Canada, 2013. [Google Scholar]
  29. Raup, D.M. Size of the Permo-Triassic Bottleneck and Its Evolutionary Implications. Science 1979, 206, 217–218. [Google Scholar] [CrossRef] [PubMed]
  30. Erwin, D.H. Extinction: How Life on Earth Nearly Ended 250 Million Years Ago; Princeton University Press: Princeton, NJ, USA, 2006. [Google Scholar]
  31. Zonneveld, J.-P.; Beatty, T.W.; Macnaughton, R.B.; Pemberton, S.G.; Utting, J.; Henderson, C.M. Sedimentology and ichnology of the Lower Triassic Montney Formation in the Pedigree-Ring/Border-Kahntah River area, northwestern Alberta and northeastern British Columbia. Bull. Can. Pet. Geol. 2010, 58, 115–140. [Google Scholar] [CrossRef]
  32. Woods, A.D.; Bottjer, D.J.; Corsetti, F.A. Calcium carbonate seafloor precipitates from the outer shelf to slope facies of the Lower Triassic (Smithian-Spathian) Union Wash Formation, California, USA: Sedimentology and palaeobiologic significance. Palaeogeogr. Palaeoclim. Palaeoecol. 2007, 252, 281–290. [Google Scholar] [CrossRef]
  33. Zonneveld, J.-P.; Gingras, M.K.; Beatty, T.W. Diverse ichnofossil assemblages following the p-t mass extinction, lower triassic, alberta and british columbia, canada: Evidence for shallow marine refugia on the northwestern coast of pangaea. Palaios 2010, 25, 368–392. [Google Scholar] [CrossRef]
  34. Moslow, T.F.; Davies, G.R. Turbidite reservoir facies in the Lower Triassic Montney Formation, west-central Alberta. Bull. Can. Pet. Geol. 1997, 45, 507–536. [Google Scholar]
  35. Moslow, T.F. Reservoir architecture of a fine-grained turbidite system: Lower Triassic Montney Formation, Western Canada Sedimentary Basin. In Deep-Water Reservoirs of the World; Weimer, P., Slatt, R.M., Coleman, J., Rosen, N.C., Nelson, H., Bouma, A.H., Styzen, M.J., Lawrence, D.T., Eds.; Gulf Coast SEPM: Houston, TX, USA, 2000. [Google Scholar]
  36. Utting, J.; Zonneveld, J.; Macnaughton, R.; Fallas, K. Palynostratigraphy, lithostratigraphy and thermal maturity of the Lower Triassic Toad and Grayling, and Montney formations of western Canada, and comparisons with coeval rocks of the Sverdrup Basin, Nunavut. Bull. Can. Pet. Geol. 2005, 53, 5–24. [Google Scholar] [CrossRef]
  37. Zonneveld, J.-P.; Moslow, T.F. Palaeogeographic setting, lithostratigraphy, and sedimentary framework of the Lower Triassic Montney Formation of western Alberta and northeastern British Columbia. Bull. Can. Pet. Geol. 2018, 66, 93–127. [Google Scholar]
  38. Espitalie, J.; Laporte, J.; Madec, M.; Marquis, F.; Leplat, P.; Paulet, J.; Boutefeu, A. Méthode rapide de caractérisation des roches mètres, de leur potentiel pétrolier et de leur degré d’évolution. Rev. Inst. Franc. Pétrole 1977, 32, 23–42. [Google Scholar] [CrossRef]
  39. Behar, F.; Beaumont, V.; Penteado, H.L.D.B. Rock-Eval 6 Technology: Performances and Developments. Oil Gas Sci. Technol. Rev. IFP 2001, 56, 111–134. [Google Scholar] [CrossRef]
  40. Barker, C. Pyrolysis techniques for source-rock evaluation. AAPG Bull. 1974, 58, 2349–2361. [Google Scholar]
  41. Peters, K.E. Guidelines for Evaluating Petroleum Source Rock Using Programmed Pyrolysis. AAPG Bull. 1986, 70, 318–329. [Google Scholar]
  42. Peters, K.E.; Cassa, M.R. Applied Source Rock Geochemistry: Chapter 5: Part II. Essential Elements; Datapages Inc.: Tulsa, UK, USA, 1994; pp. 93–120. [Google Scholar]
  43. Al-Areeq, N.M.; Al-Badani, M.A.; Salman, A.H.; Albaroot, M.A. Petroleum source rocks characterization and hydrocarbon generation of the Upper Jurassic succession in Jabal Ayban field, Sabatayn Basin, Yemen. Egypt. J. Pet. 2018, 27, 835–851. [Google Scholar] [CrossRef]
  44. Landau, S. A Handbook of Statistical Analyses Using SPSS; CRC: Boca Raton, FL, USA, 2004. [Google Scholar]
  45. Jolliffe, I.T.; Cadima, J. Principal component analysis: A review and recent developments. Philos. Trans. R. Soc. A Math. Phys. Eng. Sci. 2016, 374, 20150202. [Google Scholar] [CrossRef]
  46. Rokach, L.; Maimon, O. Clustering Methods. In Data Mining and Knowledge Discovery Handbook; Springer: Berlin/Heidelberg, Germany, 2005; pp. 321–352. [Google Scholar]
  47. Garson, D. Correspondence Analysis, from Statnotes: Topics in Multivariate Analysis. 2008. Available online: http://faculty.chass.ncsu.edu/garson/pa765 (accessed on 2 August 2011).
  48. Şchiopu, D. Applying TwoStep cluster analysis for identifying bank customers’ profile. Buletinul 2010, 62, 66–75. [Google Scholar]
  49. Zhang, T.; Ramakrishnan, R.; Livny, M. BIRCH: An efficient data clustering method for very large databases. ACM Sigmod Rec. 1996, 25, 103–114. [Google Scholar] [CrossRef]
  50. Tissot, B.; Welte, D. Petroleum Formation and Occurrence, 2nd ed.; Springer: Berlin/Heidelberg, Germany, 1984; 699p. [Google Scholar]
  51. Langford, F.; Blanc-Valleron, M.-M. Interpreting Rock-Eval pyrolysis data using graphs of pyrolizable hydrocarbons vs. total organic carbon. AAPG Bull. 1990, 74, 799–804. [Google Scholar]
  52. Espitalie, J.; Deroo, G.; Marquis, F. Rock-Eval pyrolysis and its applications. Rev. Inst. Franc. Pétrole 1985, 40, 563–579. [Google Scholar]
Figure 1. Ideal stratigraphic sequence of the Montney Formation modified from [37].
Applsci 12 00267 g001
Figure 2. Map showing the location of the studied wells, Montney Formation, NE BC.
Applsci 12 00267 g002
Figure 3. Cross plots of TOC and both S2 and S1 for the analyzed samples. (A) Displaying the organic richness. (B) The organic matter quality.
Applsci 12 00267 g003
Figure 4. (A) pseudo van Krevelen plot illustrating the kerogen type. (B) Cross plot of TOC vs. GP demonistrating the generating potential of the tested samples.
Applsci 12 00267 g004
Figure 5. Thermal maturation of Montney Formation source rock, BC area, Canada. (A) Tmax vs. HI cross plot showing the maturation level and kerogen type. (B) Tmax vs. PI showing the hydrocarbon yield.
Applsci 12 00267 g005
Figure 6. Graphical modeling of Spearman correlation coefficient for the studied samples of Montney Formation.
Applsci 12 00267 g006
Figure 7. Dendrogram based on hierarchical cluster analysis and average linkage (between groups).
Applsci 12 00267 g007
Figure 8. The TwoStep clustering model details the main five pyrolysis components showing the number and quality of clusters.
Applsci 12 00267 g008
Figure 9. The two clusters resulting from the application of the TwoStep clustering technique.
Applsci 12 00267 g009
Figure 10. Predictor importance according to the TwoStep clustering technique.
Applsci 12 00267 g010
Table 1. SRA data set shows the different pyrolysis parameters for 58 core samples from 4 Montney Formation wells.
Well
Location
Well,
No.
Depth (m)TOC (wt.%)S1
mg HC/g rock
S2
mg HC/g rock
S3
mg CO2/g rock
Tmax (°C)HI
mg HC/g TOC
OI
mg CO2/
g TOC
PIGP
(S1 + S2)
A01-17-080-18305122386.051.40.630.560.345339.9121.380.531.19
2396.050.650.320.230.3344735.3850.770.580.55
2406.281.450.540.60.5245841.4135.890.471.14
2416.441.840.860.990.3847353.7820.640.461.85
2426.552.471.111.380.2948655.8511.740.452.49
2436.751.790.960.90.3347650.3618.470.521.86
2446.921.470.80.790.3147353.8521.130.51.59
2456.192.061.141.020.2748249.4413.090.532.16
2466.251.190.780.510.3546542.7929.360.61.29
2476.551.560.730.610.3446039.1521.820.541.34
2486.850.50.490.330.3845067.4877.710.60.82
2496.91.711.160.90.346452.7917.60.562.06
2506.11.30.960.590.2645545.4520.030.621.55
2516.351.550.750.450.345028.9919.330.631.2
2526.610.930.480.290.3544631.1237.550.620.77
2536.21.420.710.430.2745030.319.030.621.14
2546.711.230.650.390.3544731.7128.460.631.04
2556.621.190.490.30.2945025.1324.290.620.79
2566.21.370.590.390.3245428.5123.390.60.98
2576.151.470.450.330.2446022.4316.320.580.78
2586.341.810.640.450.3746124.920.480.591.09
2592.351.850.360.240.2746013.0114.630.60.6
B-093-I/094-B-09277511851.082.273.481.130.647649.826.440.754.61
1860.12.864.981.660.4947857.9617.110.756.64
1869.091.894.051.250.3947066.1720.650.765.3
1878.341.241.850.660.6145153.3149.270.742.51
1889.011.271.790.60.6244847.1748.740.752.39
1898.081.643.390.90.5645754.8434.130.794.29
1908.060.871.520.460.5544353.0663.440.771.98
1918.131.652.640.690.6745141.8440.630.793.33
1933.041.642.250.580.4644435.2827.980.82.83
1943.111.852.080.680.644536.6832.360.752.76
1953.111.151.430.460.543639.9343.40.761.89
19631.311.520.560.6444142.6848.780.732.08
1973.10.982.010.510.5644751.9357.030.82.52
1983.11.432.680.670.5544547.0238.60.83.35
1998.181.82.690.790.5645644.0131.20.773.48
2003.081.462.20.690.646047.3941.210.762.89
b-65-J/94-B-162404720231.230.340.240.6549019.5352.890.590.58
2029.80.870.290.10.3249111.5536.950.740.39
2035.31.210.370.240.549019.7741.190.610.61
2039.31.130.290.170.4449015.0739.010.630.46
2046.31.060.440.080.324907.5830.30.850.52
2049.551.140.30.170.2448914.8921.020.640.47
21022.020.330.250.2950412.3614.340.570.58
2107.60.960.150.140.4452314.6646.070.520.29
21131.360.170.10.265007.3419.080.630.27
2118.51.10.150.10.695269.0762.610.60.25
2125.051.790.540.490.2850327.3715.640.521.03
01-25-079-14W6M253331890.321.260.470.50.9143139.6872.220.480.97
1904.40.780.530.350.5343244.8767.950.60.88
1914.491.460.910.890.4243360.9628.770.511.8
2187.520.980.560.320.5543732.6556.120.640.88
2188.811.651.140.660.484434029.090.631.8
2196.640.780.740.280.5142535.965.380.731.02
2203.330.750.570.270.314223641.330.680.84
2664.192.110.320.310.6244814.6929.380.510.63
2684.761.660.280.260.8245015.6649.40.520.54
Table 2. Spearman’s correlation coefficient (ρ) between pyrolysis parameters for the studied Montney Formation samples.
TOCS1S2S3TmaxHIOIPIGP
TOC1.000
S10.407 **1.000
S20.625 **0.864 **1.000
S3−0.0610.269 *0.1481.000
Tmax0.271 *−0.296 *−0.113−0.327 *1.000
HI0.2150.781 **0.849 **0.196−0.273 *1.000
OI−0.694 **−0.103−0.311 *0.731 **−0.464 **0.0201.000
PI−0.2000.478 **0.0190.293 *−0.2140.0660.284 *1.000
GP0.489 **0.986 **0.917 **0.281 *−0.2560.805 **−0.1400.370 **1.000
** Correlation is significant at the 0.01 level (2-tailed). * Correlation is significant at the 0.05 level (2-tailed).
Table 3. PCA of the pyrolysis parameters for the studied samples of Montney Formation showing the extraction of three components.
Rotated Component Matrix a
Factor 1Factor 2Factor 3
S20.902
TOC0.873
S10.733
OI−0.666
PI 0.853
S3 0.689
Tmax −0.795
HI 0.790
Extraction Method: Principal Component Analysis. Rotation Method: Varimax with Kaiser Normalization. a Rotation converged in 6 iterations.
Publisher’s Note: MDPI stays neutral with regard to jurisdictional claims in published maps and institutional affiliations.

