Review

Silicon 3D Microdosimeters for Advanced Quality Assurance in Particle Therapy

by
Linh T. Tran
1,*,
David Bolst
1,
Benjamin James
1,
Vladimir Pan
1,
James Vohradsky
1,
Stefania Peracchi
1,2,
Lachlan Chartier
2,
Emily Debrot
1,
Susana Guatelli
1,
Marco Petasecca
1,
Michael Lerch
1,
Dale Prokopovich
1,3,
Željko Pastuović
2,
Marco Povoli
4,
Angela Kok
4,
Taku Inaniwa
5,
Sung Hyun Lee
5,
Naruhiro Matsufuji
5 and
Anatoly B. Rosenfeld
1,*
1
Centre for Medical Radiation Physics, University of Wollongong, Wollongong 2500, Australia
2
Australian Nuclear Science and Technology Organization, Lucas Heights 2234, Australia
3
EBG MedAustron, Marie Curie-St. 5, 2700 Wiener Neustadt, Austria
4
SINTEF, 0314 Oslo, Norway
5
National Institutes for Quantum Science and Technology, Chiba 263-0024, Japan
*
Authors to whom correspondence should be addressed.
Appl. Sci. 2022, 12(1), 328; https://doi.org/10.3390/app12010328
Submission received: 22 November 2021 / Revised: 27 December 2021 / Accepted: 28 December 2021 / Published: 30 December 2021
(This article belongs to the Special Issue Detectors for Medical Physics)

Abstract

:
The Centre for Medical Radiation Physics introduced the concept of Silicon On Insulator (SOI) microdosimeters with 3-Dimensional (3D) cylindrical sensitive volumes (SVs) mimicking the dimensions of cells in an array. Several designs of high-definition 3D SVs fabricated using 3D MEMS technology were implemented. 3D SVs were fabricated in different sizes and configurations with diameters between 18 and 30 µm, thicknesses of 2–50 µm and at a pitch of 50 µm in matrices with volumes of 20 × 20 and 50 × 50. SVs were segmented into sub-arrays to reduce capacitance and avoid pile up in high-dose rate pencil beam scanning applications. Detailed TCAD simulations and charge collection studies in individual SVs have been performed. The microdosimetry probe (MicroPlus) is composed of the silicon microdosimeter and low-noise front–end readout electronics housed in a PMMA waterproof sheath that allows measurements of lineal energies as low as 0.4 keV/µm in water or PMMA. Microdosimetric quantities measured with SOI microdosimeters and the MicroPlus probe were used to evaluate the relative biological effectiveness (RBE) of heavy ions and protons delivered by pencil-beam scanning and passive scattering systems in different particle therapy centres. The 3D detectors and MicroPlus probe developed for microdosimetry have the potential to provide confidence in the delivery of RBE optimized particle therapy when introduced into routine clinical practice.

1. Introduction

In contrast to conventional X-ray therapy, particle therapy delivered with protons and heavy ion beams allows extremely conformal dose painting and an improved therapeutic ratio due to the Bragg peak phenomena. The dose prescription process in proton and heavy ion therapy includes a radiobiological concept called the relative biological effectiveness (RBE). RBE is the ratio of the absorbed doses that produce the same biological effect between a proton or ion irradiation and a reference radiation. RBE depends on linear energy transfer (LET), dose and biological endpoint as well as the intrinsic radiosensitivity of the tissue [1]. Currently, an RBE value of 1.1 is used worldwide in proton therapy as it was anticipated, from short-term clinical outcome data, that variation in proton RBE with tissue type, LET, dose per fraction and study endpoints would be small [2]. Despite this, a large amount of data is available [3] showing large variation and considerable uncertainties in proton RBE values. Protons exhibit a stronger biological effect on healthy tissues surrounding the treated region compared to photon therapy. The RBE-weighted dose (RBED) concept was first introduced for protons and heavy ions, for which the RBE varies significantly throughout the treatment volume. RBED planning requires RBE verification along with traditional absorbed dose quality assurance to guarantee accurate treatment. While the absorbed dose is routinely measured with an ionisation chamber, microdosimetric quantities, such as the dose-averaged lineal energy ( y D ¯ ) or dose-averaged lineal energy transfer (LETd), need to be measured with high spatial resolution for RBE prediction. The current gold standard detector for microdosimetry is the tissue equivalent proportional counter (TEPC); however, conventional TEPCs are not ideal for routine clinical microdosimetry due to pile up in high-dose rate clinical therapeutic beams. A new mini-TEPC with a smaller sensitive volume was developed at Legnaro National Laboratory to overcome this issue and it was successfully tested using the CATANA 62 MeV proton beam [4]. Nevertheless, both types of TEPCs still require high voltage operation and gas supply that could limit routine application in the clinical setting.
The Centre for Medical Radiation Physics (CMRP) introduced the concept of SOI microdosimeters that are based on micron-sized cylindrical sensitive volumes (SV) in an array. These microdosimeters mimic the dimensions of cell nuclei and are fabricated with both planar and Micro-Electro-Mechanical Systems (MEMS) 3D detector technology at SINTEF MiNaLab, Norway. The microdosimeter requires less than 10 V bias supply. The thickness of the SOI microdosimeter active region is 2, 5 or 10 µm depending on the application such as proton, heavy ion or boron neutron capture therapy (BNCT). Previous generations of CMRP SOI microdosimeters were fabricated using planar technology. Through this technology, a p-n junction is formed by implementing an oxide-passivated surface and using the ion implantation process to create doping impurities at the surface of a silicon detector. Planar technology microdosimeters were developed and successfully tested [5] but had limited 3D SV definition due to the silicon not being able to be patterned any more than 1–2 µm under the surface of the 10 μm thick active SOI layer, leading to lateral diffusion of the charge outside the SV [6,7,8,9,10,11]. In order to overcome these drawbacks in planar technology, 3D detector technology has been used to fabricate 3D SOI microdosimeters presented in this review (often referred to as the “Mushroom” microdosimeter). The 3D detector concept was first proposed by S. Parker in 1995 [12], and the fabrication of 3D detectors was made possible by the advanced developments in MEMS technology [13]. Contrary to a conventional planar detector where n+ and p+ electrodes are on the surface of the detector, the 3D detector n+ and p+ columns penetrate through the entire silicon substrate. 3D detector technology allows well-defined 3D SV microdosimeters to be produced using a deep reactive ion etching (DRIE) process. This process utilizes a sequence of alternate etching and passivation, creating the high aspect ratio sidewall of the SV cylindrical shape, followed by gas doping of p+ or n+ on this wall.
This paper reviews various designs of 3D SOI Mushroom microdosimeters and their application in particle therapy for RBE and cell survival prediction.

2. Principles of Microdosimetry and Its Application for RBE Prediction

The microdosimetry concept is related to stochastic deposition of ionizing energy by ions moving in matter. The microdosimetric quantity of interest is lineal energy. Lineal energy describes the stochastic energy deposition by a single event in a micron-size SV along a particle’s track, given by:
y = E l
where E is the energy deposited in an SV from a single event with a mean chord length <l> and its distribution f(y) for all primary and secondary charged particles. The microdosimetric kinetic model (MKM) developed by Hawkins [14,15] can predict RBE in proton and heavy ion radiation fields. A modified MKM proposed by Kase et al. introduced saturation correction to account for the reduction of RBE from overkill effects for events with a very high lineal energy y. The modified MKM was shown to predict the survival fraction of human salivary gland (HSG) cells using the microdosimetric quantities measured with a TEPC [16] for different heavy ion beams from protons to silicon ions. Following the successful results from the modified MKM, several more detailed studies were carried out to estimate the biological effects of carbon ion irradiation using the MKM [17,18]. RBE calculations based on the MKM are advantageous over other empirical models in that experimentally measured microdosimetric distributions of lineal energies, f(y), are used.
If a microdosimetric measurement is performed in a non-tissue equivalent material, such as an SOI or diamond microdosimeter, the recorded spectra must be converted so that they represent a tissue equivalent (TE) material (water or tissue). A number of methods exist to convert from a non-TE to a TE material; however a simple and commonly used method is to apply a single conversion factor that scales the energy deposition. An example conversion factor is 0.58, which converts the microdosimetric measurements made in a proton beam using silicon to striated muscle [19].
In the modified MKM, the survival fraction, S, of certain cells is calculated with the biological model parameters ( α o ,   β ,   r d and y 0 ) and is given by:
S = e x p   [ α D β D 2 ]
α = α o + β ρ π r d 2   y *
where   α 0 is a constant that represents the initial slope of the survival fraction curve in the limit of zero LET, β is a constant independent of LET, ρ is the density of tissue, r d is the radius of a sub-cellular domain in the MK model and y* is the restricted dose-mean lineal energy that accounts for cell overkill for y   > 150 keV/µm and is calculated from Equation (4) where yo = 150 keV/µm. These MKM model parameters are cell line dependent. For example, the parameters for Human Salivary Gland (HSG) cells are: α 0 = 0.13   Gy 1 , β = 0.05   Gy 2 , ρ = 1   g / cm 3 , r d = 0.42   μ m .
y * = y o 2 0 ( 1 e x p ( y 2 / y o 2 ) ) f ( y ) d y 0 y f ( y ) d y
The RBE of the HSG cells is then calculated from:
R B E 10 = D 10 , R D 10 = 2 β D 10 , R α 2 4 β l n ( 0.1 ) α
where D10 is the 10% survival dose of in-vitro cells for the radiation of interest, and D10,R is the 10% survival dose obtained from the empirical survival curve of HSG cells irradiated by 200 kVp X-rays, which is the reference radiation (D10,R = 5.0 Gy for HSG cells).
Due to cells having a greater dependence on the dose delivered from protons compared to heavier ions, a dose-dependent form is used for RBE estimations calculated with the MKM. The proton dose-dependent RBE, RBED, is calculated for particular survival fractions S(Dp) and can be obtained from (2) using the following formula:
R B E D = D X D p = α X 2 + 4 β X ( α p D p + β p D p 2 ) α X 2 β X D p
where αp is a linear function of y as in (3) and Dp and DX are protons and reference X-ray radiation doses required for the same cell survival S, respectively. The 200 kVp X-rays are a reference radiation. For example, for HSG cells, αX = 0.164 Gy−1 and βp = βX = 0.05 Gy−2 [20]. For other cell lines, different values of parameters should be used.

3. Silicon on Insulator (SOI) Detector for Microdosimetry

3.1. Design of SOI Detectors

In this section, we present examples of SOI detectors developed for microdosimetry of mixed radiation fields.

3.1.1. The 2-µm-Thick Mushroom Microdosimeter Fabricated by Planar Technology

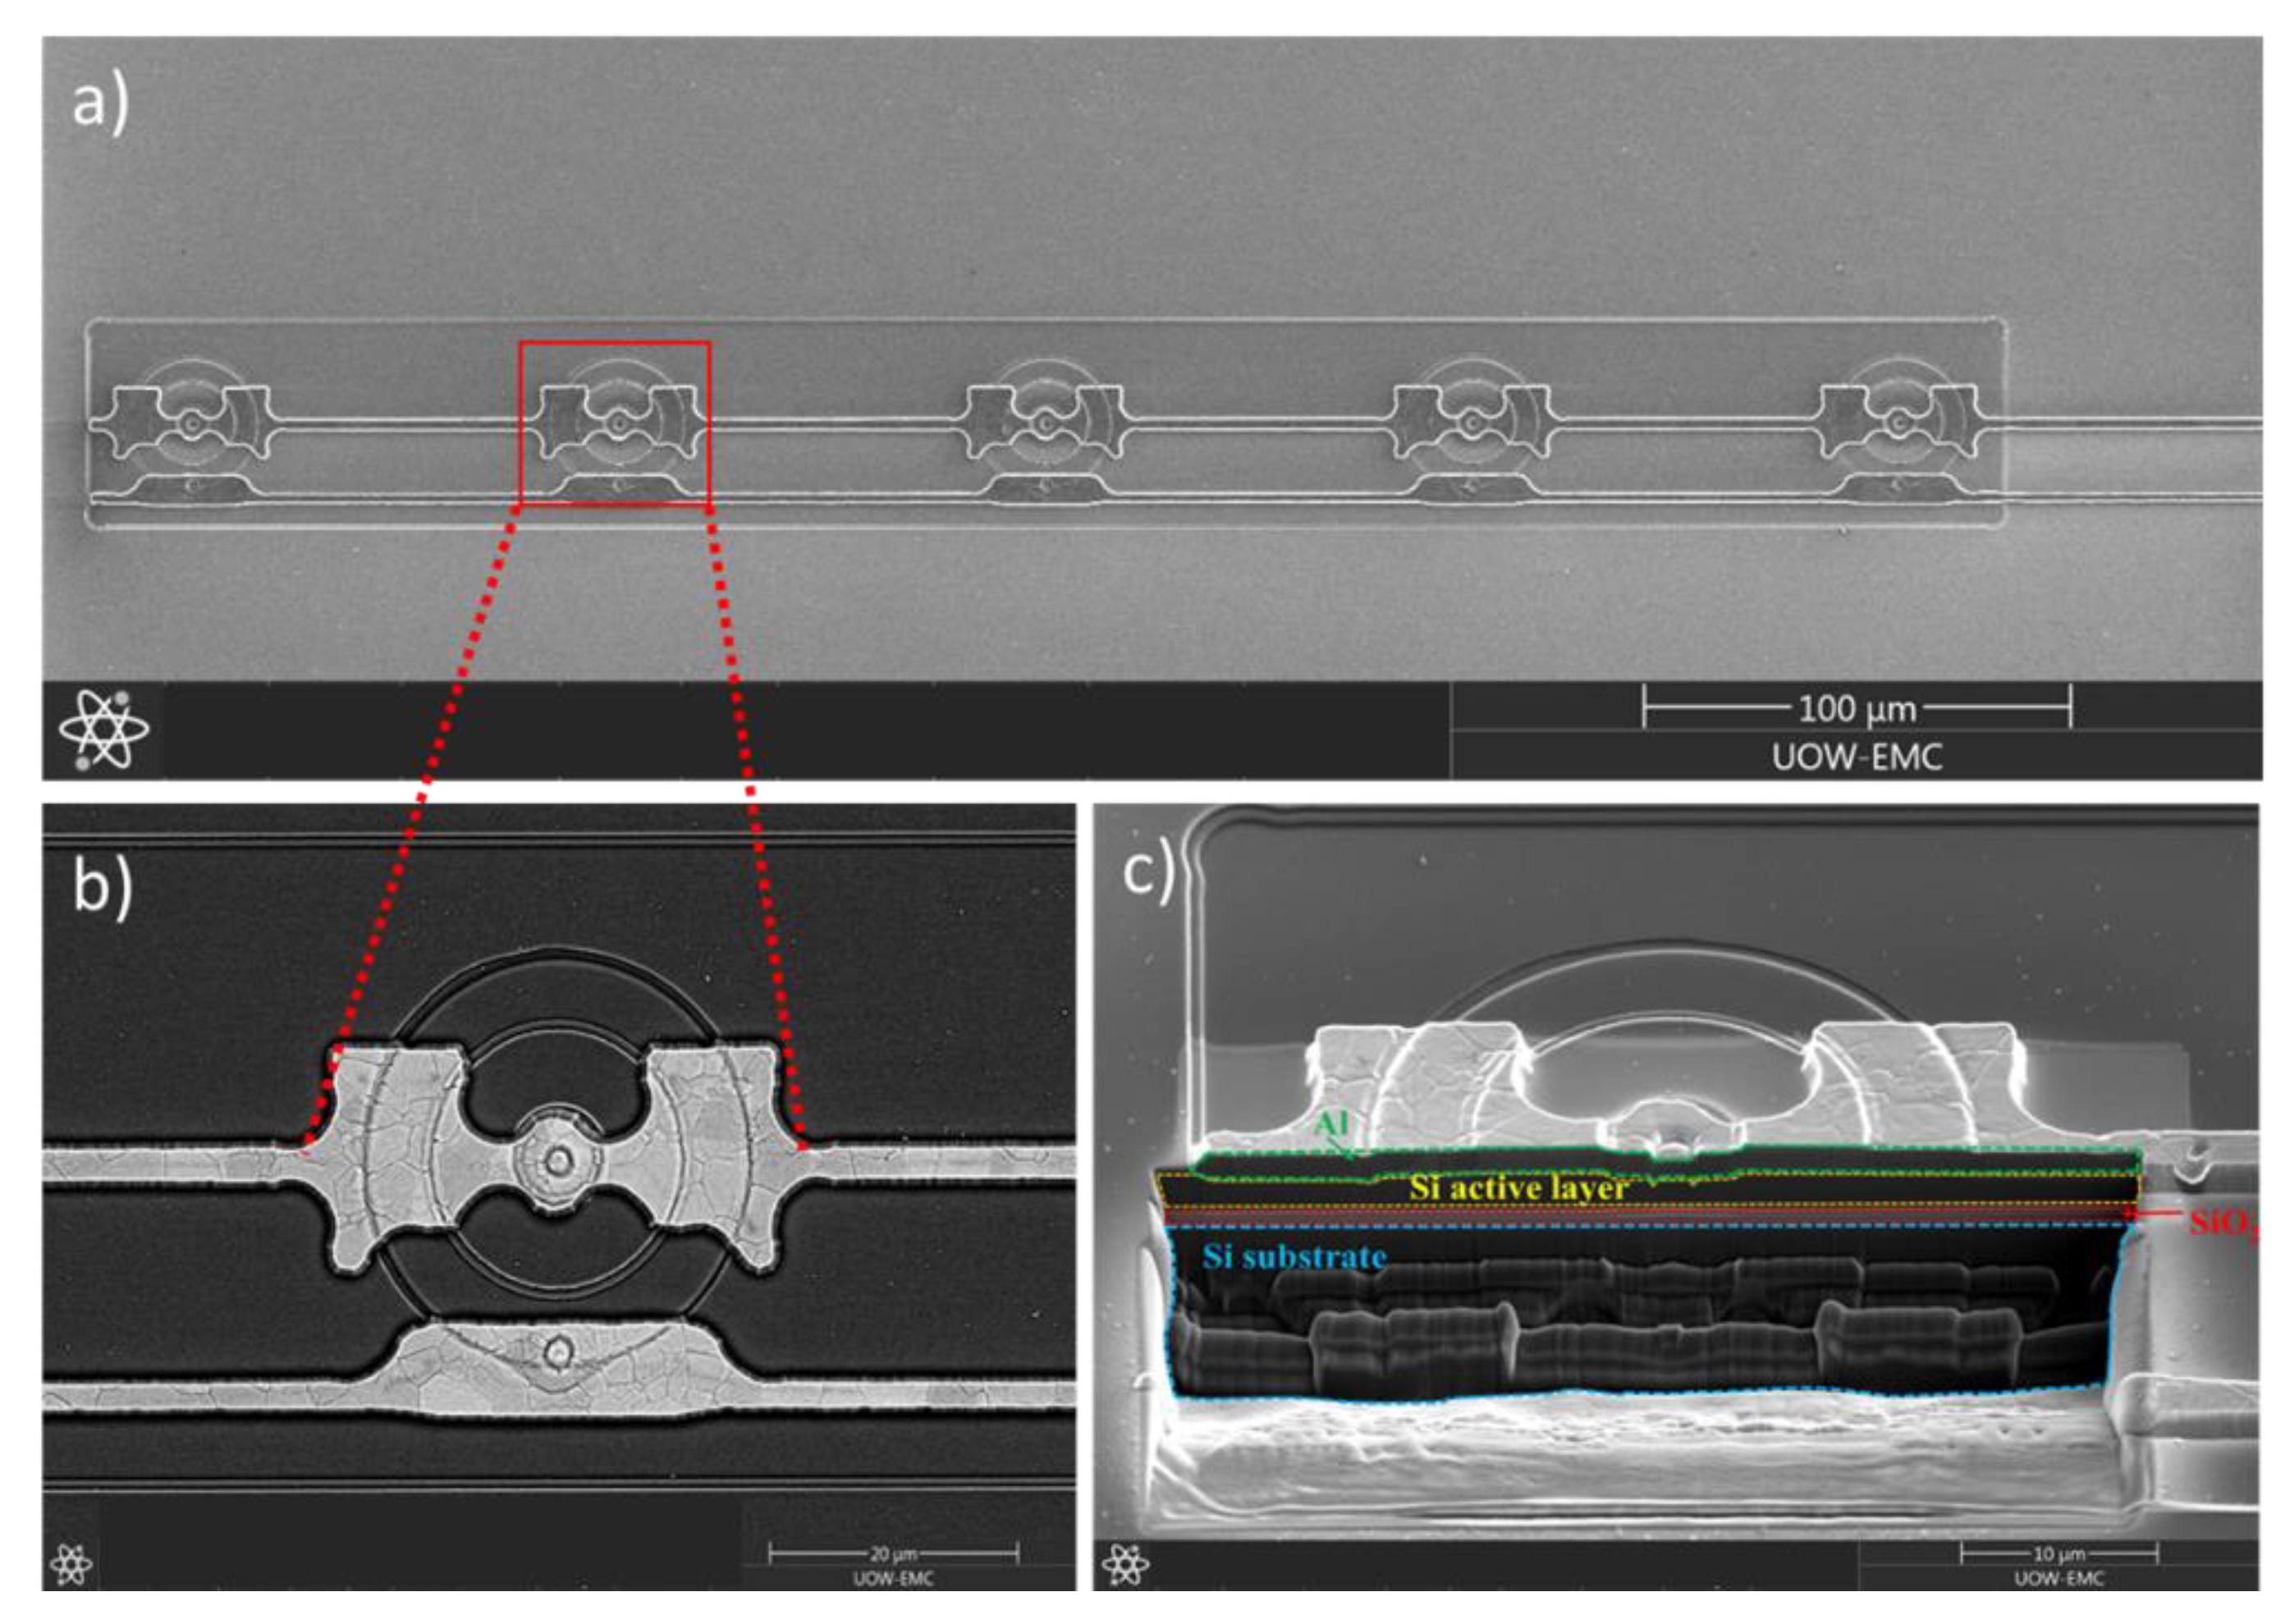
Due to its thin active layer, the 2-µm-thick Mushroom microdosimeter was fabricated using planar technology. The 2-µm-Mushroom-planar (Mushroom-p) microdosimeter consists of well-defined cylindrical SVs with a height of 2 µm and a diameter of 20 µm. Figure 1 shows the planar design of the microdosimeter with n+ phosphorus doping in the core region and p+ boron doping in the circular (ring) region of the SV. The n+ core and p+ outer ring electrodes were created using phosphorus and boron ion implantation, respectively, followed by a drive-in diffusion to a depth of the 2 µm active layer of the SOI microdosimeter. Outside the SV, an additional p-stop layer was created by boron implantation and diffusion that connects to the p+ outer electrode to avoid the effect of positive charge build-up in the field silicon oxide. This effect generally leads to the creation of inverse channels under the silicon oxide passivation layer. In this microdosimeter design, linear arrays of SVs are connected via aluminium buses (Figure 2a) with various numbers of SVs (1, 5, 10, 20 and 25) in a given array. Figure 2b,c shows the top and cross-sectional views of SEM images of a single SV obtained via a focused ion beam imaging technique. The small thickness of the SV provides more precise microdosimetric spectra of the radiation field by reducing the number of events stopping within the SV (stoppers), especially for high LET, low-energy charged particles. Such particles are important for accurate dosimetry/microdosimetry (e.g., BNCT) as well as for separation of radiation field components in mixed gamma-neutron fields.

3.1.2. Trenched-3D Mushroom Microdosimeter Fabricated by 3D Detector Technology

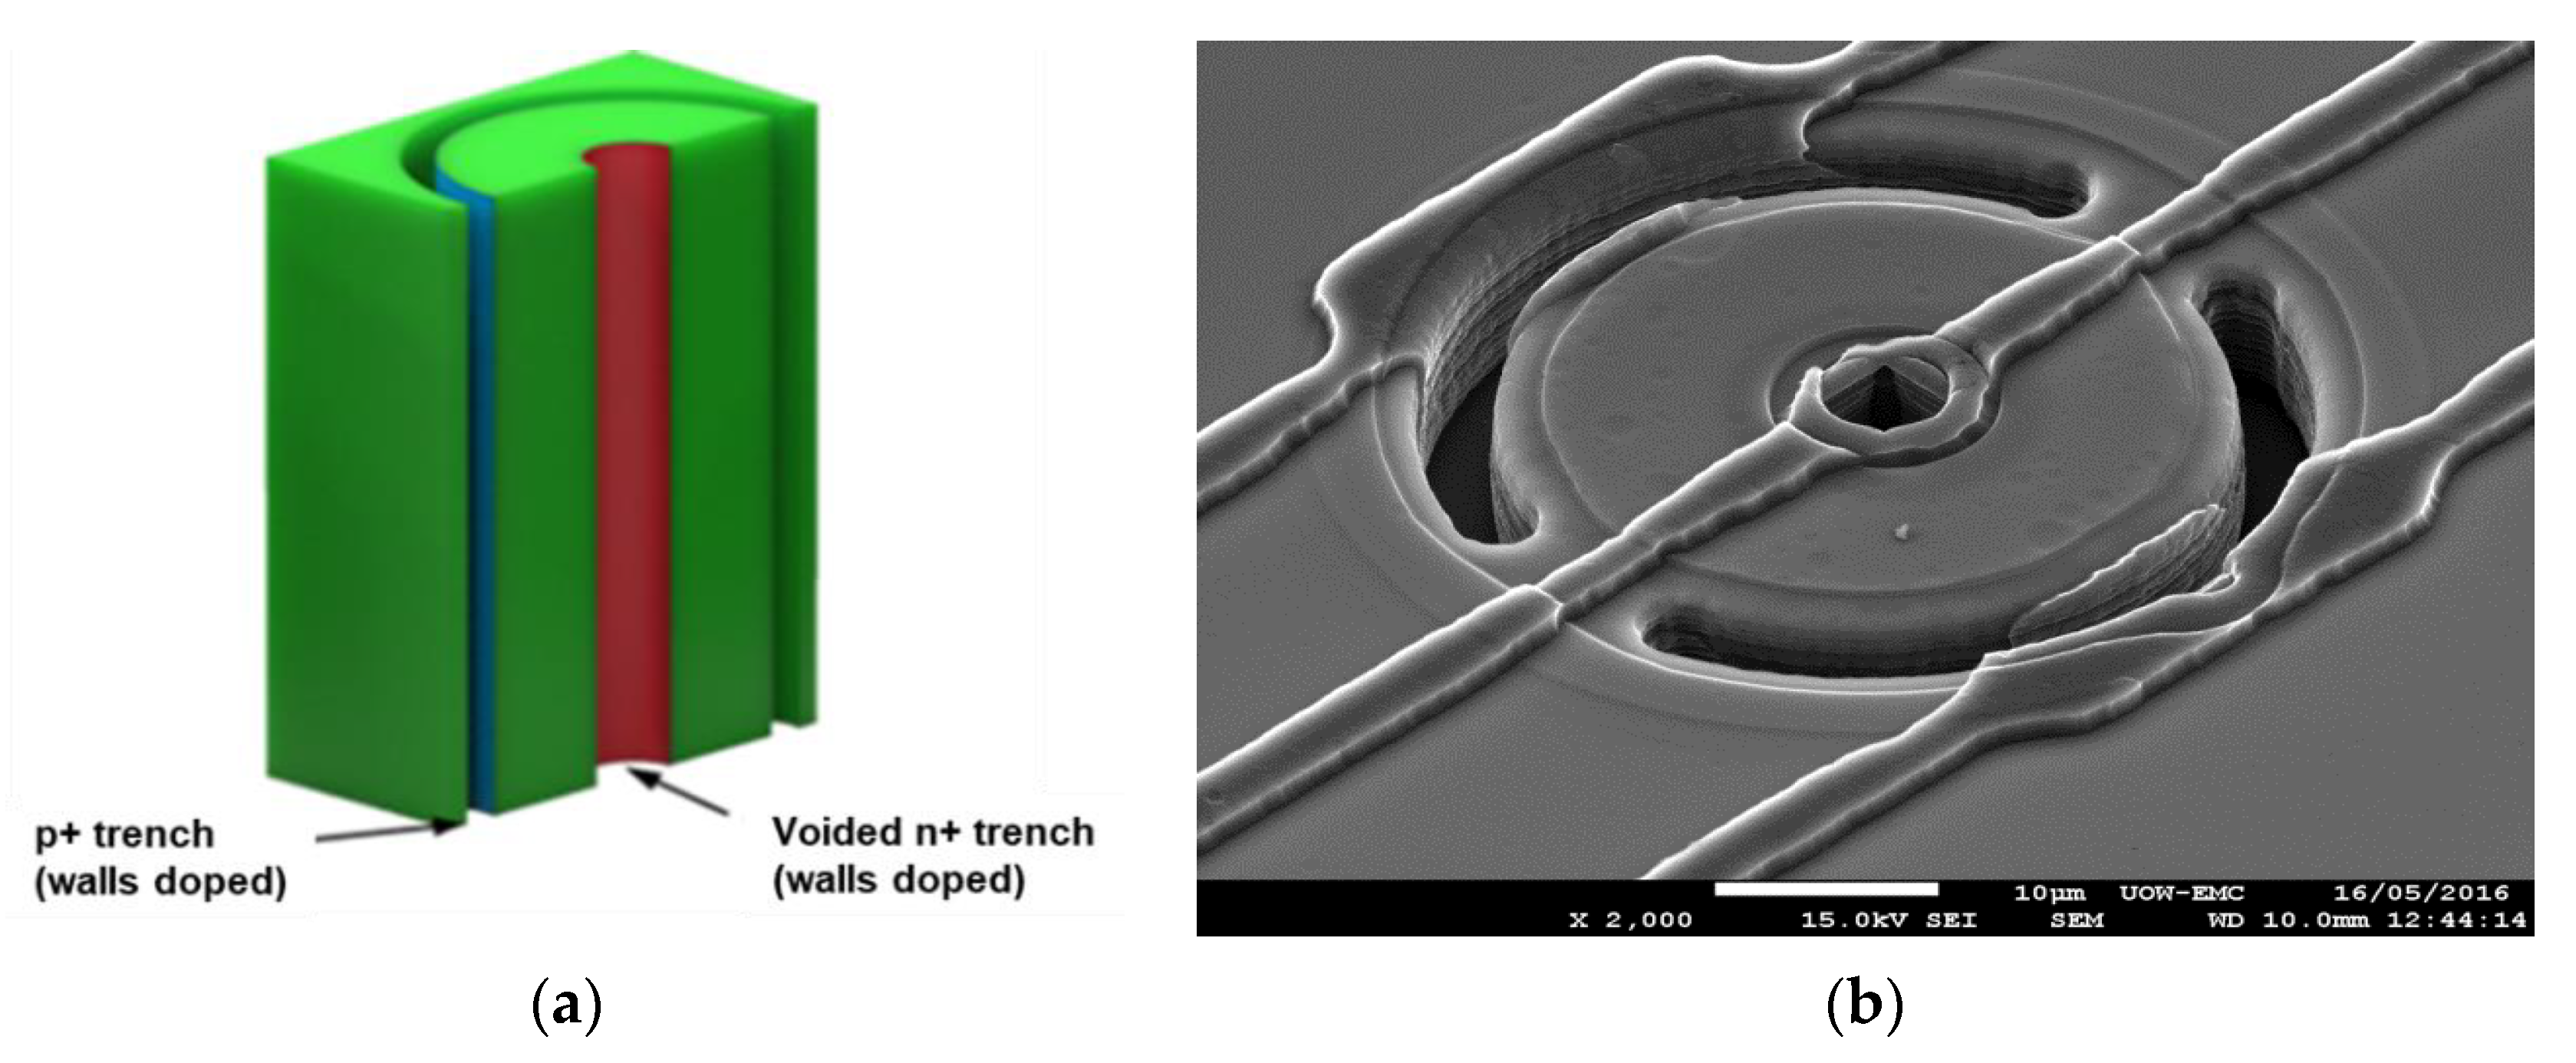
The trenched-3D microdosimeter consists of 3D cylindrical SVs fabricated on a high resistivity p-SOI wafer. In the center of the SV, the inner core column was etched and doped with n+ (Figure 3a). Each SV is 10 µm high, 20 or 30 µm in diameter and is surrounded by a trench with p+ doping. This design was made to eliminate charge collection outside the SV. In this type of microdosimeter structure, the p+ trench and n+ column of the SV are empty (filled with air). In order to connect SVs in an array, some silicon was left after etching the trenches to support the aluminum contact in the inner n+ electrode. Aluminium contact lines connected to the n+ core and p+ outer electrodes of 3D SVs were achieved through a planar doping layer at the surface extending to the outside of the open 3D structures. This planar region is in contact with the doping inside the 3D structures. Figure 3b shows an SEM image of a single SV where the structure of the fabricated microdosimeter is clearly shown.

3.1.3. Trenched-3D Mushroom Microdosimeter with a Planar Core Electrode

The trenched-planar Mushroom microdosimeter consists of 3D SVs with a cylindrical shape and a planar n+ core produced by ion implantation. Each SV is 5 or 10 µm in height and 20, 30 or 50 µm in diameter and is surrounded with a complete p+-doped trench filled with polysilicon (Figure 4a). It can be seen in the SEM image of this device structure (Figure 4b) that the trench is filled with polysilicon. In order to avoid breakage in the metal line connections, the polysilicon regions on the surface of the SVs were etched to make a smooth surface before the deposition of metal contacts. Furthermore, the p-stop layer was connected to the outer p+ trench (NO-GAP configuration) to avoid charge build-up in the oxide layer between the SVs after being irradiated with heavy ions. This fabrication process allows charge collection to be localised to the SV and helps avoid the build-up of charge in the oxide layer, which was observed in the previous version of the trenched planar Mushroom microdosimeter after irradiation with high-intensity ion beams (Figure 3).

3.1.4. Free-Standing 3D Mushroom Microdosimeter Embedded in Tissue Equivalent Material

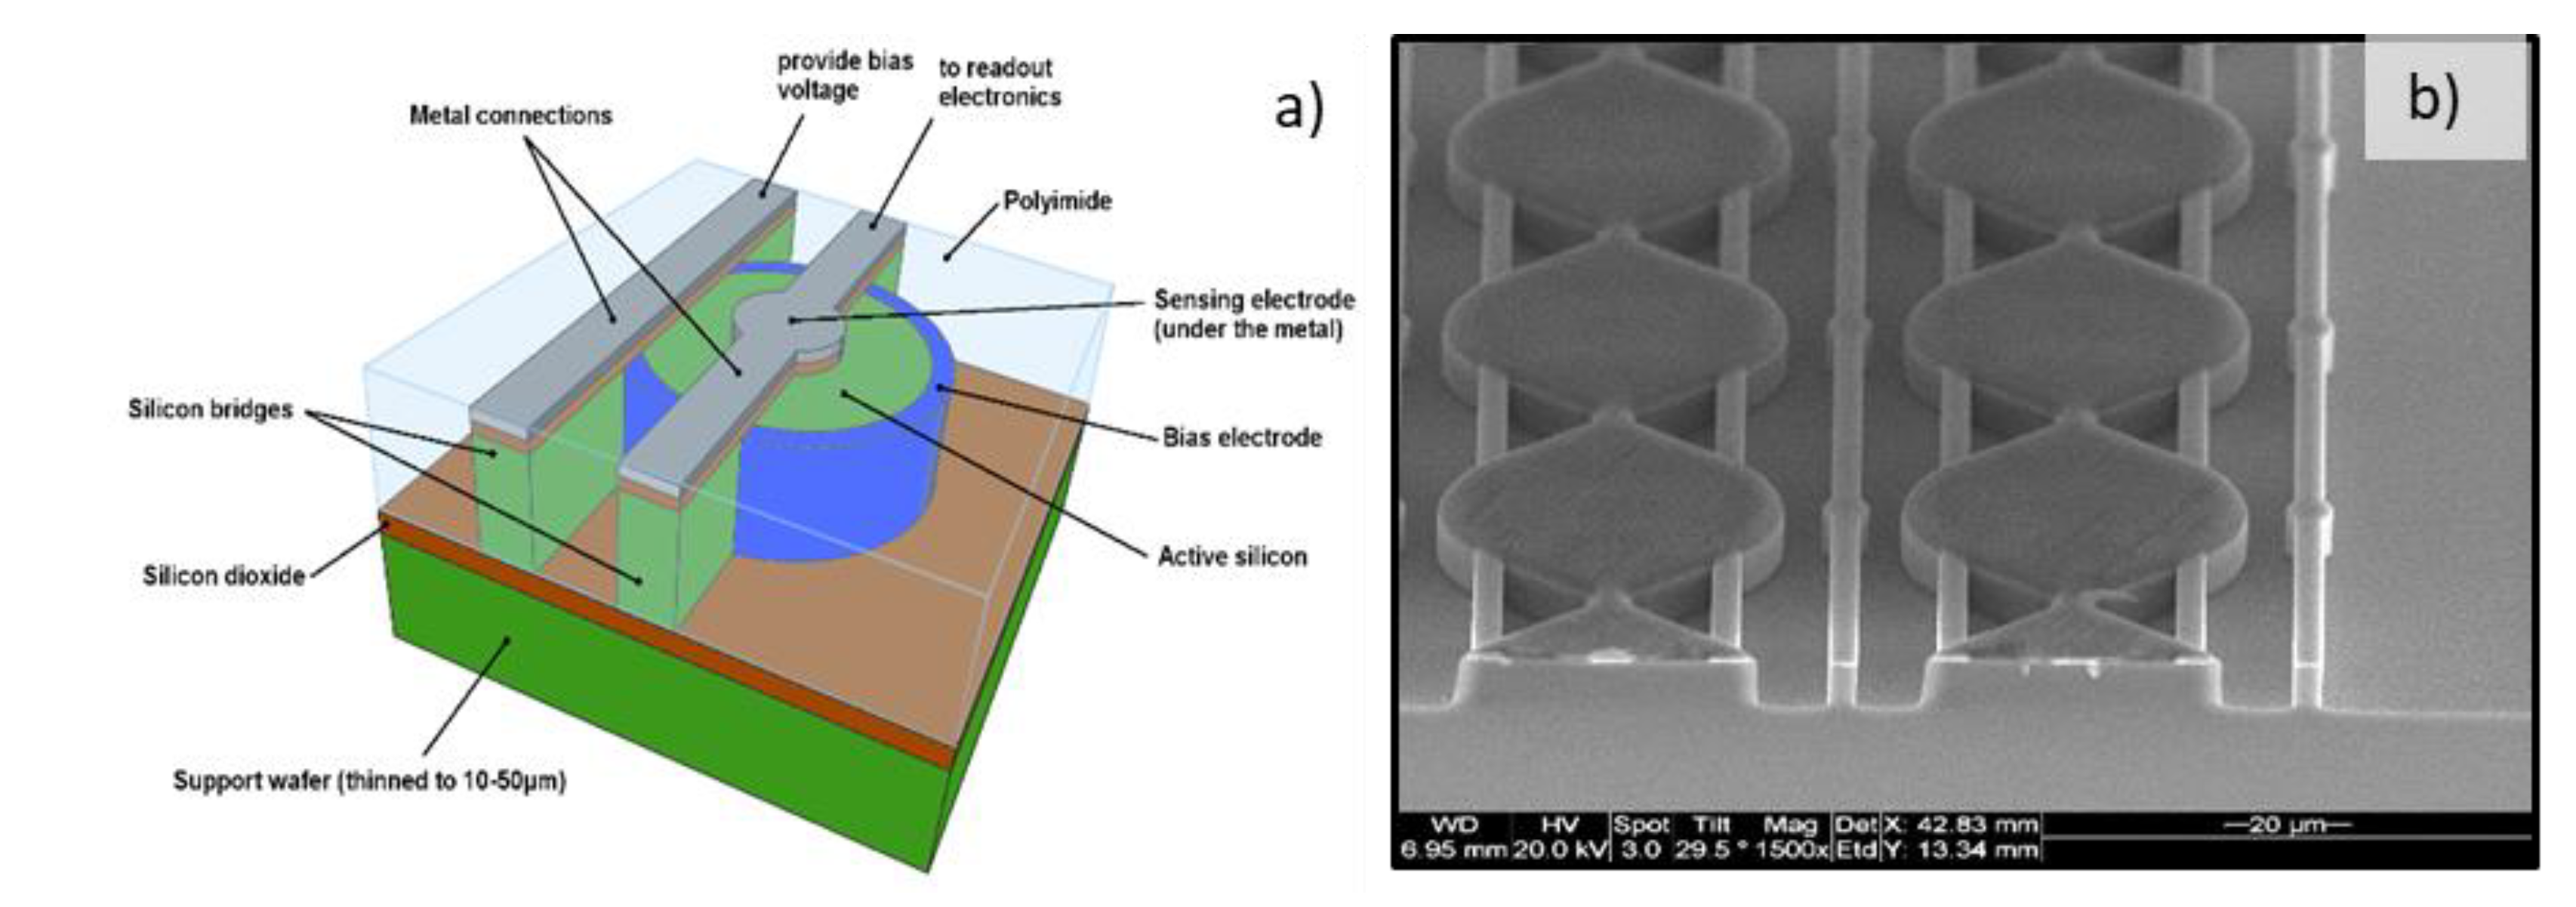
Figure 5a, b show the design and SEM image of a free-standing 3D sensitive volume (SV) array of microdosimetric SVs, later named the 3D Mushroom microdosimeter. The SV has a cylindrical shape with a diameter of 20–50 µm, thickness of 5 or 10 µm and 50 µm pitch between neighbouring SVs. An array of SVs can either be surrounded by air or embedded in polyimide, a tissue equivalent material that extends 12 µm above SVs. There are odd and even arrays in this design that can be connected in parallel or read out individually.
The SOI 3D Mushroom microdosimeter is then inserted into an electronic readout probe built in-house–the MicroPlus (µ+) probe for microdosimetric measurements in proton and heavy ion therapy.

3.2. TCAD Simulations of 3D Mushroom SOI Microdosimeters

Modern numerical simulation tools, such as Technology Computer Aided Design (TCAD), offer considerable support in the design and characterisation of novel radiation detectors. A detailed numerical model of the devices can be created to simulate the operation of the sensors to be fabricated. Typical simulations include Current-Voltage (I–V) curves, Capacitance-Voltage (C-V) curves and transient simulations in response to impinging radiation.
The tools chosen for this TCAD simulation study were the SYNOPSYS TCAD tools. Process and device simulations were carried out at SINTEF. The simulation tools were tuned with the known SINTEF process parameters to obtain models as close as possible to the final devices.
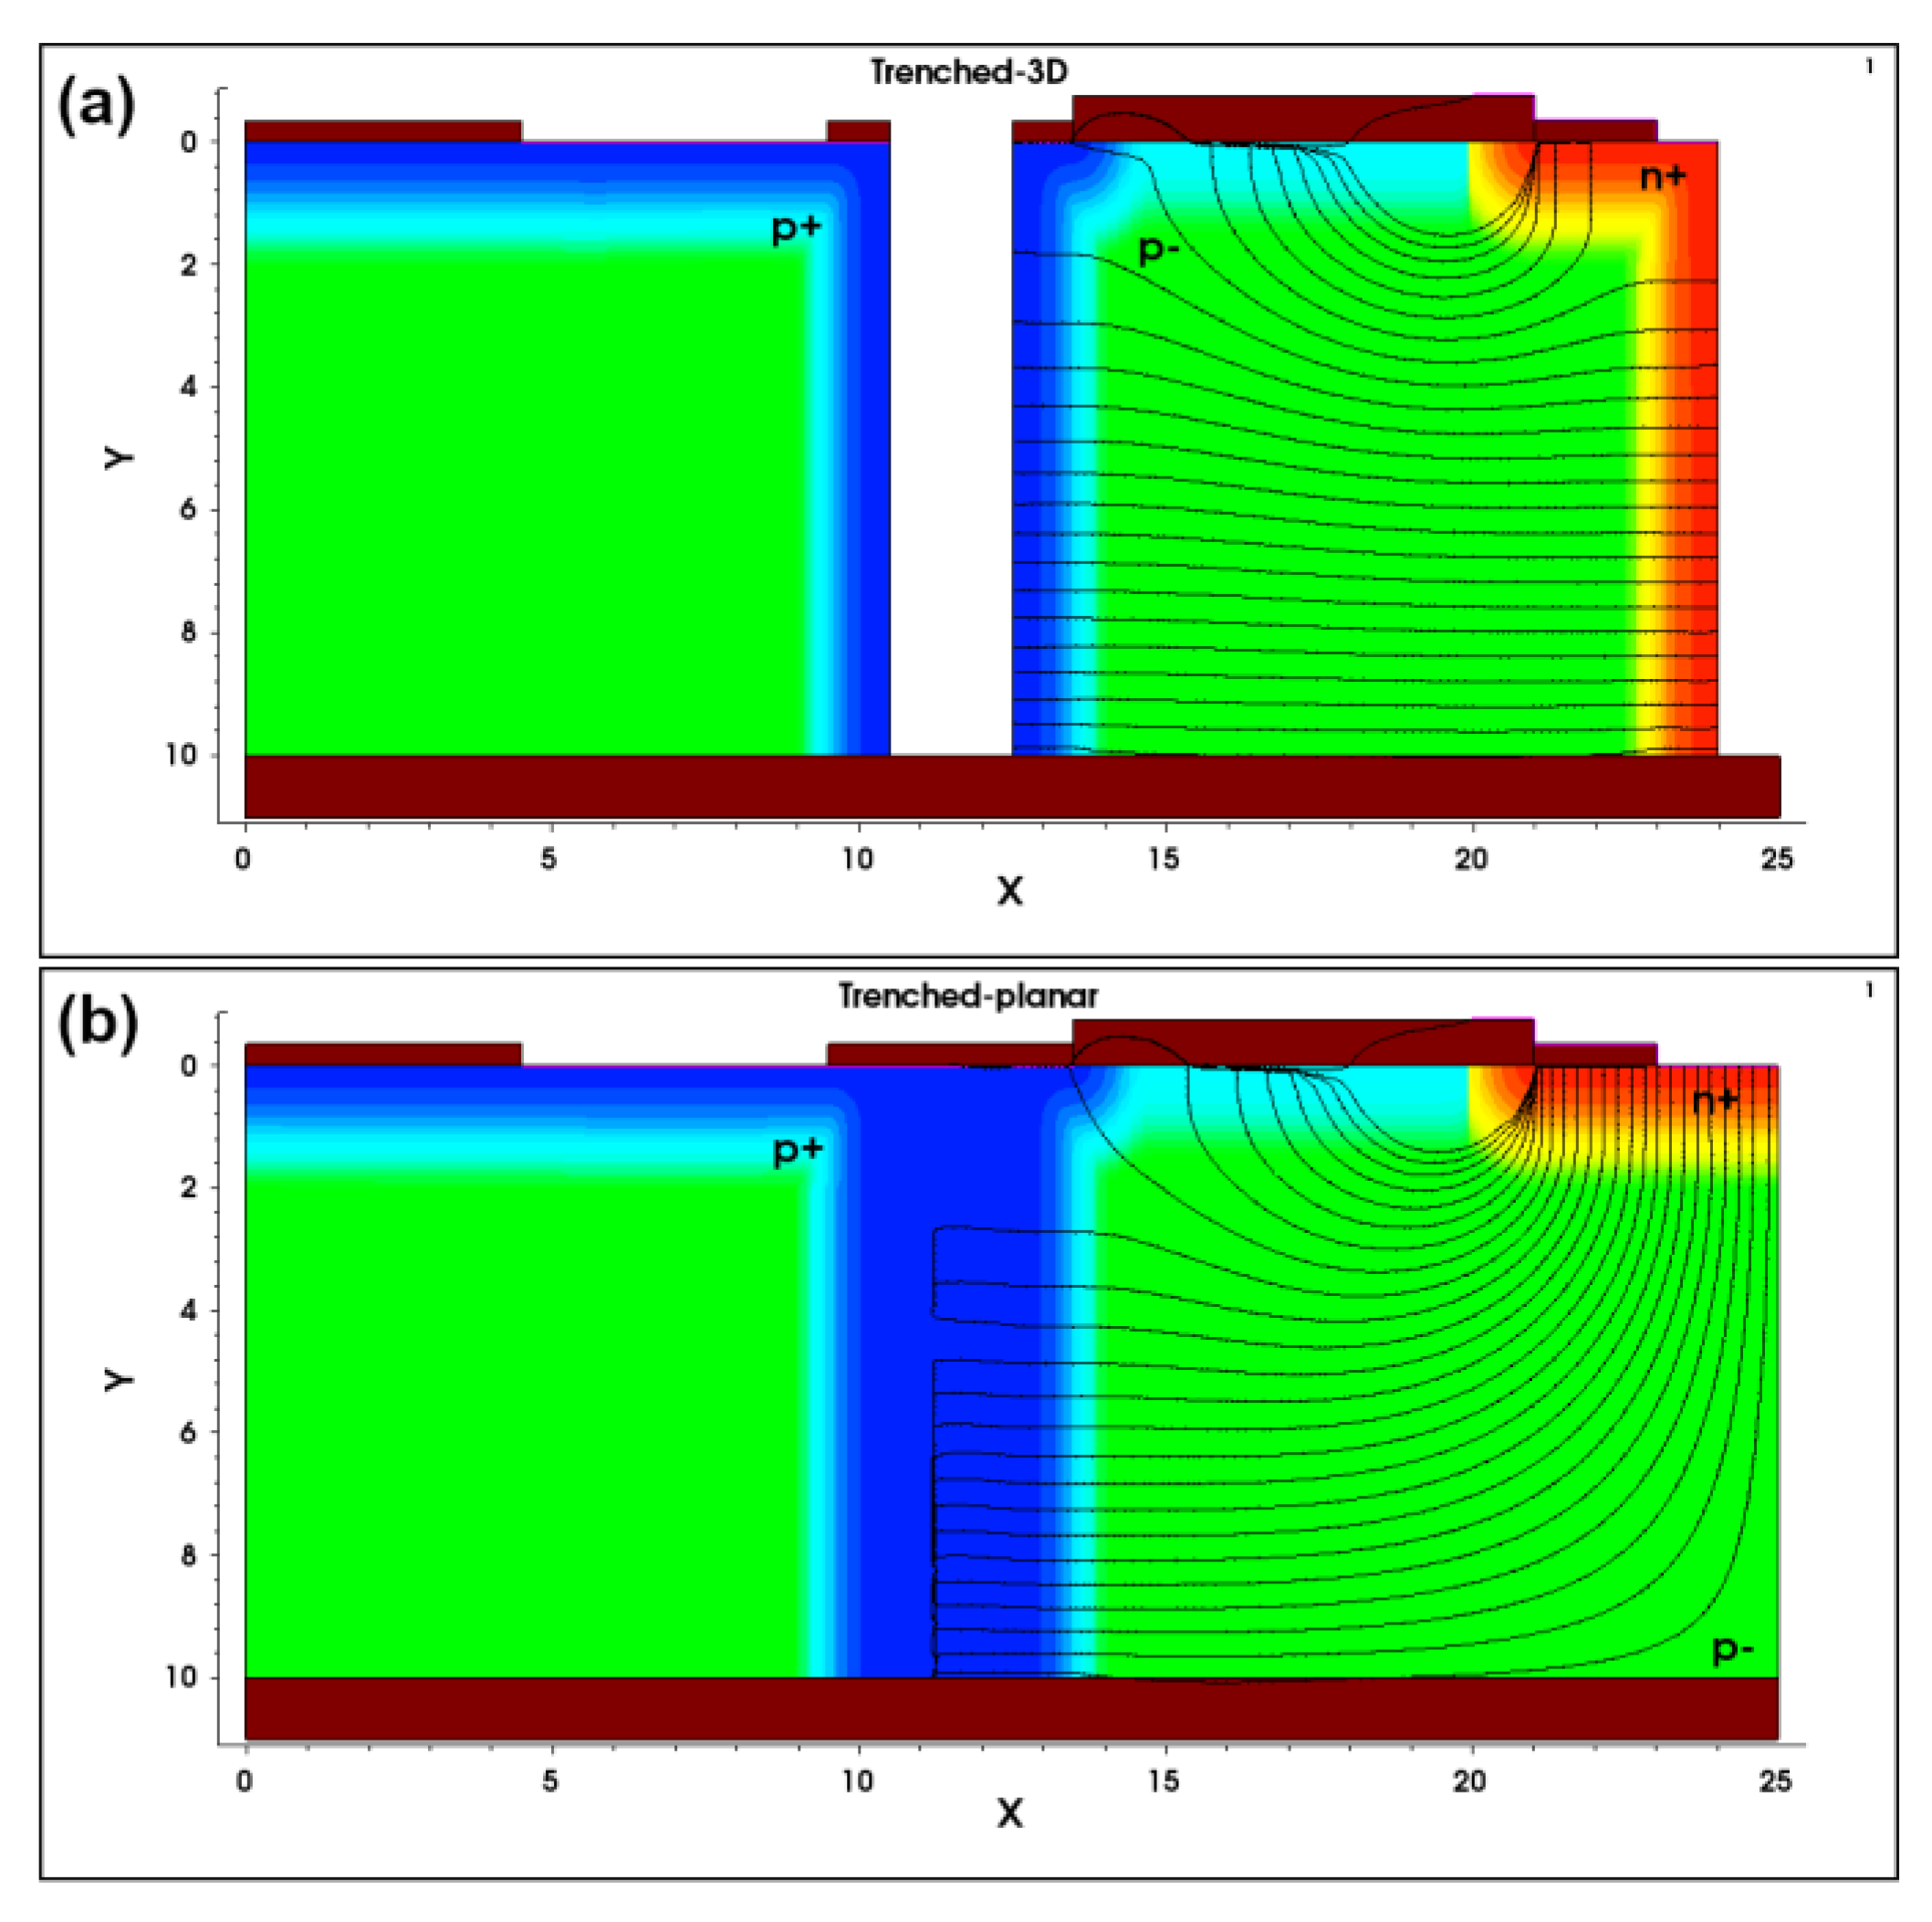
Numerical models were created in 2D for both the Trenched-3D and Trenched-planar sensors for SV thickness of 10 µm (Figure 6). These structures represent a radial slice of a single SV and can be used to perform simulations in cylindrical coordinates (the centre of the SV is located at x = 25 µm). The main difference between the two structures is that in Figure 6a, empty regions are present at x = 11 µm and x = 25 µm to simulate the lack of polysilicon filling in the Trenched-3D approach. It can also be observed that in Figure 6b the n+ electrode is planar.
Electrical simulations are performed by scanning the bias voltage on the p+ electrode from 0 V to −100 V while keeping the n+ electrode grounded. Breakdown voltage was found to be at biases higher than 60 V, which is more than sufficient to achieve over-depletion. The simulations showed that, for a fully depleted single SV, the expected current was on the order of 50fA, and the expected capacitance was on the order of 9fC. These values can be used to obtain an estimate of what to expect when multiple SVs are connected in an array to cover larger areas while still providing an excellent signal-to-noise ratio. The scaling is typically very reliable for dark currents, while extra capacitive components must be considered for large arrays due to the long metal interconnections between the SVs. The simulator can also provide 2D plots of electrostatic potential and electric field distributions. For example, the equipotential drift lines at a bias of −20 V are shown for both structures in Figure 6. It can be observed that, for the Trenched-3D structure (Figure 6a), the lines were mostly horizontal, while this was not the case for the Trenched-planar structure (Figure 6b). While this does not drastically affect the operation of both approaches, it was found that higher electric fields can be achieved in the Trenched-3D structure, potentially resulting in faster charge collection.
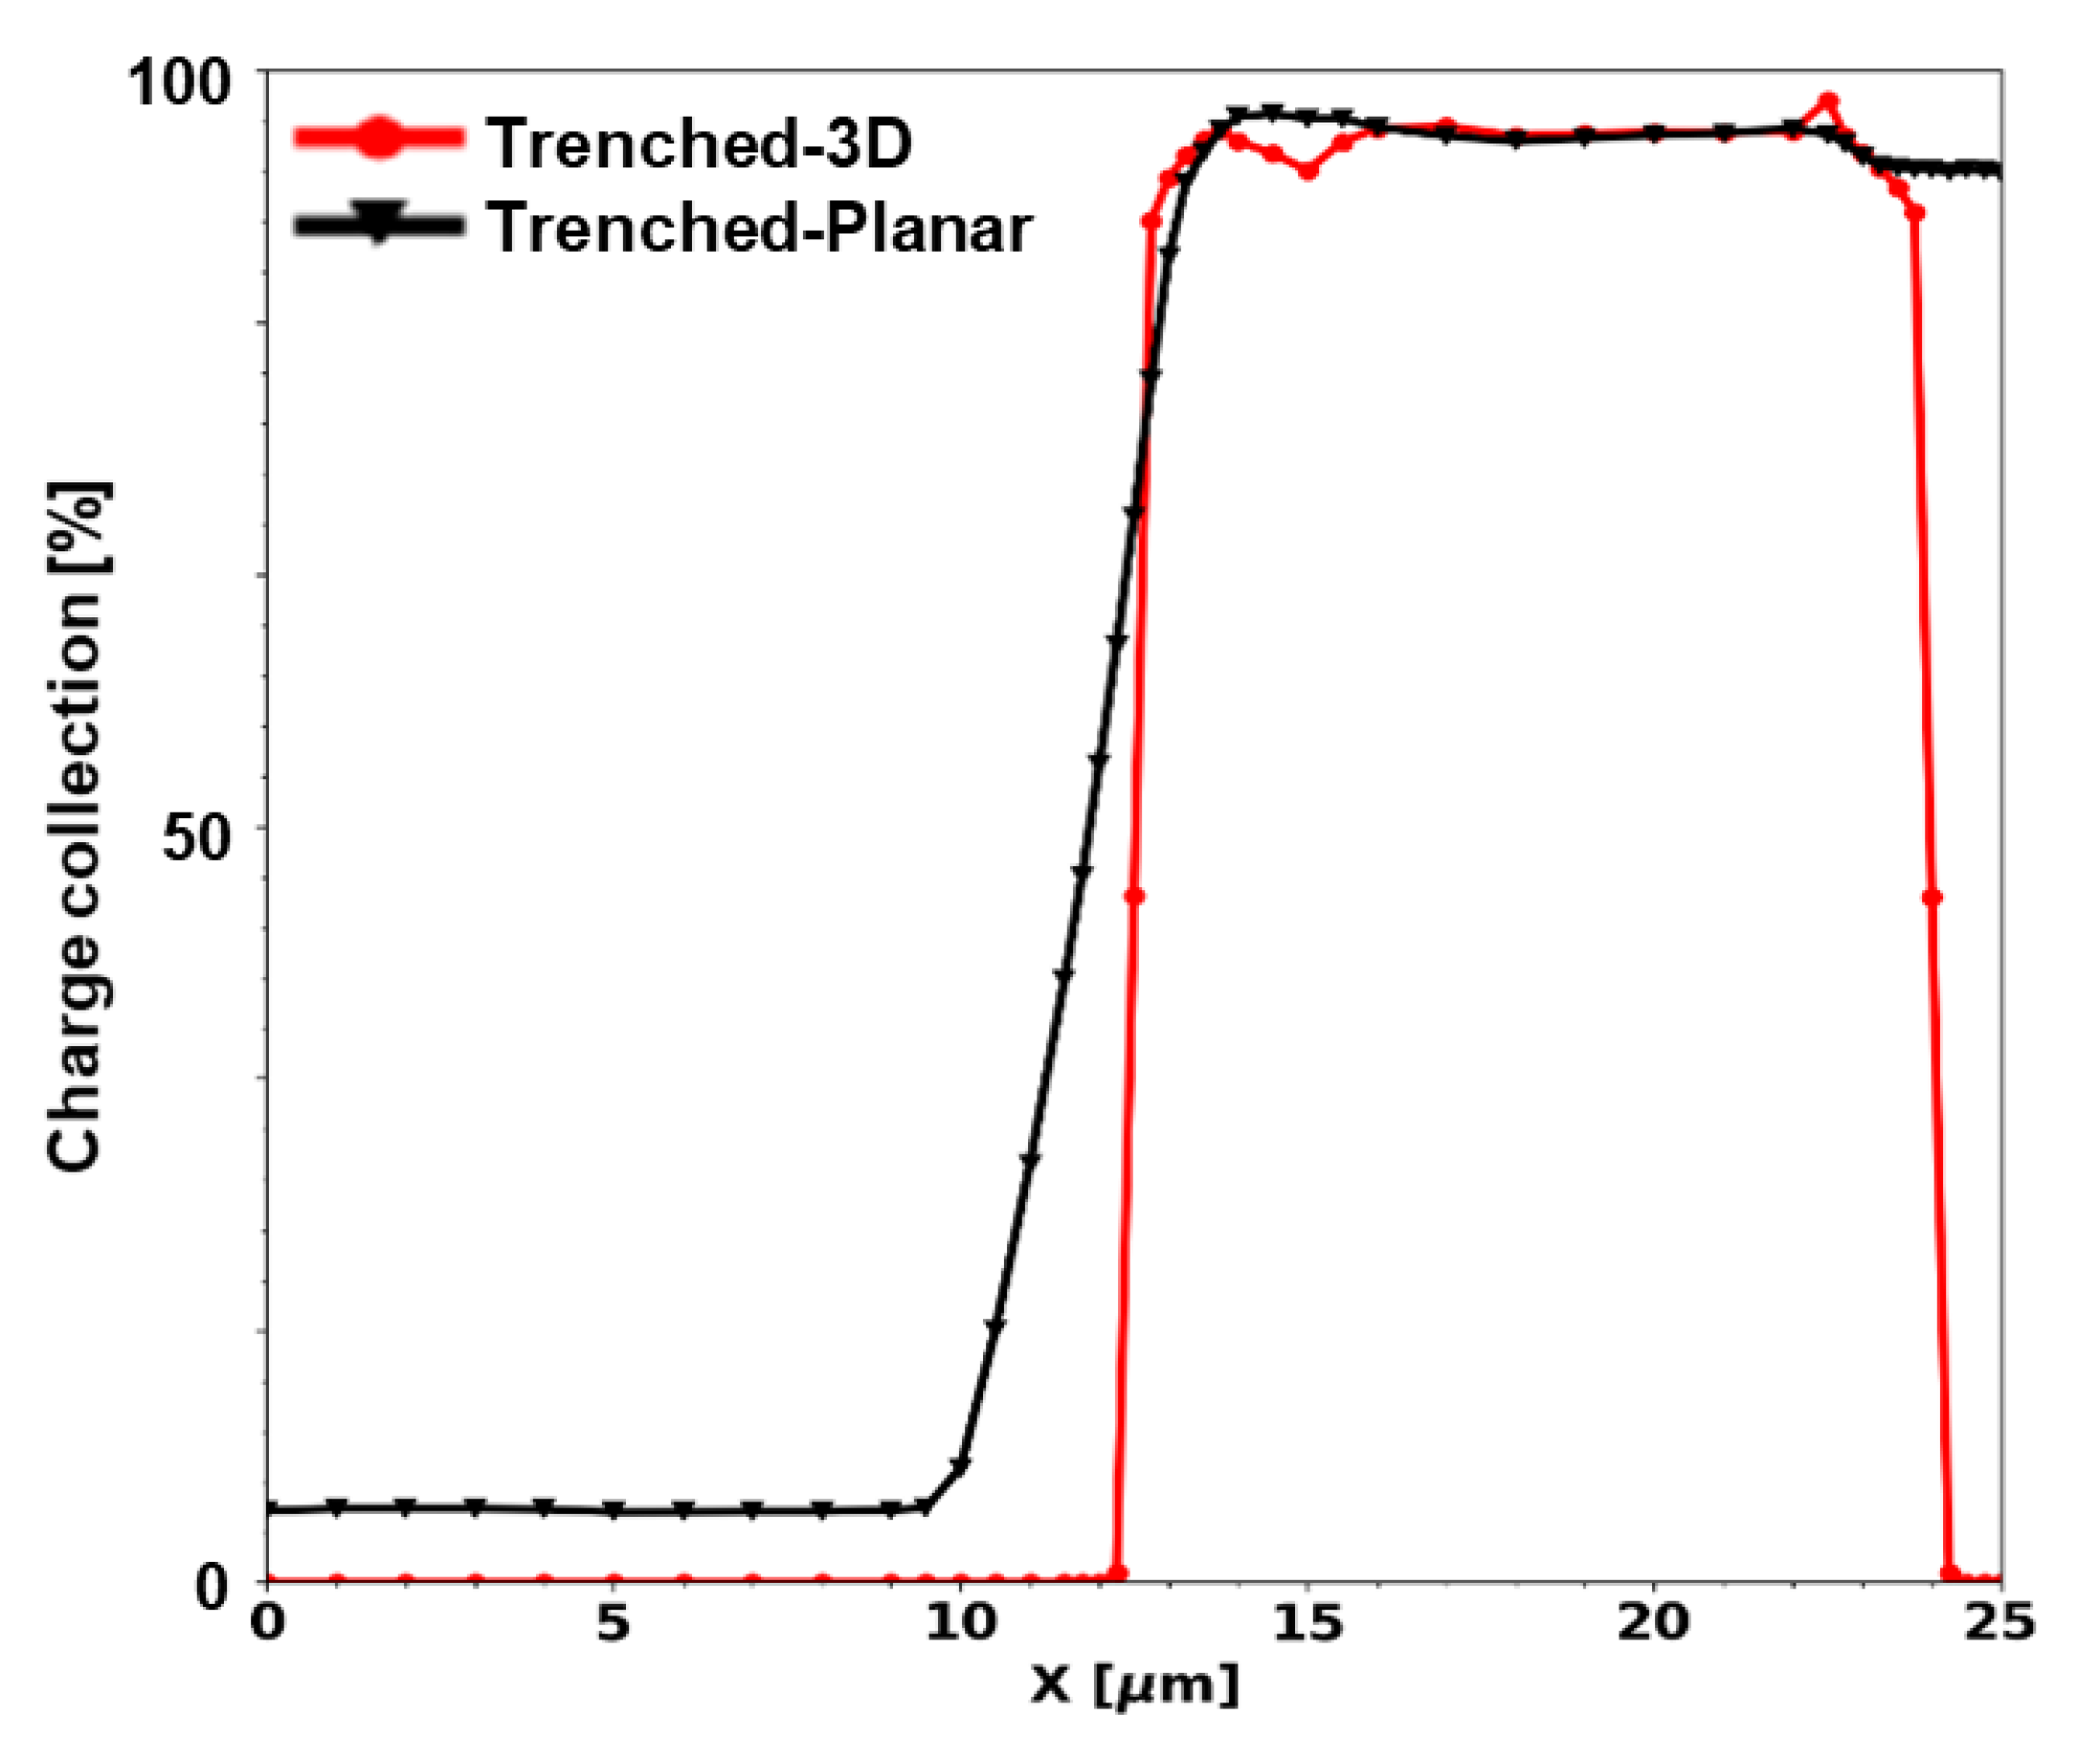
The operation of the numerical structures under irradiation was tested using the radiation generation models available in the SYNOPSYS Device. The simulator allows a particle track to be defined and offers both a heavy-ion and an alpha particle generation model. For this study, an alpha particle of energy 5.5 MeV was scanned radially through the SV, and transient simulations were performed at different bias voltages to estimate the charge collection efficiency. It was found that bias voltage had very little impact on charge collection because of the small size of the SV. This suggested that these devices can be operated in passive mode. The charge collection profiles for the Trenched-3D and Trenched-planar approaches at a bias of 20 V are compared in Figure 7 where 100% charge collection corresponds to 1.5 MeV energy deposition.
Charge collection outside the SV (0 < x < 10 µm) was only observed in the Trenched-planar structure. This was caused by the fact that small amount of charge produced by alpha particles in the extremely low resistivity polysilicon filling the trench was collected by diffusion from a thin silicon region surrounding the SV. No charge collection was observed in this region for the Trenched-3D structure because the outside silicon was physically disconnected by an air gap. As mentioned in Section 3.1.2, it is important to keep in mind that the Trenched-3D approach requires that the trench is not a completely closed ring, thus still leaving a point of contact between the outside and the inside of the SV. This aspect cannot be easily simulated in 2D and would require a complex 3D structure. As the incident particle approached the edge of the SV (10 < x < 15 µm), the charge collection rapidly increased, reaching a maximum of almost 100% charge collection efficiency (which corresponds to 1.5 MeV) for both structures. The Trenched-3D version exhibited a sharp transition, while for the trenched planar, a 2-µm-wide penumbra was observed in the charge collection efficiency. The charge collection profile inside the SV was mostly flat in the region from 15 < x < 22 µm; however, in the middle of the SV, the two structures behaved differently. The Trenched-3D structure was completely insensitive because of the presence of an empty columnar electrode, while the Trenched-planar structure only had a small reduction in charge collection efficiency due to the presence of the planar n+ implantation, causing some of the generated charge to be lost due to recombination.
These numerical simulation studies showed that both the Trenched-3D and Trenched-planar designs are viable, although the Trenched-planar solution should be able to deliver better and more consistent uniformity in charge collection efficiency, i.e., higher definition of a cylindrical SV.

3.3. Charge Collection Characterisation of SOI Mushroom Microdosimeters

3.3.1. Ion Beam-Induced Charge Collection (IBIC) Technique at ANSTO

The charge collection properties of the Mushroom microdosimeters with different structures were investigated using the ion beam-induced charge collection (IBIC) technique at the 6-MV accelerator SIRIUS at the Australian Nuclear Science and Technology Organisation (ANSTO) [23,24]. A microbeam of 1.78, 3 and 5.5 MeV He2+ ions were raster scanned over the surface of the microdosimeter. The spot size of the microbeam was approximately 1 µm. The position “x” and “y” of the microbeam and the deposited energy “E” for each event were processed into a list mode file. The median energy maps of the charge collection of the devices were then produced. To calibrate the energy deposited into the microdosimeter, a calibrated pulse generator was used. The pulse generator was calibrated using a silicon p-i-n photodiode with 100% charge collection efficiency (CCE) in response to 1.78 and 5.5 MeV He2+ ions.

3.3.2. Charge Collection Results of Mushroom Microdosimeters with Different Structures

(A)
The 2-µm-thick Mushroom-p microdosimeter fabricated by planar technology
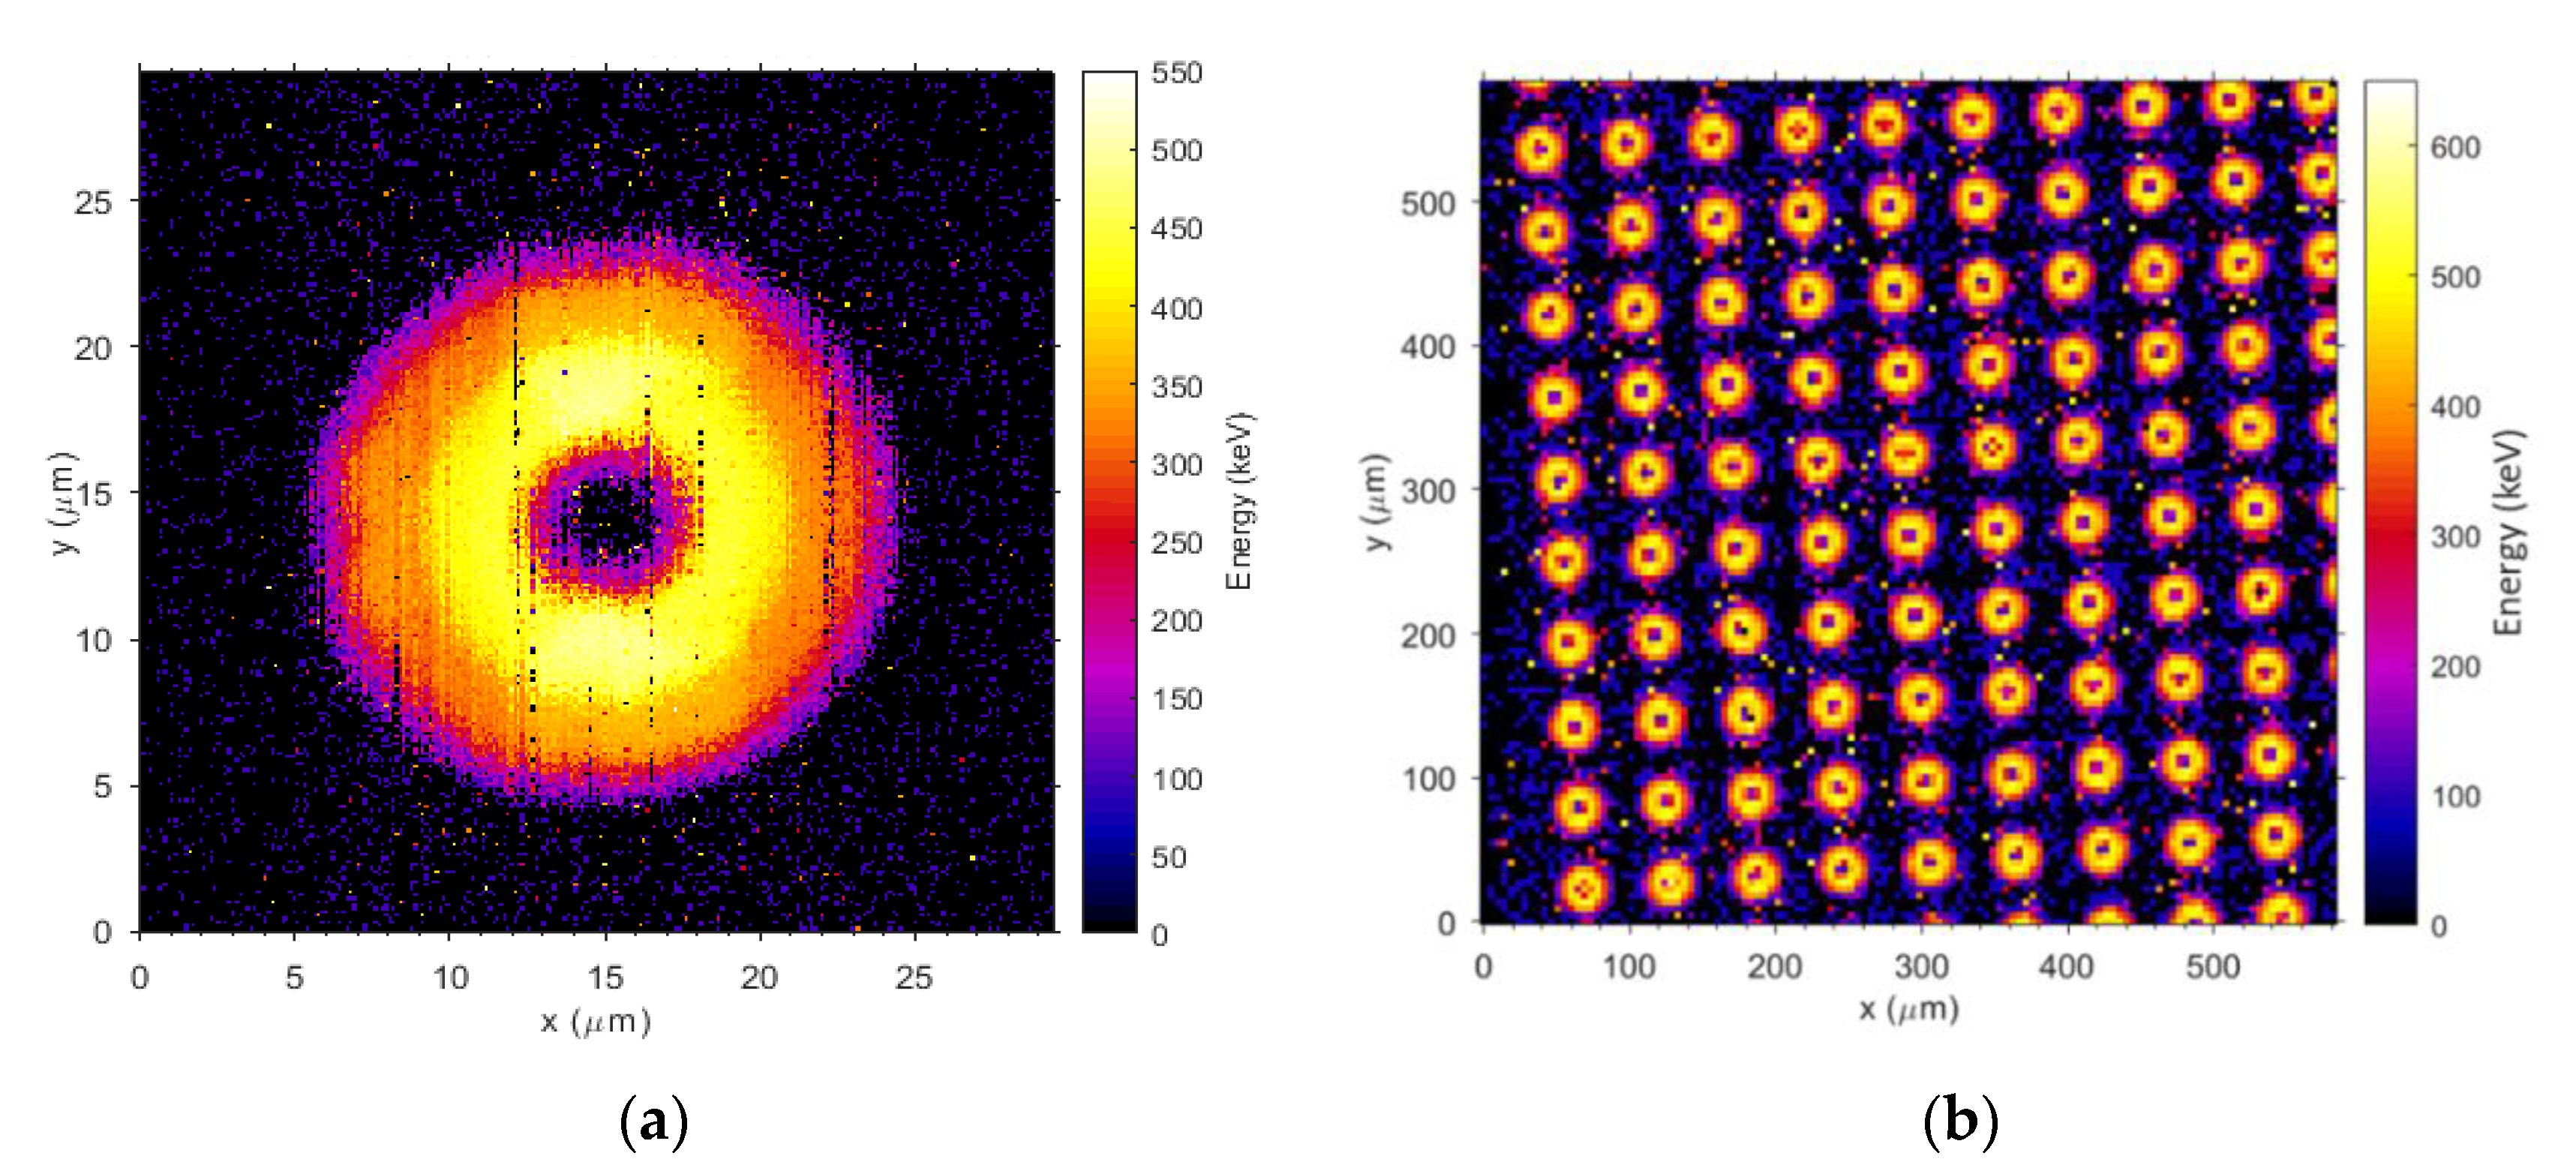
Figure 8a,b show the median energy map of a single SV and an array of SVs, respectively, of the 2-µm-thick Mushroom-p biased with 10 V and in response to a 1.78 MeV He2+ ion-scanned microbeam. It can be seen that the device was fully depleted even at 0 V with almost 100% CCE in a particular annular region surrounding the inner n+ electrode. The n+ core of the SV showed almost zero CCE due to the implantation and diffusion depth propagated through entire thickness of the sensitive region of SOI layer (as observed in Figure 8a).
(B)
Trenched-3D Mushroom microdosimeter
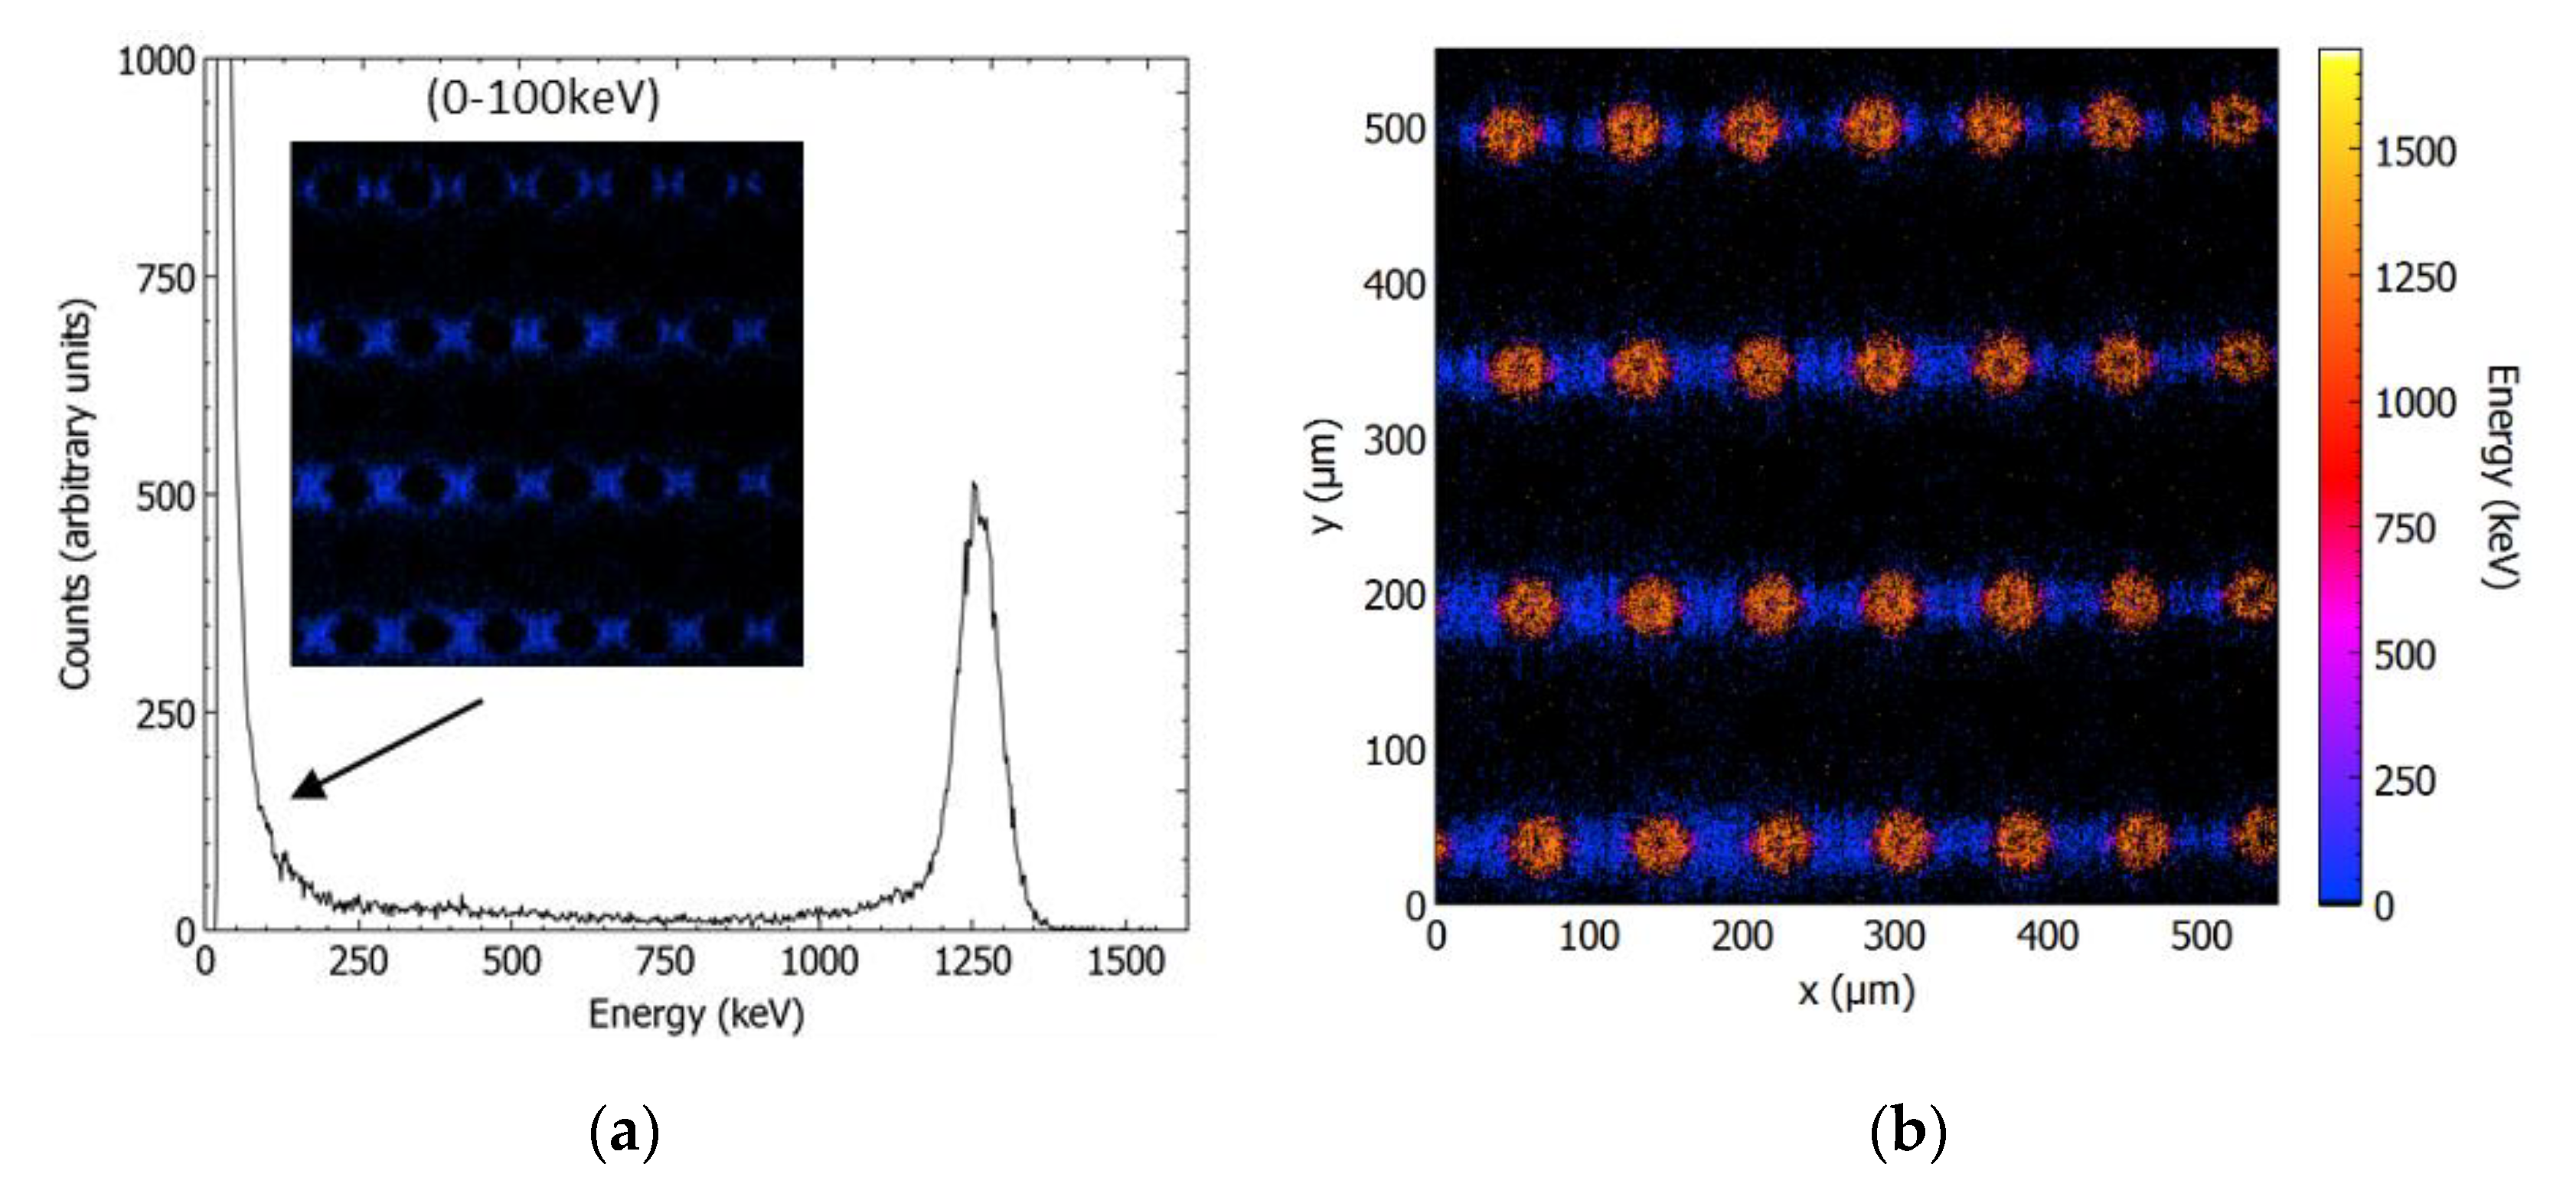
Figure 9a,b show the multichannel analyzer (MCA) spectra and the charge collection energy map, respectively, obtained by the trenched-3D Mushroom microdosimeter with SV diameter of 20 µm and 10 µm thickness irradiated with a 5.5 MeV He2+ microbeam. The peak of the energy spectrum deposited in the 3D SV was approximately 1260 keV. The energy peak between 1100 and 1400 keV corresponded to events that originated from within the sensitive volume. It can be seen that in the middle of the SV, there was no charge collection (black) due to the empty core. The events with low energy (0–100 keV) mainly originated from the silicon bridges supporting metal line contacts. The bridge region was not doped with p+; therefore, charge generated outside the SV diffused inside and was collected by the core electrode. Figure 9b clearly shows the bridge region between the SVs. More detailed IBIC results on this device can be found in [21].
(C)
Trenched-planar Mushroom microdosimeter
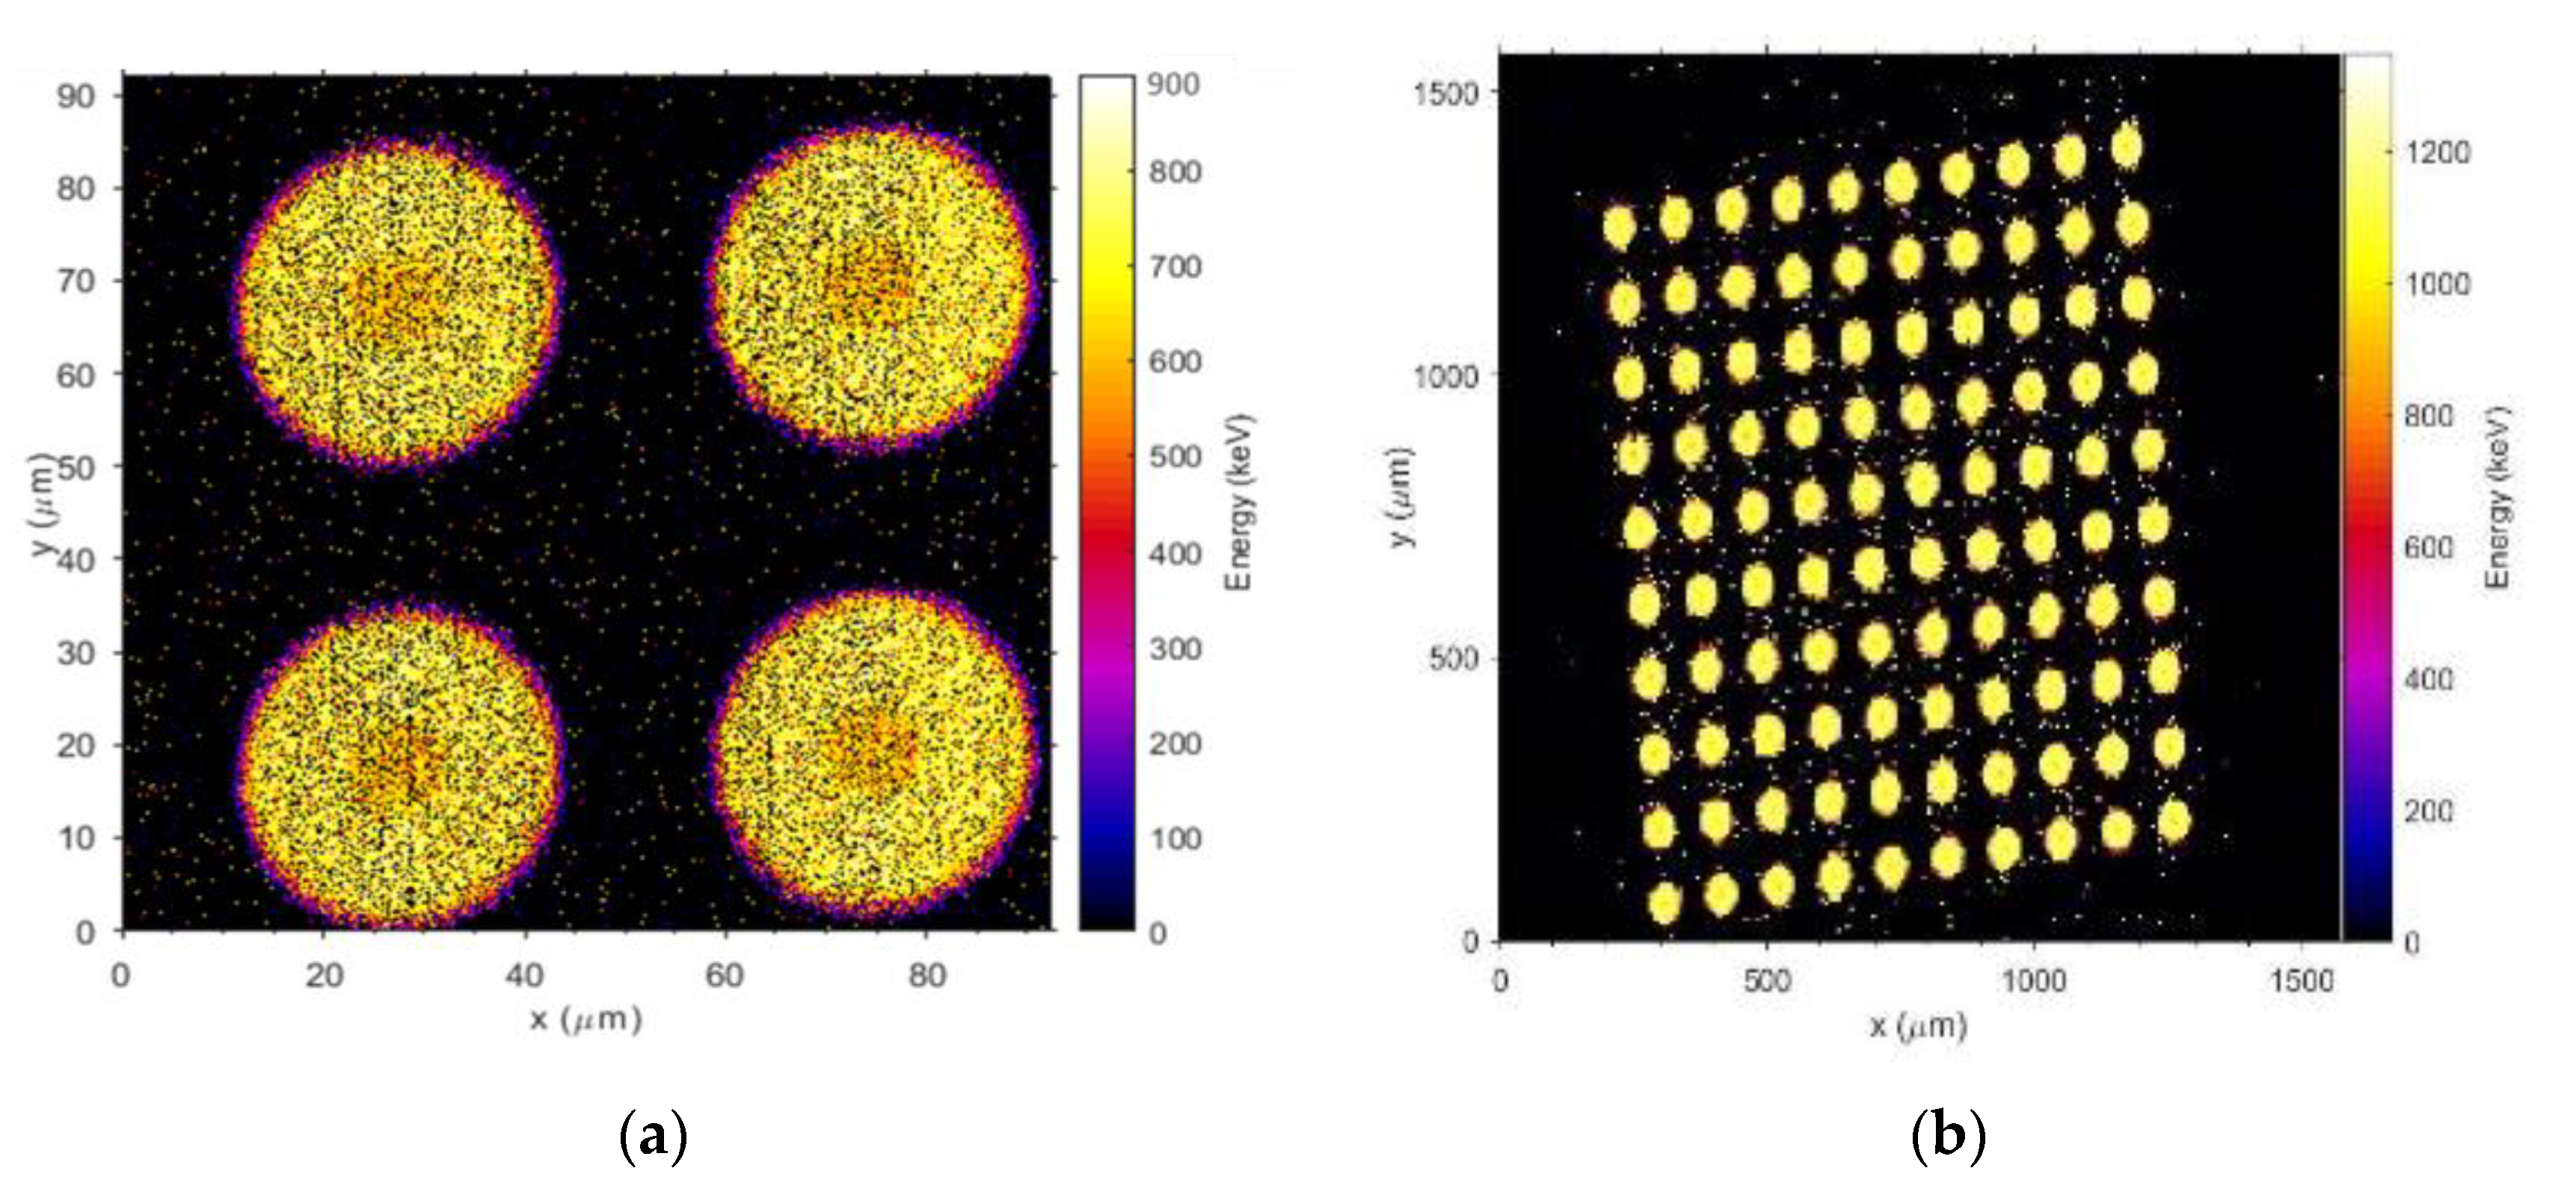
Figure 10a,b show the median energy map of four individual (5 µm thick) SVs and a full-array of SVs (10 µm thick) in response to 3 and 5.5-MeV He2+ scanning microbeams, respectively. The detector was biased at 10 V. It is evident that the yield in the structure of the Mushroom microdosimeter was almost 100%. The diameter of each SV was 30 μm, and pitch was 50 μm between SVs. Highly uniform charge collection and a well-defined cylindrical sensitive volume were seen. Low-energy events in the border ring of the SV next to the polysilicon trench (~1 μm width) were due to p+ doping going into the inner sidewall of the cylindrical SV, which is in agreement with the TCAD simulation (Figure 7). In this structure, no charge collection was observed in the connecting regions between the SVs both at 0 and 10 V bias. With the exception of the n+ core region, the SV region showed almost 100% CCE with very uniform charge collection. A deficit of charge collection produced by He2+ ions in the n+ core was due to a dead layer of n+ ion implantation in the core. The CCE within the planar core was calculated based on the frequency of events and was approximately 84% [22], which is supported by the TCAD simulation (Figure 7).
(D)
Free-standing 3D Mushroom microdosimeter embedded in tissue-equivalent material
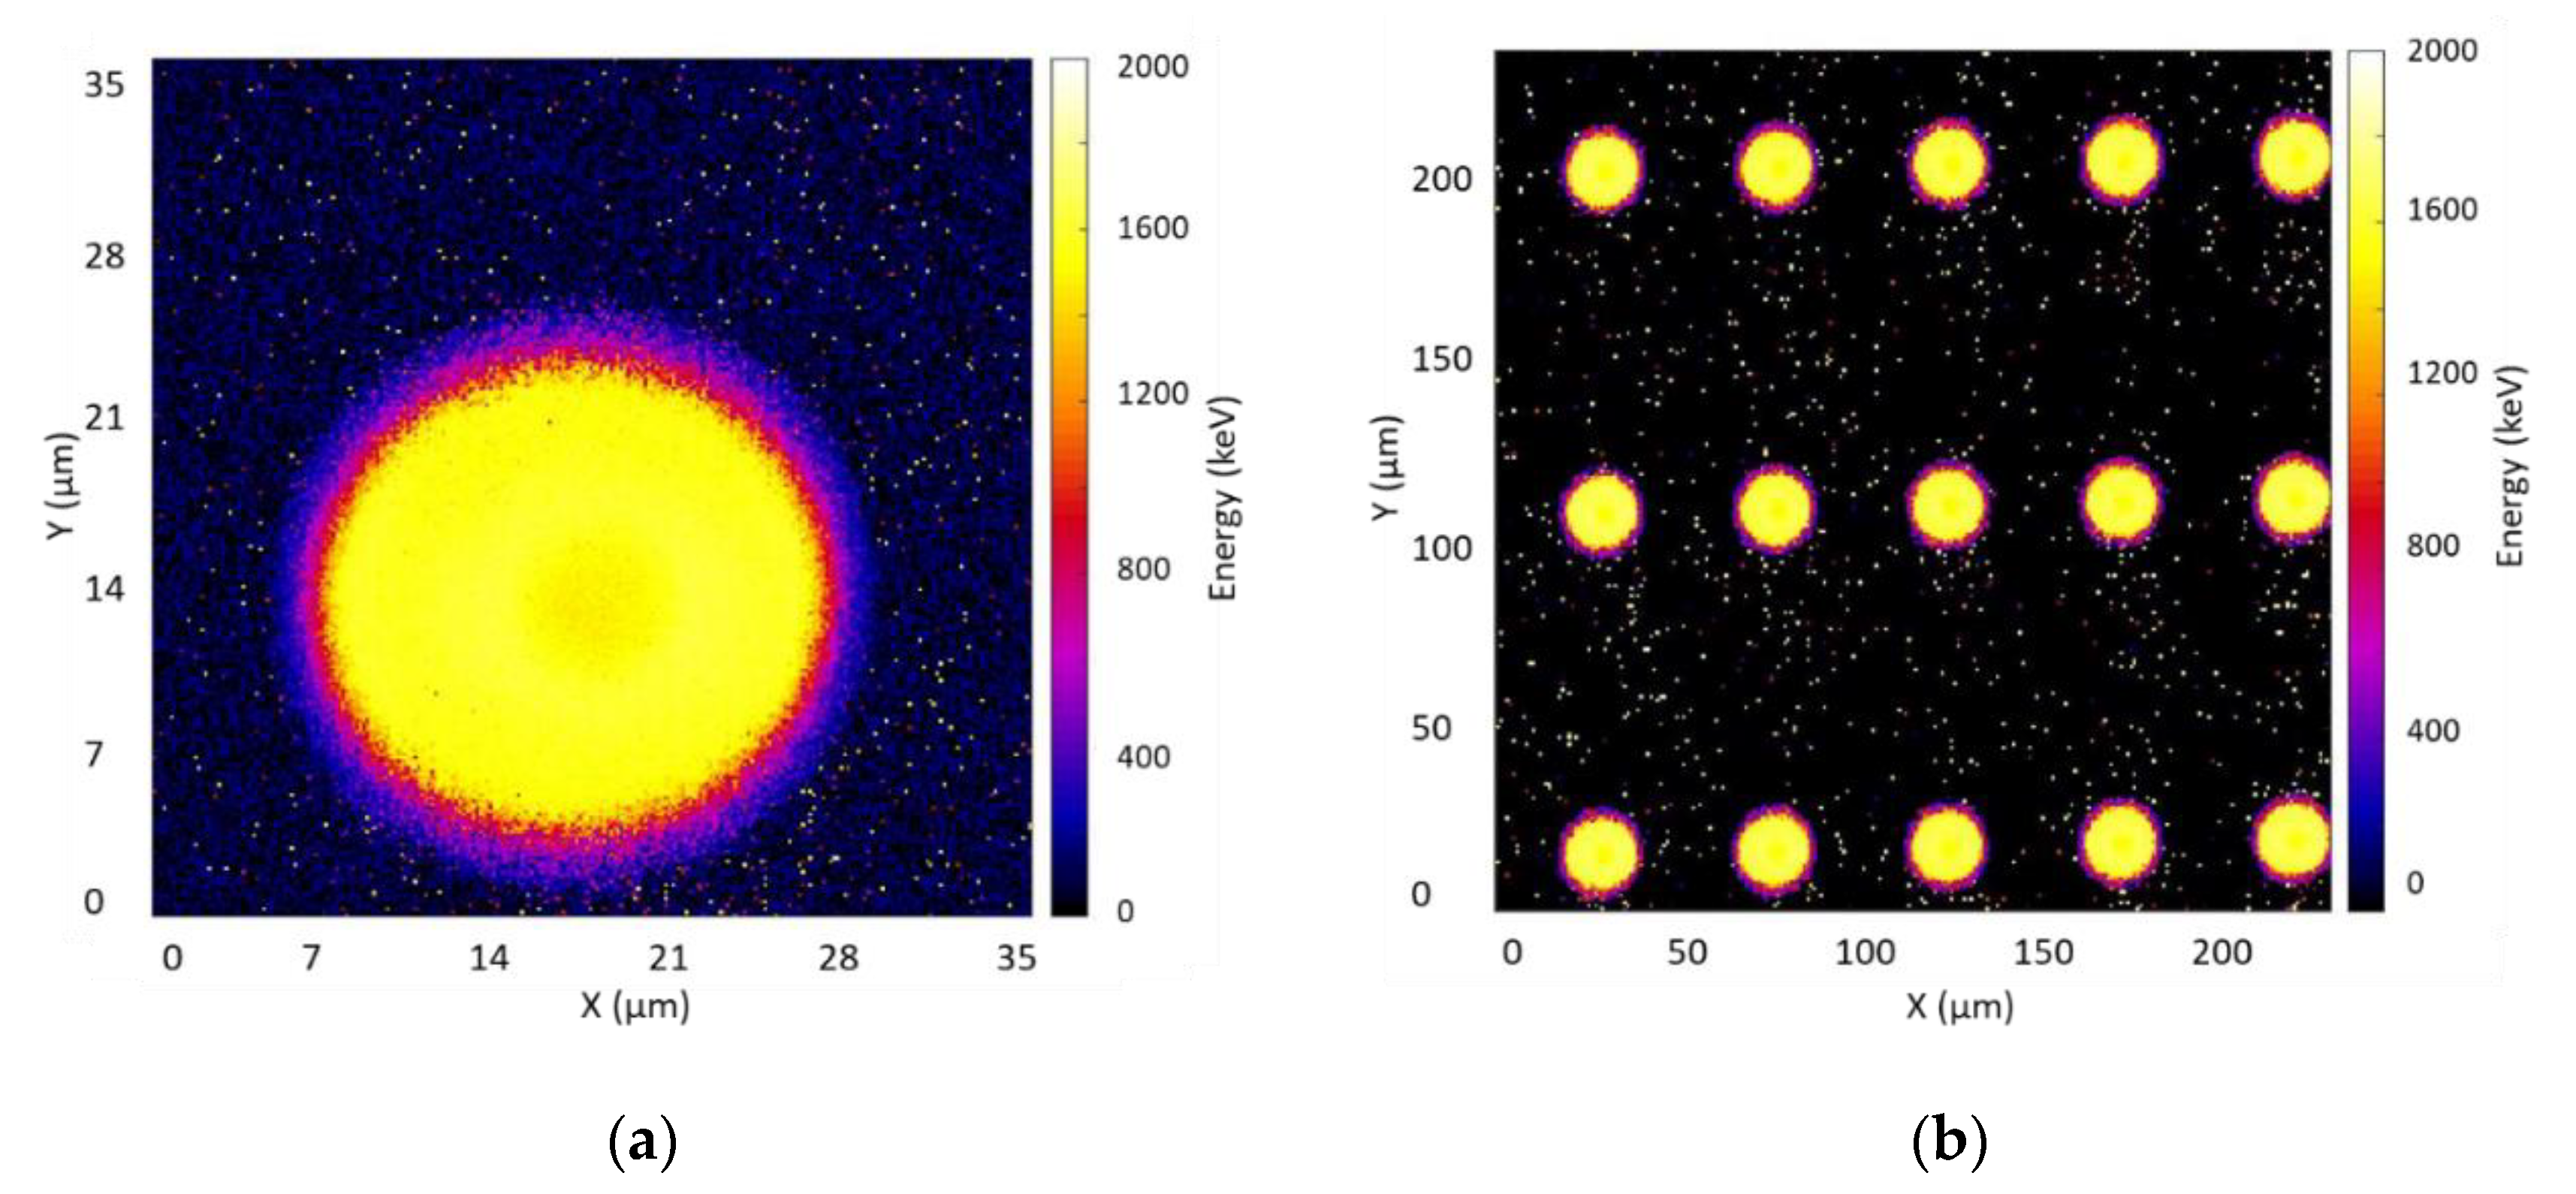
Figure 11a,b show the median energy map of a single SV and an even array of SVs embedded in Polyimide. Similar to the trenched-planar Mushroom microdosimeter, very uniform charge collection and well-defined cylindrical volume shapes were observed for the free-standing Mushroom microdosimeter embedded in Polyimide. Approximately 80% CCE was seen in the n+ core region compared to the SV due to ion implantation in the n+ core). The size of a single SV was also confirmed to be ~18–20 μm from the median energy map.
Very little charge was collected in the narrow region surrounding each SV. This was due to the p+ doped trench wall providing a p+ electrode from which charge was partially collected by diffusion. Moreover, no charge was collected in the unconnected array (odd), or the regions between the sensitive volumes [25].

4. Application of SOI Mushroom Microdosimeters

Radiobiological effects in particle therapy can be predicted from experimental microdosimetry with silicon microdosimeters. In order to investigate the performance of newly developed SOI microdosimeters at CMRP, different experiments have been carried out at a number of proton and heavy ion therapy centres.

4.1. Irradiation Facilities

4.1.1. Passive Beam Irradiation at the HIMAC Facility with 16O ion Pristine BP and 12C Ion SOBP

Measurements were performed with SOI microdosimeters on the passive biological beamline at the Heavy Ion Medical Accelerator in Chiba (HIMAC) facility in Japan with 16O and 12C ion beams at nominal beam energies of 400 MeV/u and 290 MeV/u, respectively. For 16O irradiation, a pristine Bragg peak (BP) was delivered with a Tantalum (Ta) scatterer positioned in the beamline to passively widen the beam. Measurements were performed in a water phantom with an 86-mm-thick range shifter of PMMA and an additional 100-mm-water-equivalent thickness (WET) of PMMA positioned upstream. The passively scattered beam was collimated to a 10 × 10 cm2 field with a 50-mm-thick brass collimator. The physical dose deposited by 16O ions in water was measured using a pinpoint ionisation chamber (PTW 31066, Germany) at the same effective depth as measurements performed with microdosimeters on central axis of the beam.
A 60-mm-spread-out Bragg Peak (SOBP) of 290 MeV/u 12C beam collimated to a 10 × 10 cm2 field size was delivered using an Aluminum ridge filter positioned in the beamline. The range of 290 MeV/u of 12C ions at the HIMAC beamline was 147.9 mm in water. For both radiation fields, the microdosimetric spectra were measured using an X–Y motion stage to control the location of the MicroPlus probe in a water phantom with sub-hundred-micron accuracy.

4.1.2. SOBP Beam Irradiation with Scanning Beam of He, C, O and Ne Ions

Microdosimetric measurements were performed in scanned helium, carbon, oxygen and neon ion beams. Treatment plans, designed at the National Institute for quantum Sciences and Technology (QTS), to achieve a 10% survival fraction (SF) for MIA PaCa-2 cells throughout a 10 × 10 × 6 cm3 target volume were delivered to SOI microdosimeters. The survival fraction predicted by the TPS was demonstrated by Inaniwa et al. to show good agreement with measured survival fractions for MIA PaCa-2 cells [26]. The same 6-cm-thick SOBP fields were generated using a hybrid-depth-scanning technique with a combination of energies of helium (166.0, 151.9 and 136.9 MeV/u), carbon (313.2, 288.0 and 261.5 MeV/u), oxygen (373.9, 343.3 and 309.1 MeV/u) and neon ion (430.0, 392.4 and 353.0 MeV/u) beams at a horizontal beamline in HIMAC [27].

4.1.3. Proton Therapy Facility in Ithemba Labs, South Africa

Microdosimetric measurements were conducted with the Trenched-3D Mushroom microdosimeter in the double scattering proton beamline at the iThemba Labs, South Africa, and compared against in-vitro cell experiments. A proton beam with initial energy of 200 MeV was delivered from the cyclotron to the treatment nozzle where the beam was variably degraded to form a 50 mm SOBP with a maximum energy of approximately 127 MeV at the surface of the water phantom (with a range of approximately 120 mm in water). A field size of 10 cm diameter was delivered in this study.

4.1.4. Geant4 Simulations

The Monte Carlo simulation toolkit Geant4 version 10.2p02 [28,29] was used to simulate the 3D Mushroom microdosimeters in the HIMAC Biological beamline [30]. The G4 Standard EM option 3 Physics List and Binary Intranuclear Cascade (BIC) model were adopted for electromagnetic interactions and inelastic hadronic interactions, respectively [31]. The HIMAC Biological beamline, shown in Figure 12, was modelled through which 16O ions were tracked. Wobbler magnets, a Ta scatterer and a brass collimator were simulated to form a uniform 10 × 10 cm2 field incident on a water phantom. The initial energy of the 16O ions was 400 MeV/u with 0.15% energy sigma. Every event generated by primary particles was simulated by Geant4, and the energy deposition of each event was stored in Geant4 Hits. The energy deposition per event (corresponding to one incident primary particle) was stored, and the output was processed into a spectrum of the energy depositions per event.

4.2. RBE Derivation and Cell Survival Predictions

4.2.1. RBE Prediction in Heavy Ion Therapy

Figure 13 shows the y D ¯ distribution and corresponding microdosimetric spectra at different depths along the central axis of the 12C SOBP in water obtained with a 3D freestanding Mushroom microdosimeter embedded in polyimide. The y D ¯ value was approximately 16 keV/μm at the entrance of the SOBP and increased with depth in water. The microdosimetric spectra also shifted to the right as the microdosimeter moved to greater depths in water. At the distal part of the SOBP (~148 mm), the y D ¯ value reached a maximum of 195 keV/μm.
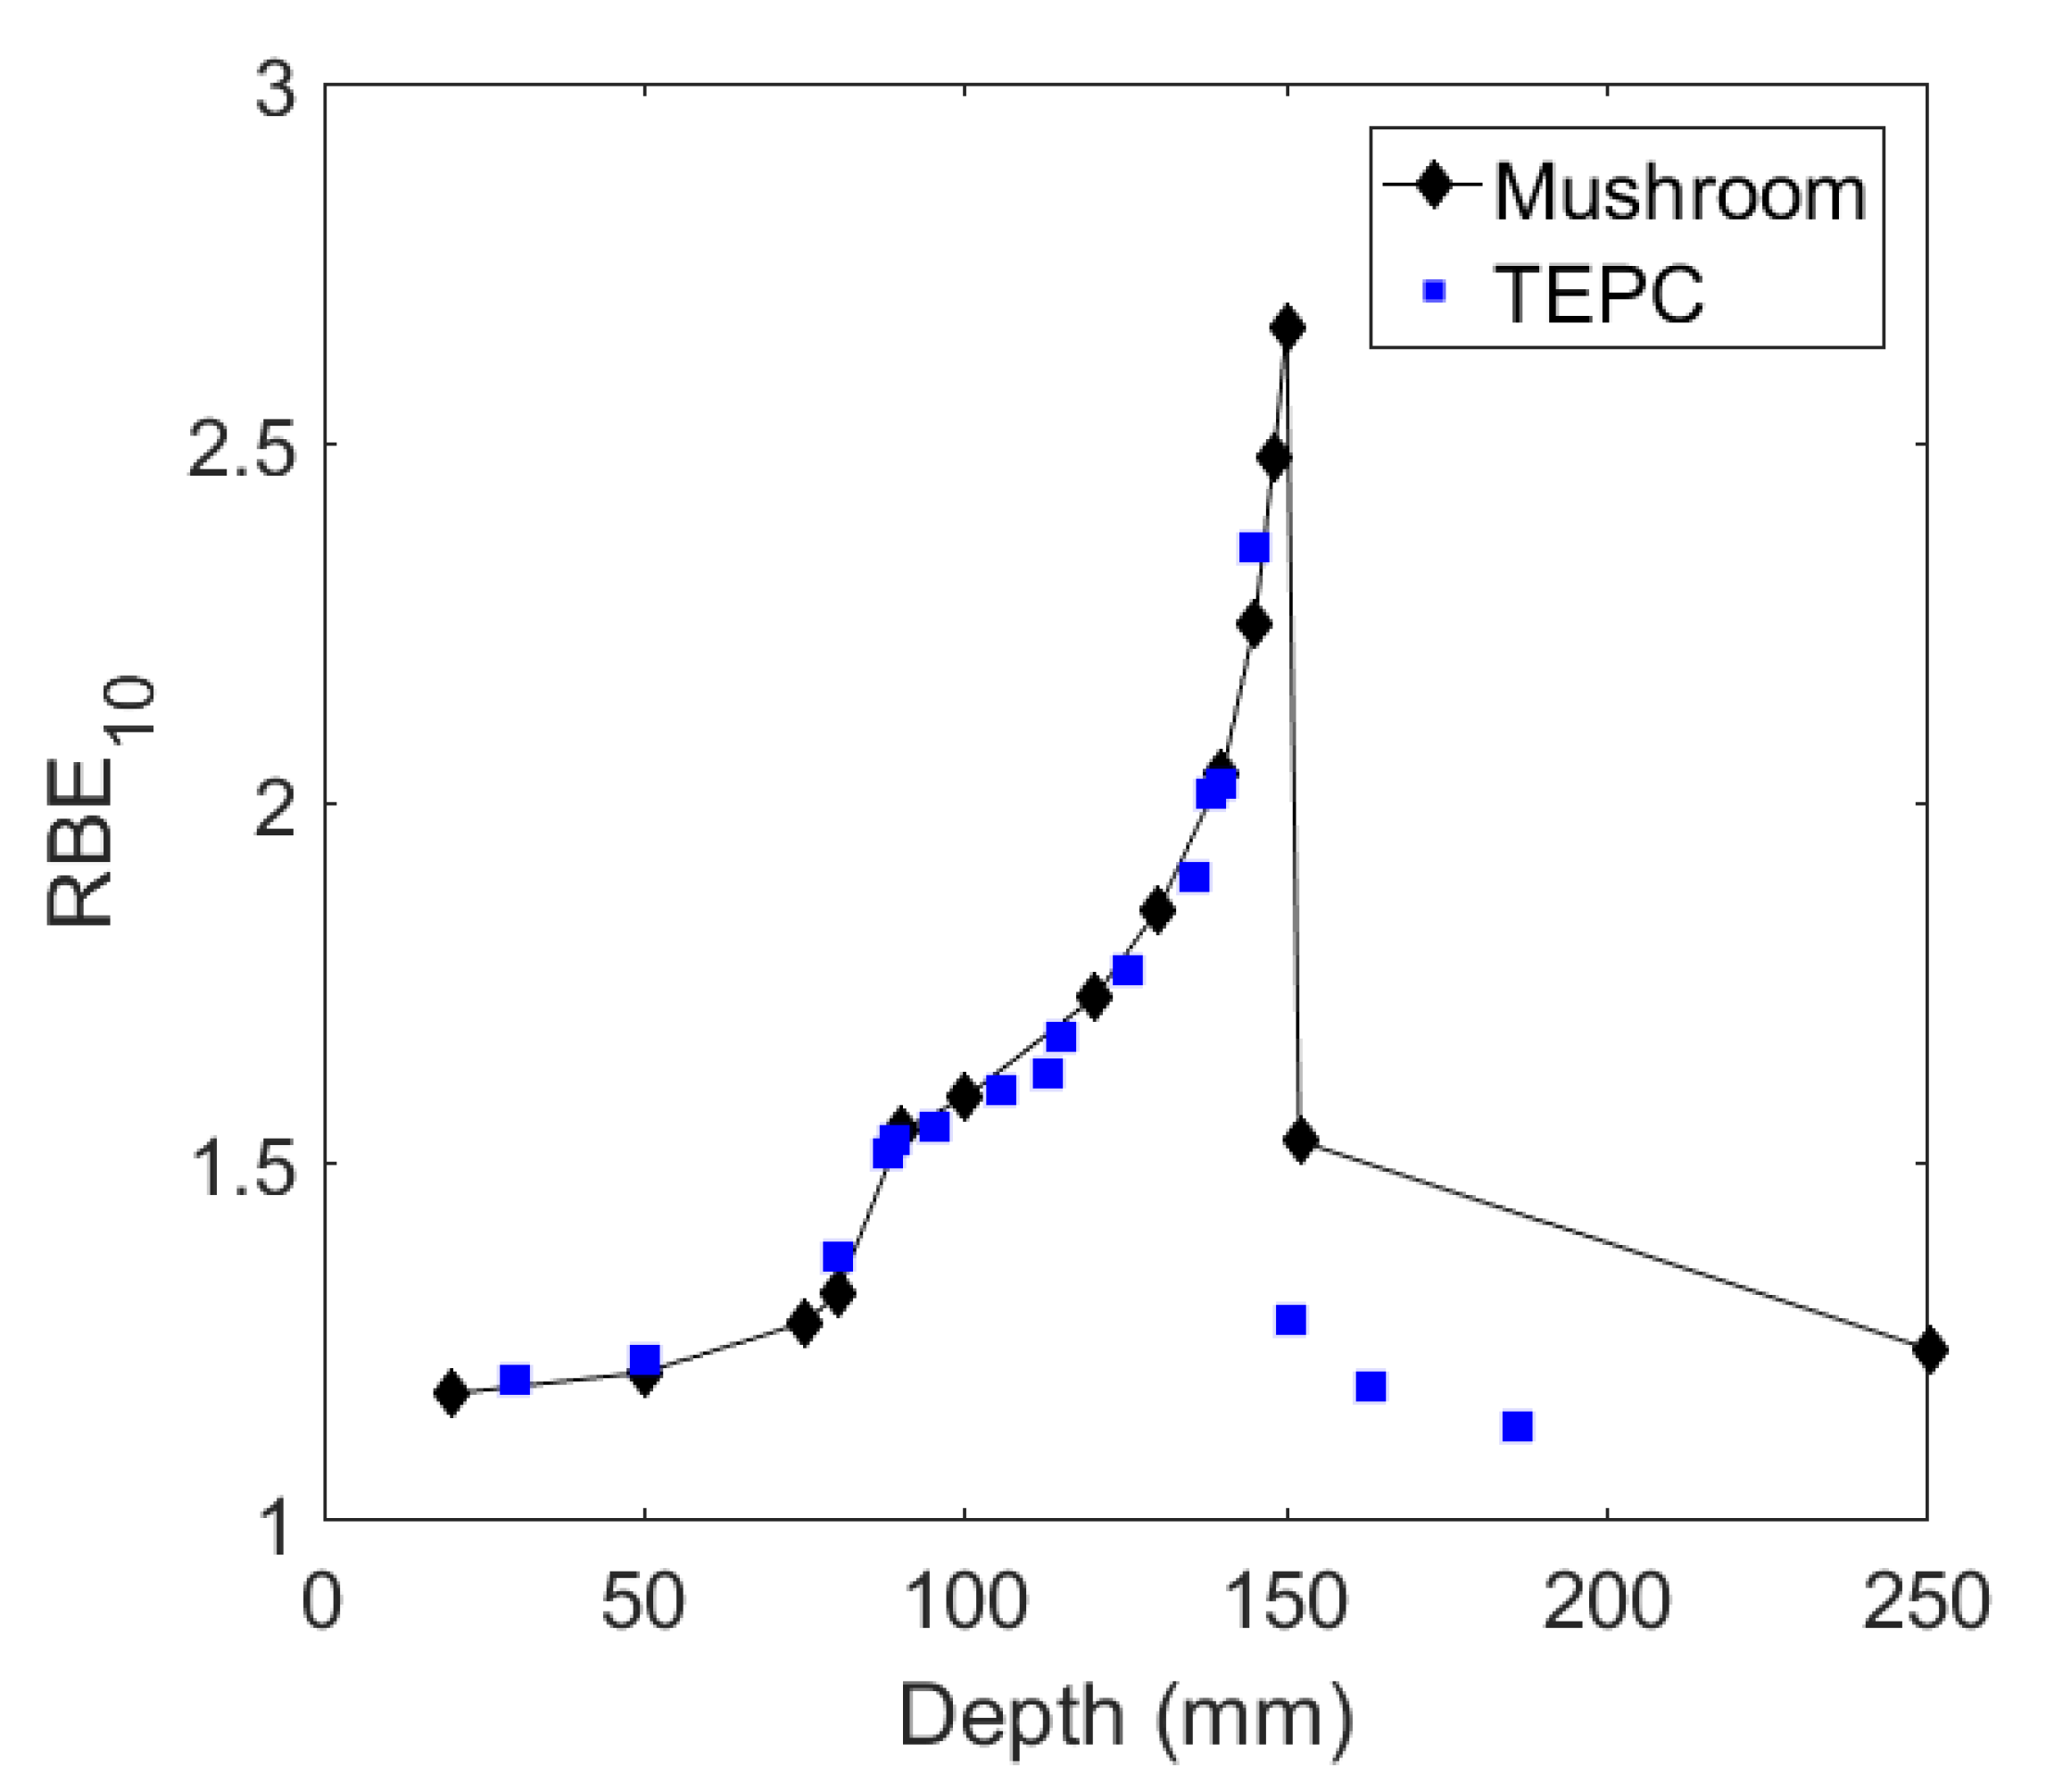
Figure 14 shows the RBE10 distribution derived from the modified microdosimetric kinetic model (MKM) along the SOBP. At the entrance, the RBE started at 1.3 and increased to 2.7 at the end of the SOBP. It can be seen that the experimental data obtained with the SOI microdosimeter matched the TEPC data very well in the entrance and at the end of the SOBP. At the end of the SOBP (~148 mm), the SOI Mushroom microdosimeter was able to provide more detailed RBE10 derivation than the TEPC due to its superior spatial resolution. Higher values obtained with the SOI microdosimeter downstream of the SOBP are due to (i) the SOI microdosimeter having a much higher lateral spatial resolution than the TEPC (~1 mm vs. ~2 cm, respectively). Lighter particles are more susceptible to scatter and have comparatively lower LET than heavier ions that are more focused on the central axis of the beam. Low energy particles with higher concentrations away from the central axis are measured by the TEPC (due to its larger physical size) rather than the MicroPlus SOI microdosimeter, resulting in the latter recording higher y D ¯ values. (ii) The proportion of low LET events is higher in the tail region. As the TEPC has a lower threshold for energy detection compared to the MicroPlus, 0.1 keV/μm compared with ~0.4 keV/μm, it was therefore able to detect these lower energy events.
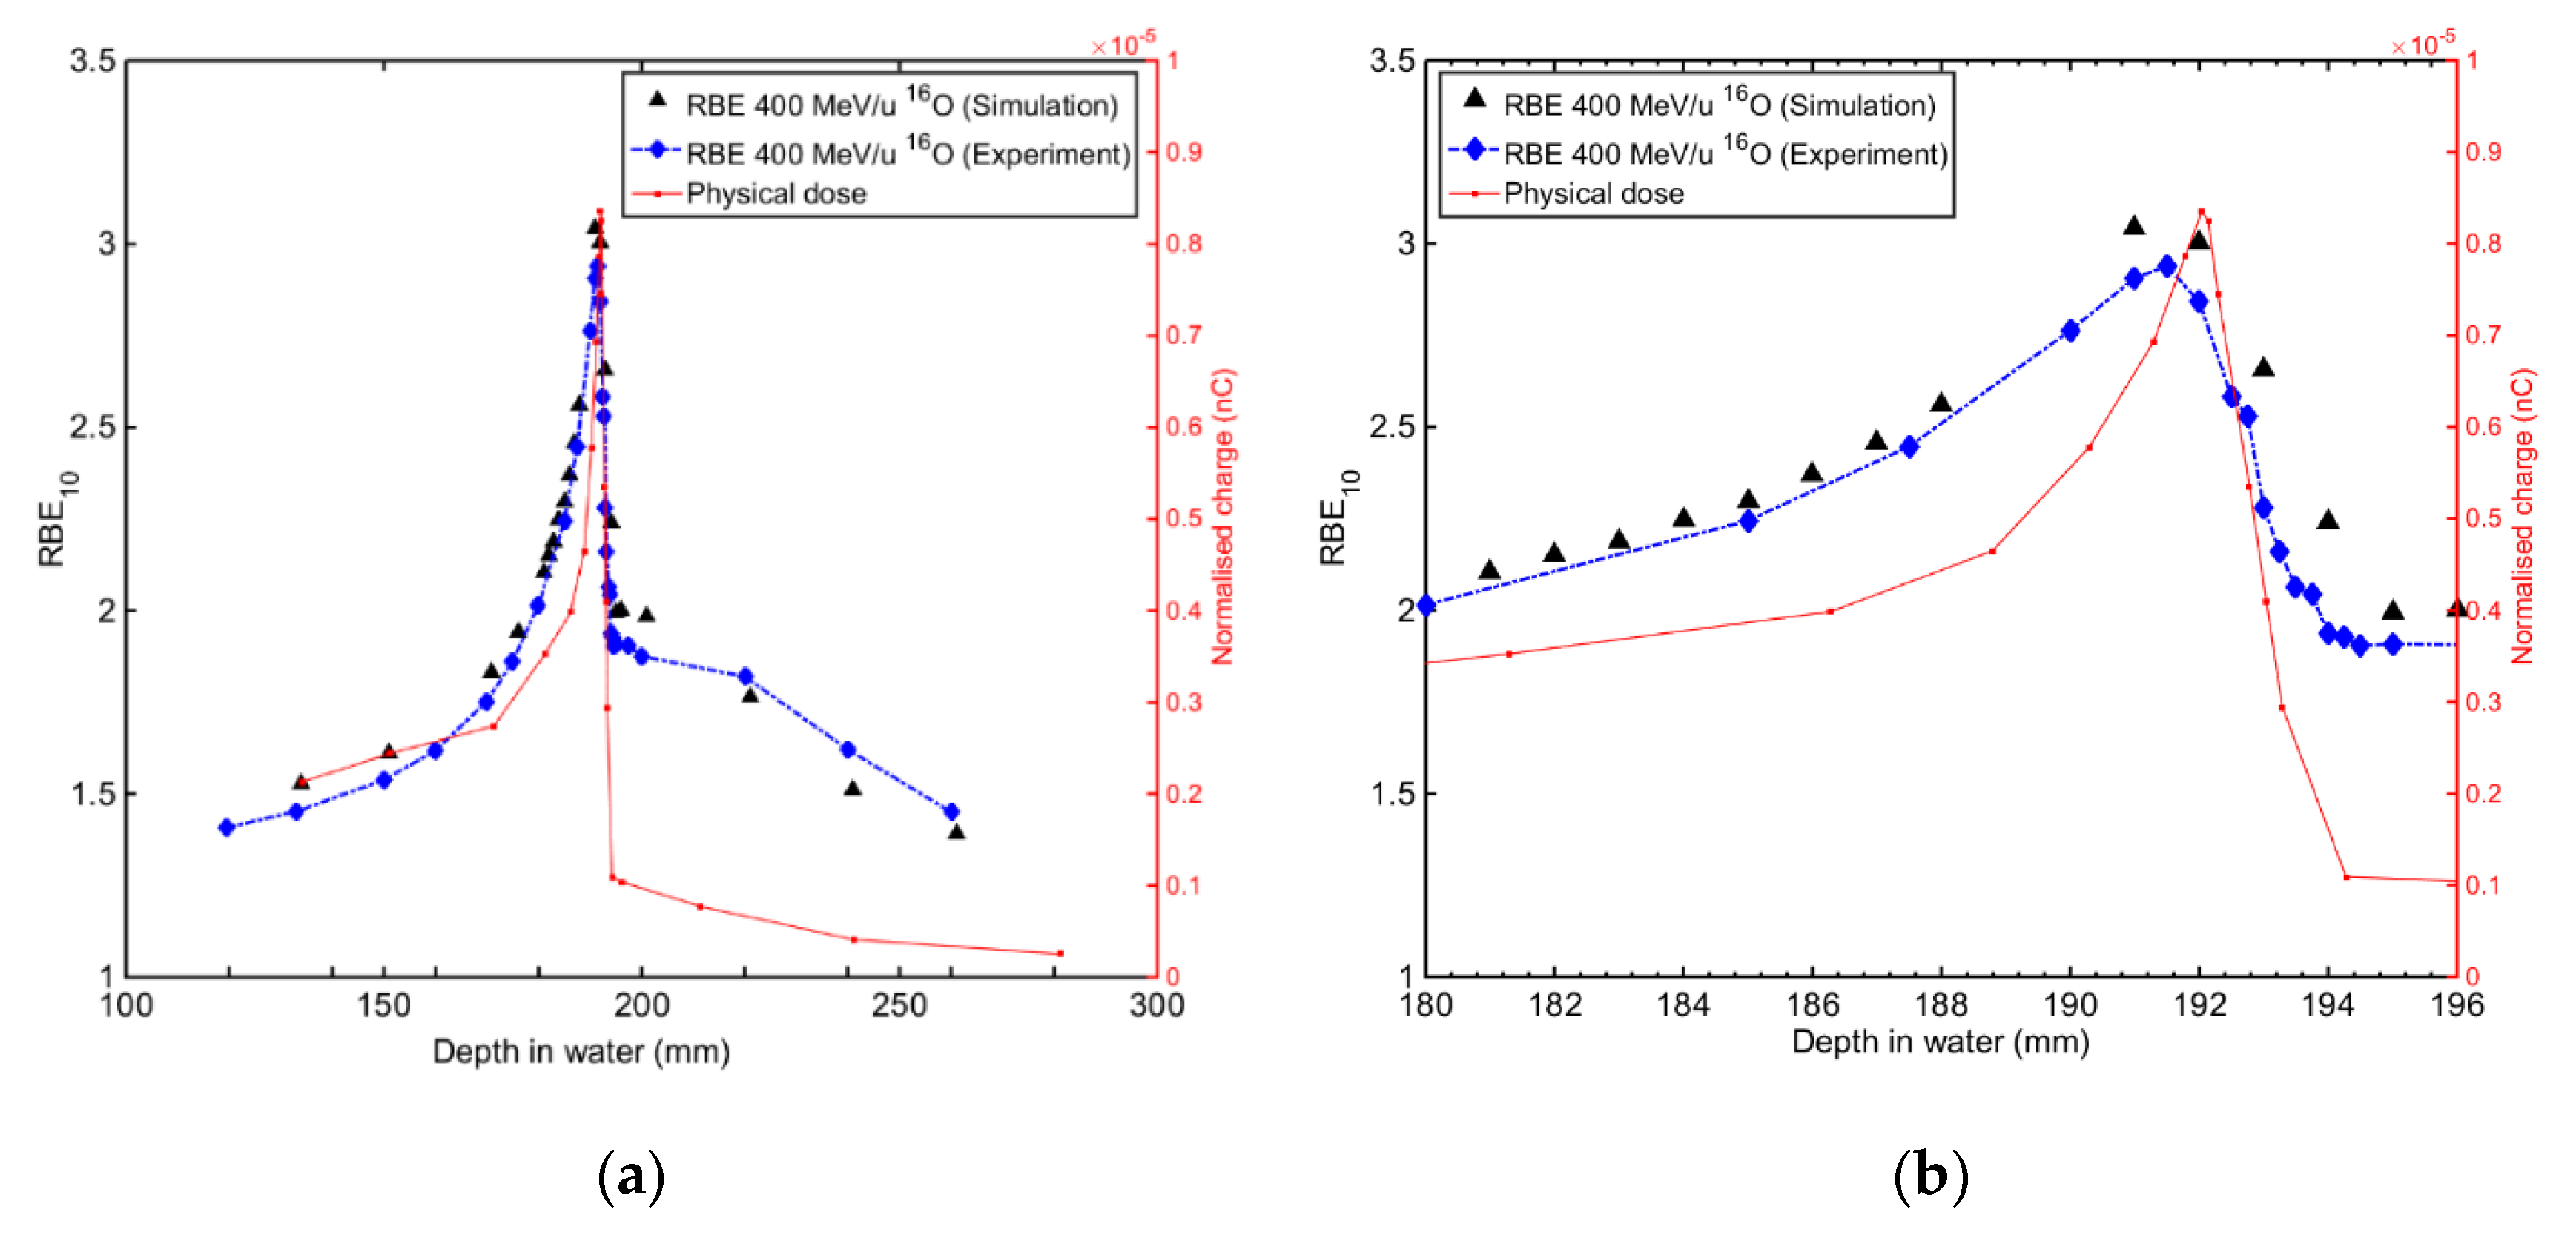
A comparison of RBE10 determined from Geant4 simulation and experimentally derived from SOI microdosimetry measurements for the 400 MeV/u 16O beam is shown in Figure 15a. It can be seen that the maximum RBE10 value of 2.94 was located approximately 1 mm before the BP. This confirms that for Oxygen ions, the depth of the maximum RBE10 occurred slightly earlier than the maximum physical dose. Figure 15b shows a detailed view of RBE10 and the physical dose distribution near the BP region. More detailed results on different types of heavy ions can be found in [32].

4.2.2. Cell Survival Prediction in Proton and Heavy Ion Therapy

Figure 16a,b show a comparison of the survival fraction (SF) for MIA PaCa-2 cells (marker) as reported in [26] for each linear energy transfer (LET) of 16O and 20Ne ions irradiated at NIRS (QST)-HIMAC scanning beam delivery. Solid lines correspond to the SF calculated based on the modified MK model using Equations (2)–(5), where the microdosimetric quantity y D ¯ was measured with the trenched planar Mushroom microdosimeter and the MK model parameters obtained for this cell line. It can be seen that for doses up to 3 Gy, good agreement between the cell SF and calculated SF based on measurements with SOI microdosimeters and MKM was observed for all types of ions. This good agreement emphasized that the SOI 3D Mushroom microdosimeter and the MKM model can be very useful tool to predict the survival of cells for these heavy ion irradiations.
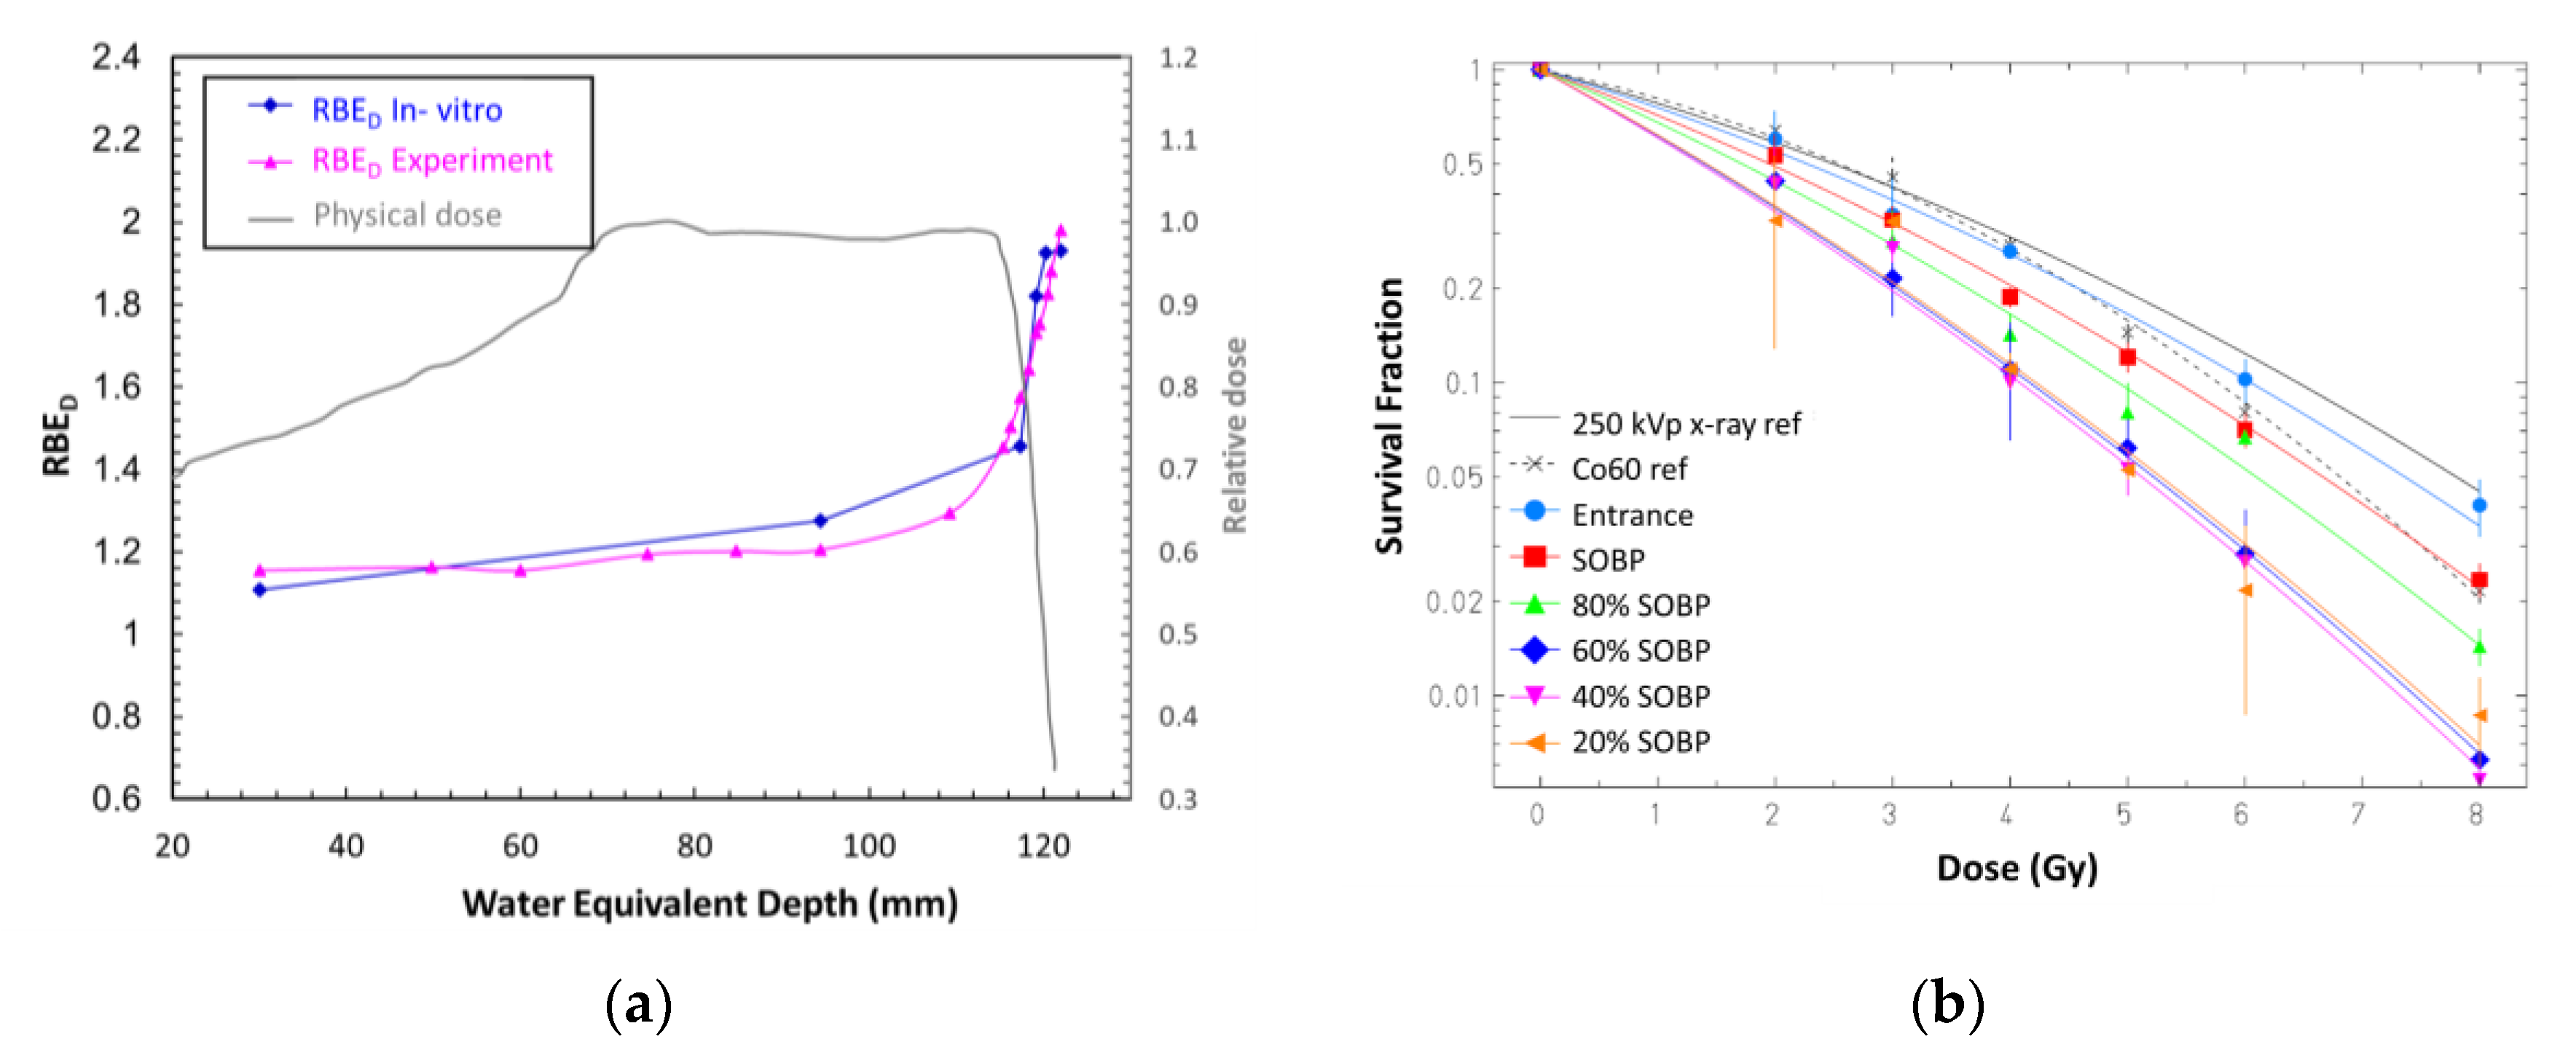
Figure 17a shows the derived RBED distribution obtained with the MicroPlus probe for 2 Gy delivered at the middle of the 50 mm proton SOBP at iThemba Labs proton beam facility, South Africa, compared with RBED values obtained from Chinese hamster ovary (CHO-K1) SF cells measured in vitro in a PMMA phantom (Figure 17b) as well as the physical dose measured at the same position using a MarkusTM ionisation chamber. A 250 kVp x-ray was used as a reference radiation. RBED values were found to increase from 1.21–2.32 along the SOBP. The RBE calculated from the SOI-microdosimeter and MKM method was found to be in good agreement with that obtained from in vitro data within experimental uncertainty. The percentage difference was less than 8% for corresponding water equivalent depths [34].
The results presented provide good justification of the utility of 3D SOI Mushroom microdosimetry for RBE and cell survival prediction in proton therapy.

5. Conclusions

This paper summarises different designs of the 3D SOI Mushroom microdosimeters developed by the Centre for Medical Radiation Physics, University of Wollongong, Australia, and fabricated at SINTEF MiNaLab, Norway. These microdosimeters utilise 3D detector technology, and their application in proton and heavy ion therapy has been demonstrated in collaboration with international partners over the world. The SOI microdosimeters developed with a 3D SV mimicking the size of a biological cell with low noise readout electronics (MicroPlus probe) can be used to predict the LET of and radiobiological response of multiple cell lines to a wide range of ions. SOI microdosimetry detectors with high spatial resolution are very useful for detailed measurements at the end and distal falloff of the SOBP where the LET of charged particles increases significantly. The small size of the SOI detectors for microdosimetry and low power consumption of the battery operated MicroPlus probe allow a compact and fast setup for RBE-related quality assurance (QA) in water or plastic phantoms. This is a necessary step required for verification of the RBE weight dose predicted by treatment planning systems used in clinical particle therapy settings.
This work highlights the essential contribution of Australia to particle therapy research, which will benefit the Australian Bragg Centre for Proton Therapy and Research, currently under construction in Adelaide, and the National Particle Treatment and Research Centre planned at Westmead Hospital, Sydney as well as many other particle therapy centers over the world. The SOI microdosimeters were developed with funding support from National Health and Medical Research Council (NHMRC) of Australia, Australian Research Council (ARC), European Space Agency (ESA) and Norwegian Research Council, Norway.

6. Patents

Anatoly B. Rozenfeld “Method and apparatus for tissue equivalent solid state microdosimetry, U.S. Patent No. 8,421,022 B2, EP 2 102 685 B1.

Author Contributions

L.T.T.: Performed and lead the experiment, data analysis, results discussion and paper writing; D.B.: Helped with Geant4 simulation and results discussion; B.J., V.P., J.V., S.P., L.C., E.D.: Performed experiment, helped with data analysis and paper preparation; S.G.: helped with Geant4 simulation and results discussion; M.P. (Marco Petasecca): Electronics advice and results discussion; M.L.: Results discussion; D.P.: Provided support for experiment preparation in the laboratory at ANSTO and results discussion; Ž.P.: Helped with the IBIC experiment and results discussion. M.P. (Marco Povoli): Fabricated SOI detectors, ran T-CAD simulations and discussed detector characterization results; A.K.: Fabricated SOI detectors and discussed detector characterization results. N.M., T.I. and S.H.L.: Provided beam time at HIMAC, Japan, and support during experiments overseas and results discussion; A.B.R.: lead the project, results discussion and paper writing. All authors have read and agreed to the published version of the manuscript.

Funding

Australian Research Council’s Discovery Projects funding scheme (projects DP 170102273 and DP170102423) and the European Space Agency (ESA) for a grant “Tissue equivalent crew dosimeter based on novel 3D Si processing” Contract No. 4000112670/14/NL/HK. Australian Government Research Training Program Scholarship and Post Graduate Research Award (PGRA) from the Australian Institute of Nuclear Science and Engineering (AINSE).

Acknowledgments

This research was supported by the Australian Government through the Australian Research Council’s Discovery Projects funding scheme (projects DP 170102273 and DP170102423) and a grant from the European Space Agency (ESA): “Tissue equivalent crew dosimeter based on novel 3D Si processing” Contract No. 4000112670/14/NL/HK. The authors wish to acknowledge the National Collaborative Research Infrastructure Strategy (NCRIS) funding provided by the Australian Government for this research. The authors would like to acknowledge Andrew See at the UNSW ANFF node for packaging work as well as Elena Pereloma and Mitchell Nancarrow at the Australian Institute for Innovative Materials, University of Wollongong, for their excellent imaging work. The authors would like to acknowledge Evan De Kok, Charlot Vandevoorde and their team at Ithemba labs for their support during the experiment and the Physics Advisory Committee of NRF iThemba LABS for the beam time allocation. Finally, the authors thank all collaborators in the 3D-MiMiC project, funded by the Norwegian Research Council via the NANO2021 program.

Conflicts of Interest

The authors declare no conflict of interest.

References

  1. Paganetti, H. Proton Relative Biological Effectiveness—Uncertainties and Opportunities. Int. J. Part. Ther. 2018, 5, 2–14. [Google Scholar] [CrossRef] [Green Version]
  2. Lühr, A.; von Neubeck, C.; Pawelke, J.; Seidlitz, A.; Peitzsch, C.; Bentzen, S.M.; Bortfeld, T.; Debus, J.; Deutsch, E.; Langendijk, J.A.; et al. “Radiobiology of Proton Therapy”: Results of an international expert workshop. Radiother. Oncol. 2018, 128, 56–67. [Google Scholar] [CrossRef]
  3. Paganetti, H. Relative biological effectiveness (RBE) values for proton beam therapy. Variations as a function of biological endpoint, dose, and linear energy transfer. Phys. Med. Biol. 2014, 59, R419–R472. [Google Scholar] [CrossRef] [PubMed]
  4. Conte, V.; Bianchi, A.; Selva, A.; Petringa, G.; Cirrone, G.; Parisi, A.; Vanhavere, F.; Colautti, P. Microdosimetry at the CATANA 62 MeV proton beam with a sealed miniaturized TEPC. Phys. Medica 2019, 64, 114–122. [Google Scholar] [CrossRef]
  5. Rosenfeld, A.B. Novel detectors for silicon based microdosimetry, their concepts and applications. NIM A 2016, 809, 156–170. [Google Scholar] [CrossRef]
  6. Bradley, P.; Rosenfeld, A.; Lee, K.; Jamieson, D.; Heiser, G.; Satoh, S. Charge collection and radiation hardness of a SOI microdosimeter for medical and space applications. IEEE Trans. Nucl. Sci. 1998, 45, 2700–2710. [Google Scholar] [CrossRef] [PubMed] [Green Version]
  7. Cornelius, I.; Siegele, R.; Rosenfeld, A.; Cohen, D.D. Ion beam induced charge characterisation of a silicon microdosimeter using a heavy ion microprobe. Nucl. Instruments Methods Phys. Res. Sect. B Beam Interact. Mater. At. 2002, 190, 335–338. [Google Scholar] [CrossRef]
  8. Ziebell, A.L.; Lim, W.H.; Reinhard, M.I.; Cornelius, I.; Prokopovich, D.A.; Siegele, R.; Dzurak, A.S.; Rosenfeld, A. A Cylindrical Silicon-on-Insulator Microdosimeter: Charge Collection Characteristics. IEEE Trans. Nucl. Sci. 2008, 55, 3414–3420. [Google Scholar] [CrossRef] [Green Version]
  9. Lim, W.H.; Ziebell, A.L.; Cornelius, I.; Reinhard, M.I.; Prokopovich, D.A.; Dzurak, A.S.; Rosenfeld, A. Cylindrical Silicon-on-Insulator Microdosimeter: Design, Fabrication and TCAD Modeling. IEEE Trans. Nucl. Sci. 2009, 56, 424–428. [Google Scholar] [CrossRef]
  10. Lai, N.S.; Lim, W.H.; Ziebell, A.L.; Reinhard, M.I.; Rosenfeld, A.; Dzurak, A.S. Development and Fabrication of Cylindrical Silicon-on-Insulator Microdosimeter Arrays. IEEE Trans. Nucl. Sci. 2009, 56, 1637–1641. [Google Scholar] [CrossRef] [Green Version]
  11. Livingstone, J.; Prokopovich, D.A.; Lerch, M.L.F.; Reinhard, M.I.; Ziegler, J.F.; Pisacane, V.L.; Dicello, J.F.; Perevertaylo, V.L.; Rosenfeld, A.; Petasecca, M.; et al. Large Area Silicon Microdosimeter for Dosimetry in High LET Space Radiation Fields: Charge Collection Study. IEEE Trans. Nucl. Sci. 2012, 59, 3126–3132. [Google Scholar] [CrossRef]
  12. Parker, S.; Kenney, C.; Segal, J. 3D—A proposed new architecture for solid-state radiation detectors. Nucl. Instrum. Methods Phys. Res. Sect. A Accel. Spectrometers Detect. Assoc. Equip. 1997, 395, 328–343. [Google Scholar] [CrossRef]
  13. Hansen, T.-E.; Kok, A.; A Hansen, T.; Lietaer, N.; Mielnik, M.; Storås, P.; Da Via, C.; Hasi, J.; Kenney, C.; Parker, S. First fabrication of full 3D-detectors at SINTEF. J. Instrum. 2009, 4, P03010. [Google Scholar] [CrossRef]
  14. Hawkins, R.B. A Statistical Theory of Cell Killing by Radiation of Varying Linear Energy Transfer. Radiat Res. 1994, 140, 366. [Google Scholar] [CrossRef] [PubMed]
  15. Hawkins, R.B. A Microdosimetric-Kinetic Model for the Effect of Non-Poisson Distribution of Lethal Lesions on the Variation of RBE with LET. Radiat Res. 2003, 160, 61–69. [Google Scholar] [CrossRef] [PubMed]
  16. Kase, Y.; Kanai, T.; Matsumoto, Y.; Furusawa, Y.; Okamoto, H.; Asaba, T.; Sakama, M.; Shinoda, H. Microdosimetric measurements and estimation of human cell survival for heavy-ion beams. Radiat Res. 2006, 166, 629–638. [Google Scholar] [CrossRef] [PubMed]
  17. Sato, T.; Kase, Y.; Watanabe, R.; Niita, K.; Sihver, L. Biological Dose Estimation for Charged-Particle Therapy Using an Improved PHITS Code Coupled with a Microdosimetric Kinetic Model. Radiat Res. 2009, 171, 107–117. [Google Scholar] [CrossRef] [PubMed]
  18. Nose, H.; Kase, Y.; Matsufuji, N.; Kanai, T. Field size effect of radiation quality in carbon therapy using passive method. Med. Phys. 2009, 36, 870–875. [Google Scholar] [CrossRef] [PubMed]
  19. Bolst, D.; Guatelli, S.; Tran, L.T.; Chartier, L.; Lerch, M.; Matsufuji, N.; Rosenfeld, A. Correction factors to convert microdosimetry measurements in silicon to tissue in 12C ion therapy. Phys. Med. Biol. 2017, 62, 2055–2069. [Google Scholar] [CrossRef] [PubMed] [Green Version]
  20. Kase, Y.; Yamashita, W.; Matsufuji, N.; Takada, K.; Sakae, T.; Furusawa, Y.; Yamashita, H.; Murayama, S. Microdosimetric calculation of relative biological effectiveness for design of therapeutic proton beams. J. Radiat Res. 2013, 54, 485–493. [Google Scholar] [CrossRef] [PubMed] [Green Version]
  21. Tran, L.T.; Chartier, L.; Prokopovich, D.A.; Bolst, D.; Povoli, M.; Summanwar, A.; Kok, A.; Pogossov, A.; Petasecca, M.; Guatelli, S.; et al. Thin silicon microdosimeter utilizing 3-D MEMS fabrication technology: Charge collection study and its application in mixed radiation fields. IEEE Trans. Nucl. Sci. 2018, 65, 467–472. [Google Scholar] [CrossRef] [Green Version]
  22. James, B.; Tran, L.T.; Vohradsky, J.; Bolst, D.; Pan, V.; Carr, M.; Guatelli, S.; Pogossov, A.; Petasecca, M.; Lerch, M.; et al. SOI Thin Microdosimeter Detectors for Low Energy Ions and Radiation Damage Studies. IEEE Trans. Nucl. Sci. 2019, 66, 320–326. [Google Scholar] [CrossRef]
  23. Pastuovic, Z.; Siegele, R.; Cohen, D.D.; Mann, M.; Ionescu, M.; Button, D.; Long, S. The new confocal heavy ion microprobe beamline at ANSTO: The first microprobe resolution tests and applications for elemental imaging and analysis. Nucl. Instrum. Methods Phys. Res. B Beam Interact. Mater. At. 2017, 404, 1–8. [Google Scholar] [CrossRef]
  24. Pastuovic, Z.; Davis, J.; Tran, T.L.; Paino, J.R.; Dipuglia, A.; James, B.; Povoli, M.; Kok, A.; Perevertaylo, V.L.; Siegele, R.; et al. IBIC microscopy—The powerful tool for testing micron—Sized sensitive volumes in segmented radiation detectors used in synchrotron microbeam radiation and hadron therapies. Nucl. Instrum. Methods Phys. Res. B Beam Interact. Mater. At. 2019, 458, 90–96. [Google Scholar] [CrossRef]
  25. James, B.; Tran, L.T.; Bolst, D.; Prokopovich, D.; Reinhard, M.; Lerch, M.; Petasecca, M.; Guatelli, S.; Povoli, M.; Kok, A.; et al. 3D sensitive volume microdosimeter with improved tissue equivalency: Charge collection study and its application in 12C ion therapy. J. Phys. Conf. Ser. 2019, 1154, 012012. [Google Scholar] [CrossRef]
  26. Inaniwa, T.; Suzuki, M.; Lee, S.-H.; Mizushima, K.; Iwata, Y.; Kanematsu, N.; Shirai, T. Experimental validation of stochastic microdosimetric kinetic model for multi-ion therapy treatment planning with helium-, carbon-, oxygen-, and neon-ion beams. Phys. Med. Biol. 2020, 65, 045005. [Google Scholar] [CrossRef] [PubMed]
  27. Lee, S.H.; Mizushima, K.; Kohno, R.; Iwata, Y.; Yonai, S.; Shirai, T.; A Pan, V.; Bolst, D.; Tran, L.T.; Rosenfeld, A.B.; et al. Estimating the biological effects of helium, carbon, oxygen, and neon ion beams using 3D silicon microdosimeters. Phys. Med. Biol. 2021, 66, 045017. [Google Scholar] [CrossRef]
  28. Allison, J.; Amako, K.; Apostolakis, J.; Araujo, H.; Arce Dubois, P.; Asai, M.; Barrand, G.; Capra, R.; Chauvie, S.; Chytracek, R.; et al. Geant4 developments and applications. IEEE Trans. Nucl. Sci. 2006, 53, 270–278. [Google Scholar] [CrossRef] [Green Version]
  29. Agostinelli, S.; Allison, J.; Amako, K. Geant4 -a simulation toolkit. Nucl. Instrum. Methods Phys. Res. Sect. A Accel. Spectrometers Detect. Assoc. Equip. 2003, 506, 250–303. [Google Scholar] [CrossRef] [Green Version]
  30. Torikoshi, M.; Minohara, S.; Kanematsu, N.; Komori, M.; Kanazawa, M.; Noda, K.; Miyahara, N.; Itoh, H.; Endo, M.; Kanai, T. Irradiation System for HIMAC. J. Radiat Res. 2007, 48, A15–A25. [Google Scholar] [CrossRef] [Green Version]
  31. Arce, P.; Bolst, D.; Bordage, M.-C.; Brown, J.M.C.; Cirrone, P.; Cortés-Giraldo, M.A.; Cutajar, D.; Cuttone, G.; Desorgher, L.; Dondero, P.; et al. Report on G4-Med, a Geant4 benchmarking system for medical physics applications developed by the Geant4 Medical Simulation Benchmarking Group. Med. Phys. 2021, 48, 19–56. [Google Scholar] [CrossRef]
  32. Tran, L.T.; Bolst, D.; Guatelli, S.; Pogossov, A.; Petasecca, M.; Lerch ML, F.; Chartier, L.; Prokopovich, D.A.; Reinhard, M.I.; Povoli, M.; et al. The relative biological effectiveness for carbon, nitrogen and oxygen ion beams using passive and scanning techniques evaluated with fully 3D silicon microdosimeters. Med. Phys. 2018, 45, 2299–2308. [Google Scholar] [CrossRef] [Green Version]
  33. Kase, Y.; Kanai, T.; Sakama, M.; Tameshige, Y.; Himukai, T.; Nose, H.; Matsufuji, N. Microdosimetric approach to NIRS-defined biological dose measurement for carbon-ion treatment beam. J. Radiat. Res. 2011, 52, 59–68. [Google Scholar] [CrossRef] [Green Version]
  34. Debrot, E.; Tran, L.; Chartier, L.; Bolst, D.; Guatelli, S.; Vandevoorde, C.; Kock, E.; Beukes, P.; Symons, J.; Nieto Camero, J.; et al. SOI microdosimetry and modified MKM for evaluation of relative biological effectiveness for a passive proton therapy radiation field. Phys. Med. Biol. 2018, 63, 235007. [Google Scholar] [CrossRef]
Figure 1. Cross-sectional and top-view schematic of the planar structure of the microdosimeter.
Applsci 12 00328 g001
Figure 2. Scanning electron microscope (SEM) image of the 2-µm-thick Mushroom microdosimeter. (a) A surface scan showing a number of SVs, (b) a zoomed-in image of a single SV and (c) a cross-sectional scan of a single SV.
Applsci 12 00328 g002
Figure 3. (a) Simplified schematic of a trenched-3D microdosimeter with a voided p+ trench and a voided n+ trench and (b) SEM image of the trenched-3D design of a single 3D Mushroom microdosimeter SV [21].
Applsci 12 00328 g003
Figure 4. (a) A simplified schematic of the trenched 3D Mushroom microdosimeter with a p+-doped trench filled with polysilicon and planar n+ core (trenched-planar) and (b) SEM image of the trenched 3D Mushroom microdosimeter with a planar core SV array [22].
Applsci 12 00328 g004
Figure 5. (a) Design of the free-standing 3D SV embedded in tissue-equivalent material and (b) SEM image of the 3D Mushroom microdosimeter with free-standing 3D SV and surrounding silicon removed.
Applsci 12 00328 g005
Figure 6. 2D structures used for numerical simulations of (a) the Trenched-3D and (b) Trenched-planar sensors. The figures also show the drift lines based on the simulated electric field.
Applsci 12 00328 g006
Figure 7. Comparison of the radial charge collection profiles for the Trenched-3D and Trenched-planar structures in response to a 5.5 MeV alpha particle for SOI thickness of 10 µm.
Applsci 12 00328 g007
Figure 8. Charge collection median energy map of the 2µm-thick Mushroom-p microdosimeter at 10 V bias for (a) a single SV and (b) an array of SVs.
Applsci 12 00328 g008
Figure 9. Trenched 3D Mushroom microdosimeter in response to a 5.5 MeV He2+ ion microbeam (a) MCA spectrum and window energy map corresponding to low energy events and (b) full charge collection energy map of the even array at 10 V bias. The odd array was grounded [21].
Applsci 12 00328 g009
Figure 10. Response of the array of the trenched planar Mushroom microdosimeter to a He2+ ion microbeam: (a) Median energy map of four SVs (5 µm thick) in response to a 3 MeV He2+ ion microbeam and (b) full array (10 µm thick) in response to a 5.5 MeV He2+ ion microbeam at a 10 V bias [22].
Applsci 12 00328 g010
Figure 11. Response of the array of the 10-µm-thick free-standing Mushroom microdosimeter embedded in polyimide to a 5.5 MeV He2+ ion microbeam (a) Median energy map of a zoomed-in scan of a single SV and (b) a full array at 10 V bias [25].
Applsci 12 00328 g011
Figure 12. Diagram of the HIMAC biological beamline (not to scale) [32].
Applsci 12 00328 g012
Figure 13. Microdosimetric spectra obtained by free-standing Mushroom microdosimeter embedded in Polyimide for 290 MeV/u SOBP 12C ions at HIMAC [25].
Applsci 12 00328 g013
Figure 14. RBE10 distribution obtained by the free-standing Mushroom microdosimeter embedded in Polyimide in response to 290 MeV/u SOBP 12C ions at HIMAC in comparison with the TEPC data [33].
Applsci 12 00328 g014
Figure 15. (a) RBE10 distribution obtained with the MicroPlus Mushroom microdosimeters versus depth in water for the 400 MeV/u 16O pristine BP, (b) zoomed-in view of RBE10 distribution [32].
Applsci 12 00328 g015
Figure 16. Survival fraction of in vitro data of the MIA PaCa-2 cells (markers) reported in [26] for each LET of pristine (a) oxygen, and (b) neon ion beams and the survival curves calculated by substituting the physical dose and lineal energy measured using the SOI MicroPlus-Mushroom microdosimeter for the MK model parameters of 𝛼0 = 0.001 Gy−1, 𝛽 = 0.085 Gy−2, 𝑅𝑛 = 6.8 µm, 𝑟𝑑 = 0.57 µm and 𝑦0 = 260 keV/µm (solid lines) [27].
Applsci 12 00328 g016
Figure 17. (a) Comparison of RBE values obtained from in vitro CHO-K1 cell survival curves and those values obtained using the modified MKM with CHO cell parameters and lineal energy measured with the SOI 3D Mushroom microdosimeter for 2 Gy (RBED) delivered at the middle of the SOBP. A 250 kVp X-ray was used as a reference radiation. (b) CHO-K1 cell survival curves measured in vitro along the proton SOBP in a PMMA phantom [34].
Applsci 12 00328 g017
Publisher’s Note: MDPI stays neutral with regard to jurisdictional claims in published maps and institutional affiliations.