
Silicon 3D Microdosimeters for Advanced Quality Assurance in Particle Therapy

 , ,
, , 
Abstract
:1. Introduction
2. Principles of Microdosimetry and Its Application for RBE Prediction
3. Silicon on Insulator (SOI) Detector for Microdosimetry
3.1. Design of SOI Detectors
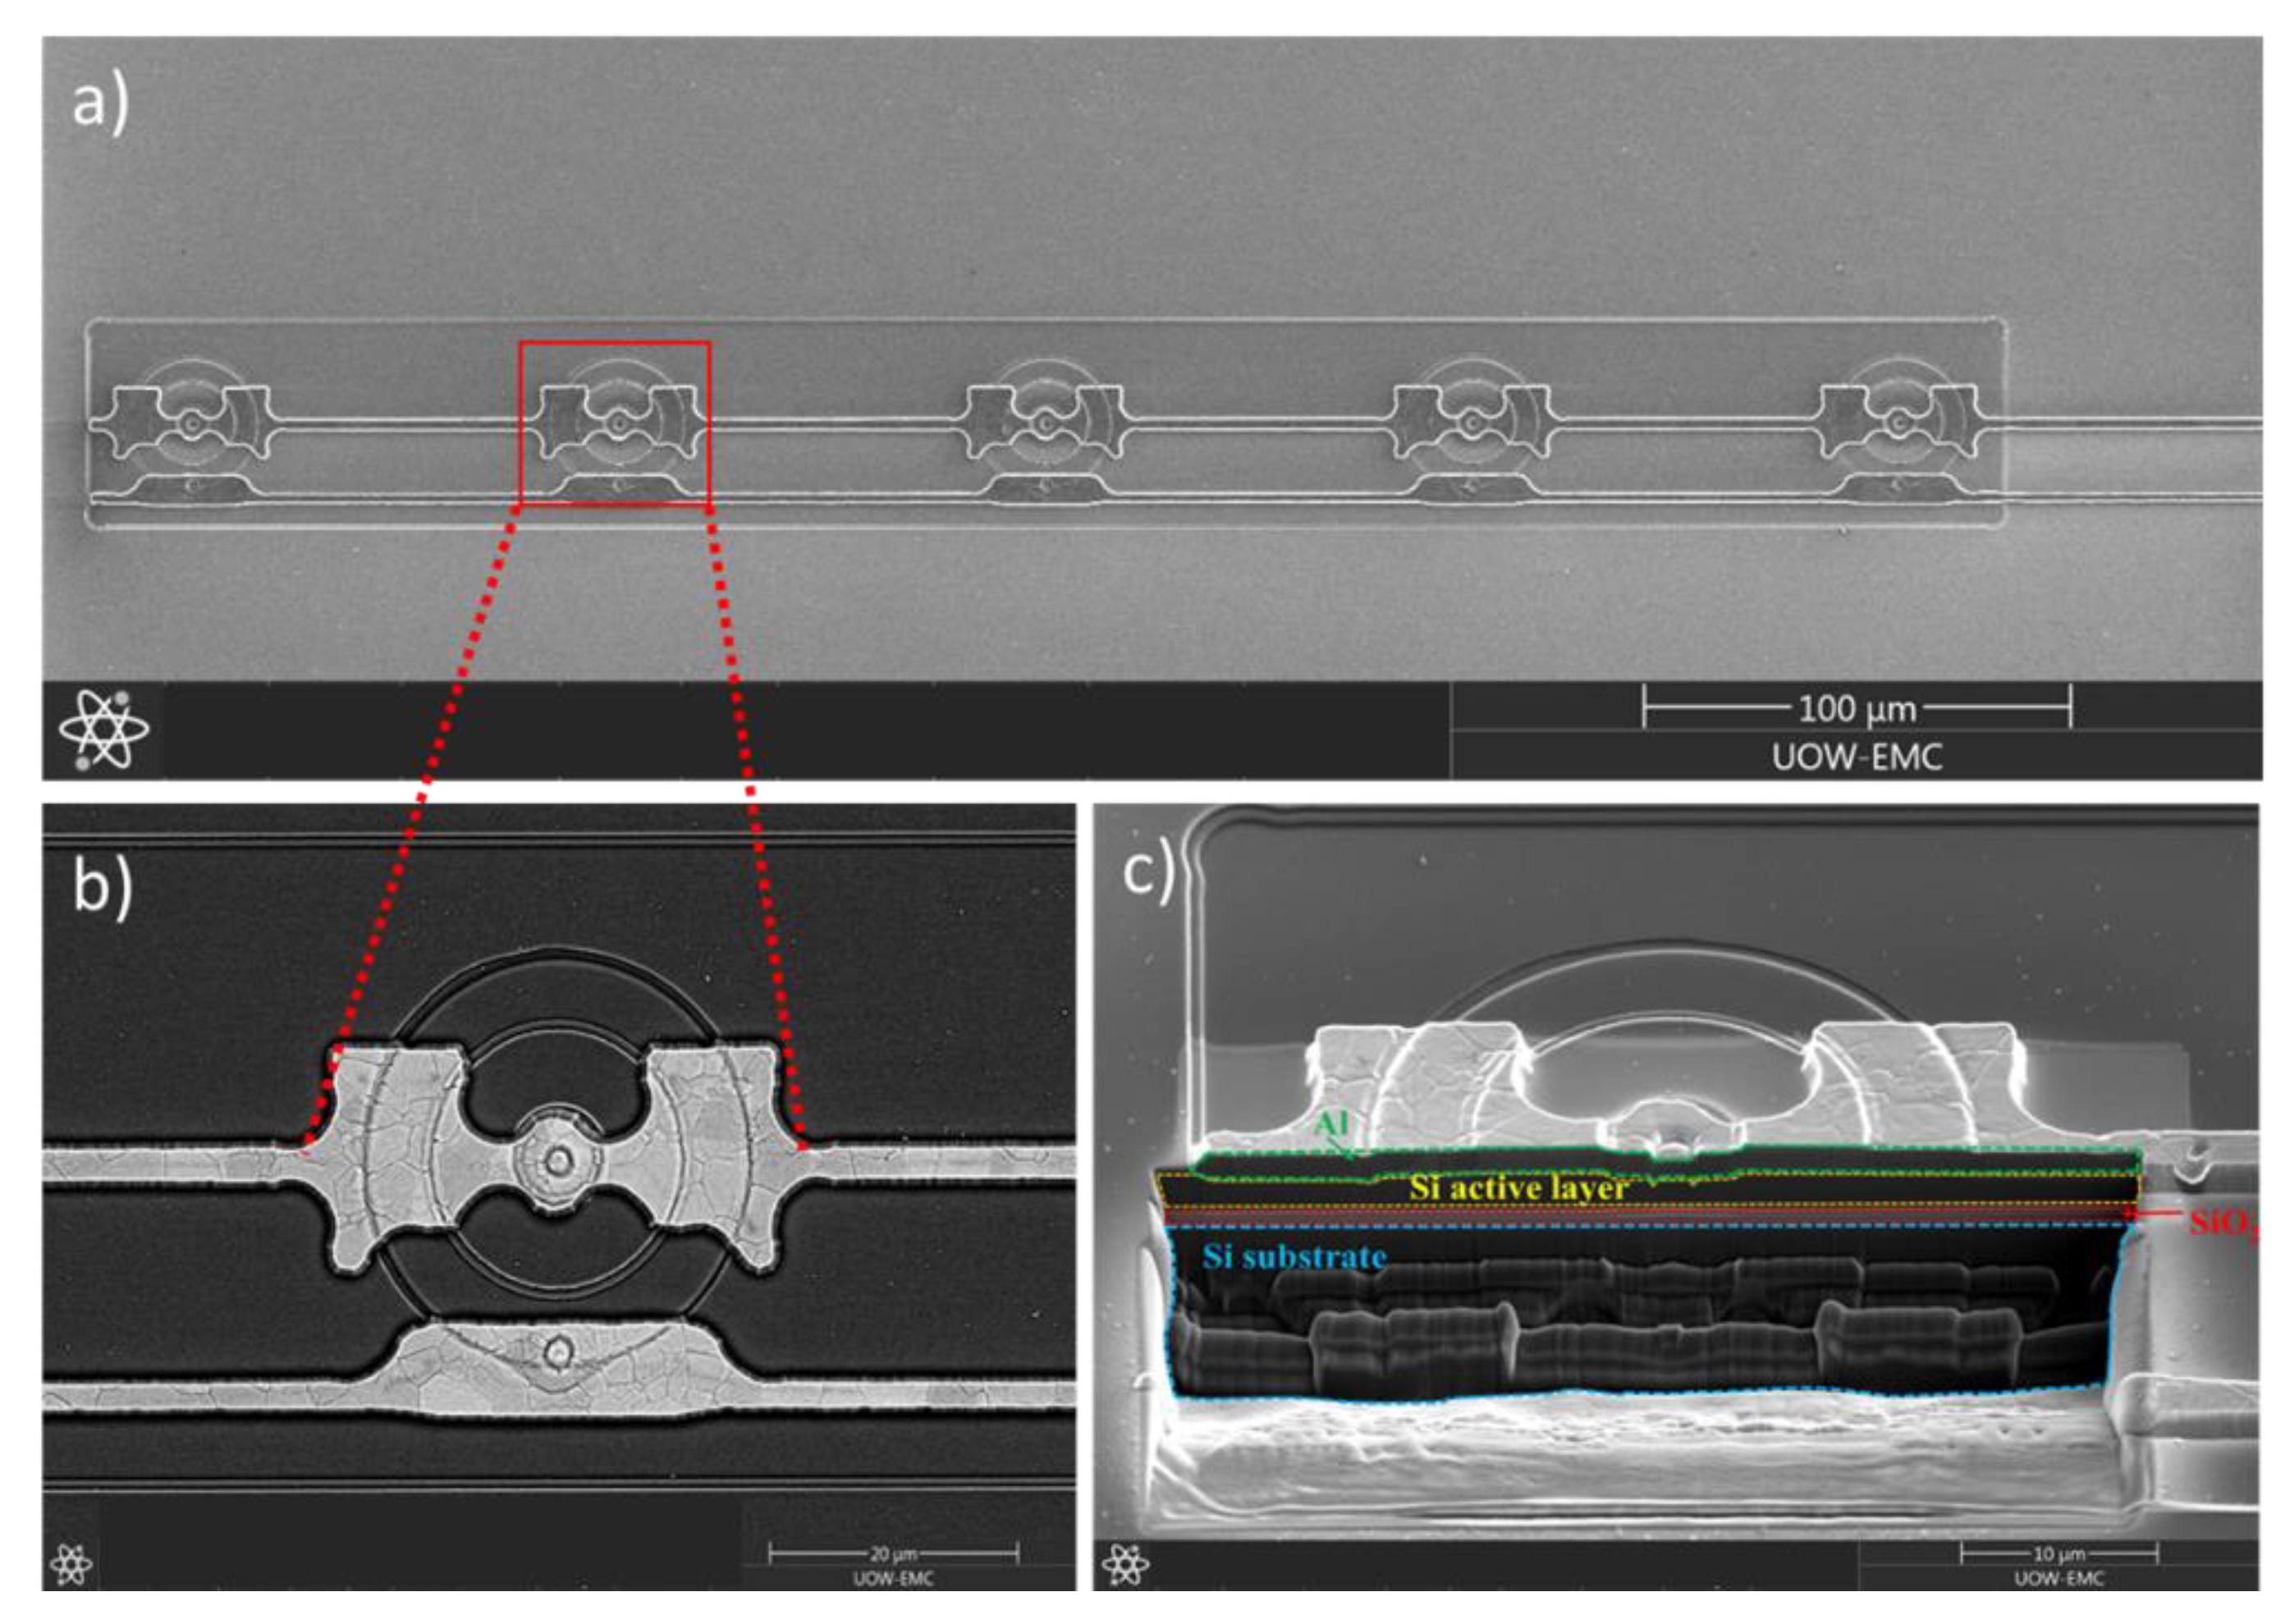
3.1.1. The 2-µm-Thick Mushroom Microdosimeter Fabricated by Planar Technology
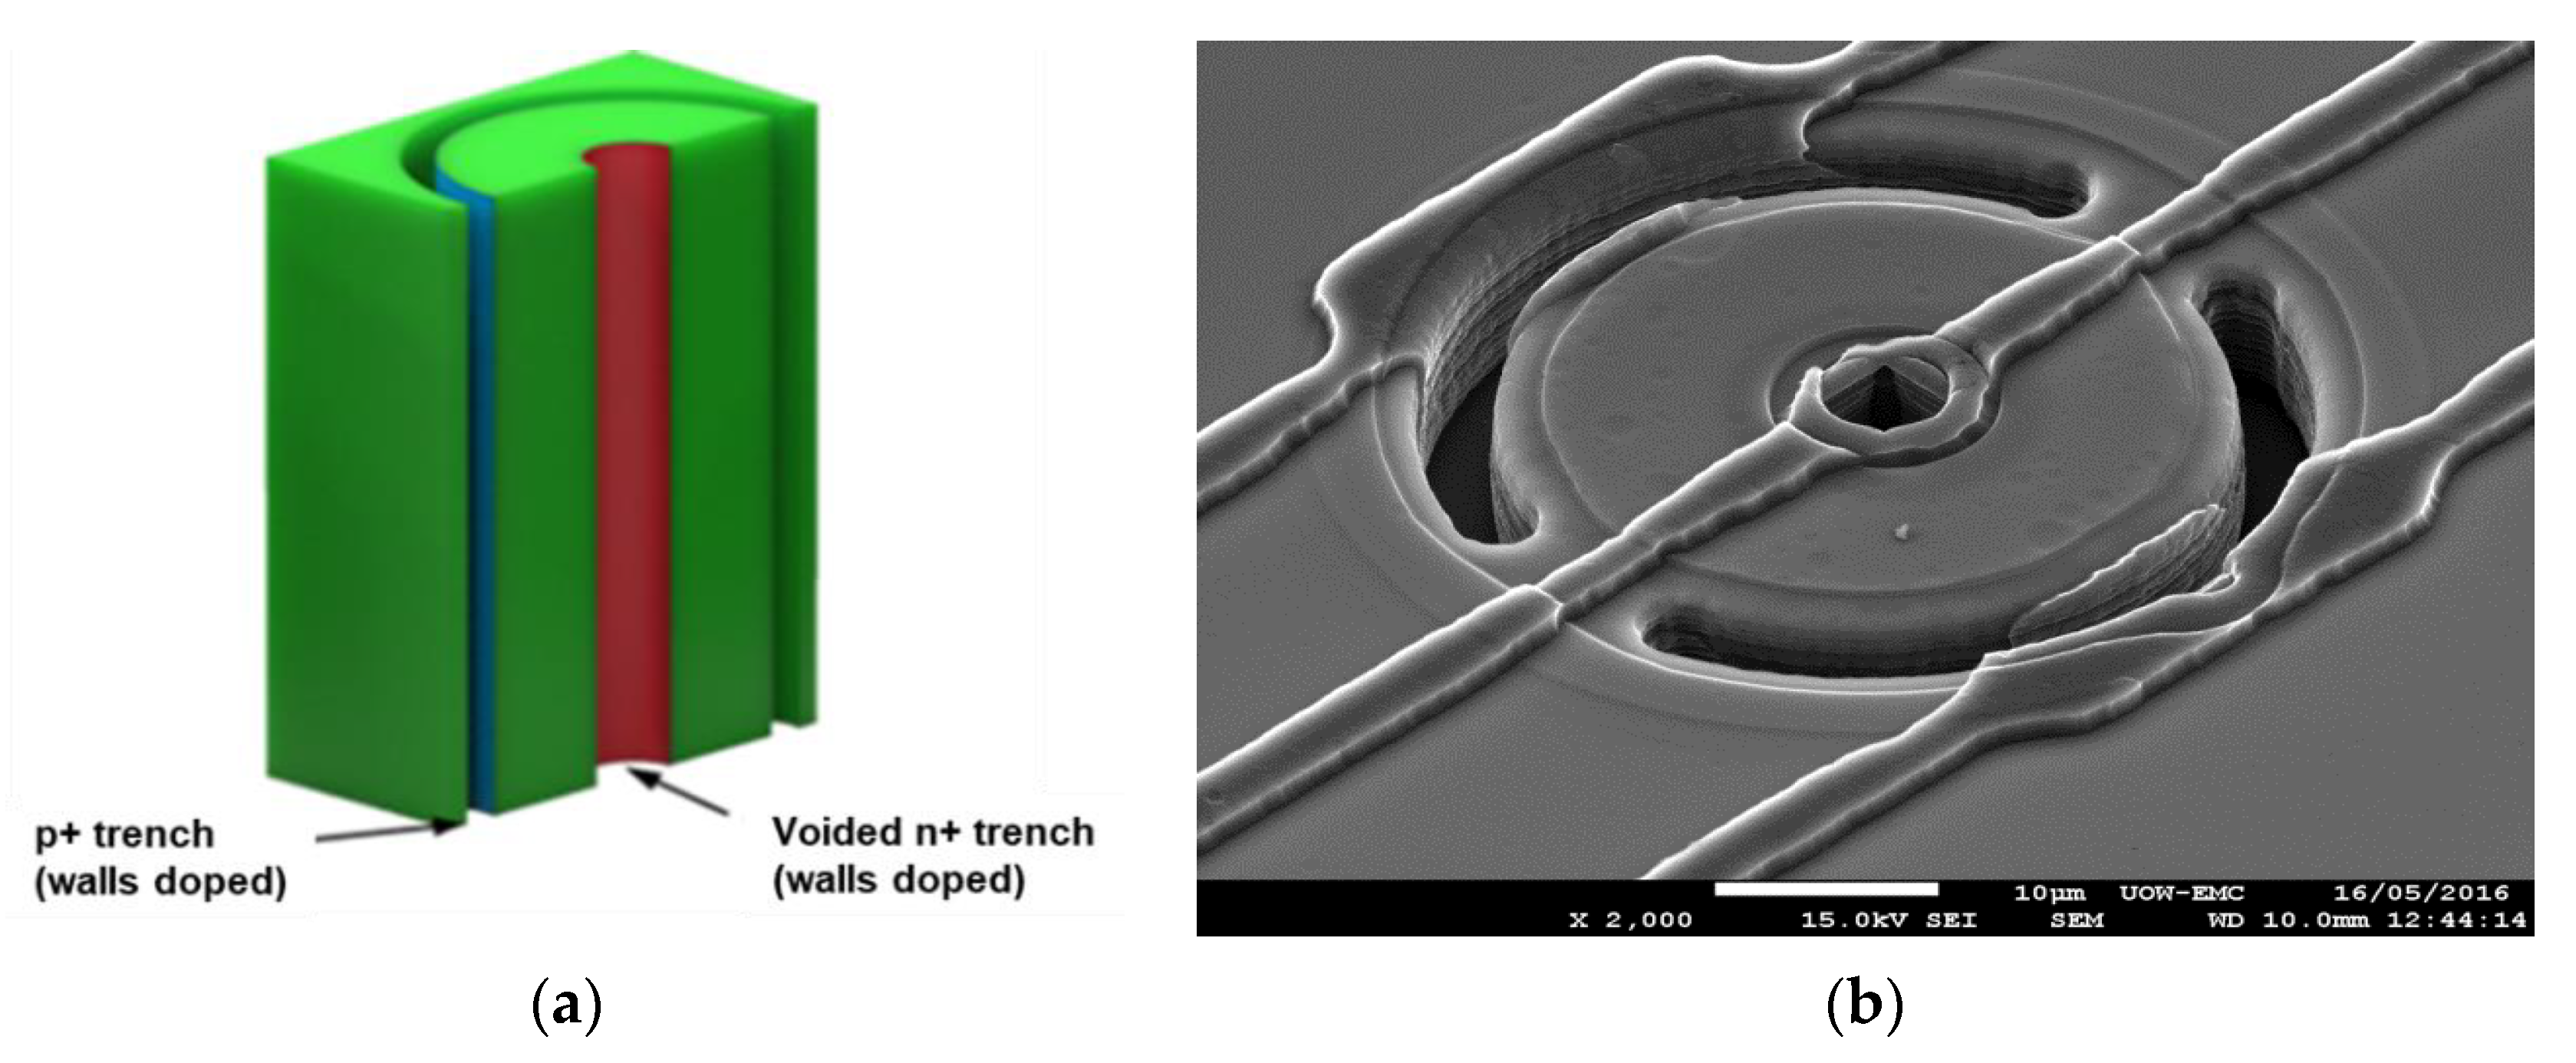
3.1.2. Trenched-3D Mushroom Microdosimeter Fabricated by 3D Detector Technology
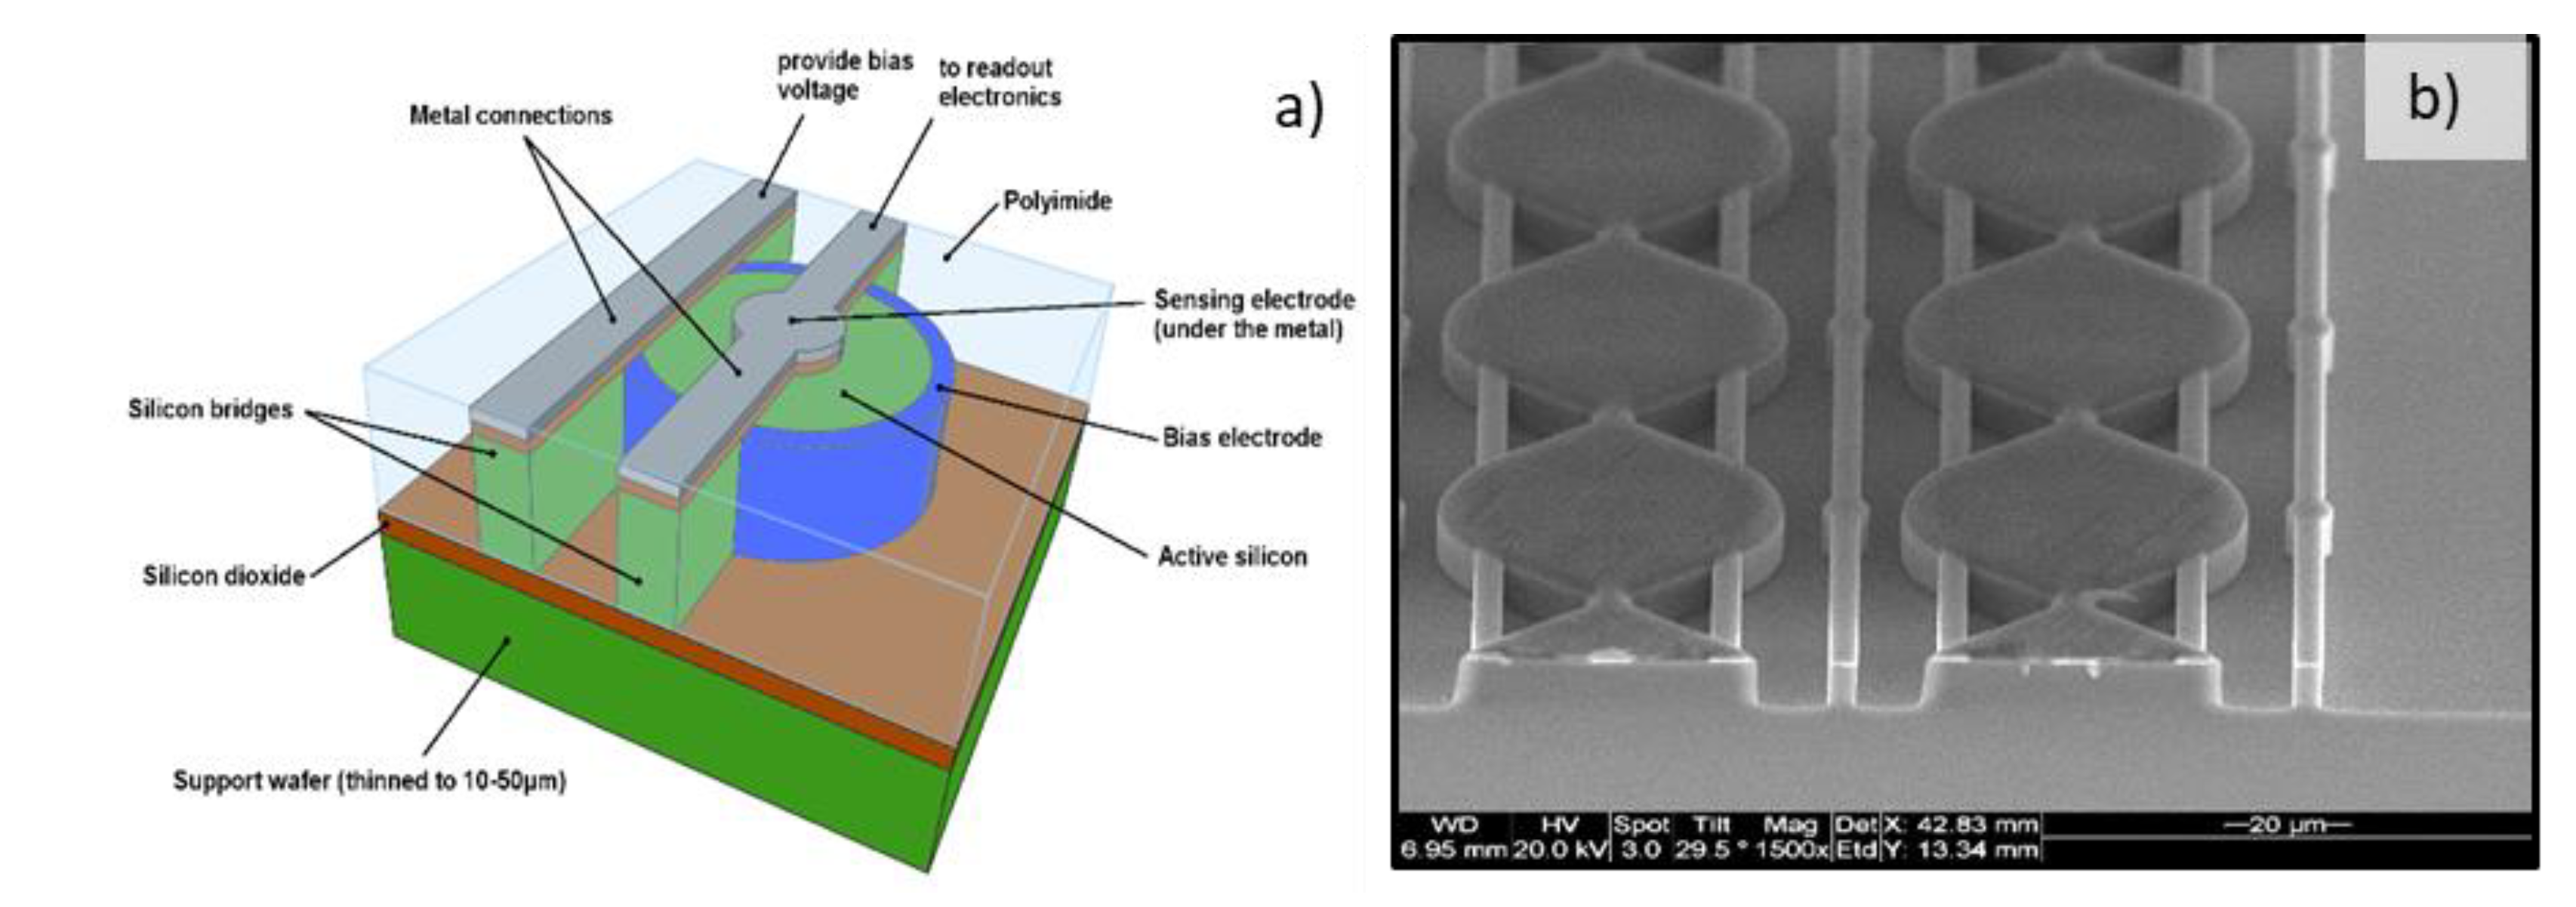
3.1.3. Trenched-3D Mushroom Microdosimeter with a Planar Core Electrode
3.1.4. Free-Standing 3D Mushroom Microdosimeter Embedded in Tissue Equivalent Material
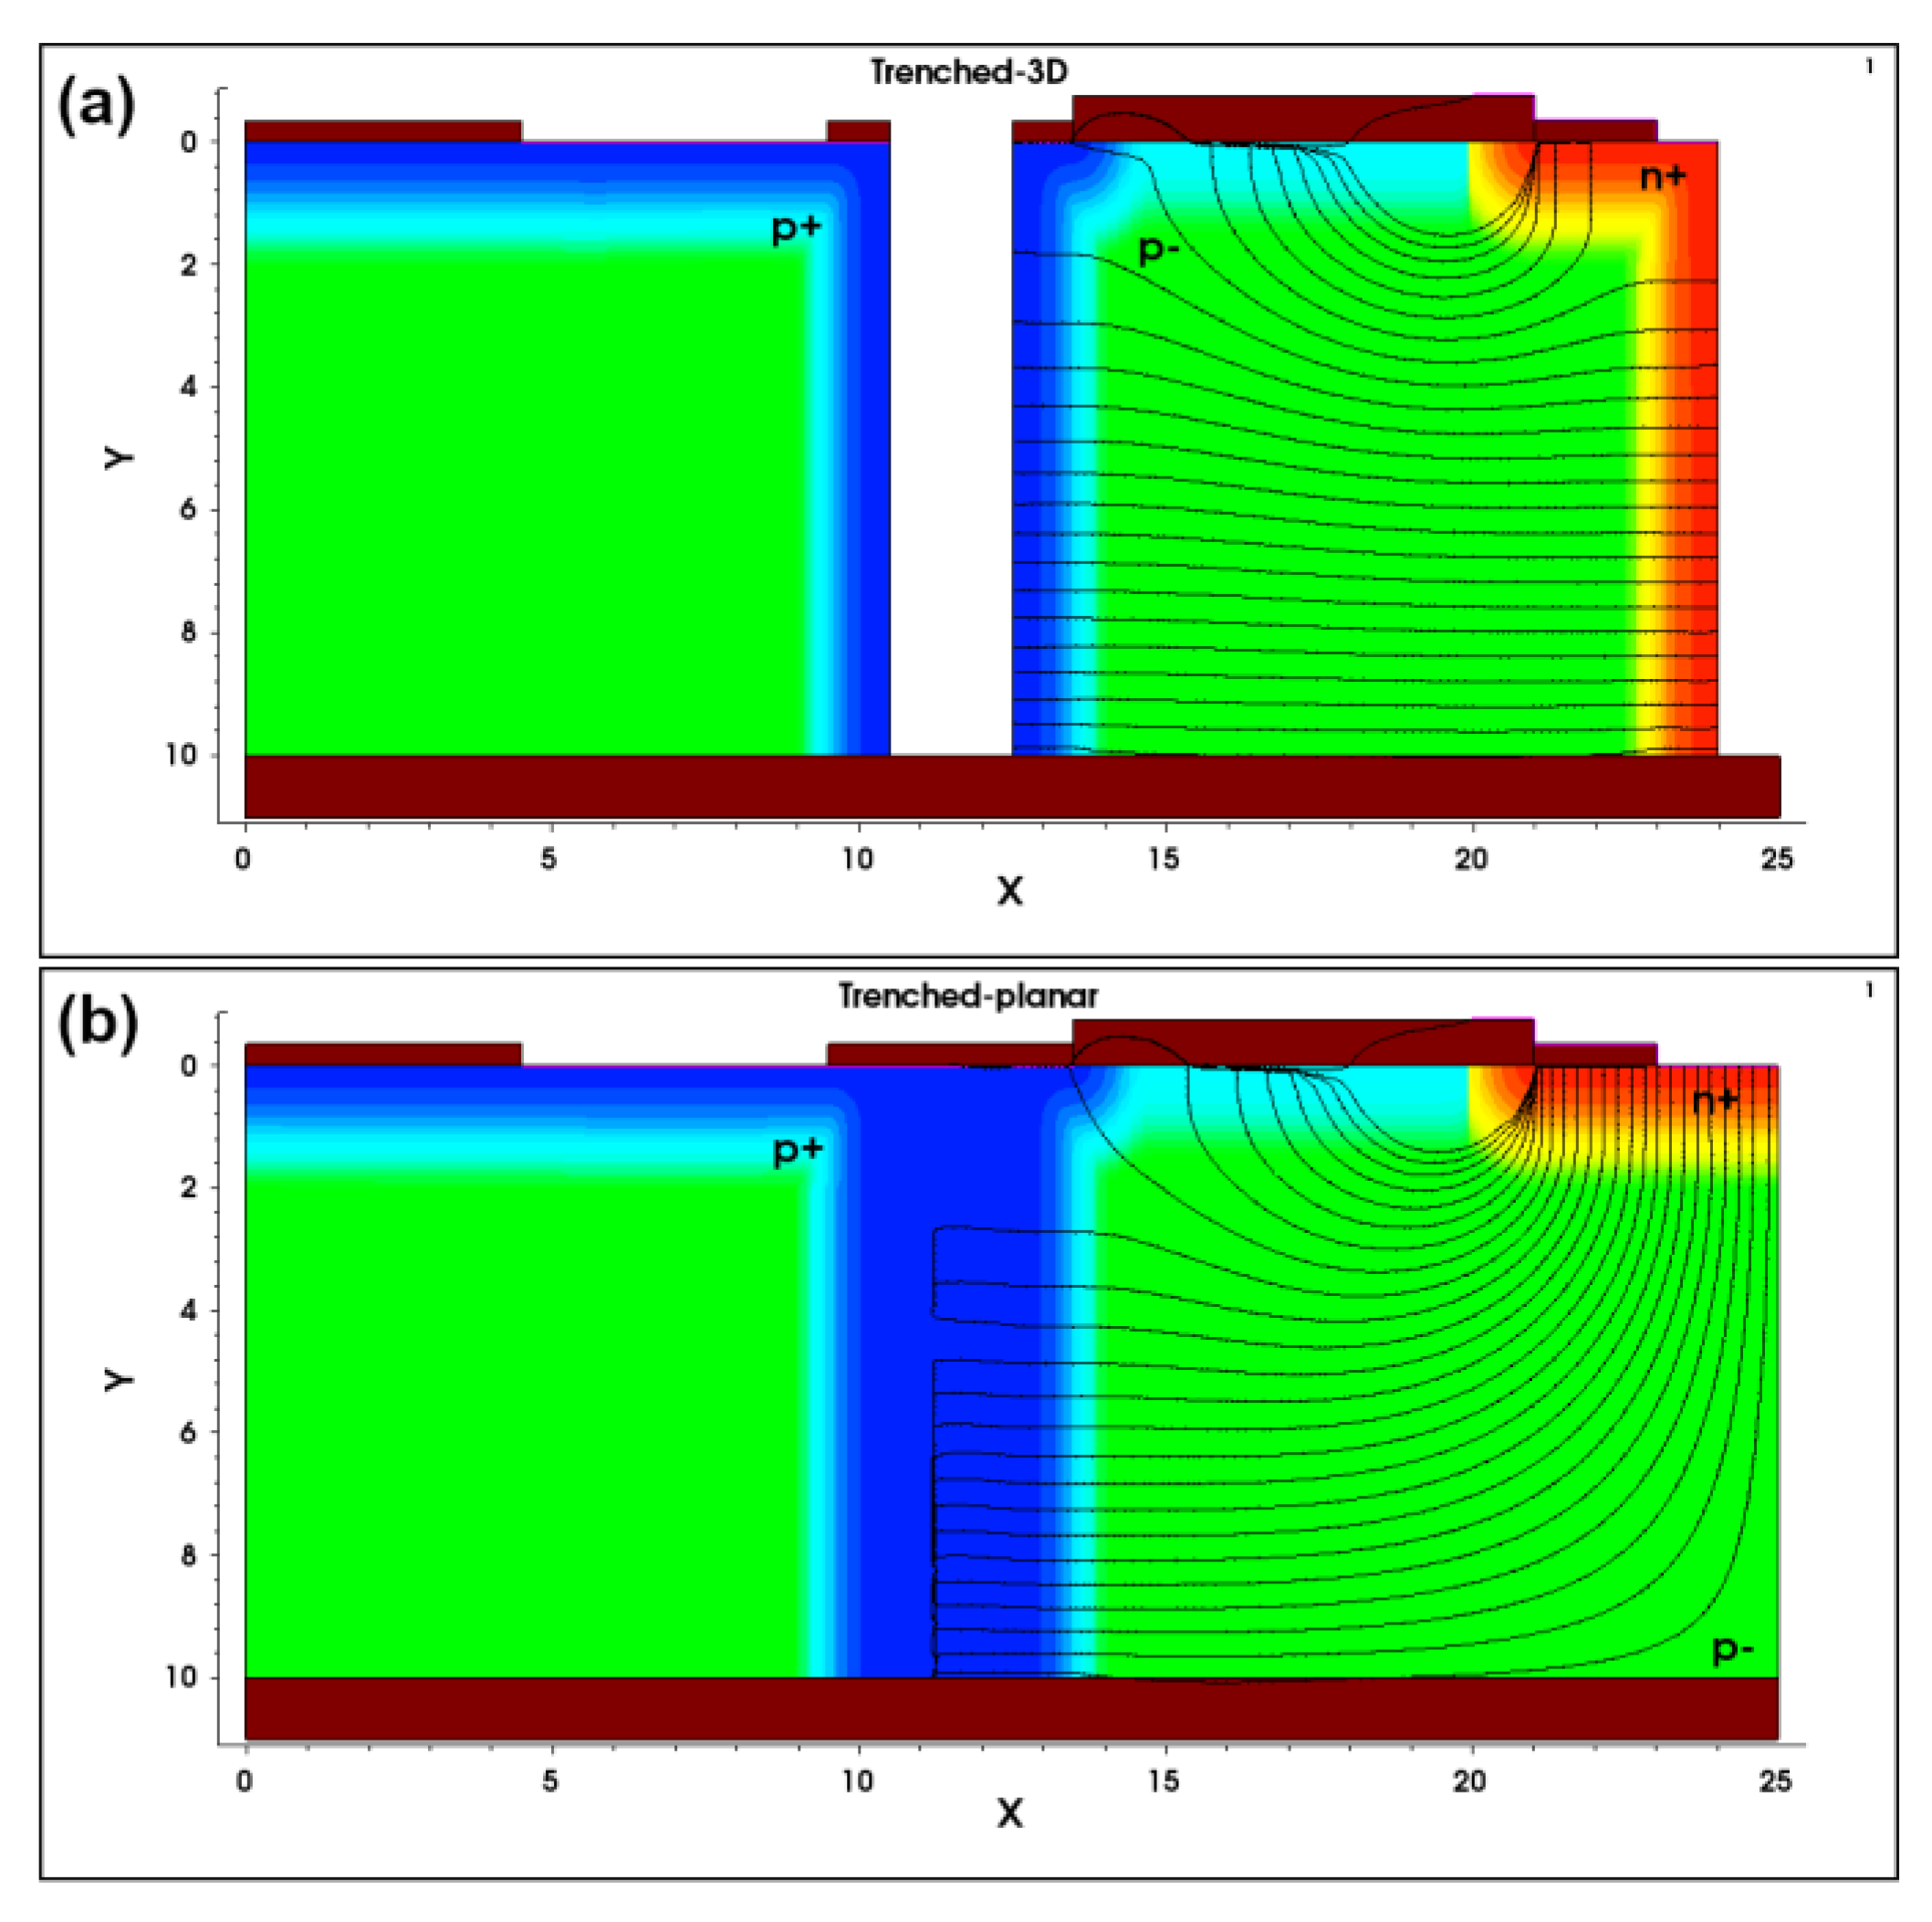
3.2. TCAD Simulations of 3D Mushroom SOI Microdosimeters
3.3. Charge Collection Characterisation of SOI Mushroom Microdosimeters
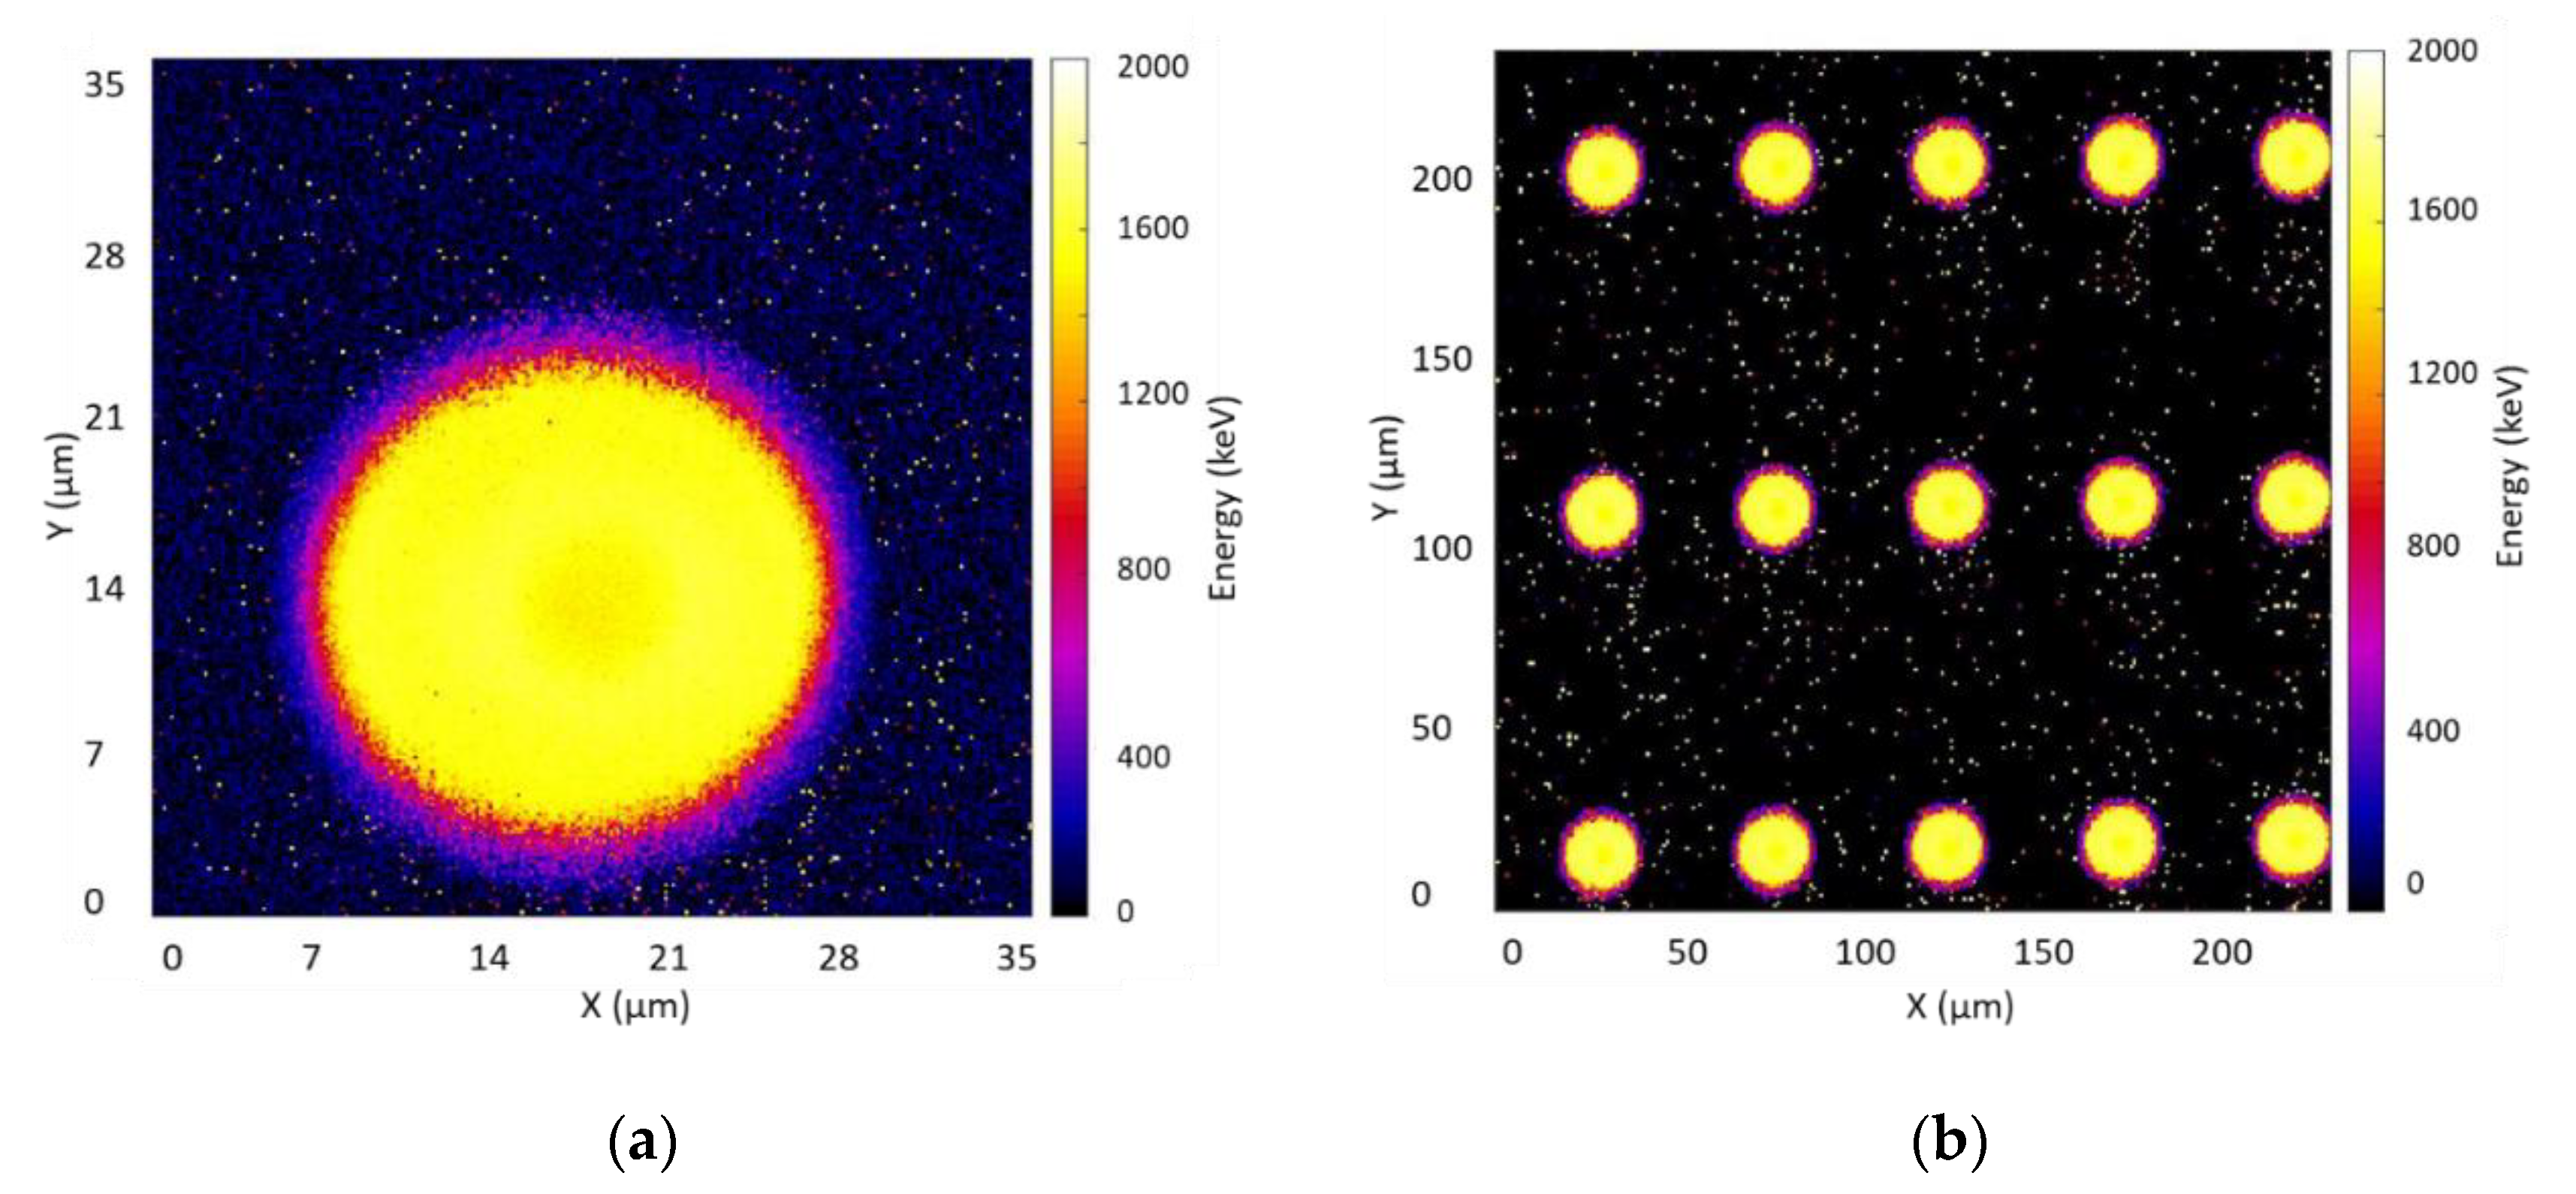
3.3.1. Ion Beam-Induced Charge Collection (IBIC) Technique at ANSTO
3.3.2. Charge Collection Results of Mushroom Microdosimeters with Different Structures
- (A)
- The 2-µm-thick Mushroom-p microdosimeter fabricated by planar technology
- (B)
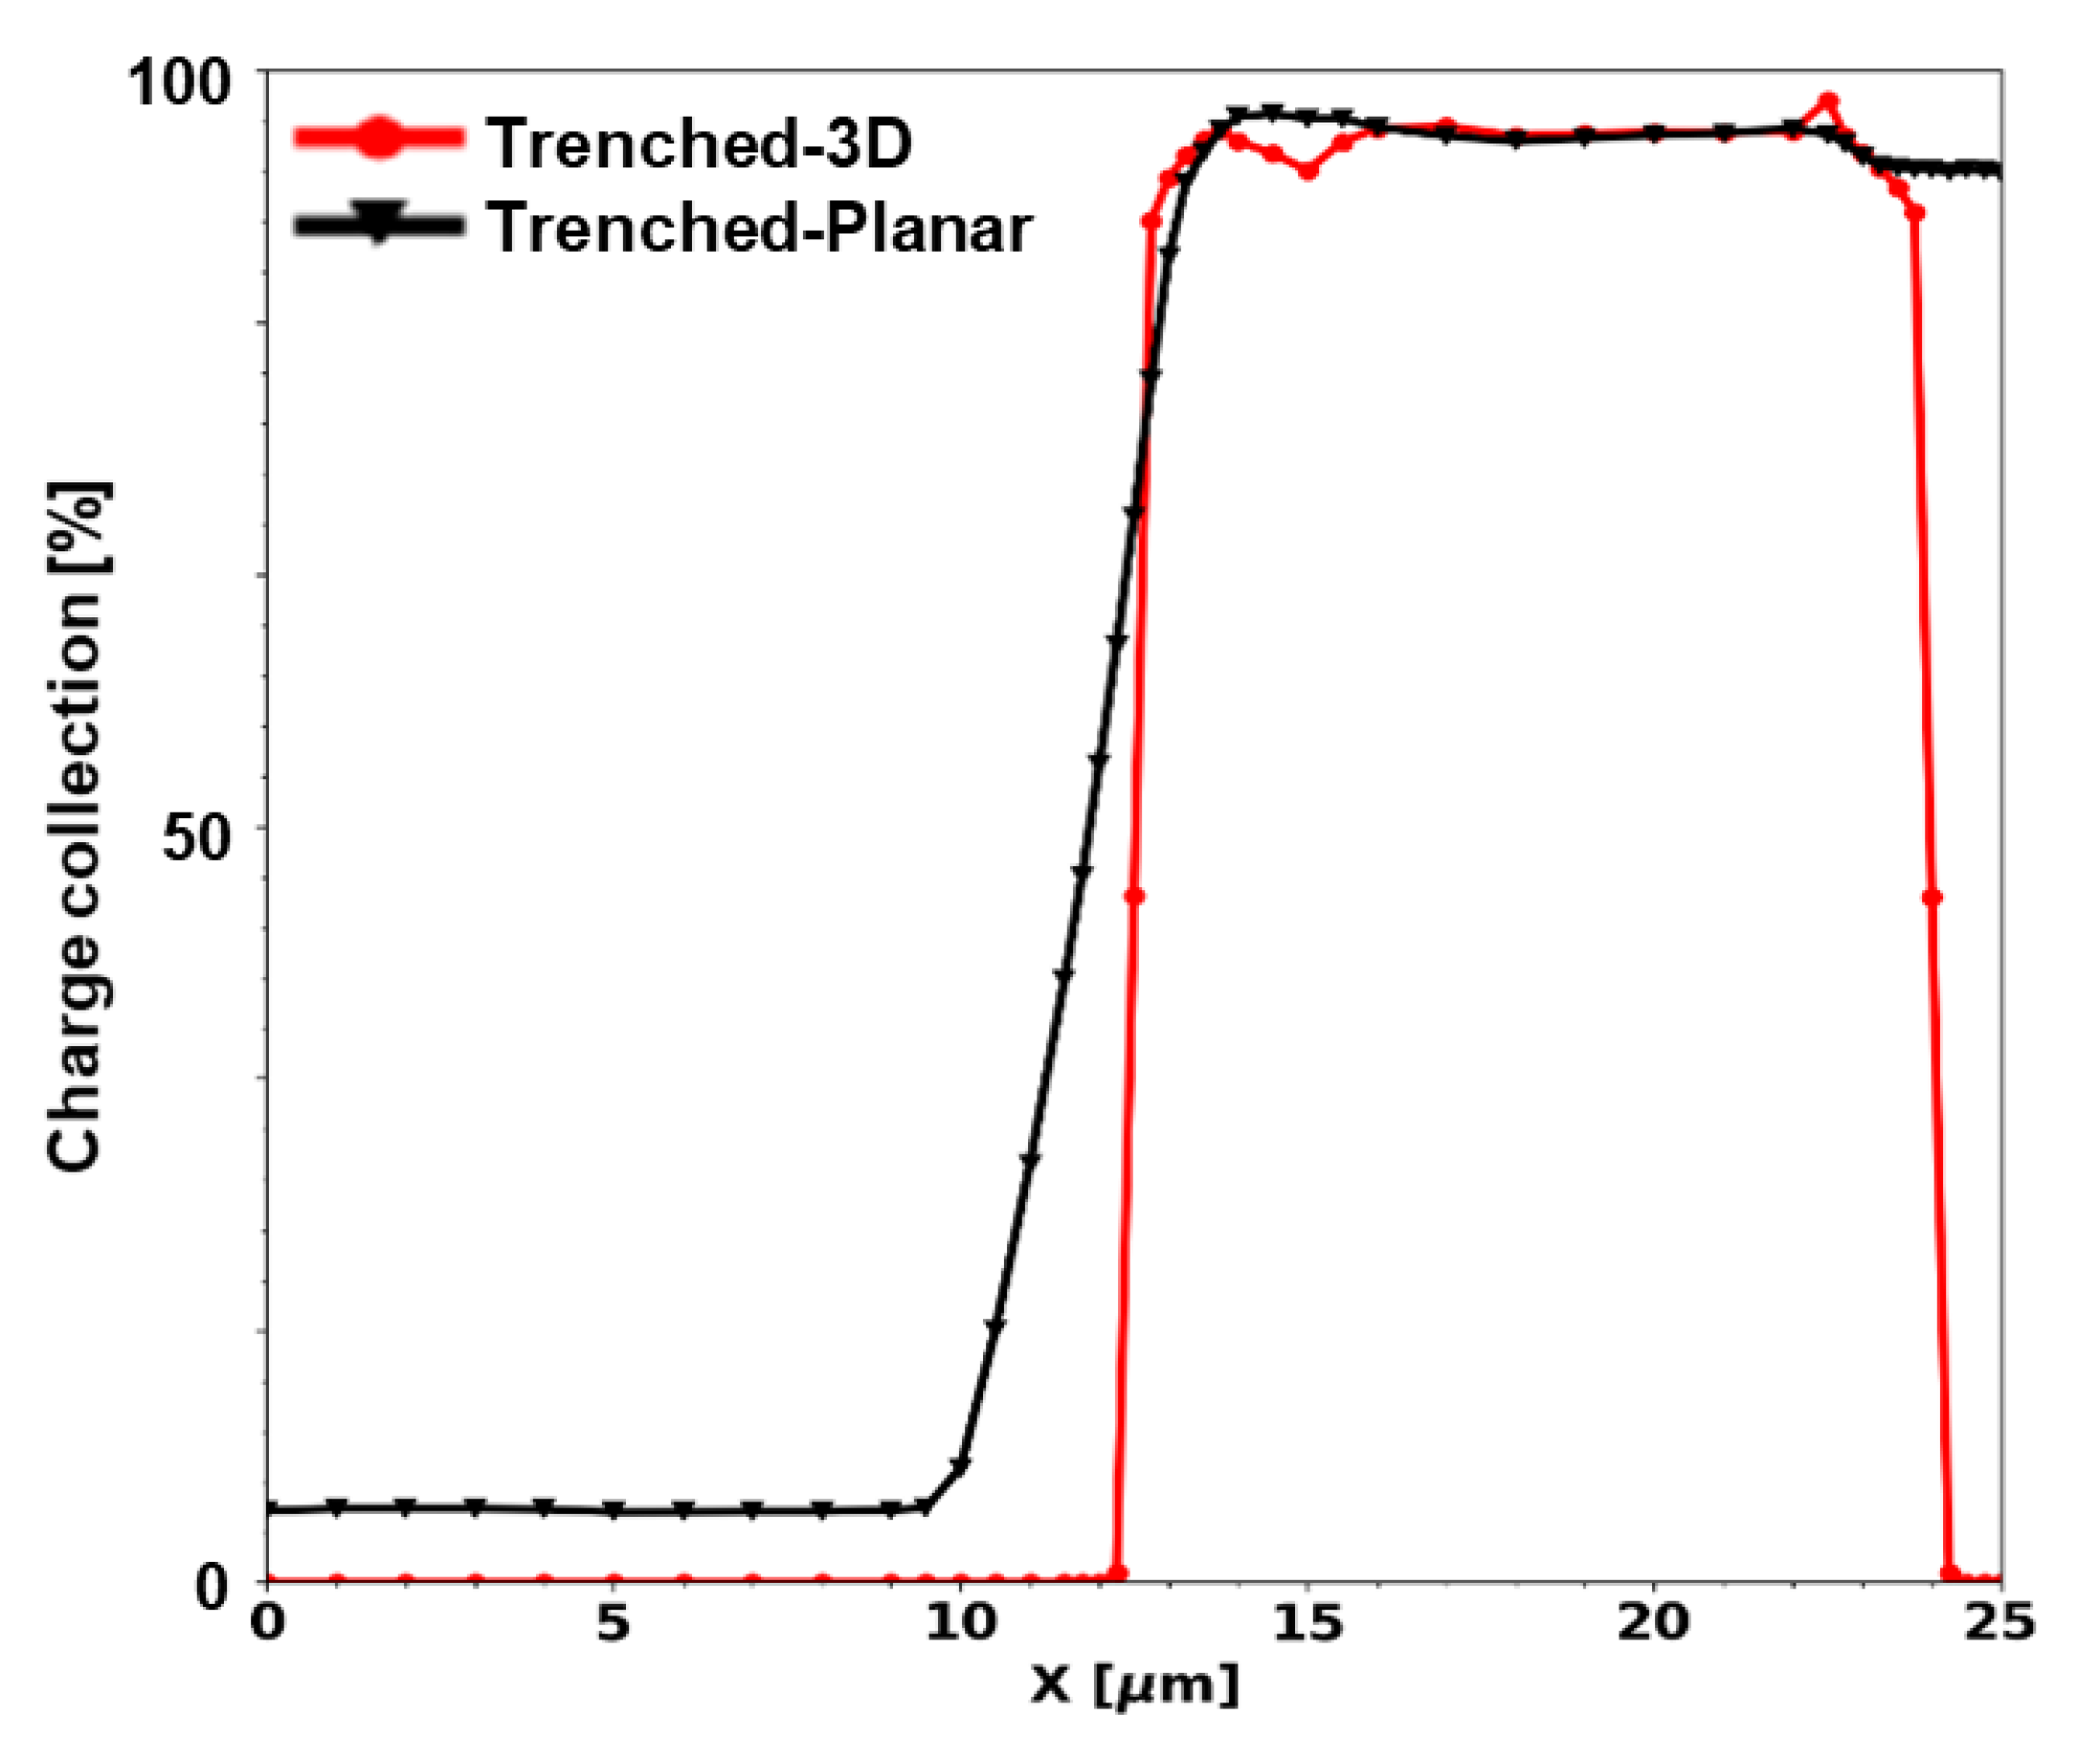
- Trenched-3D Mushroom microdosimeter
- (C)
- Trenched-planar Mushroom microdosimeter
- (D)
- Free-standing 3D Mushroom microdosimeter embedded in tissue-equivalent material
4. Application of SOI Mushroom Microdosimeters
4.1. Irradiation Facilities
4.1.1. Passive Beam Irradiation at the HIMAC Facility with 16O ion Pristine BP and 12C Ion SOBP
4.1.2. SOBP Beam Irradiation with Scanning Beam of He, C, O and Ne Ions
4.1.3. Proton Therapy Facility in Ithemba Labs, South Africa
4.1.4. Geant4 Simulations
4.2. RBE Derivation and Cell Survival Predictions
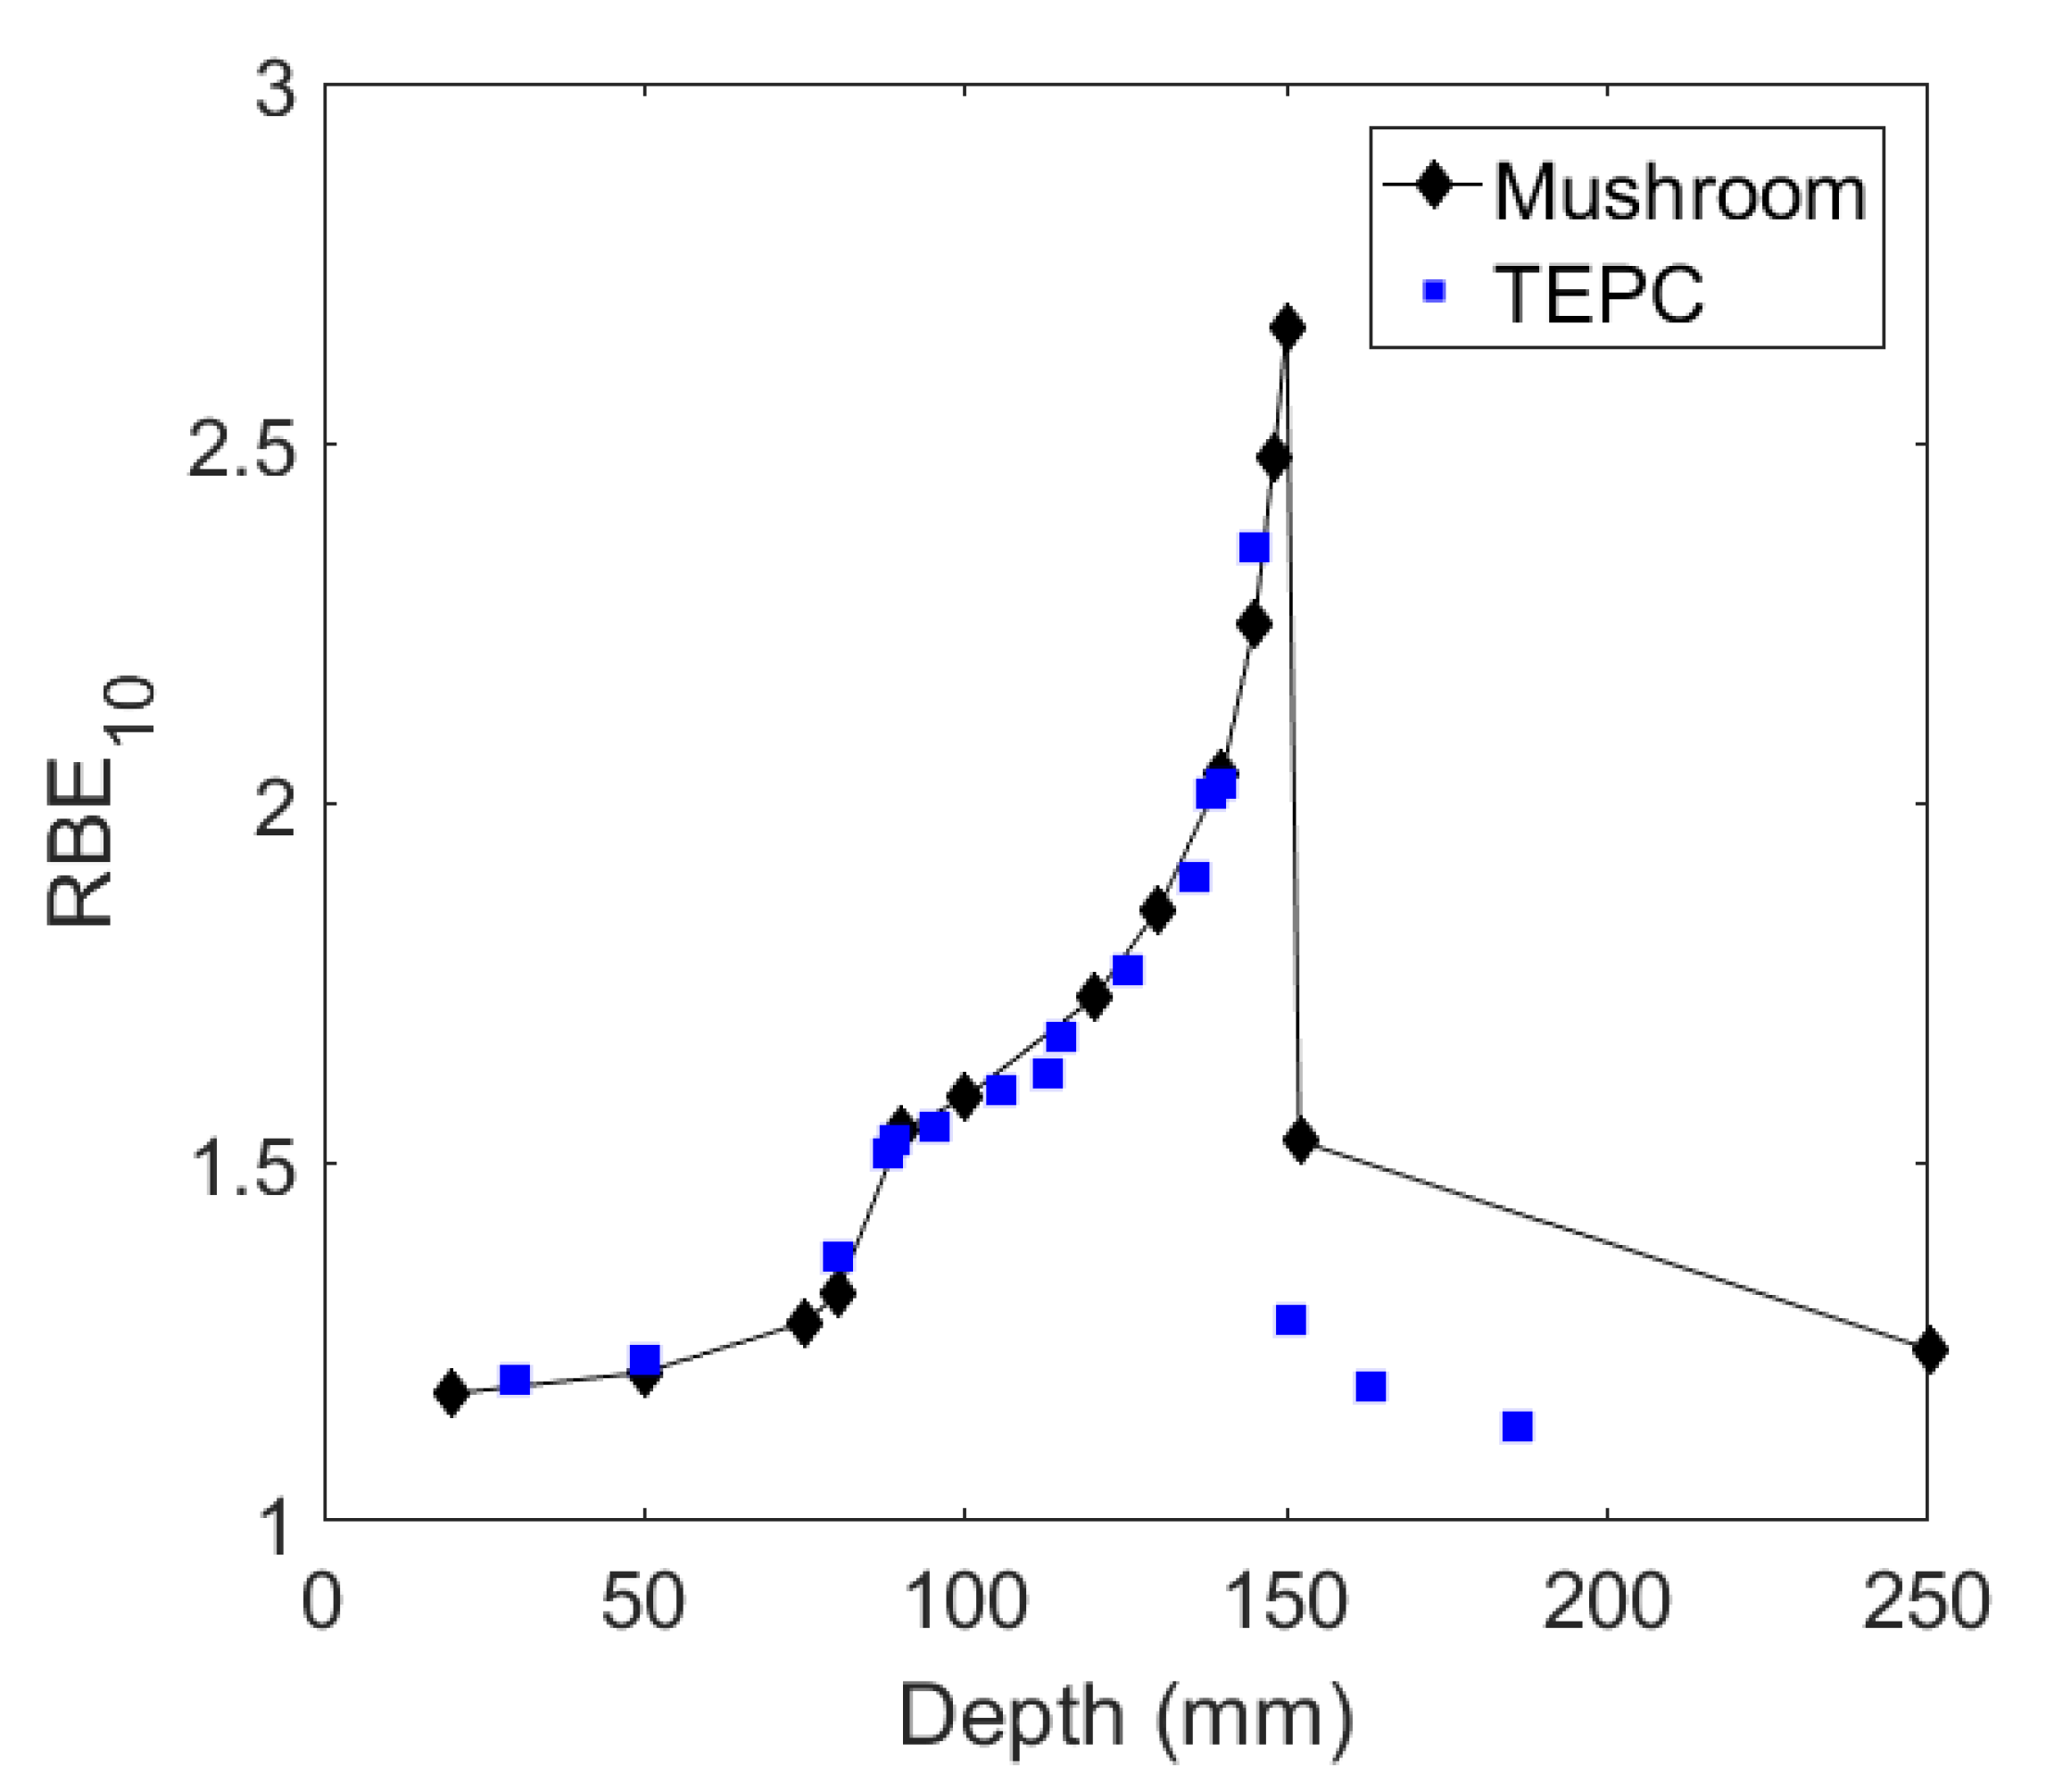
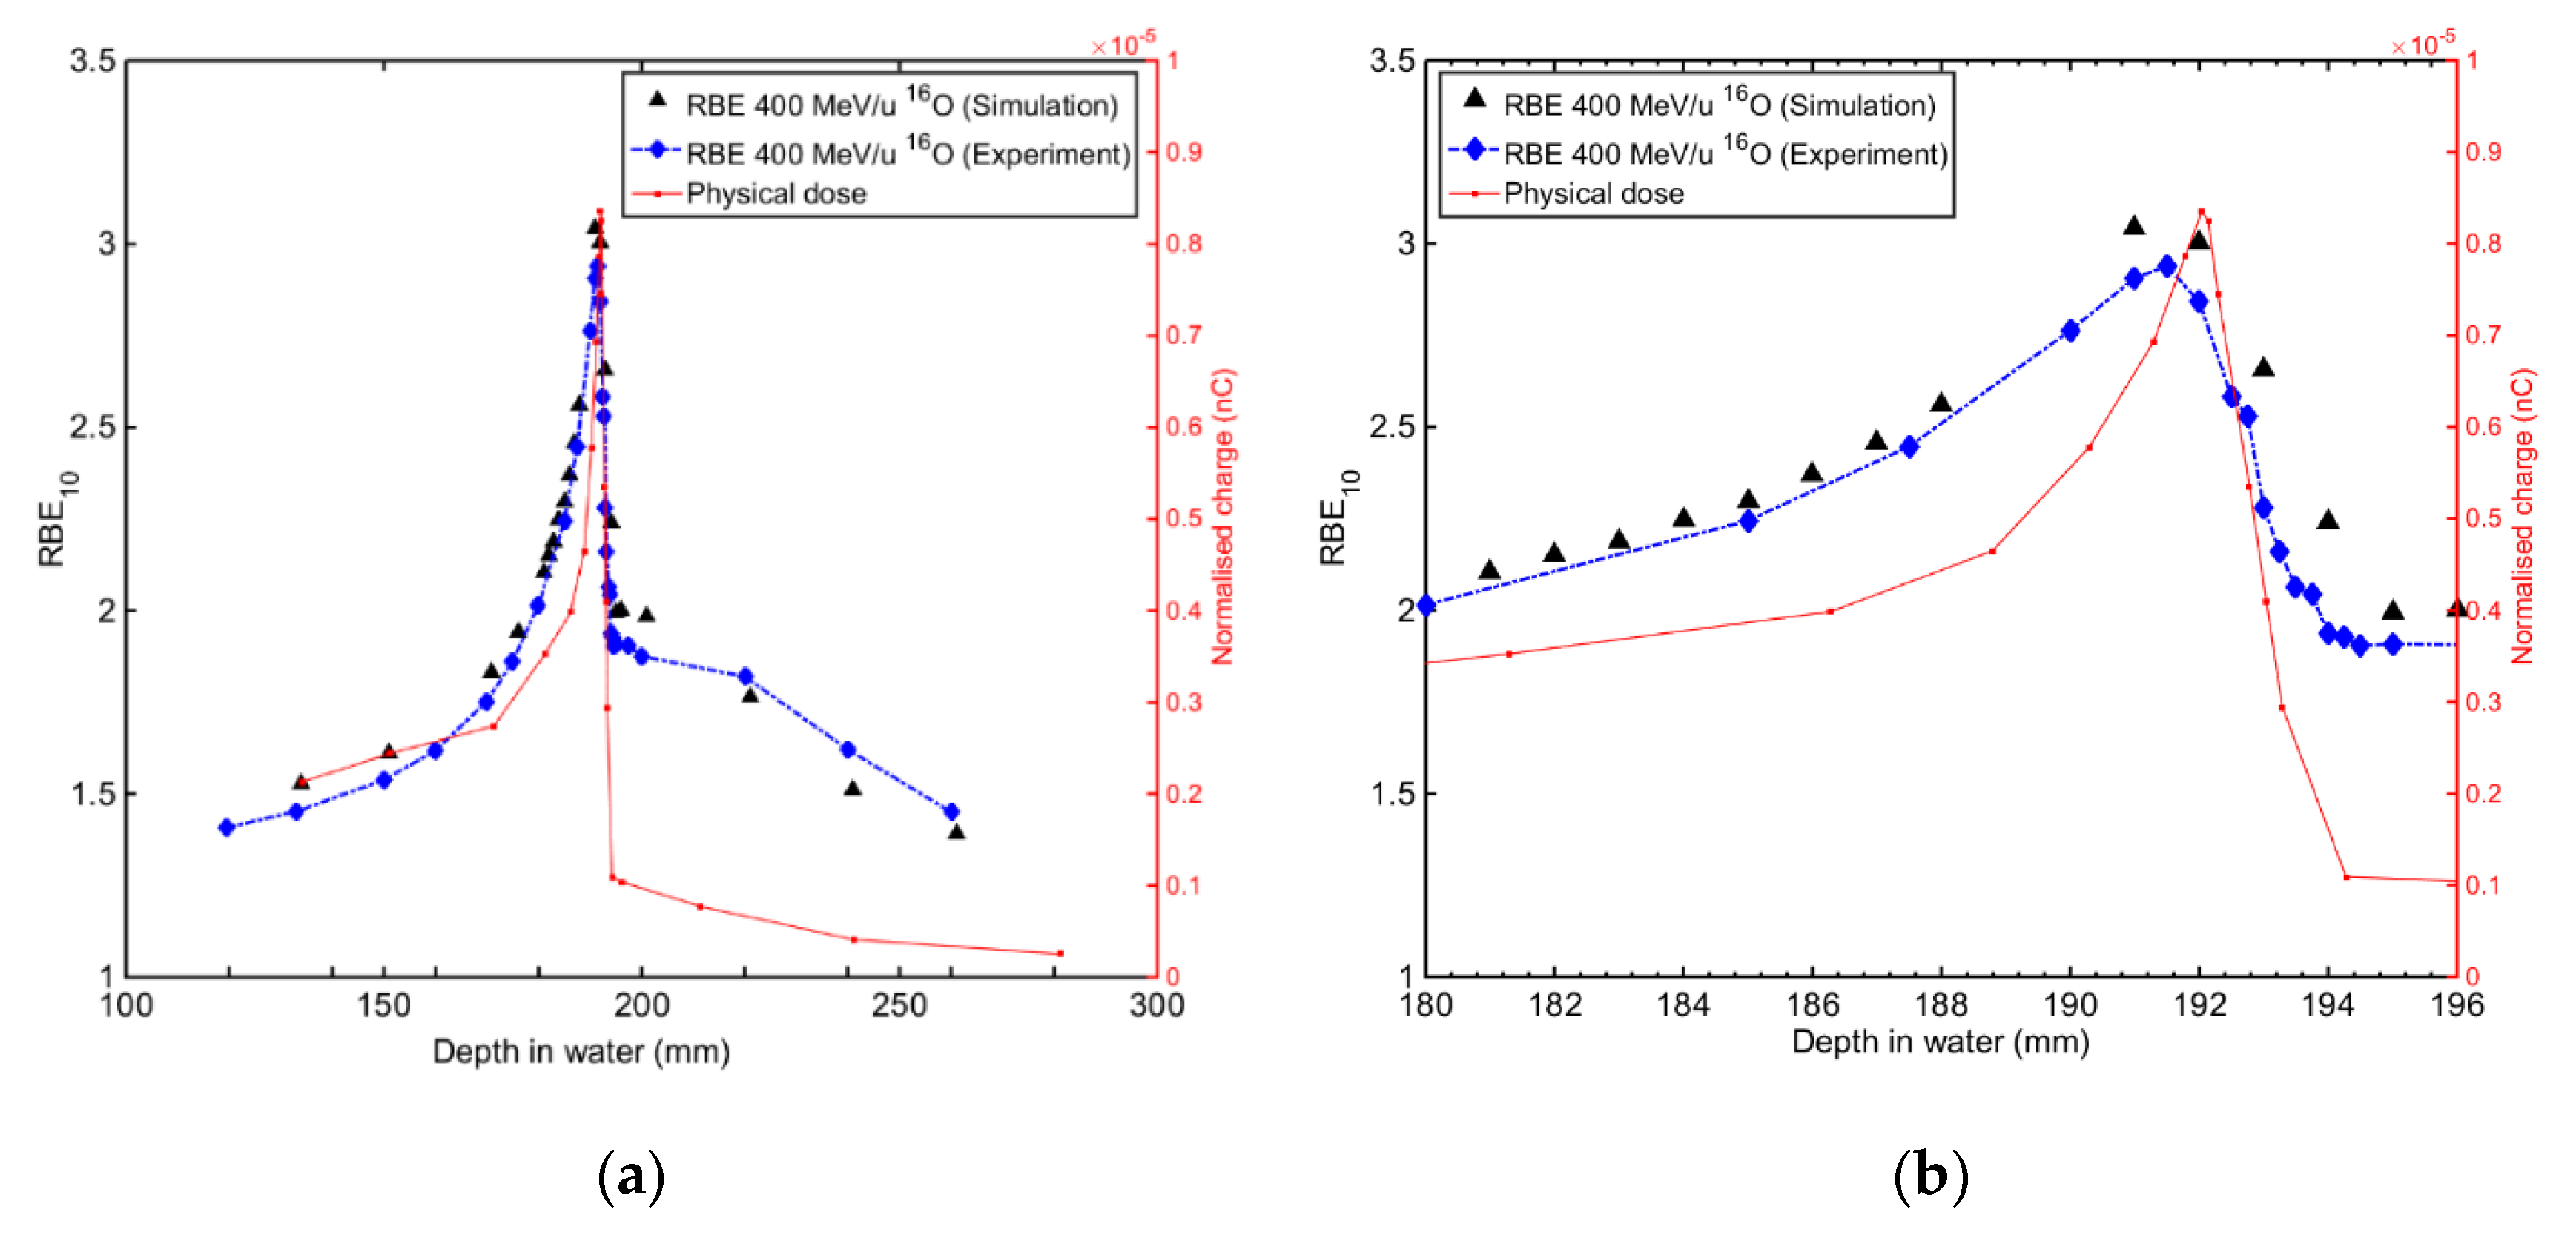
4.2.1. RBE Prediction in Heavy Ion Therapy
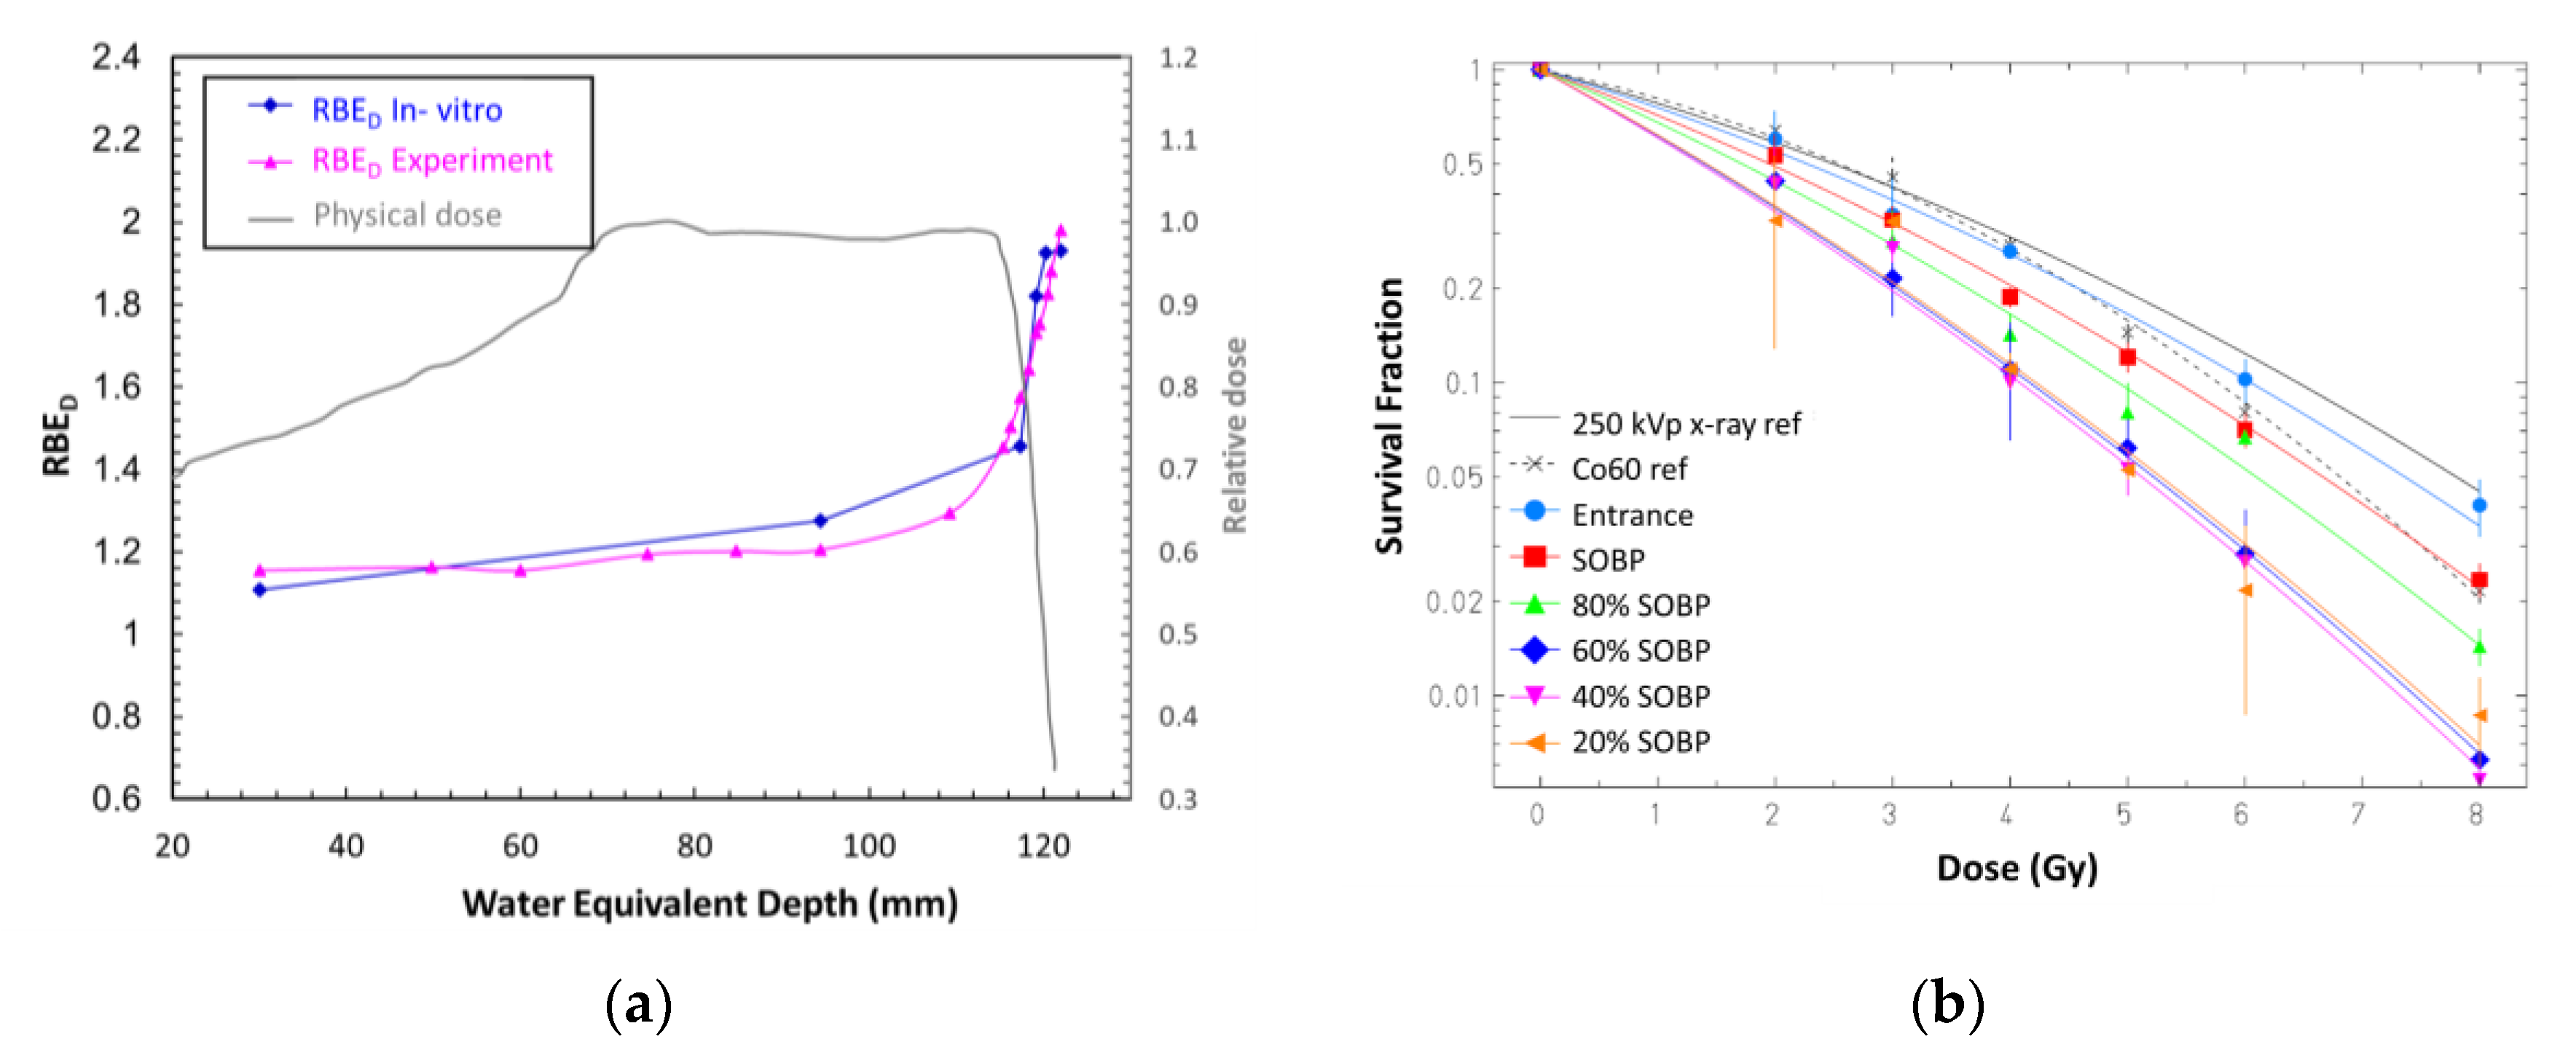
4.2.2. Cell Survival Prediction in Proton and Heavy Ion Therapy
5. Conclusions
6. Patents
Author Contributions
Funding
Acknowledgments
Conflicts of Interest
References
- Paganetti, H. Proton Relative Biological Effectiveness—Uncertainties and Opportunities. Int. J. Part. Ther. 2018, 5, 2–14. [Google Scholar] [CrossRef] [Green Version]
- Lühr, A.; von Neubeck, C.; Pawelke, J.; Seidlitz, A.; Peitzsch, C.; Bentzen, S.M.; Bortfeld, T.; Debus, J.; Deutsch, E.; Langendijk, J.A.; et al. “Radiobiology of Proton Therapy”: Results of an international expert workshop. Radiother. Oncol. 2018, 128, 56–67. [Google Scholar] [CrossRef]
- Paganetti, H. Relative biological effectiveness (RBE) values for proton beam therapy. Variations as a function of biological endpoint, dose, and linear energy transfer. Phys. Med. Biol. 2014, 59, R419–R472. [Google Scholar] [CrossRef] [PubMed]
- Conte, V.; Bianchi, A.; Selva, A.; Petringa, G.; Cirrone, G.; Parisi, A.; Vanhavere, F.; Colautti, P. Microdosimetry at the CATANA 62 MeV proton beam with a sealed miniaturized TEPC. Phys. Medica 2019, 64, 114–122. [Google Scholar] [CrossRef]
- Rosenfeld, A.B. Novel detectors for silicon based microdosimetry, their concepts and applications. NIM A 2016, 809, 156–170. [Google Scholar] [CrossRef]
- Bradley, P.; Rosenfeld, A.; Lee, K.; Jamieson, D.; Heiser, G.; Satoh, S. Charge collection and radiation hardness of a SOI microdosimeter for medical and space applications. IEEE Trans. Nucl. Sci. 1998, 45, 2700–2710. [Google Scholar] [CrossRef] [PubMed] [Green Version]
- Cornelius, I.; Siegele, R.; Rosenfeld, A.; Cohen, D.D. Ion beam induced charge characterisation of a silicon microdosimeter using a heavy ion microprobe. Nucl. Instruments Methods Phys. Res. Sect. B Beam Interact. Mater. At. 2002, 190, 335–338. [Google Scholar] [CrossRef]
- Ziebell, A.L.; Lim, W.H.; Reinhard, M.I.; Cornelius, I.; Prokopovich, D.A.; Siegele, R.; Dzurak, A.S.; Rosenfeld, A. A Cylindrical Silicon-on-Insulator Microdosimeter: Charge Collection Characteristics. IEEE Trans. Nucl. Sci. 2008, 55, 3414–3420. [Google Scholar] [CrossRef] [Green Version]
- Lim, W.H.; Ziebell, A.L.; Cornelius, I.; Reinhard, M.I.; Prokopovich, D.A.; Dzurak, A.S.; Rosenfeld, A. Cylindrical Silicon-on-Insulator Microdosimeter: Design, Fabrication and TCAD Modeling. IEEE Trans. Nucl. Sci. 2009, 56, 424–428. [Google Scholar] [CrossRef]
- Lai, N.S.; Lim, W.H.; Ziebell, A.L.; Reinhard, M.I.; Rosenfeld, A.; Dzurak, A.S. Development and Fabrication of Cylindrical Silicon-on-Insulator Microdosimeter Arrays. IEEE Trans. Nucl. Sci. 2009, 56, 1637–1641. [Google Scholar] [CrossRef] [Green Version]
- Livingstone, J.; Prokopovich, D.A.; Lerch, M.L.F.; Reinhard, M.I.; Ziegler, J.F.; Pisacane, V.L.; Dicello, J.F.; Perevertaylo, V.L.; Rosenfeld, A.; Petasecca, M.; et al. Large Area Silicon Microdosimeter for Dosimetry in High LET Space Radiation Fields: Charge Collection Study. IEEE Trans. Nucl. Sci. 2012, 59, 3126–3132. [Google Scholar] [CrossRef]
- Parker, S.; Kenney, C.; Segal, J. 3D—A proposed new architecture for solid-state radiation detectors. Nucl. Instrum. Methods Phys. Res. Sect. A Accel. Spectrometers Detect. Assoc. Equip. 1997, 395, 328–343. [Google Scholar] [CrossRef]
- Hansen, T.-E.; Kok, A.; A Hansen, T.; Lietaer, N.; Mielnik, M.; Storås, P.; Da Via, C.; Hasi, J.; Kenney, C.; Parker, S. First fabrication of full 3D-detectors at SINTEF. J. Instrum. 2009, 4, P03010. [Google Scholar] [CrossRef]
- Hawkins, R.B. A Statistical Theory of Cell Killing by Radiation of Varying Linear Energy Transfer. Radiat Res. 1994, 140, 366. [Google Scholar] [CrossRef] [PubMed]
- Hawkins, R.B. A Microdosimetric-Kinetic Model for the Effect of Non-Poisson Distribution of Lethal Lesions on the Variation of RBE with LET. Radiat Res. 2003, 160, 61–69. [Google Scholar] [CrossRef] [PubMed]
- Kase, Y.; Kanai, T.; Matsumoto, Y.; Furusawa, Y.; Okamoto, H.; Asaba, T.; Sakama, M.; Shinoda, H. Microdosimetric measurements and estimation of human cell survival for heavy-ion beams. Radiat Res. 2006, 166, 629–638. [Google Scholar] [CrossRef] [PubMed]
- Sato, T.; Kase, Y.; Watanabe, R.; Niita, K.; Sihver, L. Biological Dose Estimation for Charged-Particle Therapy Using an Improved PHITS Code Coupled with a Microdosimetric Kinetic Model. Radiat Res. 2009, 171, 107–117. [Google Scholar] [CrossRef] [PubMed]
- Nose, H.; Kase, Y.; Matsufuji, N.; Kanai, T. Field size effect of radiation quality in carbon therapy using passive method. Med. Phys. 2009, 36, 870–875. [Google Scholar] [CrossRef] [PubMed]
- Bolst, D.; Guatelli, S.; Tran, L.T.; Chartier, L.; Lerch, M.; Matsufuji, N.; Rosenfeld, A. Correction factors to convert microdosimetry measurements in silicon to tissue in 12C ion therapy. Phys. Med. Biol. 2017, 62, 2055–2069. [Google Scholar] [CrossRef] [PubMed] [Green Version]
- Kase, Y.; Yamashita, W.; Matsufuji, N.; Takada, K.; Sakae, T.; Furusawa, Y.; Yamashita, H.; Murayama, S. Microdosimetric calculation of relative biological effectiveness for design of therapeutic proton beams. J. Radiat Res. 2013, 54, 485–493. [Google Scholar] [CrossRef] [PubMed] [Green Version]
- Tran, L.T.; Chartier, L.; Prokopovich, D.A.; Bolst, D.; Povoli, M.; Summanwar, A.; Kok, A.; Pogossov, A.; Petasecca, M.; Guatelli, S.; et al. Thin silicon microdosimeter utilizing 3-D MEMS fabrication technology: Charge collection study and its application in mixed radiation fields. IEEE Trans. Nucl. Sci. 2018, 65, 467–472. [Google Scholar] [CrossRef] [Green Version]
- James, B.; Tran, L.T.; Vohradsky, J.; Bolst, D.; Pan, V.; Carr, M.; Guatelli, S.; Pogossov, A.; Petasecca, M.; Lerch, M.; et al. SOI Thin Microdosimeter Detectors for Low Energy Ions and Radiation Damage Studies. IEEE Trans. Nucl. Sci. 2019, 66, 320–326. [Google Scholar] [CrossRef]
- Pastuovic, Z.; Siegele, R.; Cohen, D.D.; Mann, M.; Ionescu, M.; Button, D.; Long, S. The new confocal heavy ion microprobe beamline at ANSTO: The first microprobe resolution tests and applications for elemental imaging and analysis. Nucl. Instrum. Methods Phys. Res. B Beam Interact. Mater. At. 2017, 404, 1–8. [Google Scholar] [CrossRef]
- Pastuovic, Z.; Davis, J.; Tran, T.L.; Paino, J.R.; Dipuglia, A.; James, B.; Povoli, M.; Kok, A.; Perevertaylo, V.L.; Siegele, R.; et al. IBIC microscopy—The powerful tool for testing micron—Sized sensitive volumes in segmented radiation detectors used in synchrotron microbeam radiation and hadron therapies. Nucl. Instrum. Methods Phys. Res. B Beam Interact. Mater. At. 2019, 458, 90–96. [Google Scholar] [CrossRef]
- James, B.; Tran, L.T.; Bolst, D.; Prokopovich, D.; Reinhard, M.; Lerch, M.; Petasecca, M.; Guatelli, S.; Povoli, M.; Kok, A.; et al. 3D sensitive volume microdosimeter with improved tissue equivalency: Charge collection study and its application in 12C ion therapy. J. Phys. Conf. Ser. 2019, 1154, 012012. [Google Scholar] [CrossRef]
- Inaniwa, T.; Suzuki, M.; Lee, S.-H.; Mizushima, K.; Iwata, Y.; Kanematsu, N.; Shirai, T. Experimental validation of stochastic microdosimetric kinetic model for multi-ion therapy treatment planning with helium-, carbon-, oxygen-, and neon-ion beams. Phys. Med. Biol. 2020, 65, 045005. [Google Scholar] [CrossRef] [PubMed]
- Lee, S.H.; Mizushima, K.; Kohno, R.; Iwata, Y.; Yonai, S.; Shirai, T.; A Pan, V.; Bolst, D.; Tran, L.T.; Rosenfeld, A.B.; et al. Estimating the biological effects of helium, carbon, oxygen, and neon ion beams using 3D silicon microdosimeters. Phys. Med. Biol. 2021, 66, 045017. [Google Scholar] [CrossRef]
- Allison, J.; Amako, K.; Apostolakis, J.; Araujo, H.; Arce Dubois, P.; Asai, M.; Barrand, G.; Capra, R.; Chauvie, S.; Chytracek, R.; et al. Geant4 developments and applications. IEEE Trans. Nucl. Sci. 2006, 53, 270–278. [Google Scholar] [CrossRef] [Green Version]
- Agostinelli, S.; Allison, J.; Amako, K. Geant4 -a simulation toolkit. Nucl. Instrum. Methods Phys. Res. Sect. A Accel. Spectrometers Detect. Assoc. Equip. 2003, 506, 250–303. [Google Scholar] [CrossRef] [Green Version]
- Torikoshi, M.; Minohara, S.; Kanematsu, N.; Komori, M.; Kanazawa, M.; Noda, K.; Miyahara, N.; Itoh, H.; Endo, M.; Kanai, T. Irradiation System for HIMAC. J. Radiat Res. 2007, 48, A15–A25. [Google Scholar] [CrossRef] [Green Version]
- Arce, P.; Bolst, D.; Bordage, M.-C.; Brown, J.M.C.; Cirrone, P.; Cortés-Giraldo, M.A.; Cutajar, D.; Cuttone, G.; Desorgher, L.; Dondero, P.; et al. Report on G4-Med, a Geant4 benchmarking system for medical physics applications developed by the Geant4 Medical Simulation Benchmarking Group. Med. Phys. 2021, 48, 19–56. [Google Scholar] [CrossRef]
- Tran, L.T.; Bolst, D.; Guatelli, S.; Pogossov, A.; Petasecca, M.; Lerch ML, F.; Chartier, L.; Prokopovich, D.A.; Reinhard, M.I.; Povoli, M.; et al. The relative biological effectiveness for carbon, nitrogen and oxygen ion beams using passive and scanning techniques evaluated with fully 3D silicon microdosimeters. Med. Phys. 2018, 45, 2299–2308. [Google Scholar] [CrossRef] [Green Version]
- Kase, Y.; Kanai, T.; Sakama, M.; Tameshige, Y.; Himukai, T.; Nose, H.; Matsufuji, N. Microdosimetric approach to NIRS-defined biological dose measurement for carbon-ion treatment beam. J. Radiat. Res. 2011, 52, 59–68. [Google Scholar] [CrossRef] [Green Version]
- Debrot, E.; Tran, L.; Chartier, L.; Bolst, D.; Guatelli, S.; Vandevoorde, C.; Kock, E.; Beukes, P.; Symons, J.; Nieto Camero, J.; et al. SOI microdosimetry and modified MKM for evaluation of relative biological effectiveness for a passive proton therapy radiation field. Phys. Med. Biol. 2018, 63, 235007. [Google Scholar] [CrossRef]


Publisher’s Note: MDPI stays neutral with regard to jurisdictional claims in published maps and institutional affiliations. |
© 2021 by the authors. Licensee MDPI, Basel, Switzerland. This article is an open access article distributed under the terms and conditions of the Creative Commons Attribution (CC BY) license (https://creativecommons.org/licenses/by/4.0/).
Share and Cite
Tran, L.T.; Bolst, D.; James, B.; Pan, V.; Vohradsky, J.; Peracchi, S.; Chartier, L.; Debrot, E.; Guatelli, S.; Petasecca, M.; et al. Silicon 3D Microdosimeters for Advanced Quality Assurance in Particle Therapy. Appl. Sci. 2022, 12, 328. https://doi.org/10.3390/app12010328
Tran LT, Bolst D, James B, Pan V, Vohradsky J, Peracchi S, Chartier L, Debrot E, Guatelli S, Petasecca M, et al. Silicon 3D Microdosimeters for Advanced Quality Assurance in Particle Therapy. Applied Sciences. 2022; 12(1):328. https://doi.org/10.3390/app12010328
Chicago/Turabian StyleTran, Linh T., David Bolst, Benjamin James, Vladimir Pan, James Vohradsky, Stefania Peracchi, Lachlan Chartier, Emily Debrot, Susana Guatelli, Marco Petasecca, and et al. 2022. "Silicon 3D Microdosimeters for Advanced Quality Assurance in Particle Therapy" Applied Sciences 12, no. 1: 328. https://doi.org/10.3390/app12010328