
Virtual Reality-Based Parallel Coordinates Plots Enhanced with Explainable AI and Data-Science Analytics for Decision-Making Processes

 , ,
, ,  ,
,  and
and
Abstract
:1. Introduction
2. Related Work
3. Datasets
4. Data-Science Analytics
4.1. Goal 1—Cluster Identification
4.2. Goal 2—Explanations of the Clustering
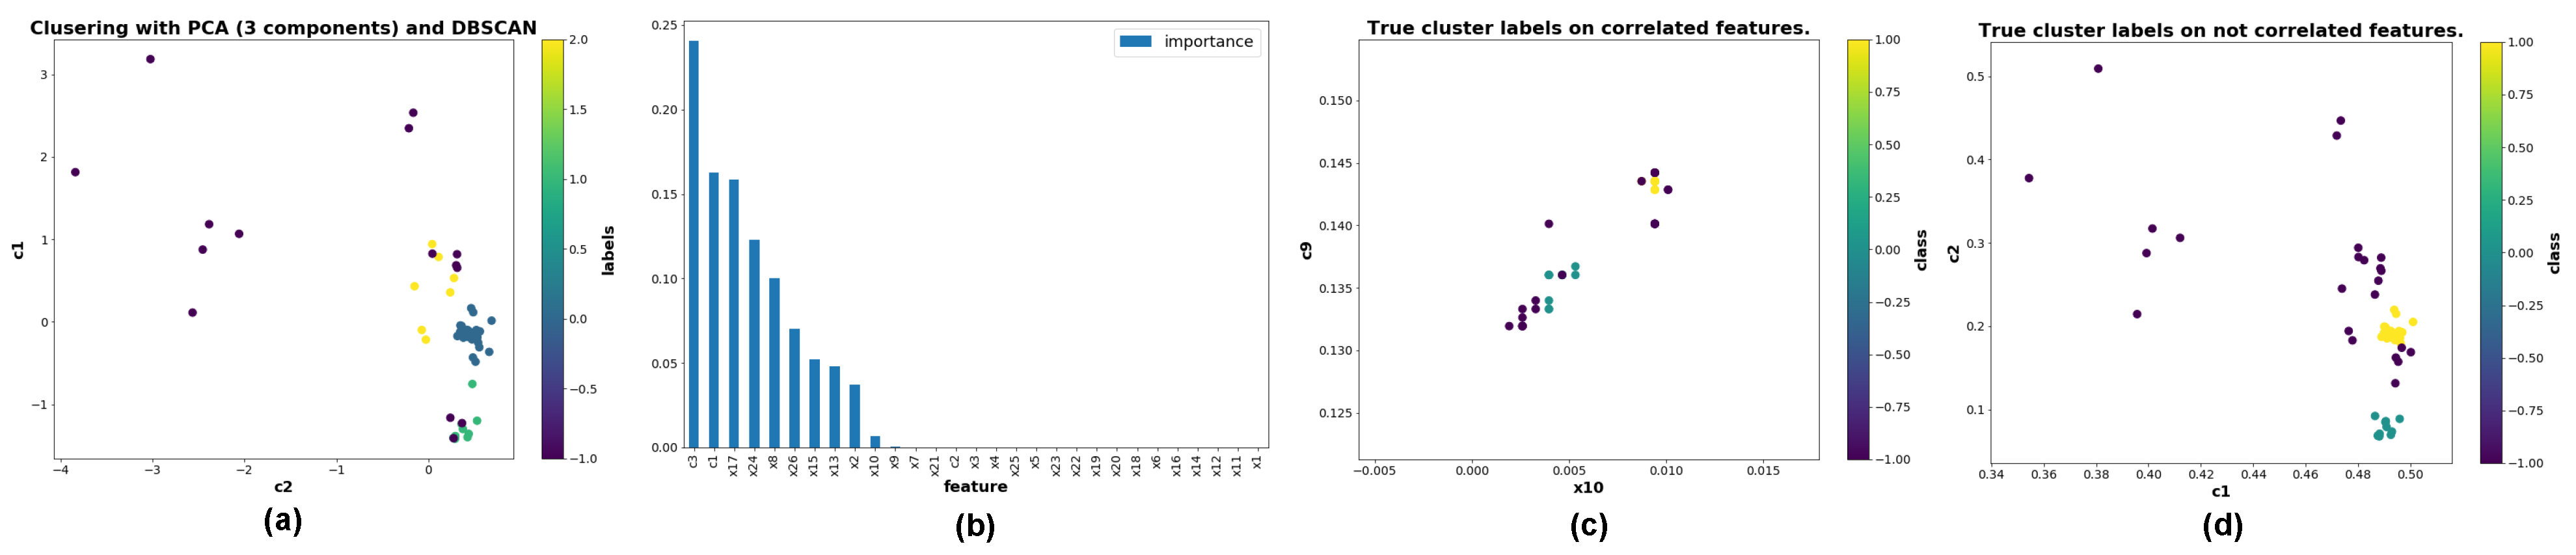
4.3. Goal 3—Identification of the Features’ Importance
5. Apparatus and Visualization Framework
5.1. Apparatus
5.2. Visualization
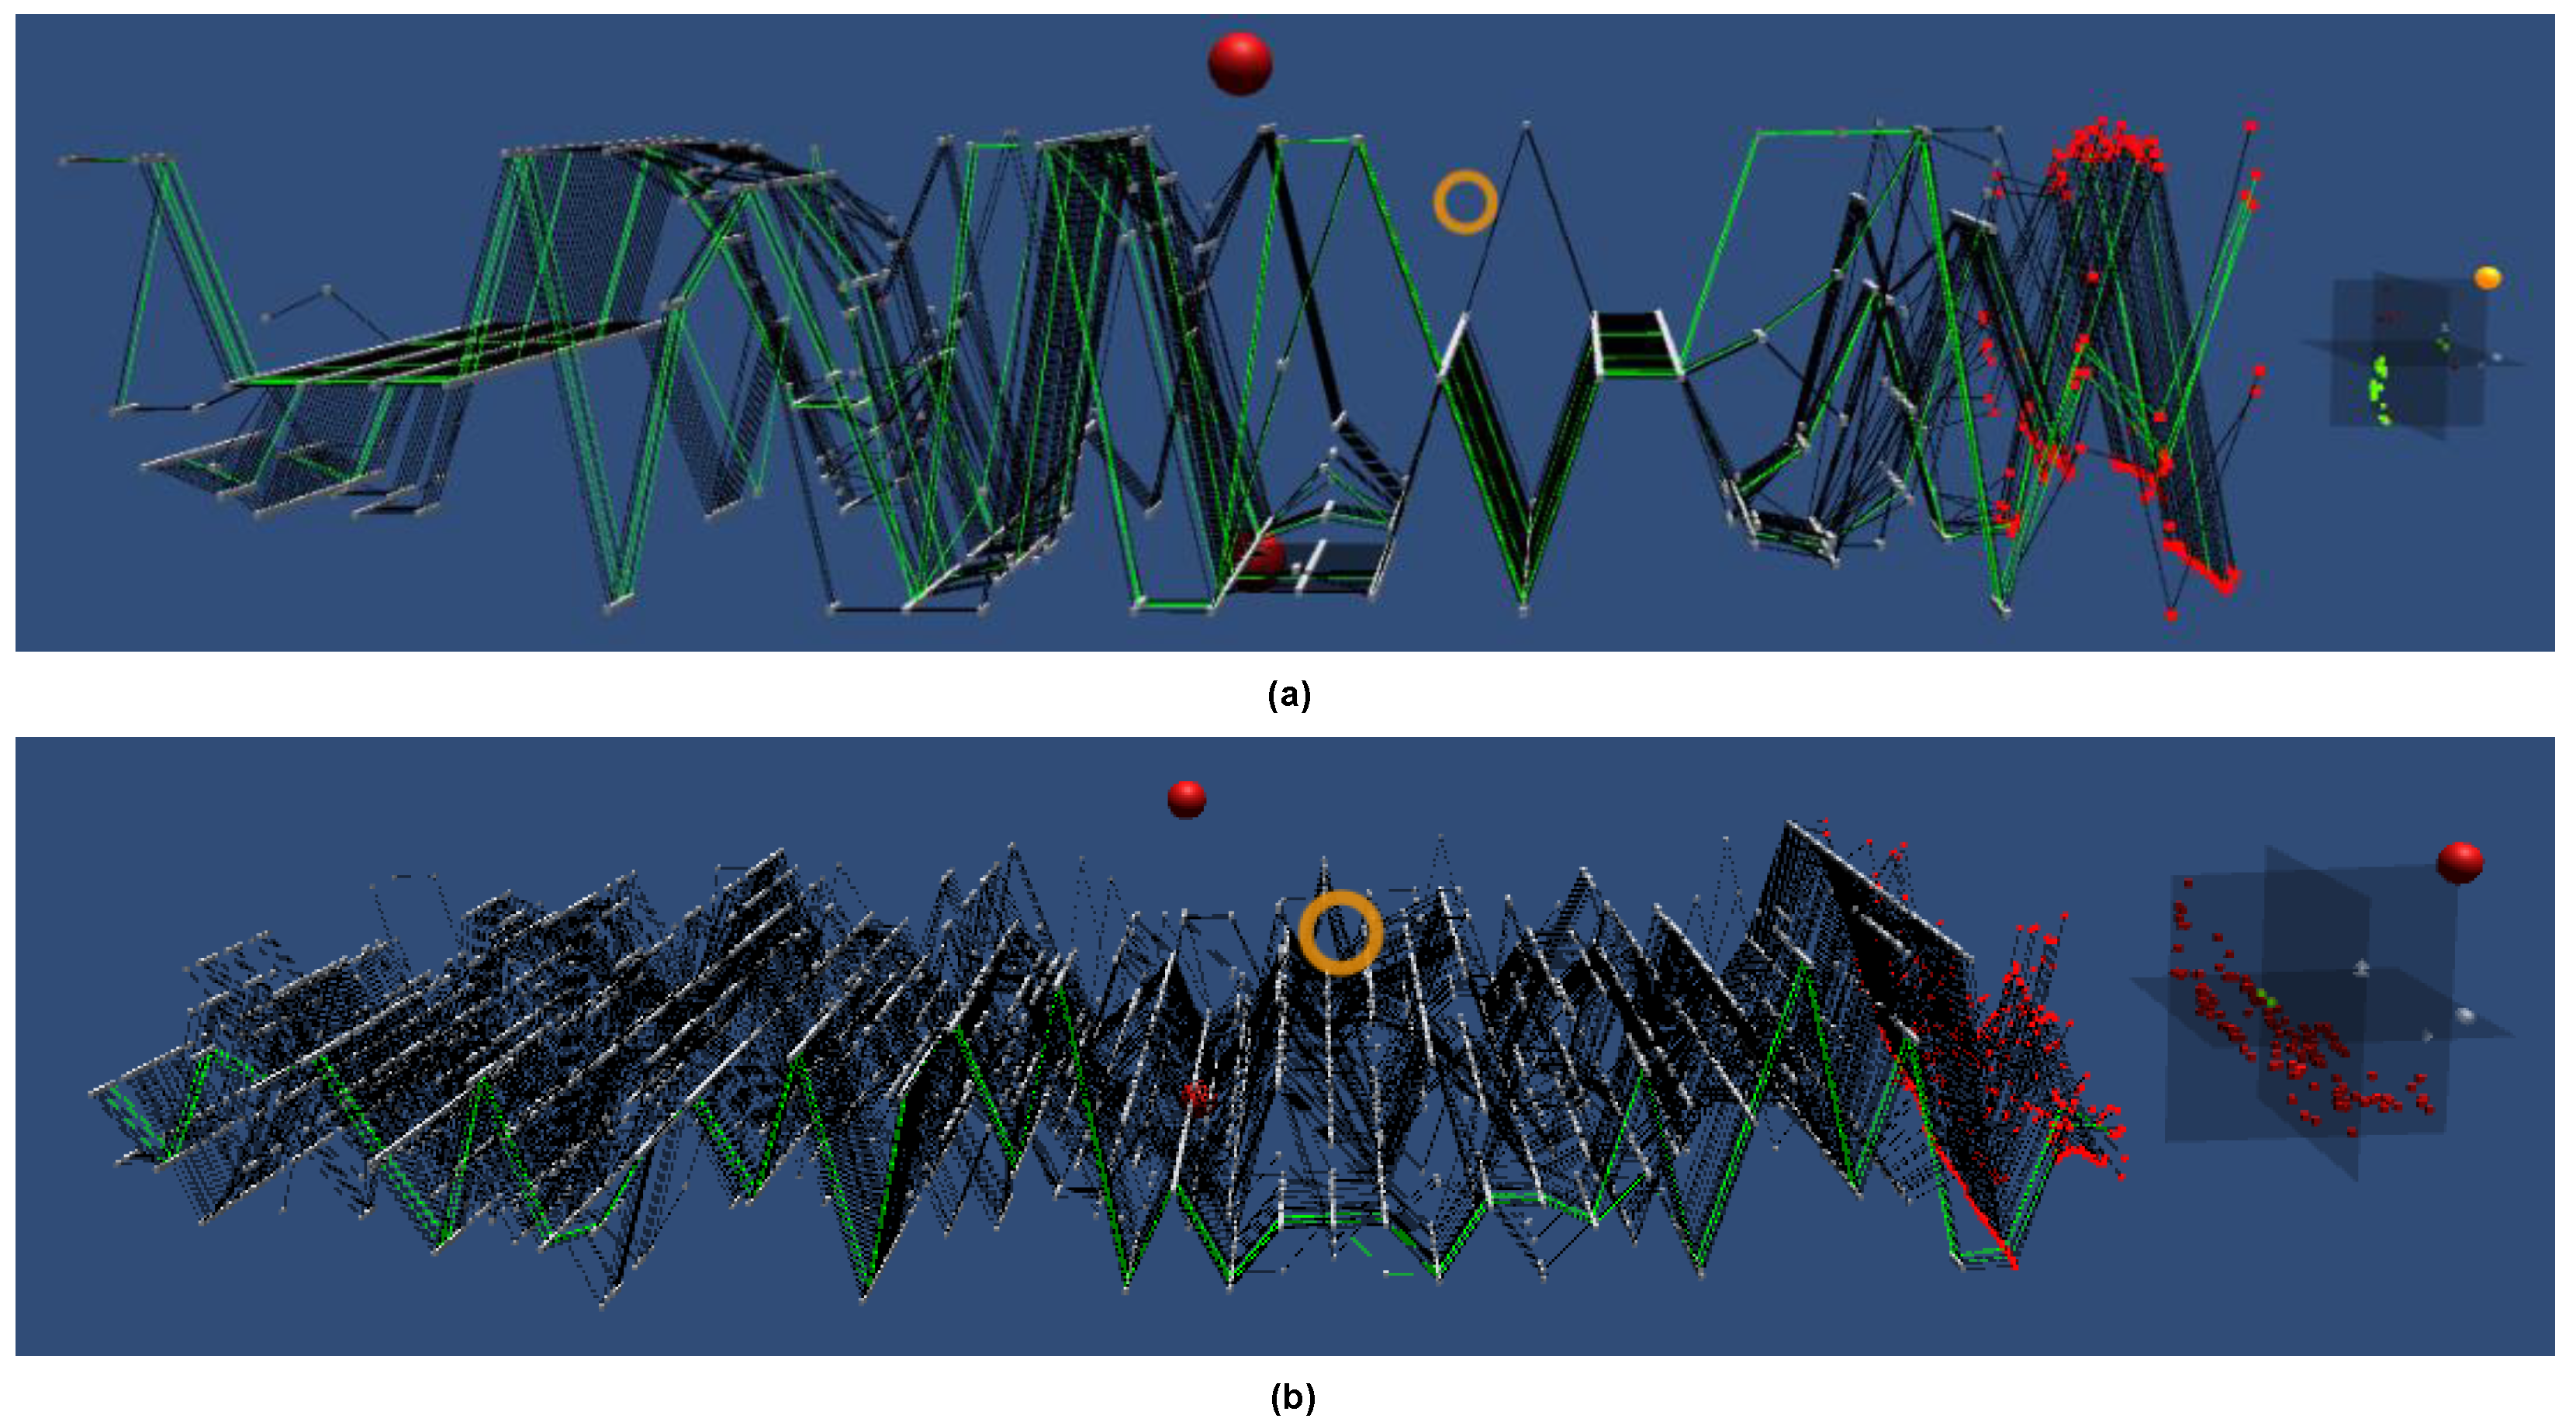
5.2.1. IPCP’s Main Plot
5.2.2. 3D Scatter Plots
6. Data-Science Analytics Integration with IPCP
6.1. Axes Ordering Based on Feature Importances
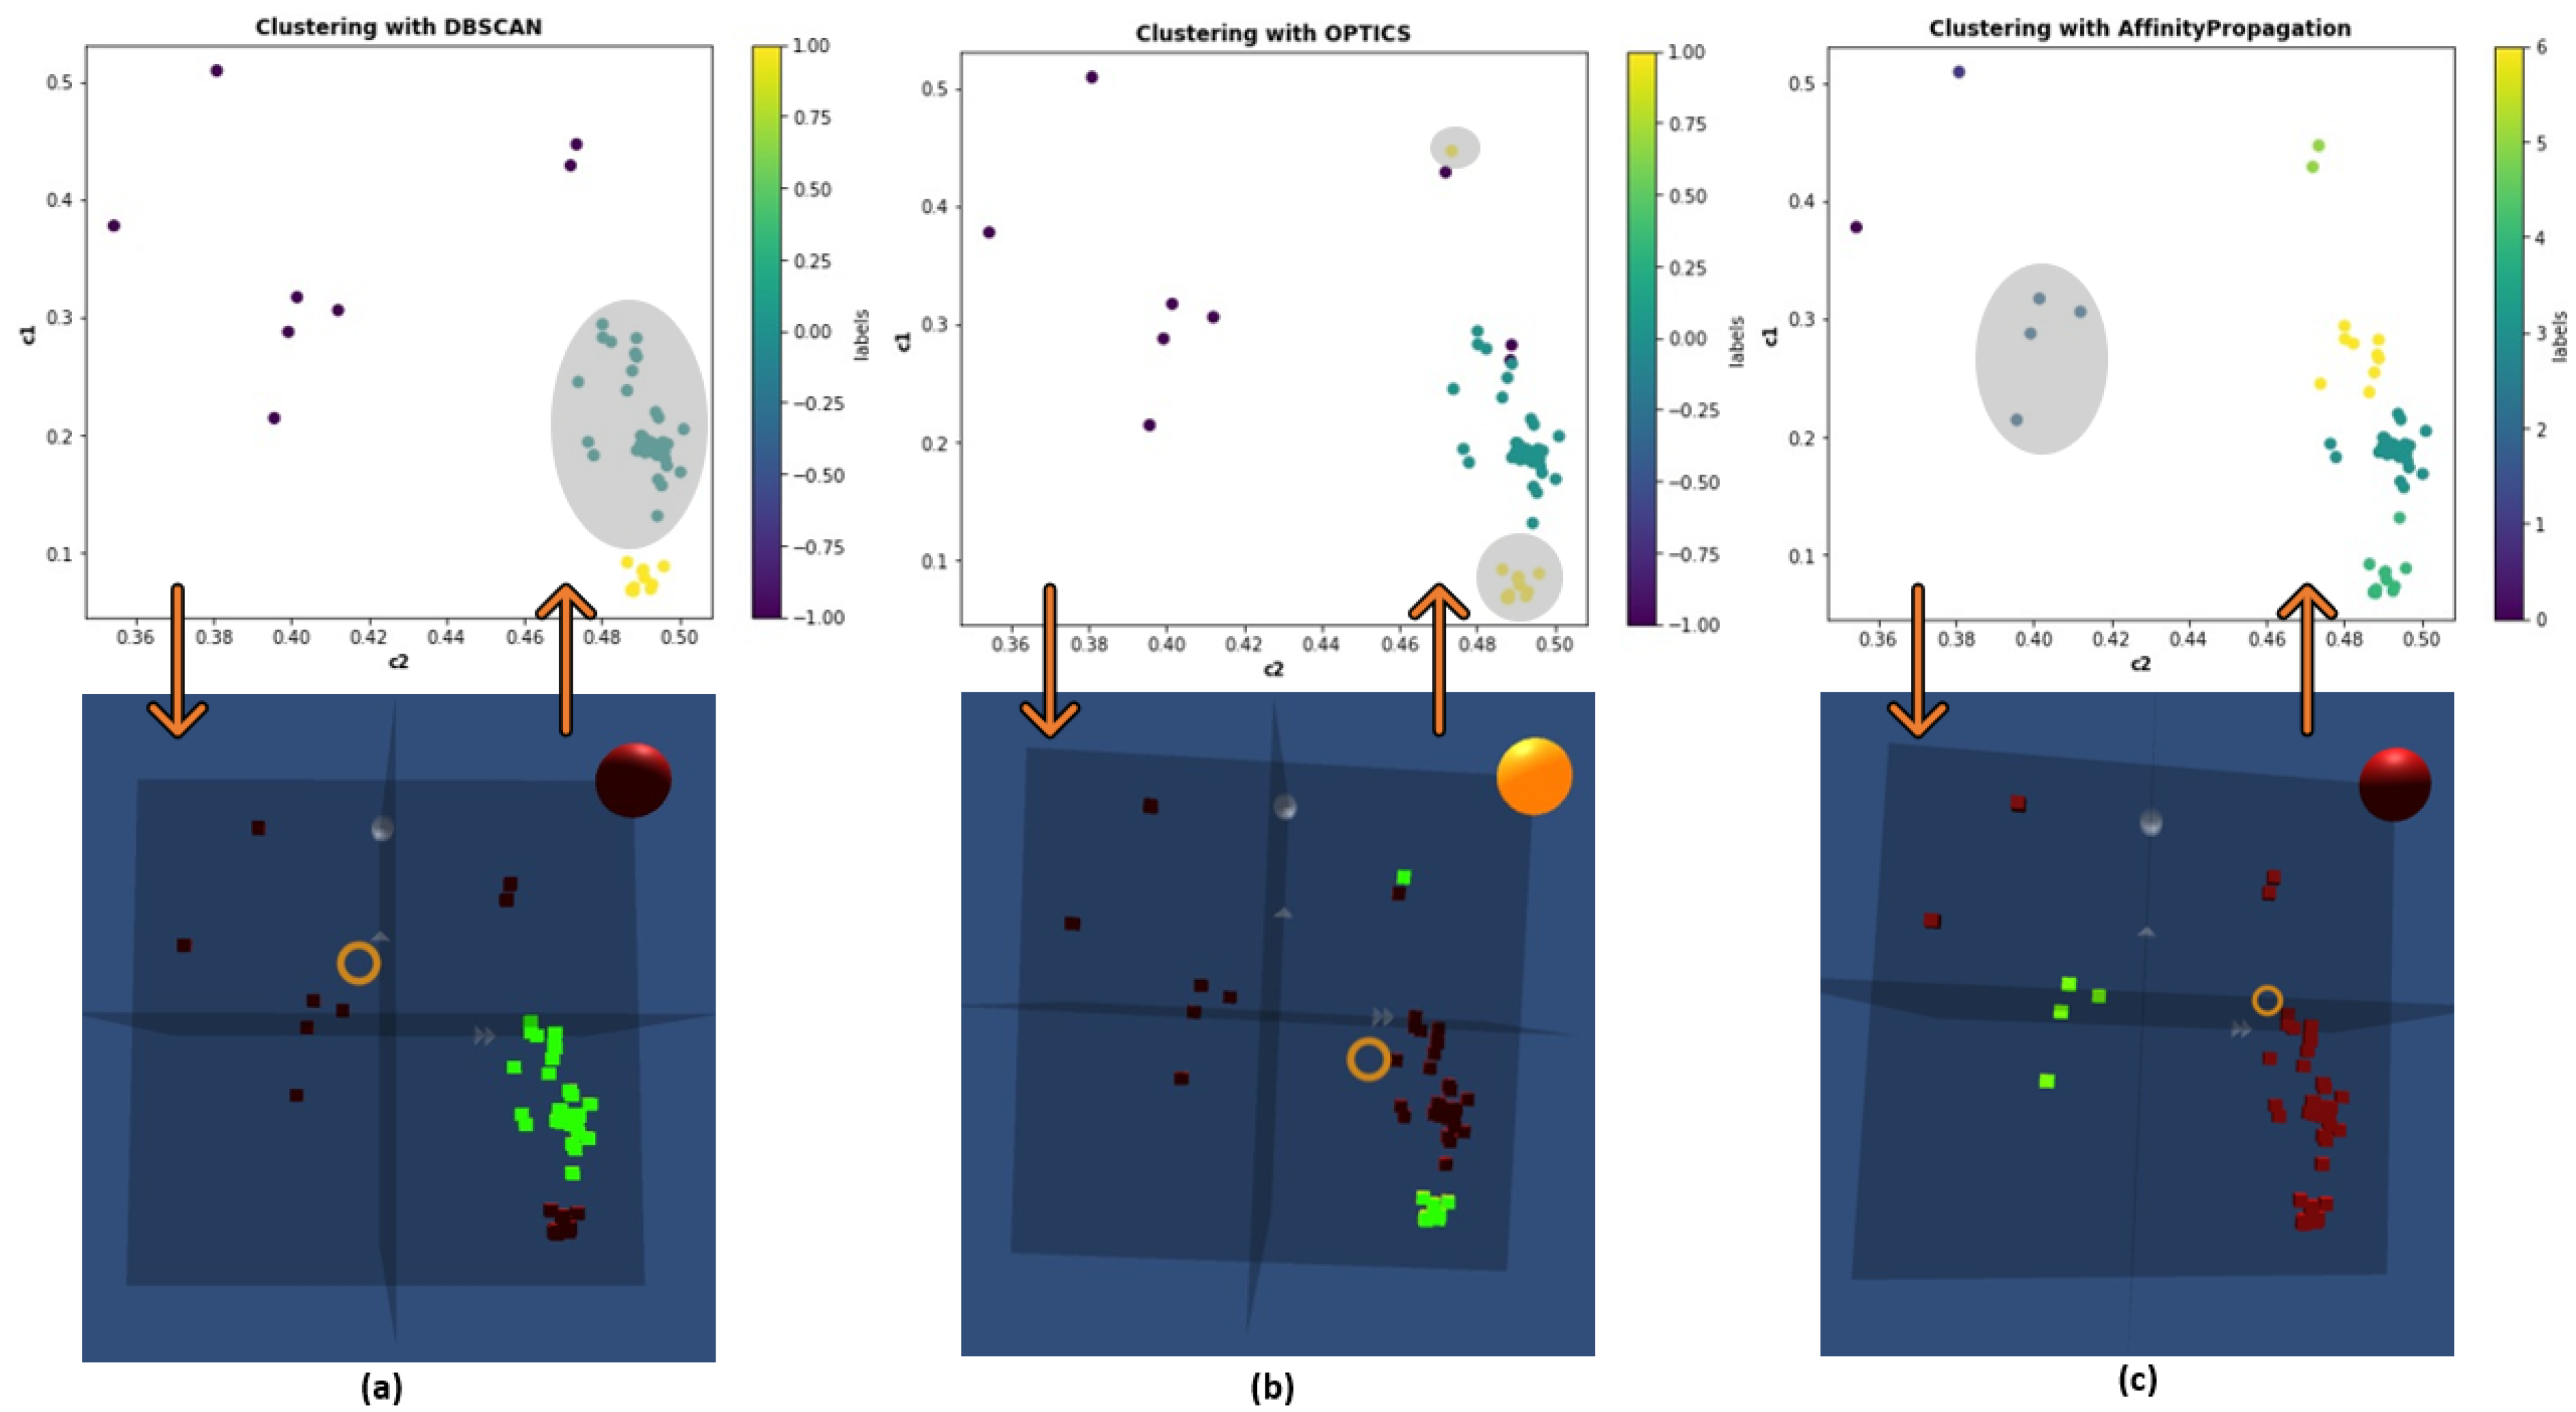
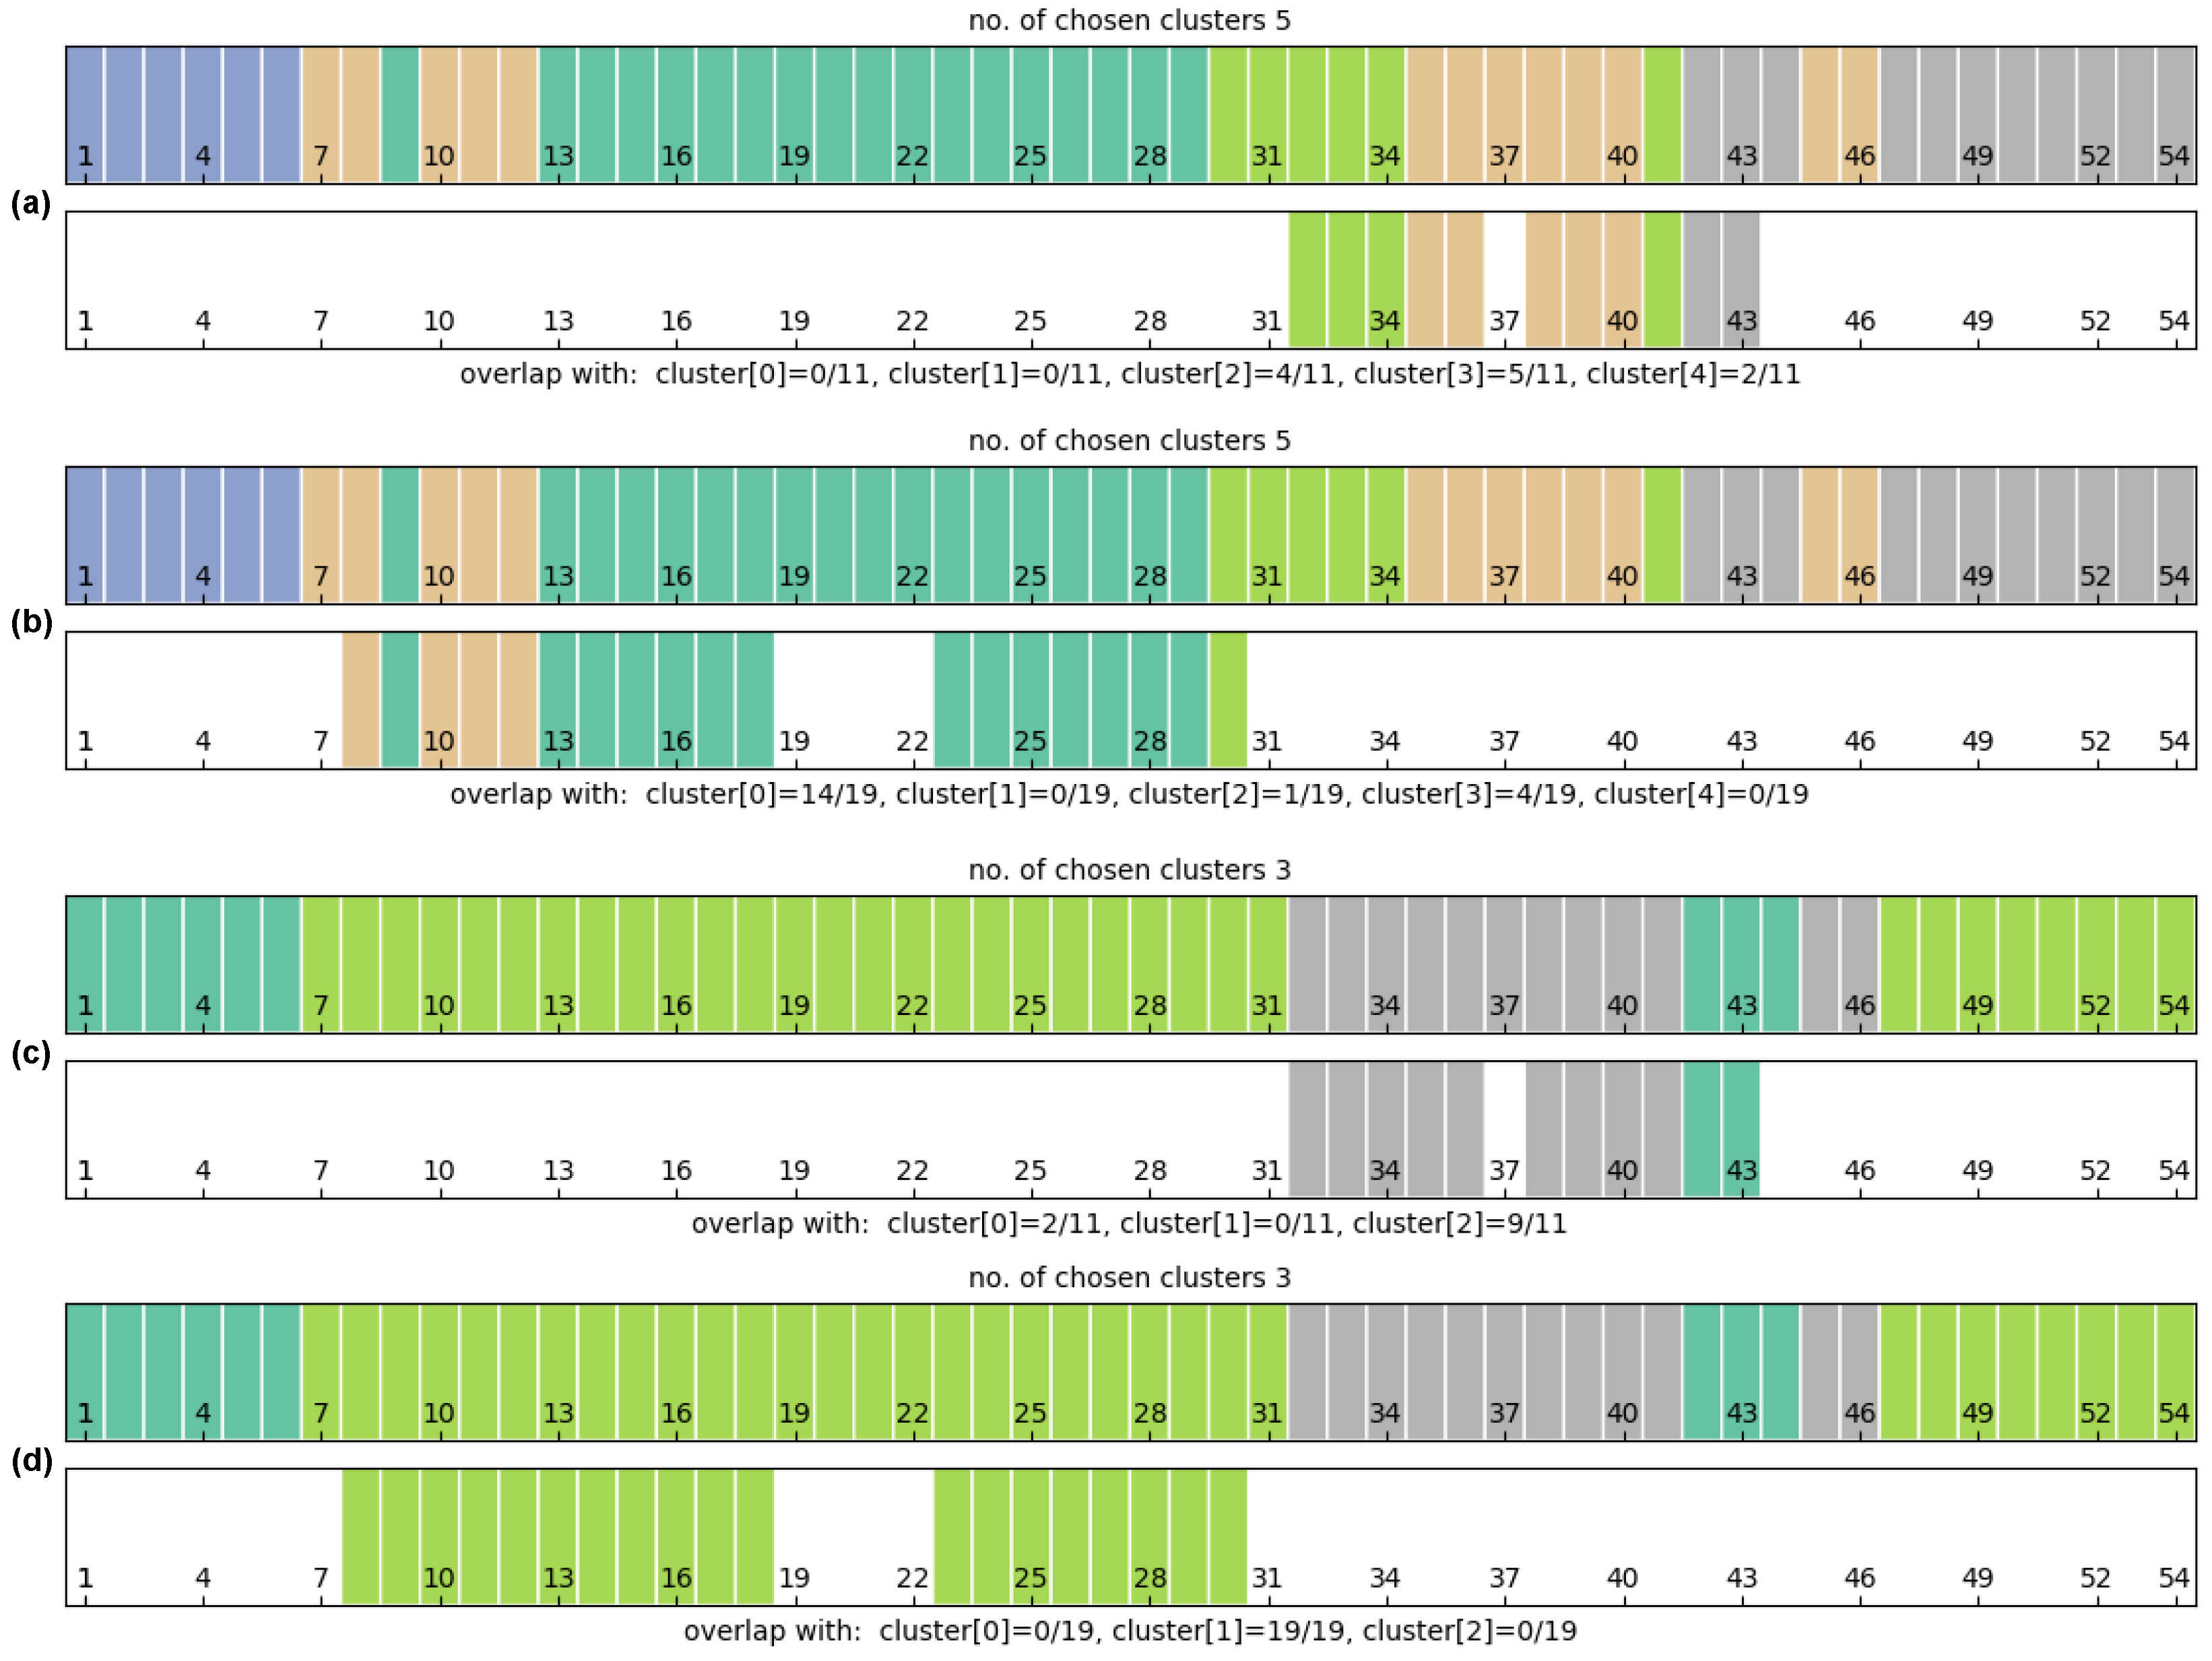
6.2. Clustering Solutions
7. Discussion
8. Conclusions
Author Contributions
Funding
Conflicts of Interest
Abbreviations
| AI | Artificial Intelligence |
| DBSCAN | Density-Based Spatial Clustering of Applications with Noise |
| DS1 | Dataset 1 (Pareto front data; 54 data items with 29 dimension each) |
| DS2 | Dataset 2 (S-duct design optimization study; 166 data items with 39 dimensions each) |
| HMD | Head-Mounted Display |
| IPCP | Immersive Parallel Coordinates Plots |
| OPTICS | Identify the Clustering Structure |
| PCA | Principal Component Analysis |
| PCP | Parallel Coordinates Plots |
| SDK | Software Development Kit |
| SuMC | Subspace Memory Clustering |
| VR | Virtual Reality |
| XAI | Explainable Artificial Intelligence |
References
- Inselberg, A. Parallel Coordinates: Visual Multidimensional Geometry and Its Applications, 1st ed.; Springer: New York, NY, USA, 2009. [Google Scholar]
- Tadeja, S.K.; Kipouros, T.; Kristensson, P.O. Exploring Parallel Coordinates Plots in Virtual Reality. In Proceedings of the Extended Abstracts of the 2019 CHI Conference on Human Factors in Computing Systems, Scotland, UK, 4–9 May 2019; Association for Computing Machinery: New York, NY, USA, 2019; pp. 1–6. [Google Scholar] [CrossRef] [Green Version]
- Tadeja, S.K.; Kipouros, T.; Kristensson, P.O. IPCP: Immersive Parallel Coordinates Plots for Engineering Design Processes. In Proceedings of the AIAA Scitech 2020 Forum, Orlando, FL, USA, 6–10 January 2020. [Google Scholar] [CrossRef] [Green Version]
- Tadeja, S.K.; Kipouros, T.; Lu, Y.; Kristensson, P.O. Supporting Decision Making in Engineering Design Using Parallel Coordinates in Virtual Reality. AIAA J. 2021, 59, 5332–5346. [Google Scholar] [CrossRef]
- Ankerst, M.; Breunig, M.M.; Kriegel, H.P.; Sander, J. OPTICS: Ordering Points to Identify the Clustering Structure. SIGMOD Rec. 1999, 28, 49–60. [Google Scholar] [CrossRef]
- Ester, M.; Kriegel, H.P.; Sander, J.; Xu, X. A Density-based Algorithm for Discovering Clusters a Density-based Algorithm for Discovering Clusters in Large Spatial Databases with Noise. In Proceedings of the Second International Conference on Knowledge Discovery and Data Mining, Portland, OR, USA, 2–4 August 1996; AAAI Press: Palo Alto, CA, USA, 1996; pp. 226–231. [Google Scholar]
- Frey, B.J.; Dueck, D. Clustering by passing messages between data points. Science 2007, 315, 2007. [Google Scholar] [CrossRef] [PubMed] [Green Version]
- Struski, Ł.; Tabor, J.; Spurek, P. Lossy Compression Approach to Subspace Clustering. Inf. Sci. 2017, 435, 161–183. [Google Scholar] [CrossRef]
- Ultraleap. Leap Motion Controller. Available online: https://www.leapmotion.com (accessed on 1 September 2019).
- Wegenkittl, R.; Loffelmann, H.; Groller, E. Visualizing the behaviour of higher dimensional dynamical systems. In Proceedings of the Proceedings. Visualization ’97 (Cat. No. 97CB36155), Phoenix, AZ, USA, 24 October 1997; pp. 119–125. [Google Scholar] [CrossRef]
- Gröller, E.; Löffelmann, H.; Wegenkittl, R. Visualization of Analytically Defined Dynamical Systems. In Proceedings of the Scientific Visualization Conference (dagstuhl ’97), Dagstuhl, Germany, 9–13 June 1997; p. 71. [Google Scholar]
- Streit, M.; Ecker, R.C.; Österreicher, K.; Steiner, G.E.; Bischof, H.; Bangert, C.; Kopp, T.; Rogojanu, R. 3D parallel coordinate systems—A new data visualization method in the context of microscopy-based multicolor tissue cytometry. Cytom. Part A 2006, 69A, 601–611. [Google Scholar] [CrossRef]
- Falkman, G. Information visualisation in clinical Odontology: Multidimensional analysis and interactive data exploration. Artif. Intell. Med. 2001, 22, 133–158. [Google Scholar] [CrossRef]
- Ribarsky, W.; Ayers, E.; Eble, J.; Mukherjea, S. Glyphmaker: Creating customized visualizations of complex data. Computer 1994, 27, 57–64. [Google Scholar] [CrossRef]
- Fanea, E.; Carpendale, S.; Isenberg, T. An interactive 3D integration of parallel coordinates and star glyphs. In Proceedings of the IEEE Symposium on Information Visualization, 2005, INFOVIS 2005, Minneapolis, MN, USA, 23–25 October 2005; pp. 149–156. [Google Scholar] [CrossRef] [Green Version]
- Johansson, J.; Ljung, P.; Jern, M.; Cooper, M. Revealing Structure in Visualizations of Dense 2D and 3D Parallel Coordinates. Inf. Vis. 2006, 5, 125–136. [Google Scholar] [CrossRef]
- Holten, D.; Wijk, J.J.V. Evaluation of Cluster Identification Performance for Different PCP Variants. Comput. Graph. Forum 2010, 29, 793–802. [Google Scholar] [CrossRef]
- Dang, T.N.; Wilkinson, L.; Anand, A. Stacking Graphic Elements to Avoid Over-Plotting. IEEE Trans. Vis. Comput. Graph. 2010, 16, 1044–1052. [Google Scholar] [CrossRef] [PubMed]
- Chang, C.; Dwyer, T.; Marriott, K. An Evaluation of Perceptually Complementary Views for Multivariate Data. In Proceedings of the 2018 IEEE Pacific Visualization Symposium, Kobe, Japan, 10–13 April 2018; pp. 195–204. [Google Scholar] [CrossRef]
- Johansson, J.; Forsell, C.; Cooper, M. On the usability of three-dimensional display in parallel coordinates: Evaluating the efficiency of identifying two-dimensional relationships. Inf. Vis. 2014, 13, 29–41. [Google Scholar] [CrossRef]
- Rosenbaum, R.; Bottleson, J.; Liu, Z.; Hamann, B. Involve Me and I Will Understand!: Abstract Data Visualization in Immersive Environments. In Proceedings of the 7th International Conference on Advances in Visual Computing—Volume Part I, Las Vegas, NV, USA, 26–28 September 2011; Springer: Berlin/Heidelberg, Germany, 2011; pp. 530–540. [Google Scholar]
- Butscher, S.; Hubenschmid, S.; Müller, J.; Fuchs, J.; Reiterer, H. Clusters, Trends, and Outliers: How Immersive Technologies Can Facilitate the Collaborative Analysis of Multidimensional Data. In Proceedings of the 2018 CHI Conference on Human Factors in Computing Systems, Montreal, QC, Canada, 21–26 April 2018; ACM: New York, NY, USA, 2018; pp. 90:1–90:12. [Google Scholar] [CrossRef] [Green Version]
- Cordeil, M.; Cunningham, A.; Dwyer, T.; Thomas, B.H.; Marriott, K. ImAxes: Immersive Axes As Embodied Affordances for Interactive Multivariate Data Visualisation. In Proceedings of the 30th Annual ACM Symposium on User Interface Software and Technology, Quebec, QC, Canada, 22–25 October 2017; ACM: New York, NY, USA, 2017; pp. 71–83. [Google Scholar] [CrossRef]
- Batch, A.; Cunningham, A.; Cordeil, M.; Elmqvist, N.; Dwyer, T.; Thomas, B.H.; Marriott, K. There Is No Spoon: Evaluating Performance, Space Use, and Presence with Expert Domain Users in Immersive Analytics. IEEE Trans. Vis. Comput. Graph. 2019. [Google Scholar] [CrossRef] [PubMed]
- Oculus, V.R. Oculus Rift. Available online: https://www.oculus.com (accessed on 1 November 2018).
- Kipouros, T.; Jaeggi, D.M.; Dawes, W.N.; Parks, G.T.; Savill, A.M.; Clarkson, P.J. Insight Into High-Quality Aerodynamic Design Spaces through Multi-Objective Optimization. CMES Comput. Model. Eng. Sci. 2008, 37, 1–44. [Google Scholar]
- D’Ambros, A.; Kipouros, T.; Zachos, P.; Savill, M.; Benini, E. Computational Design Optimization for S-ducts. Designs 2018, 2, 36. [Google Scholar] [CrossRef] [Green Version]
- Pedregosa, F.; Varoquaux, G.; Gramfort, A.; Michel, V.; Thirion, B.; Grisel, O.; Blondel, M.; Prettenhofer, P.; Weiss, R.; Dubourg, V.; et al. Scikit-learn: Machine Learning in Python. J. Mach. Learn. Res. 2011, 12, 2825–2830. [Google Scholar]
- Rosenberg, A.; Hirschberg, J. V-Measure: A Conditional Entropy-Based External Cluster Evaluation Measure. In Proceedings of the 2007 Joint Conference on Empirical Methods in NLP and Computational Natural Language Learning (EMNLP-CoNLL); Association for Computational Linguistics: Prague, Czech Republic, 2007; pp. 410–420. [Google Scholar]
- Ding, C.; He, X. K-means clustering via principal component analysis. In Proceedings of the Twenty-First International Conference on Machine Learning, Banff, AB, Canada, 4–8 July 2004; ACM: New York, NY, USA, 2004; p. 29. [Google Scholar]
- Agrawal, R.; Gehrke, J.; Gunopulos, D.; Raghavan, P. Automatic Subspace Clustering of High Dimensional Data for Data Mining Applications. SIGMOD Rec. 1998, 27, 94–105. [Google Scholar] [CrossRef] [Green Version]
- Moise, G.; Sander, J. Finding Non-Redundant, Statistically Significant Regions in High Dimensional Data: A Novel Approach to Projected and Subspace Clustering. In Proceedings of the 14th ACM SIGKDD International Conference on Knowledge Discovery and Data Mining, Las Vegas, NV, USA, 24–27 August 2008; Association for Computing Machinery: New York, NY, USA, 2008; pp. 533–541. [Google Scholar] [CrossRef]
- Breiman, L. Random Forests. Mach. Learn. 2001, 45, 5–32. [Google Scholar] [CrossRef] [Green Version]
- Ribeiro, M.T.; Singh, S.; Guestrin, C. “Why Should I Trust You?”: Explaining the Predictions of Any Classifier. arXiv 2016, arXiv:1602.04938. [Google Scholar]
- Lundberg, S.M.; Lee, S.I. A Unified Approach to Interpreting Model Predictions. In Advances in Neural Information Processing Systems 30; Guyon, I., Luxburg, U.V., Bengio, S., Wallach, H., Fergus, R., Vishwanathan, S., Garnett, R., Eds.; Curran Associates, Inc.: Red Hook, NY, USA, 2017; pp. 4765–4774. [Google Scholar]
- Ribeiro, M.T.; Singh, S.; Guestrin, C. Anchors: High-Precision Model-Agnostic Explanations. In Proceedings of the AAAI Publications, Thirty-Second AAAI Conference on Artificial Intelligence, New Orleans, LA, USA, 2–7 February 2018. [Google Scholar]
- Guo, H.; Xiao, H.; Yuan, X. Scalable Multivariate Volume Visualization and Analysis Based on Dimension Projection and Parallel Coordinates. IEEE Trans. Vis. Comput. Graph. 2012, 18, 1397–1410. [Google Scholar] [CrossRef] [PubMed] [Green Version]
- Tadeja, S.K.; Kutt, K.; Lu, Y.; Seshadri, P.; Nalepa, G.J.; Kristensson, P.O. Jarvis for Aeroengine Analytics: A Speech Enhanced Virtual Reality Demonstrator Based on Mining Knowledge Databases. arXiv 2021, arXiv:2107.13403. [Google Scholar]


| Algorithm | V-Measure | Homogeneity | Completeness |
|---|---|---|---|
| Gaussian Mixture | 0.55 | 0.50 | 0.62 |
| Spectral Clustering | 0.13 | 0.09 | 0.24 |
| Agglomerative Clustering | 0.55 | 0.50 | 0.62 |
| Affinity Propagation | 0.59 | 0.70 | 0.50 |
| Mean Shift | 0.17 | 0.13 | 0.23 |
| Birch | 0.13 | 0.09 | 0.24 |
| OPTICS | 0.58 | 0.54 | 0.61 |
| DBSCAN | 0.78 | 0.78 | 0.78 |
Publisher’s Note: MDPI stays neutral with regard to jurisdictional claims in published maps and institutional affiliations. |
© 2021 by the authors. Licensee MDPI, Basel, Switzerland. This article is an open access article distributed under the terms and conditions of the Creative Commons Attribution (CC BY) license (https://creativecommons.org/licenses/by/4.0/).
Share and Cite
Bobek, S.; Tadeja, S.K.; Struski, Ł.; Stachura, P.; Kipouros, T.; Tabor, J.; Nalepa, G.J.; Kristensson, P.O. Virtual Reality-Based Parallel Coordinates Plots Enhanced with Explainable AI and Data-Science Analytics for Decision-Making Processes. Appl. Sci. 2022, 12, 331. https://doi.org/10.3390/app12010331
Bobek S, Tadeja SK, Struski Ł, Stachura P, Kipouros T, Tabor J, Nalepa GJ, Kristensson PO. Virtual Reality-Based Parallel Coordinates Plots Enhanced with Explainable AI and Data-Science Analytics for Decision-Making Processes. Applied Sciences. 2022; 12(1):331. https://doi.org/10.3390/app12010331
Chicago/Turabian StyleBobek, Szymon, Sławomir K. Tadeja, Łukasz Struski, Przemysław Stachura, Timoleon Kipouros, Jacek Tabor, Grzegorz J. Nalepa, and Per Ola Kristensson. 2022. "Virtual Reality-Based Parallel Coordinates Plots Enhanced with Explainable AI and Data-Science Analytics for Decision-Making Processes" Applied Sciences 12, no. 1: 331. https://doi.org/10.3390/app12010331
APA StyleBobek, S., Tadeja, S. K., Struski, Ł., Stachura, P., Kipouros, T., Tabor, J., Nalepa, G. J., & Kristensson, P. O. (2022). Virtual Reality-Based Parallel Coordinates Plots Enhanced with Explainable AI and Data-Science Analytics for Decision-Making Processes. Applied Sciences, 12(1), 331. https://doi.org/10.3390/app12010331