1. Introduction
Thailand is the second economy of Southeast Asia and one of the world’s leading producers of agriculture products. According to the statistics of Thai exports in 2020, the Thai agricultural export growth decreased by 9.31%. The export of agricultural production consists of rice 22.24%, cassava 21.47%, sugar 29.51% and others 26.78% [
1]. Thailand has expanded exports to China by 2.86%, with the top three products being frozen chicken, fresh fruit and frozen shrimp. The frozen chicken had the highest exports. China has encountered a shortage of pork because of African swine fever, which caused the high price of pork in China’s market. Chinese people have turned to consume chicken instead of pork. Therefore, China imports more chicken products from Thailand [
2]. In the past, the government and private sectors have worked continually to co-develop Thailand’s logistics system. In addition, the Thai business sector has increased the awareness and importance of the development of logistics management systems within the organization. In 2020, Thailand increased logistics costs per GDP, with the freight forwarding agency increasing by 6.7% and the warehouse storage by 5.7% [
3].
The poultry industry of Thailand is the most promising agri-food segment, especially the egg industry. The logistics of the egg industry can be separated into three parts, which are inbound logistics, internal logistics and outbound logistics (
Figure 1). First, the inbound logistics of egg production starts with purchasing chicks from a hatchery and transporting them to pullet-raising farms. Second, the internal logistics of egg production is when chicks turn into a hen at about 17 weeks old; the hens must be moved to a laying unit (hen houses) for harvesting eggs until the age of 75 weeks. Eggs must be sorted by size at the egg processing center, then sent to the egg packaging process. Once the hens cannot perform as layers (spent hens), they will be moved to be slaughtered at the farm’s slaughterhouse. Third, outbound logistics of production is where companies collect eggs (finished goods), store the eggs for safe inventory, and distribute products (eggs and chicken) to customers or end consumers. In the logistics of the egg industry, egg distribution planning is considered a crucial problem because egg distribution is a main cause of increasing total cost in the egg industry. Nowadays, the case study company has insufficient suitable decision tools.
At present, the case study company has no decision tools for minimizing total cost in outbound logistics. The egg distribution problem is highly complex, primarily because of the need to respect labor costs of a driver, variety of vehicle capacity (volume), duration time of route restriction, the time window of the customer, various demands of egg sizes for each customer and inventory restrictions. Moreover, the characteristic of the problem can be classified as a multi-depot problem since eggs can be delivered from more than one distribution center, and the numbers of available vehicles are different at each depot. Therefore, if the outbound logistics of the egg industry cannot be managed effectively, there will be an increase in transportation distance, transportation time and the number of transport vehicles which directly increases the total cost.
This paper focuses on the outbound logistics activity of the case study. The problem is formulated as a Multi-Depot, Multi-Product Heterogeneous Fleet Vehicle Routing Problem with Time Window and Inventory restriction (MDPVRPTWI) in the various practical operations of the real-world industry. The objective is to minimize total costs consisting of transportation costs, labor costs of drivers and holding costs. To solve this problem, the customer’s distance from each depot, numbers of vehicles used and holding cost at each depot are considered for modeling and solving to obtain optimal solutions. We developed a Mixed Integer Linear Programming (MILP) model for a small-sized problem. This problem is considered an NP-hard (non-deterministic polynomial-time hardness) problem that cannot be solved by MILP optimally in a small computational time. We developed a hybrid and new self-adaptive process for the Differential Evolution (DE) algorithm to solve a large-sized problem.
The remainder of this paper is organized as follows.
Section 2 is the literature review. An overview of the egg distribution problem is presented in
Section 3.
Section 4 introduces the proposed solution strategy. The experimental results are given in
Section 5. Finally,
Section 6 is the conclusion of the work of this paper.
2. Literature Review
A brief review of multi-depot, heterogeneous fleet, time window, multi-product, and inventory restriction and solution is presented in this section.
Pick-up and delivery problems (PDPs) are concerned with a type of vehicle routing problem (VRP) in which goods or persons come from different origins and go to different destinations [
4]. PDP issues occur in various contexts, including logistics, ambulatory care and robotics [
5,
6]. Vehicles available to pick up and deliver cargo can have heterogeneous capacities. Each vehicle’s load must not exceed its capability. However, depending on the problem, additional assumptions, and restrictions on vehicle paths, such as time windows or repeated visits at certain vertices, can be presented. Wang et al. [
7] proposed an exact method and a constructive heuristic approach from the min-max split delivery multi-depot vehicle routing problem with a minimum service time requirement. In this problem, each customer requires a specified amount of service time. They generated instance ranges from 10 to 500 and 3 to 20 for the customer and depot, respectively, to investigate the constructive heuristic. They tested the heuristic on three sets of data with 43, 21 and 258 instances. The heuristic result on the first and second sets of data was 2% and 1.5%. However, the third set of heuristics is more substantial when the average number of customers per route is small and there is a medium level of average customer service time. Kachitvichyanukul et al. [
8] studied a multi-depot vehicle routing problem with multiple pick-up and delivery requests. They developed a solution approach based on Particle Swarm Optimization (PSO) to create a new particle for an assignment using a vehicle that created a decoding method to find the best solution. They used 56 sample problems with the best-known solution and divided the instance problems into 13, 17 and 26 for clustered location, random location, mixed cluster and random locations. All the instance problems were compared with their previous work and the best-known solutions. The conclusion showed that the new decoding method for PSO provided better solutions for their problems than their previous work. Mancini [
9] developed an exact method, initial solution and Adaptive Large Neighborhood Search (ALNS) based metaheuristic on the multi-depot multi-period vehicle routing problem with a heterogeneous fleet for minimizing the total cost. They proposed 1 to 9 instances and a number of customers ranging from 50 to 75 customers. They compared the LANS algorithm results with the Large Neighborhood Search (LNS) algorithm. LANS showed higher-quality performance over LNS that averaged a computational time of 400 s and obtained an averaged percentage improvement of 55% to the constructive heuristic.
Most authors have developed a mathematical model to solve multi-product vehicle routing problems and planning problems in transport-related industries, which are difficult to solve in a reasonable amount of time for medium or large-sized problems [
10] and for the multi-depot vehicle routing problem [
11,
12]. In 2014, Salhi et al. [
13] proposed a mixed vehicle routing problem on the multi-depot routing with a heterogeneous vehicle and a mixed-integer linear model for solving the problem. The multi-product VRP can be better illustrated in
Figure 2.
In the last decade, inventory restrictions have also been extensively studied to solve the problem. For example, Chen et al. [
14] proposed an improved variable neighborhood search (VNS) algorithm with a heuristic to solve VRP with an unpaired pick-up, delivery and split loads. They considered a constraint about the demand of customers for each various product and inventory restriction. The inventory levels and quantity of demanded products were described that should be suitably allocated to minimize total cost. Qiu et al. [
15] studied multi-product multi-vehicle production routing problems (MMPRPs) with fixed production startup cost, setup cost of each problem, and inventory restriction. Their objective was to minimize total cost, including the operational cost of the production, inventory cost and transportation cost. Bouanane et al. [
16] proposed a hybrid genetic algorithm that incorporates three different procedures to solve the multi-depot vehicle routing problem: simultaneous delivery and pick-up, and inventory restrictions.
Table 1 summarizes the studies about the VRP in the literature.
In the scholarly literature, logistics for egg industry applications have received much attention. Most of the egg industry research has been focused on value chain optimization and the allocating pullets problems, such as transportation supply for smooth operations. We refer readers to Seydim and Dawson [
17], Boonmee et al. [
18], Dechampai et al. [
19] and Hisasaga et al. [
20] In previous work in the same company case study, Boonmee et al. [
18] studied the inbound logistics of egg production for allocating pullets to hen houses to minimize the total cost. The total cost included the cost of farm utilization, transportation cost from pullet farms to hen farms, and loss from mixing hens at different ages in the same hen houses. They used traditional Growing Neural Gas (GNG) and Hybrid GNG to solve their problem. Additionally, Dechampai et al. [
19] presented a vehicle routing problem with mixed pick-up and delivery services (PDP). They developed two heuristics to minimize the total cost of fuel and vehicle utilization in the internal logistics of egg production to minimize the distance from pullet farm to hen farm and the vehicle rental cost. The first heuristic used the Differential Evolution (DE) algorithm for clustering the pullet houses. The second heuristic used multifactor-based evolving Self-Organizing Maps (SOM) with the DE algorithm for minimizing the transfer from pullet farms to the hen farms.
Various approaches have been used to solve the problem. DE has been established as a new evolutionary strategy during the last decade. The DE algorithm was first implemented by Storn and Price [
21] and was effectively implemented to optimize algorithms. One of the most efficient evolutionary algorithms is DE, which is a population-based metaheuristic. DE has been used successfully in various areas, including output scheduling [
22] and transportation [
23]. For the VRP scheduling problem, Kunnapapdeelert and Kachitvichyanukul [
24] created four new DE-based algorithms for solving the multi-depot vehicle routing problem. Two of the improved DE algorithms are focused on subgrouping, and the other two are based on strategy swapping. In the same year, Akararungruangkul and Kaewman [
25] proposed DE to solve the location routing problem (SLRP) when the objective function is fuel consumption. Fan et al. [
26] presented a DE with knowledge-based control parameters and strategy adaptation, combining three well-known test suites. Later, Zhang et al. [
27] proposed the parallel DE to minimize transport costs and penalties due to logistics service providers’ delays. Marinaki et al. [
28] developed a distance-related DE to maximize the total price collected. Recently, Sethanan and Jamrus [
29] proposed a hybrid DE to solve the multi-trip vehicle routing problem with backhauls and heterogeneous fleets in the beverage logistics industry. They demonstrated the benefit of using self-adaptive strategies because the user does not have to change the control parameters. The total computational effort was able to converge faster and significantly reduced into efficient solutions. As a result, this paper proposes a new Hybrid and Self-Adaptive Differential Evolution algorithm (HSADE) that combines their respective benefits, increasing the robustness to solve the problem. We suggest the HSADE that includes Hybrid and Self-Adaptive modification of the DE algorithm, which can also include self-adaptive mutation strategies, control parameters for crossover rate probability and hybrid neighborhood search structures using the probability exchange equation. We focus on addressing egg distribution planning transportation by improving the efficient solution in terms of the total cost, including the transportation cost, labor cost and holding cost. There is no work in the literature to the best of our knowledge interested in the interaction between these constraints: multi-depot, heterogeneous fleet, time window, multi-product and inventory restriction.
4. Solution Strategies
The MILP developed in
Section 3 can be solved optimally for small-sized instances. We developed a Hybrid and Self-Adaptive Differential Evolution algorithm (HSADE) to solve our proposed model and compared performance solutions through numerical experiments in handling large-sized instances. The traditional Differential Evolution algorithm (DE) initializes a set of the dimension of vectors and obtains the best dimensions iteratively via the DE mechanisms (i.e., mutation, recombination). In solution strategies, HSADE combines the constructive heuristic for the initial solution, the self-adaptive mutation strategies, and the neighborhood search by probability (NSP).
In
Section 4.1,
Section 4.2,
Section 4.3 and
Section 4.4 we divided this section to explain the frameworks for the proposed HSADE; first, the initialization representation is described, then the procedure of the self-adaptive mutation strategies and the proposed HSADE are presented and, finally, the fitness value and the selection operation of HSADE are described. The Framework of the HSADE algorithm is shown in
Figure 3 4.1. Initialization of HSADE
In HSADE, the dimensions in each vector are identified by a limited number of the vehicles on each depot id and a customer id sequence in which the customer’s id is sorted in increasing order. A random real number in the range (0–1) is generated for each corresponding id (
Figure 4). The vectors are split into two sub-vector arrays of length |
D|+|
N| since there are |
D| depots and |
N| customers, for example, two depots and ten customers, denoted as vector array Tg. The first array is the ratio number of the route for each depot id in Tg(1, |
D|), while the second array is the customer’s id and the random read number in Tg(1, |
N|) (
Figure 4a)
For example, see the first array in
Figure 4a, where the limited number of the vehicles from each depot equals three and four. The dimensions with the random number are {0.57, 0.36}. Depot 1 has the probability of selecting a vehicle equal to 1/3, which means the range [0,0.33], [0.33,0.66], and [0.66,1.00] for vehicles number 1, 2 and 3, respectively. Depot 1, as the random number is 0.57, must have at least two vehicles. Similarly, Depot 2 has the random number 0.36 so must assign at least two vehicles. (see
Figure 4b).
In the second array, the customer sequence can be obtained with ascending Rank Order Value (ROV) decoding from a randomly real number. Consequently, the customer sequence is depicted as {3,8,10,4,7,1,9,5,6,2}
Figure 4b.
4.1.1. Initial Solution of HSADE
This section represents generating a feasible initial solution by the constructive heuristic. There are two parts to generate an initial solution. The first is to cluster customers to each of the depots |D|. The clustered customers are assigned to the nearest depot because the objective function is to minimize the total cost. For example, there are two depots, D1 and D2, and |N| customers. The distances between customers and the depot are di,D1, and di,D2. Each customer must be assigned to a single depot. The selection, if di,D1 is less than di,D2, then assigns customer i to depot 1; if di,(D1 is greater than di,D2, then assign customer i to depot 2; if di,D1 is equal to di,D2, assign a depot arbitrarily.
The second is to find the route to each customer for each depot by the Nearest Neighbor Heuristic (NNH) [
30]. The NNH starts with the nearest customer of each depot, then finds the shortest distance connecting the previous customer until all customers are selected.
Referring to
Section 4.1, the encoding of the initial solution with initialization of HSADE,
Figure 5a represents the customer sequences {4,2,6,5}, and the customer sequences {10,7,9,1,3,8} are clustered by D1 and D2, respectively. Both sequencings are generated by NNH.
4.1.2. Initial Solution Translation of HSADE
The purpose of the initial solution translation is to convert the initial solution back to the current vector. As explained, a vector is encoded as a vector array, which consists of the customer’s id (denoted by CT-10) and a random real number (
Figure 5a) (denoted by RN-10). Referring to the
Section 4.1.1 (
Figure 5a), the constructive heuristic obtained a customer sequence {4,2,6,5,10,7,9,1,3,8} (denoted by FT-10); the dimension sequence CT-10 is replaced into FT-10. The initial solution translation is to change the RN-10 to the new position dimension that corresponds with a customer sequence (1, |
N|).
For example,
Figure 5b obtains a customer sequence CT-10, the dimension sequence corresponds to {0.090, 0.133, 0.210, 0.409, 0.666, 0.695, 0.778, 0.858, 0.949, 0.990} (denoted by HCT-10) and when decoded the vector can return to the initial solution of a customer sequence FT-10. Thus, the translation obtains the new dimension changed from RN-10 to HCT-10 (
Figure 5c). In the vector iteration, the initial solution dimension is the role to guide for updating the new generation of target vectors.
4.2. Self-Adaptive Differential Evolution Algorithm with Mutation Strategies Adaptation
This section represents the new self-adaptive DE algorithm with mutation strategies adaptation. The mutation strategy is used to generate a mutated vector (
), where the performance of DE is significantly influenced by the selection of mutation strategies [
31].
The famous mutation equation strategies are listed as follows:
where
r1,…,r5 are the random vectors within the range of the number of the population [1,
NP], and each
r must be different (i.e.,
r1≠r2≠r3≠r4≠r5). The mechanism of self-adaptive mutation strategies) is introduced below.
4.2.1. Self-Adaptive Mutation Strategies
The self-adapting mutation procedure can be described as follows:
(1) The number of vectors of each mutation strategy for adapting mutation strategies (called the Weak strategy) is computed as follows:
where Equation (35) denotes
, which is the difference between the objective function value of each vector and the best objective function value, and
is the difference between the average objective function value and the objective function value of each vector. It is how to select the weak strategies out of all vectors.
(2) the number of weak strategy updates for the new strategy is as follows:
The Equation (36) is to eliminate the weak mutation strategies from the individual vector. For example, the best strategy is strategy 1. If vector i is the weak vector that is formed from another mutation strategy except strategy 1, it must be updated to use strategy 1. In other words, vector i is formed from the best mutation strategy (strategy 1). It has been updated from random strategies.
4.2.2. Self-Adaptive Control Parameters
In order to increase the performance of the Crossover Rate (
CR), this section represents the self-adaptive control parameters
. The crossover mechanism is to generate a trial vector by replacing the dimension of the target vector. The following equation creates the trial vector:
This section has used Equation (38) for adapting the crossover probability.
where
,
are the minimum crossover rate probability, maximum crossover rate probability, computation time and limited computation time, respectively. Due to it being in the early stages of evolution, the trial vectors are identical to the target vectors. As the iteration increases, the similarity to the target vectors decreases, and the trial vectors become more identical to the mutated vectors. By increasing the
CR, the capacity for local search can be improved.
4.3. The Neighborhood Search by Probability
This section aims to inter-change the clustering of customers in each depot. The neighborhood search by probability (called NSP) is used to exchange the customers based on a probability calculated by Equation (39):
where
indicates the distance customer
i to depot
n, and
indicates the average distance between customer
i and all depots.
For example, the distance between customer 1 and depots 1, 2 and 3 are 7, 4 and 5, respectively. The average distance of customer 1 and all depots is 5.34. The probability that customer 1 is assigned to depots 1, 2 and 3 equals 0.00%, 80.00% and 20.00%, respectively. Although depot 2 is closest to customer 1, there is a chance to assign customer 1 to depot 2.
After calculating the probability, the next step is to randomize the number of customers to inter-change nodes (k). where that mean k should be the random number between 2 to round up 20% of the number of customers.
The neighborhood search strategies, a kind of changing sequence, is developed to four neighborhood search structures and described for k = 2 as follows:
Inter-exchange by probability, randomize
k customer nodes from each depot in a clustered customer sequence, as demonstrated in
Figure 6a. The neighborhood structure is defined as Nh1;
Inter-insertion by probability, randomize
k customer nodes from one depot to another depot in a clustered customer sequence, as demonstrated in
Figure 6b. The neighborhood structure is defined as Nh2;
Intra-exchange without probability is similar to inter-exchange but change k customer nodes only for the same depot. The neighborhood structure is defined as Nh3;
Intra-insertion without probability is similar to inter-insertion but insert k customer nodes only for the same depot. The neighborhood structure is defined as Nh4.
The sequencing of the structure neighborhood is selected by two random operations between inter-depot and intra-depot neighborhood search structures. For example, iteration 1 used sequencing of structure neighborhood {Nh1,Nh4}, but iteration 2 used {Nh2,Nh3}. The idea of the NPS is to increase the search to prevent moving into a trap solution.
Neighborhood Search Translation
Similarly to
Section 4.1.2, the neighborhood search translation is used to return the position sequence with the new changed customer sequence. For example, a customer sequence before entering the NSP is {6, 3, 7, 8, 5, 1, 2, 4, 9, 10} denoted by NS10 (
Figure 7), the dimension position corresponding to the customer sequence is {0.090, 0.133, 0.210, 0.409, 0.666, 0.695, 0.778, 0.858, 0.949, 0.990} (denoted by RS10). The NSP that changes NS10 to a new customer sequence is {8, 3, 7, 6, 10, 2, 1, 4, 9, 5}(denoted by NSP10) (
Figure 7b) with the corresponding dimension position RS10.
Neighborhood search translation returns NSP10 to the initial customer id {1,…,|
N|}, and corresponding dimension position RS10 reorders to original dimension position (
Figure 7). Therefore, the Neighborhood search translation changes as shown in
Figure 7a to
Figure 7c. The random dimension position must be translated to change to a new dimension position before the new iteration is performed in the current iteration.
4.4. The Fitness Value and Selection Operation
The selection mechanism of DE differs from the other evolutionary algorithms. The fitness value of the trial vector
is compared with that of its target vector
in each generation; the one with a better fitness value (in this case, lower total cost) will propagate the population of the next generation. The population of the next generation
is selected as follows:
5. Numerical Experiments
In this section, we report on numerical experiments using a PC with an Intel Core i7, 2.20 GHz CPU and 16 GB DDR4 RAM to demonstrate the performance of HSADE. Our computational experiments were performed on three-size instances: small-sized, medium-sized, and large-sized instances. Specifically, the small-sized instance is compared with HSADE for heuristic performance (
HP), calculated from Equation (41). The MILP was implemented by LINGO v.17(LINDO Systems, Inc. 1415 North Dayton Street. Chicago, IL 60642). The HSADE algorithm was developed through the MATLAB Version 9.4.0.813654 (R2018a) software (John N. Little, Cleve Moler, Steven Bangert, Natick, Massachusetts, United States). The relative improvement (
RI) is determined using Equation (42) to measure the percentage improvement between current practices and the HSADE algorithm.
where
HP = the heuristic performance (%).
Optimal = the optimal solution obtained from the mathematical model.
RI = the relative improvement (%) between current practices and meta-heuristics.
= the solution obtained from current practices.
= the solution obtained from the meta-heuristics.
The numerical experiments were tested with 18 randomly generated instances and 1 case study. The factors of all instances and a case study are shown in
Table 3.
In
Table 3, the first column shows the size instances, including small (instances S1–S5), medium (instances M1–M7), large size instances (instances L1–L6), and the case study (instance CS1). The second column shows instance names, and the third to sixth columns show the characteristics of the problems in which the number of depots, the number of customers, size of demand (egg trays) (egg tray carries 36 eggs), the number of vehicles of each depot, number of product types, and capacity size of the vehicles. Note that the size of demand is randomly generated using a uniform distribution U (min, max). The vehicles’ capacity size, including two fleet sizes, is the small fleet size (S) or large fleet size (L). From
Table 3, the number of depots is divided into three groups, which are small, medium, and large-scale test instances. There are two to three, four and six for small, medium, and large-sized instances, respectively. Sizes of demand (egg trays) for small, medium, and large-sized test instances are between 10 to 60 egg trays, 20 to 100 egg trays, and 40 to 150 egg trays. The number of customers for small, medium, and large-sized test instances is 12–20, 50–100, and 160–360 nodes, respectively. The number of vehicles in each depot for small, medium, and large-sized test instances are 4, 8–15, 40–65 vehicles, respectively. The number of product types for small, medium, and large-sized test instances are 2–4, 4–5, 6 product types, respectively. The capacity sizes of vehicles for small, medium, and large-sized test instances are 60/100, 80/120, and 150/200. Moreover, presently, the case study company has the customers’ orders size of demand ranging from 30 to 300 for 500 customers per day. The case study company has 250 vehicles per eight depots with capacity sizes of vehicles 300/400 to transport the products. The number of product types is six.
We set the computation time as the stopping criteria of our proposed method. The limited computation time of LINGO is set to 30 min, 1440 min and 4320 min for small, medium and large-sized instances, respectively. Our proposed method used a limited computation time of 5 min, 15 min and 30 min for small, medium and large-sized instances, respectively. The traditional DE, DE combined initial solution (IDE), and IDE combined self-adaptive (ISDE) were selected for comparison with the HSADE algorithm. The parameter values used in our implementation include scaling factor (
F) = 2,
Cmin = 0.5,
Cmax = 1 [
32] and the population is set to 25. The DE and IDE used the
(Equation (30)) mutation strategy. The self-adaptive mutation strategy is set as Ts = 0.2 × Tmax for using the single mutation strategy
when
. If
then the self-adaptive mutation strategy is used to change the mutation strategies of the vectors. The current practice in egg distribution is based on a greedy algorithm.
The computational results are shown in
Table 4, and the statistical test has been performed using the Wilcoxon signed-rank test shown in
Table 5. The HSADE yields a better solution than all other proposed algorithms, including the current practice, DE, IDE and ISDE. The statistical test indicates that the solutions obtained from our proposed algorithm were significantly different at a
p-value
0.05 compared to those obtained from the LINGO for 19 instances (
Table 5, second row). However, our proposed solution for small-sized instances was not significantly different compared to the LINGO. In
Table 5, the fifth column for the HSADE shows that the solutions were significantly different, compared with all algorithms.
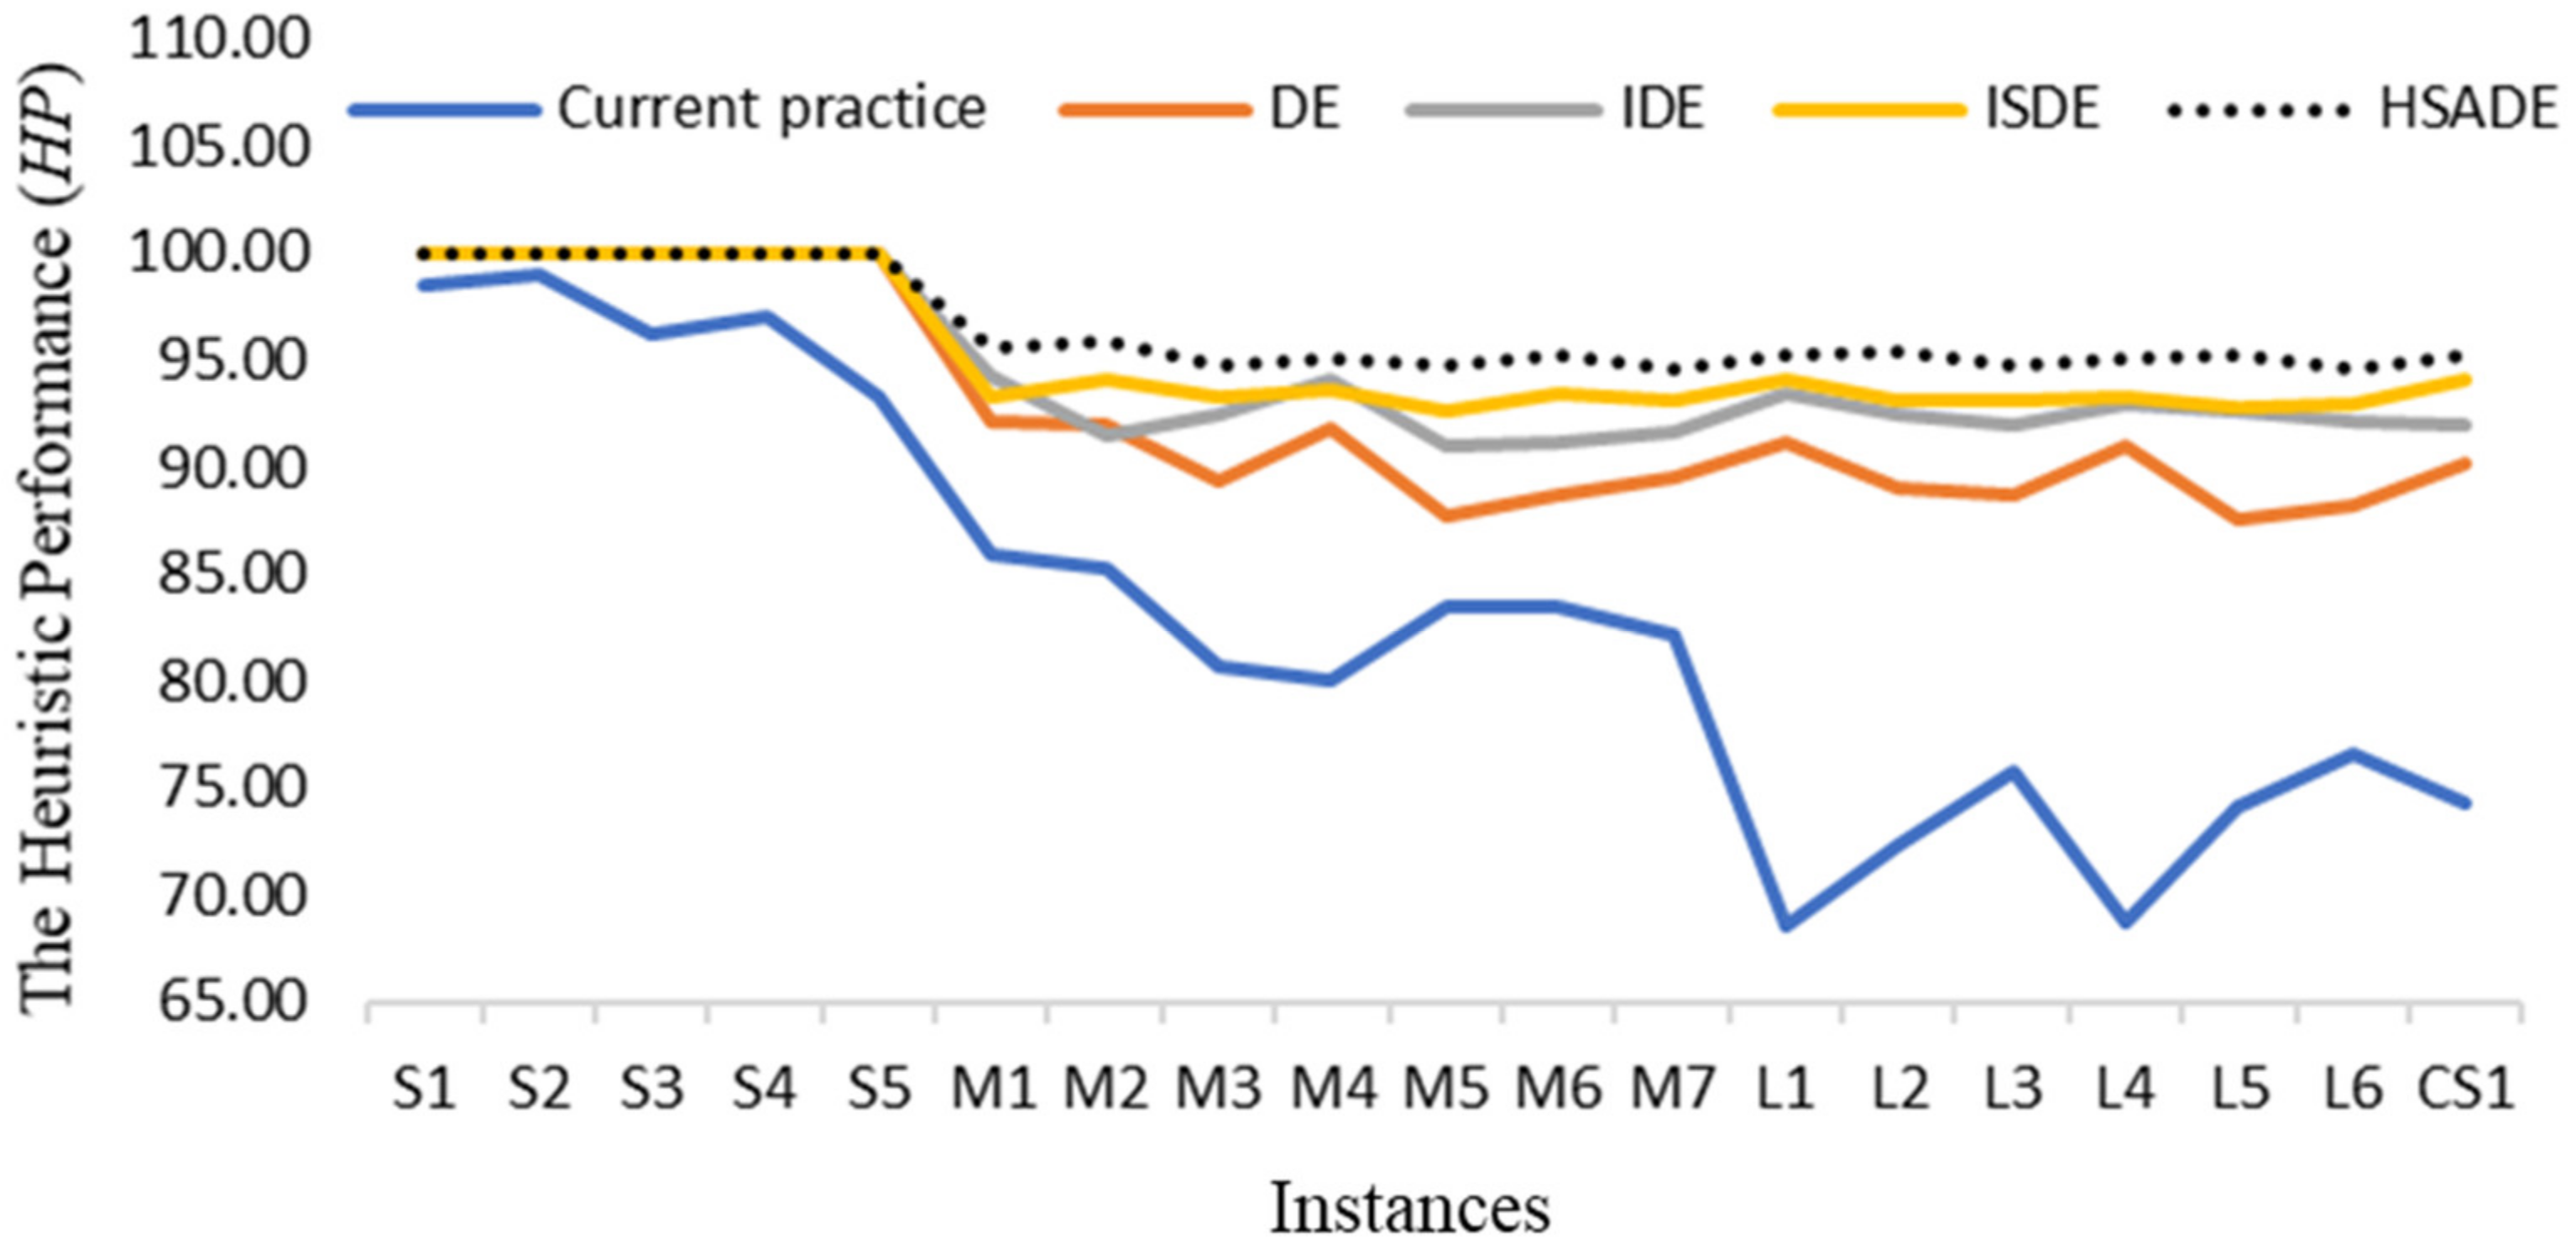
Additionally, the heuristic performance (
HP) percentage was measured using the solution obtained from all compared algorithms by comparing it with the optimal solution obtained from the LINGO. The results show that the HSADE algorithm provided 100%
HP for the small-sized instance. Based on the medium-sized instance, the range of
HP of the HSADE algorithm is 94.66% to 95.85% (with an average of 95.14%), compared to the lower bound solution. Similarly to the medium-sized instances, the large-sized instances demonstrate a range of
HP of 94.64% to 95.38% (with an average of 95.06%). The
HP of the HSADE algorithm compared with the case study was 95.20%. The average
HPs of current practice, DE, IDE, ISDE and HSADE algorithms are 82.92%, 92.48%, 94.40%, 95.11% and 96.40%, respectively (
Table 6,
Figure 8).
The relative improvement (
RI) results are shown in
Table 7. The total costs of the solutions obtained from the current practice were compared with the DE, IDE, ISDE and HSADE algorithms. The results show that the HSADE algorithm outperforms all other algorithms (
Figure 9). The average
RI of DE, IDE, ISDE and HSADE algorithms is 10.55%, 12.35%, 12.99% and 14.13%, respectively; that means that the HSADE algorithm combined with the initial solution, self-adaptive mutation formula and hybrid neighborhood strategies search is more effective than DE, IDE and ISDE.
6. Conclusions
This paper proposes the HSADE algorithm to solve the realistic egg distribution problem in Thailand. The problem has dealt with the multi-product (egg sizes), multi-depot vehicle routing problem, with heterogeneous fleets, time window constraints and inventory restrictions to minimize the total cost. The MILP model of egg distribution in Thailand has been formalized. The differential evolution algorithm is selected as the core mechanic to develop the best algorithm to solve the large-sized test instance and the case study. The constructive heuristics adopt the initial solution to guide the solution through a customer clustering method. The hybrid and self-adaptive differential evolution were developed. The hybrid with neighborhood structure, including k-random inter-exchange and k-random insertion by probability, k-random intra-exchange, and k-random intra-insertion, were implemented to avoid trapping in a local optimum. The self-adaptive mutation strategy was developed with a new self-adaptive algorithm to change the mutation formula. The optimal solution for a small-sized instance and the lower bound solution for medium and large-sized problems are the criterion to measure the Heuristic Performance (HP) with our proposed algorithm. The current practice of egg distribution in Thailand has been developed to measure relative improvement (RI) to demonstrate the ability to improve our proposed algorithm from the current practice. For the computation result of our HSADE algorithm applied to egg distribution, LINGO solves the MILP model with a prespecified time limit for 19 instances. The test results show that our proposed algorithm can provide the optimal solution; the HSADE algorithm significantly outperforms LINGO both in solution quality and CPU time. The heuristic performance (HP) showed that the HSADE algorithm obtained a near-optimal solution ranging from 94.64% to 95.85% and the current practice obtained a solution ranging from 68.58% to 85.87% for medium and large-sized instances. The average heuristic performance (HP) of HSADE is 96.40% for all instances. Additionally, the relative improvement (RI) has been compared to the total cost of the solution obtained from the current practice with DE, IDE, ISDE, and HSADE algorithms. Those algorithms had average relative improvements equal to 10.55%, 12.35%, 12.99%, and 14.13%, respectively.
The statistical results obtained using the Wilcoxon signed-rank test showed that compared the total cost of LINGO and our proposed algorithm. As a result, our proposed algorithm obtains solutions that are not significantly different from the optimal solution for the small-sized instances. Additionally, the statistical test for large-sized instances showed that the proposed HSADE algorithm was significantly better than the DE, IDE, and ISDE algorithms, respectively. Furthermore, the solutions of IDE were significantly different from the solutions of ISDE which DE combined initial solution based on nearest neighbor heuristic (IDE) and IDE combined self-adaptive strategy (ISDE). This implies that the self-adaptive mutation strategy did significantly improve the IDE solution. Therefore, the HSADE algorithm in this paper will assist the egg distribution industry in reducing total transportation costs.
The HSADE algorithm had solutions that yield better results than each other algorithm for all test instances because the initial solution, mutation strategy adaptation, and the neighborhood search structure can enhance the exploitation capability of DE. In the larger-size instances and the case study, the HSADE algorithm obtained the solution near the lower bound solution from LINGO. Additionally, the HSADE algorithm took only 30 min instead of 4320 min. Therefore, within the time constraints of the egg industry in Thailand, Thai entrepreneurs can apply the HSADE algorithm to improve egg distribution planning transportation. The mathematical and proposed algorithms in this paper should prove beneficial to similar agriculture logistics in Thailand and worldwide.
Our future work will consider a variant of the egg distribution problem in Thailand that considers horizontal planning, such as a multiple-period, periodic, multiple-time window, mixed-time window, and so forth. Additionally, although our proposed mathematical model is efficient, research to determine the solutions to the problem should be carried out by using different mathematical models to compare the strengths of various approaches in solving the problems of this nature.


