Article

Effect of a Hypoxia-Controlled Atmosphere Box on Egg Respiration Intensity and Quality

1
College of Engineering, Huazhong Agricultural University, Wuhan 430070, China
2
Ministry of Agriculture Key Laboratory of Agricultural Equipment in the Middle and Lower Reaches of the Yangtze River, Wuhan 430070, China
3
National Research and Development Center for Egg Processing, Huazhong Agricultural University, Wuhan 430070, China
*
Author to whom correspondence should be addressed.
Appl. Sci. 2022, 12(1), 380; https://doi.org/10.3390/app12010380
Submission received: 22 November 2021 / Revised: 9 December 2021 / Accepted: 17 December 2021 / Published: 31 December 2021
(This article belongs to the Special Issue Processing and Preservation Technologies for Meat and Eggs)

Abstract

:

Featured Application

The findings of this study can be applied to warehouses, factories, or businesses that store large amounts of eggs to extend their shelf life at low costs.

Abstract

Egg preservation is an important factor during storage and transportation. Fresh eggs were stored in boxes in a controlled atmosphere with an O2 concentration of 0% O2 + 100% nitrogen (N2), 5% O2 + 95% N2, 10% O2 + 90% N2, 15% O2 + 85% N2, and 20% O2 + 80% N2, and the effects of these storage conditions on large quantities of eggs were studied. The respiratory intensity and quality of eggs during storage were measured. We chose the weight loss rate of eggs, Haugh unit, pH, and the egg white total plate count as the characteristic indices of egg quality. We compared the changes in egg quality during and after storage at different O2 concentrations versus that at 25 °C. The stages were evaluated using the TOPSIS method to sort egg quality, and the optimal O2 concentration was selected. FLUENT was used to simulate and control the atmospheric requirements. Our findings showed that eggs stored in an air-conditioning chamber with O2 concentration ≤10% exhibited weak respiratory intensity (0–1 mg/(kg·h)). The rates of decrease in loss of egg weight and Haugh units were smaller. There were significant differences in the pH of egg white stored in different O2 concentrations (p < 0.05). Reducing the O2 concentration in the egg-storage environment reduced the number of colonies in eggs and had a positive effect on egg preservation. Simulations using FLUENT revealed that only 1200 s were required to achieve the low-oxygen environment in the controlled atmosphere box (1.5 m × 1 m × 1 m). The storage environment of 5% O2 + 95% N2 had the best preservation effect on eggs. This approach is associated with low costs in practical application and can potentially be used for egg storage and transport.

1. Introduction

Eggs have a high nutritional value and are prone to quality changes during storage [1]. Spoiled eggs can cause harm when consumed [2]. Due to the short shelf life of eggs and seasonal variation in production, there is a serious imbalance between the supply and demand in off-peak seasons. Thus, the market price fluctuates greatly [3,4] and the economic benefits to manufacturers are not guaranteed. Therefore, an effective storage method is urgently needed to prolong storage life and improve the shelf quality of eggs.
Modified atmosphere packaging (Map) is a technology that is widely used for the storage of agricultural products. It can effectively prolong the shelf life of foods and is a means of pollution-free preservation that is gaining widespread attention globally. Its main principle is based on the respiration mechanism of agricultural products to preserve freshness by reducing the extent of exchange of materials between the internal and external products [5,6,7]. The most common protective gases are carbon dioxide (CO2), oxygen (O2), and nitrogen (N2). Among them, O2 and CO2 are important factors affecting egg respiration, whereas N2 is an inert and inexpensive gas mostly used to regulate gas concentration [8].
Studies have shown that the respiration rate of fruits and vegetables were significantly reduced in an environment of low O2 [9,10,11]. Storage of agricultural products in an environment of low O2 can not only inhibit their respiratory intensity but also significantly reduce the production of volatile organic compounds [12]. However, fruits will exhibit browning, cavities, and other phenomena indicating quality deterioration at very low O2 concentrations [13]. Xu et al. [14] used to store fresh eggs in a high-carbon dioxide gas environment. It is found that the carbon dioxide gas conditioning method can effectively weaken the activity of enzymes in the egg, slow down the rate of biochemical reactions, and inhibit the growth of microorganisms. During the storage period (42 days), the eggs were treated with improved packaging, cleaning coating and ultraviolet sterilization compound method, and their freshness index, egg white pH value and bacterial colony count were better than ordinary eggs [15].Yuan [16] studied the effect of modified atmosphere packaging on the preservation of eggs. After 28 days of storage, the unpackaged control group had already loosened yellow, and the air packaged group’s eggs had dropped to B level. However, the eggs in the modified atmosphere packaging group still maintained about AA grade, and the difference in the fresh-keeping effect of the modified atmosphere experimental groups was not significant. Further, 100% CO2 packaging might represent a promising innovative technique for the maintenance of egg characteristics during transport, retail, and domestic storage [17].
As a living body, the strength of the respiration of eggs is related to changes in quality [18,19]. The respiration of eggs entails the consumption of their own nutrients; thus, the key to prolonging the storage period of eggs is by reducing their respiration rate [20]. Studies have shown that increasing the volume fraction of CO2 in the storage environment can inhibit the respiration in eggs [21], whereas the effect of reducing the volume fraction of O2 on their respiration has been rarely reported. In addition, most studies and the available equipment have been designed for/on the storage of fruits, and there are no related applications for egg storage. Keeping in mind the economic costs, in this study, we increased the environmental N2 volume fraction to reduce the O2 volume fraction and attempted to extend the shelf life of eggs. For the first time, a large box with a controlled ambiance was used to store large quantities of eggs, following which, the effect of different O2 volume fractions on the respiratory intensity and egg quality was analyzed. The relationship between respiration intensity and quality indicators, and changes in eggs during storage were analyzed to discover a green, effective, low-cost storage method for large quantities of eggs. Our study could provide a theoretical basis and technical support in real-world egg storage and transport.

2. Materials and Methods

2.1. Materials

Jingfen No. 6 egg samples were obtained from SHENDAN Health Co., Ltd. (Wuhan, Hubei Province, China). Eggs were collected on the day they were laid and transported to the laboratory for storage and processing. The 800 eggs were randomly divided into five groups and 160 eggs in each group were packed in egg trays. The eggs were placed in the air-conditioning box (Modified Atmosphere Preservation System for Agricultural Products; Tianjin CNRO Science Technology Co., Ltd., Tianjin, China) and sealed.
The air-conditioning box was filled with N2 through the reserved valve to adjust the gas to 5 different concentrations (A: 100% N2; B: 95% N2 + 5% O2; C: 90% N2 + 10% O2; D: 85% N2 + 15% O2; and E: 80% N2 + 20% O2). The indoor temperature was adjusted to 25 °C and the humidity to 65%. From day zero, 20 eggs were taken out every five days to test their breathing intensity and quality.

2.2. Methods

2.2.1. Measurement of the Breathing Intensity of Eggs

A breathalyzer (SY-1022 breathalyzer. Wuhan Xinxing Scientific Instrument Co., Ltd., Wuhan, China) was used to detect the amount of CO2 released by 10 eggs within 30 min. Next, the comprehensive temperature coefficient was calculated, and the respiration intensity of the eggs was obtained.
Previously published methods were used to measure the respiration intensity of eggs [18,19]. The specific steps were as follows: weighed eggs were transferred to the breathing chamber one at a time. The reading was allowed to stabilize, and the initial CO2 initial concentration (C0) and temperature (T0) were recorded. The real-time concentration (C) and temperature (T) were recorded after being left undisturbed for 0.5 h. Equation (1) was used to calculate the egg respiration strength (Q).
Q = 1.964 × 273 × C 273 + T 1.964 × 273 × C 0 273 + T 0 M × t × 1000 × V
where Q is the respiratory intensity (mg/(kg × h)), C is the final concentration of CO2 (mg/L), C0 is the initial concentration of CO2 (mg/L), T is the final temperature (°C), T0 is the initial temperature (°C), M is the mass of the egg (g), t is the measurement time (h), and V is the volume of the breathing chamber (L).

2.2.2. Measurement of Egg Quality Index

Weight loss rate: the percentage of weight loss of eggs before and after storage was calculated using Equation (2):
= M 0 M t M 0 × 100 %
where is the weight loss rate, M0 is the mass of the egg on Day 0 (g), and Mt is the mass of the egg on day t (g).
Haugh unit: First, the eggs were placed on the upper tray of the multifunctional egg test analyzer (EA-01 multifunctional egg test analyzer. Israel Oka Food Technology Co., Ltd., Herzliya, Israel) to determine their weight. After the weights were recorded, the eggs were cracked and put in an inner tray. Once the sensor was automatically triggered, the height of the egg white can be obtained by scanning. The Haugh unit was calculated by referring to a previously published method (Equation (3)) [22].
H U = 100 × L o g ( h + 7.57 1.7 × W 0.37 )
where HU is the Haugh unit, h is the height of the egg white (mm), and W is the egg weight (g).
Yolk index: First, the egg was broken and gently placed on a Petri dish. A Vernier caliper was used to measure the height and diameter of the egg yolk. The average of the last three readings was used to calculate the egg yolk index (Equation (4)):
Y = H ϕ
where Y is the yolk index, H is the yolk height (mm), and ϕ is the yolk diameter (mm).
pH: The egg white was stirred evenly using a magnetic stirrer in a 50-mL beaker and the pH was determined using a pH meter.
Total number of colonies: To detect the total number of colonies in the egg content mixture, the method of Caudill was used [23]. The specific test steps were as follows: First, the surface of eggshells was cleaned with pure analytical grade alcohol to remove the dirt. The egg mixture was poured into a homogenization bag and beaten evenly with a homogenizer. Next, 5 mL of the egg homogenate was taken in a sterile test tube and diluted 10-fold to an appropriate concentration. The diluted sample was pipetted into a sterile Petri dish and the process was repeated. Lastly, an appropriate amount of the sample was poured with a plate counting agar medium into a Petri dish and incubated at 36 °C for 48 h before counting.

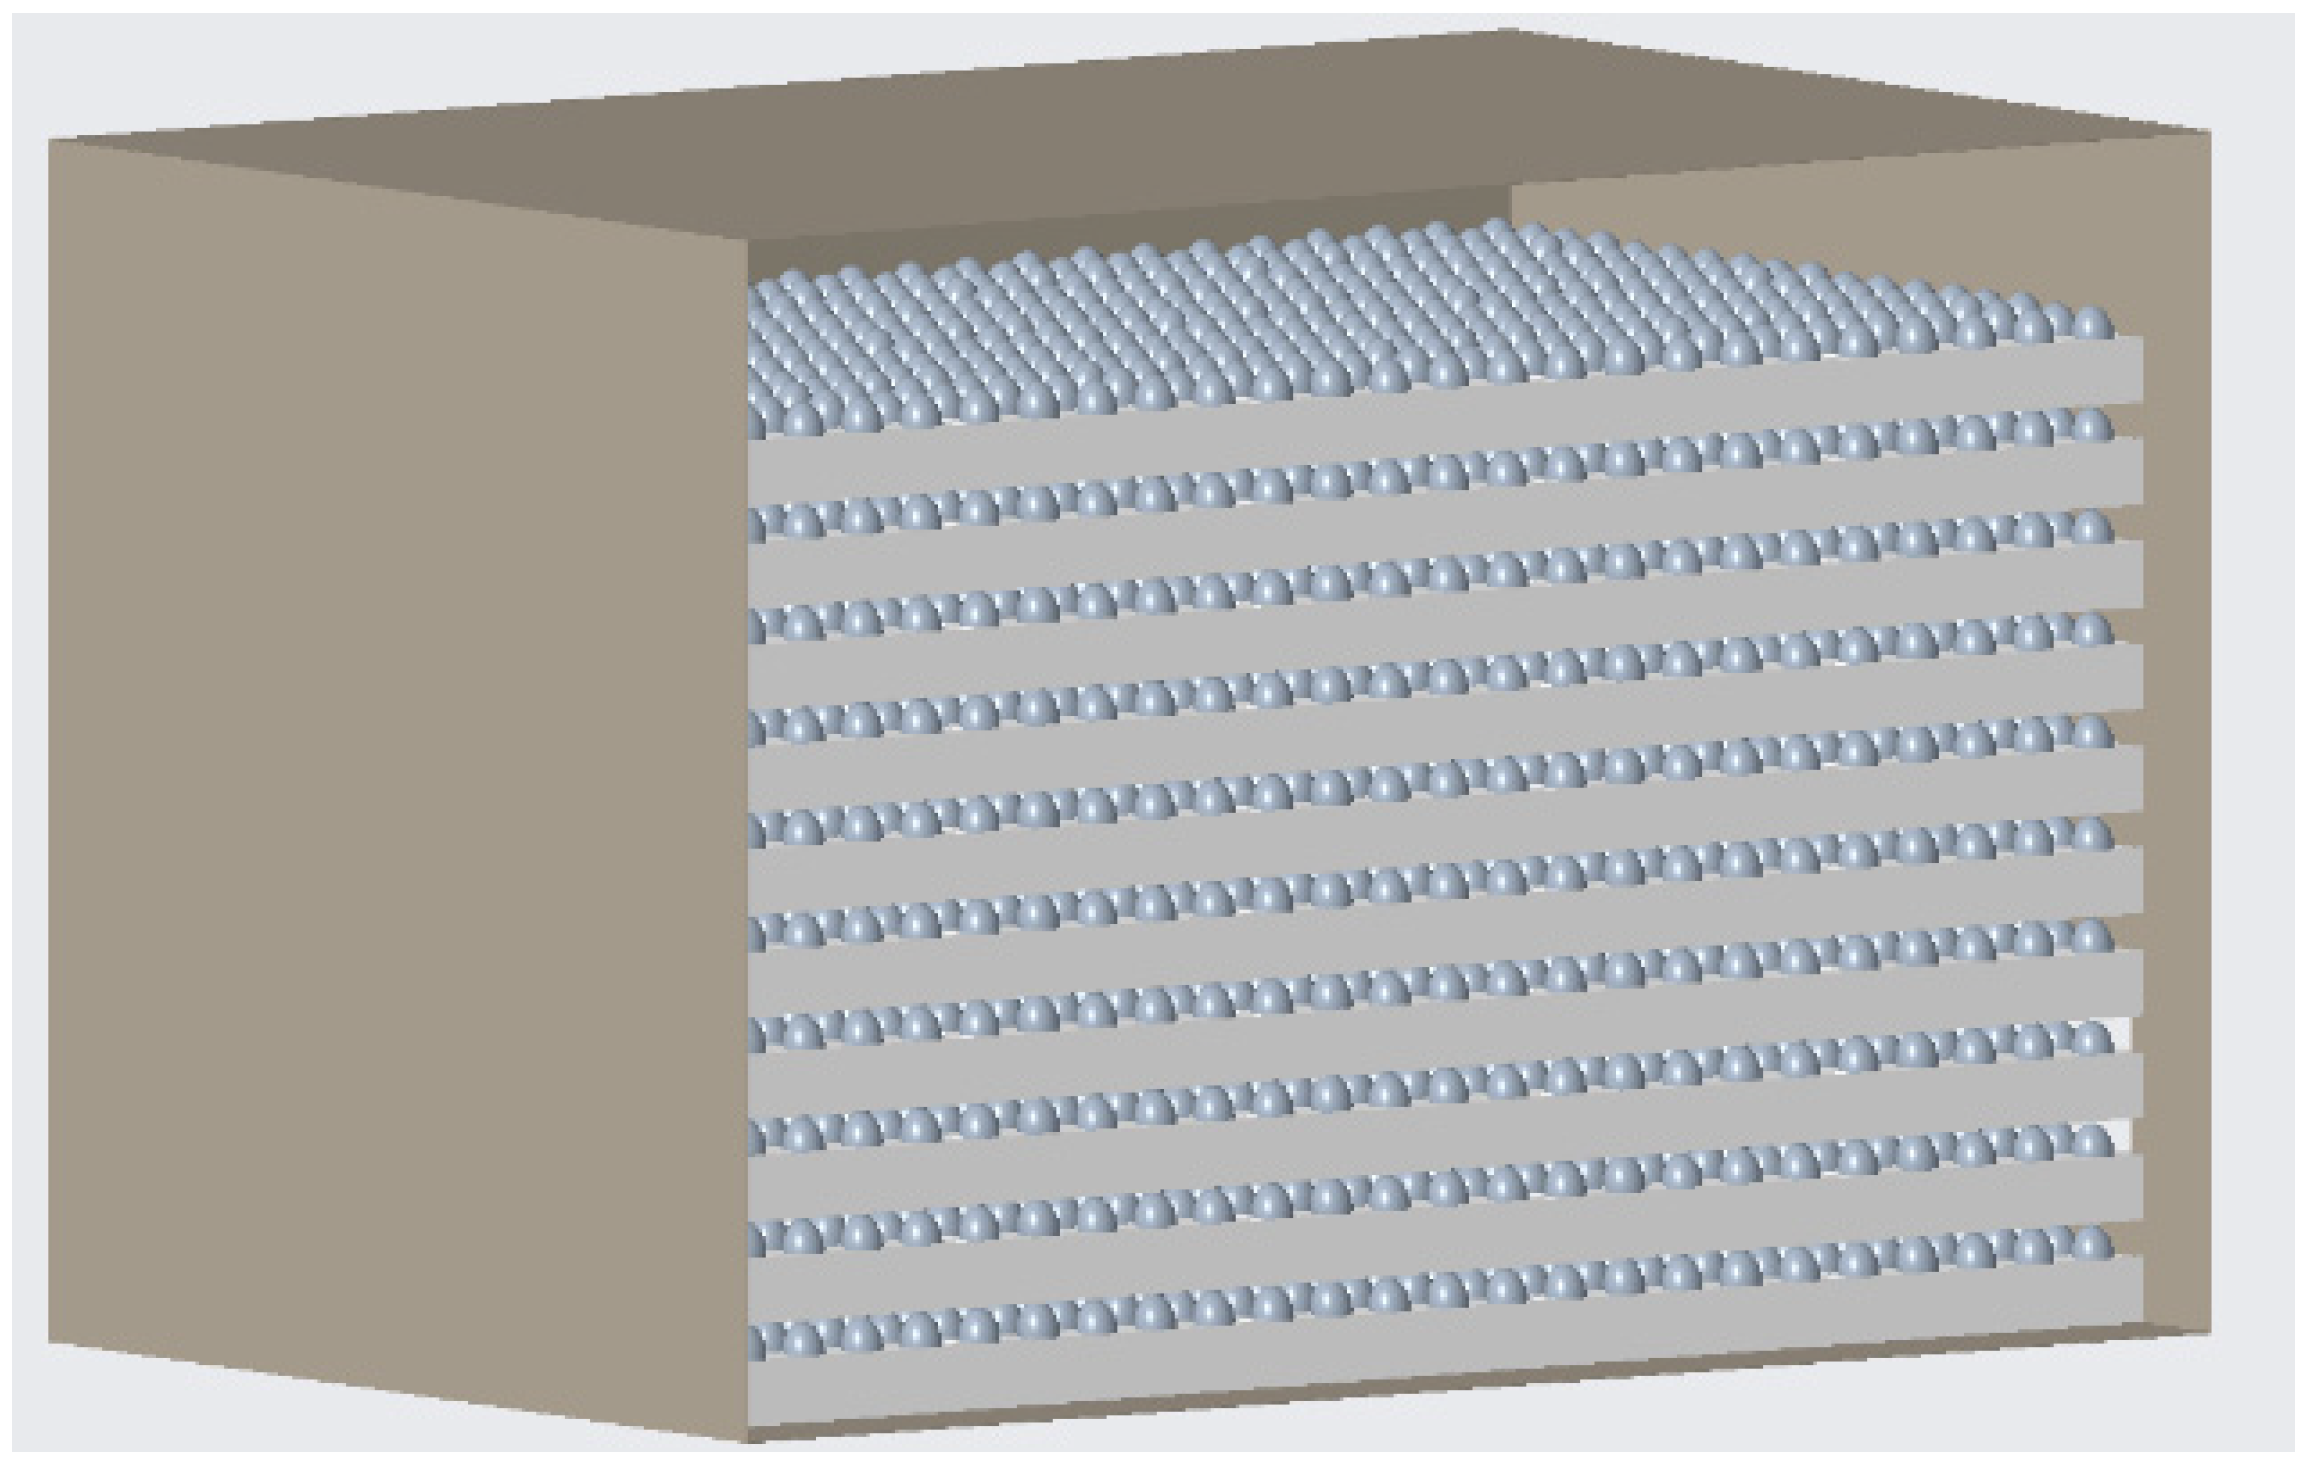
2.3. Design of the Air-Conditioning Box

Computational fluid dynamics (CFD) is a cross-disciplinary science that integrates mathematics, fluid mechanics, and computer programming. This method overcomes the shortcomings of theoretical analyses in calculation and solving, and breaks through many restrictions, such as experimental conditions, to simulate various physical phenomena in fluid flow.
As the most common fluid analysis software, FLUENT has been widely used for the research of indoor fluids in the literature. Lalmi et al. [24] used the finite volume method to simulate heat transfer and radiation of a greenhouse. Yang et al. [25] (pp. 8–18) used this software to simulate the thermal and humidity characteristics of the environment and studied apples stored in a controlled atmosphere warehouse. Zhou et al. [26] (pp. 11–24) analyzed the rapid O2 reduction in the air-conditioning process. The distribution characteristics of gas velocity and flow direction, and the concentration of components in the modified atmosphere environment are important technical indicators in the evaluation and design of atmosphere preservation. Therefore, establishment of a dynamic model that can accurately predict gas distribution and concentration changes in the air-conditioning box is a prerequisite to extending this technology from the theoretical level to the production and application levels. The model can also provide optimization directions to design the structure and system and evaluate the performance of the air-conditioning box.
An air-conditioning box is similar to an air-conditioning warehouse, which has a high stacking arrangement. The purpose of this arrangement is to reduce air-conditioning costs by reducing the total volume of gas in the box. O2 concentration in the box can be reduced by filling the box with N2. In our study, high-purity N2 was pumped through the air inlet to replace an equivalent amount of mixed gas in the library until the gas concentration in the air-conditioning box reached the set value. N2 was introduced from the air inlet on the top of the air-conditioning box and the gas flow was 0.5 m/s. The air outlet is located at the lower end of the opposite side and is the pressure outlet.
In this study, we focused on the practical applications and needs to calculate costs. As the main consumable object of this method was N2, FLUENT software was used to analyze O2 distribution during the N2-filling process in the air-conditioning box. N2 consumption was calculated based on the amount of O2 in the box. During actual use in production, the placement of controlled atmosphere storage has a demand for high stacking. Therefore, the real-life air-conditioning process was simulated in our study. Figure 1 shows the geometric model of the air-conditioning box. The size of the air-conditioning box (length× width× height) was 1.5 m × 1 m × 1 m. The eggs were packed in egg trays with 30 eggs per tray, and the size of the tray was 0.3 m × 0.3 m × 0.08 m. Trays of eggs (4 × 3) were put on one layer, and a total of 10 layers and a total of 3600 eggs were used. To study gas flow in the air-conditioning box, we considered the gas in the library as a Newtonian fluid. The egg-stacking area was regarded as a whole, and only gas flow in the vacant areas was studied. As the air-conditioning box was a closed environment, the influence of heat transfer was ignored. Lastly, the parameters and boundary conditions were set based on the theory of fluid mechanics, and the gas diffusion process in the air-conditioning box was simulated numerically after filling it with N2.

2.4. Methods of Processing Data

SPSS 19.0 (SPSS Inc., Chicago, IL, USA) was used for the statistical analysis of experimental data. The data in Tables 1–3 is normally distributed. Differences among the 5 groups were analyzed using one-way ANOVA followed by Duncan’s post hoc test [27].
Graphs were constructed using Origin (Origin Lab, Northampton, MA, USA). The curve-fitting toolbox (cftool) in MATLAB (version R2012a, The MathWorks Inc., Natick, MA, USA) was used for curve fitting.
TOPSIS (technique for order preference by similarity to an ideal solution) method [28] was used to evaluate the effect of storage on eggs. TOPSIS is a sorting method that is close to the ideal solution and is based on the principle of sorting by detecting the distance between the evaluation object and the optimal solution and the worst solution. If the evaluation object is closest to the optimal solution and at the same time farthest from the worst solution, it is considered to be the best; otherwise, it is not the best. The specific calculation steps were as follows: first, the data were normalized, and then each indicator was normalized. The unified dimension of all indicators is n evaluation objects and a standardized matrix Z of m evaluation indicators (Equation (5)). The maximum value matrix (Equation (6)) and minimum value matrix (Equation (7)) in each indicator were defined.
Z = Z 11 Z 1 m Z n 1 Z n m
Z + = ( Z 1 + , Z 2 + , , Z m + ) = ( max { Z 11 , , Z n 1 } , , max { Z 11 , , Z n m } )
Z = ( Z 1 , Z 2 , , Z m ) = ( min { Z 11 , , Z n m } , , min { Z 11 , , Z n m } )
Lastly, the distance between the evaluation object and the maximum value (Equation (8)) and the minimum distance (Equation (9)) was calculated. The ranking was performed by calculating the Si score of the evaluation object (Equation (10)). The Si value is between 0 and 1. The closer the value to 1, the higher the evaluation.
D i + = j = 1 m ( Z J + Z i j ) 2
D i = j = 1 m ( Z J Z i j ) 2
S i = D i + D i + + D i

3. Results

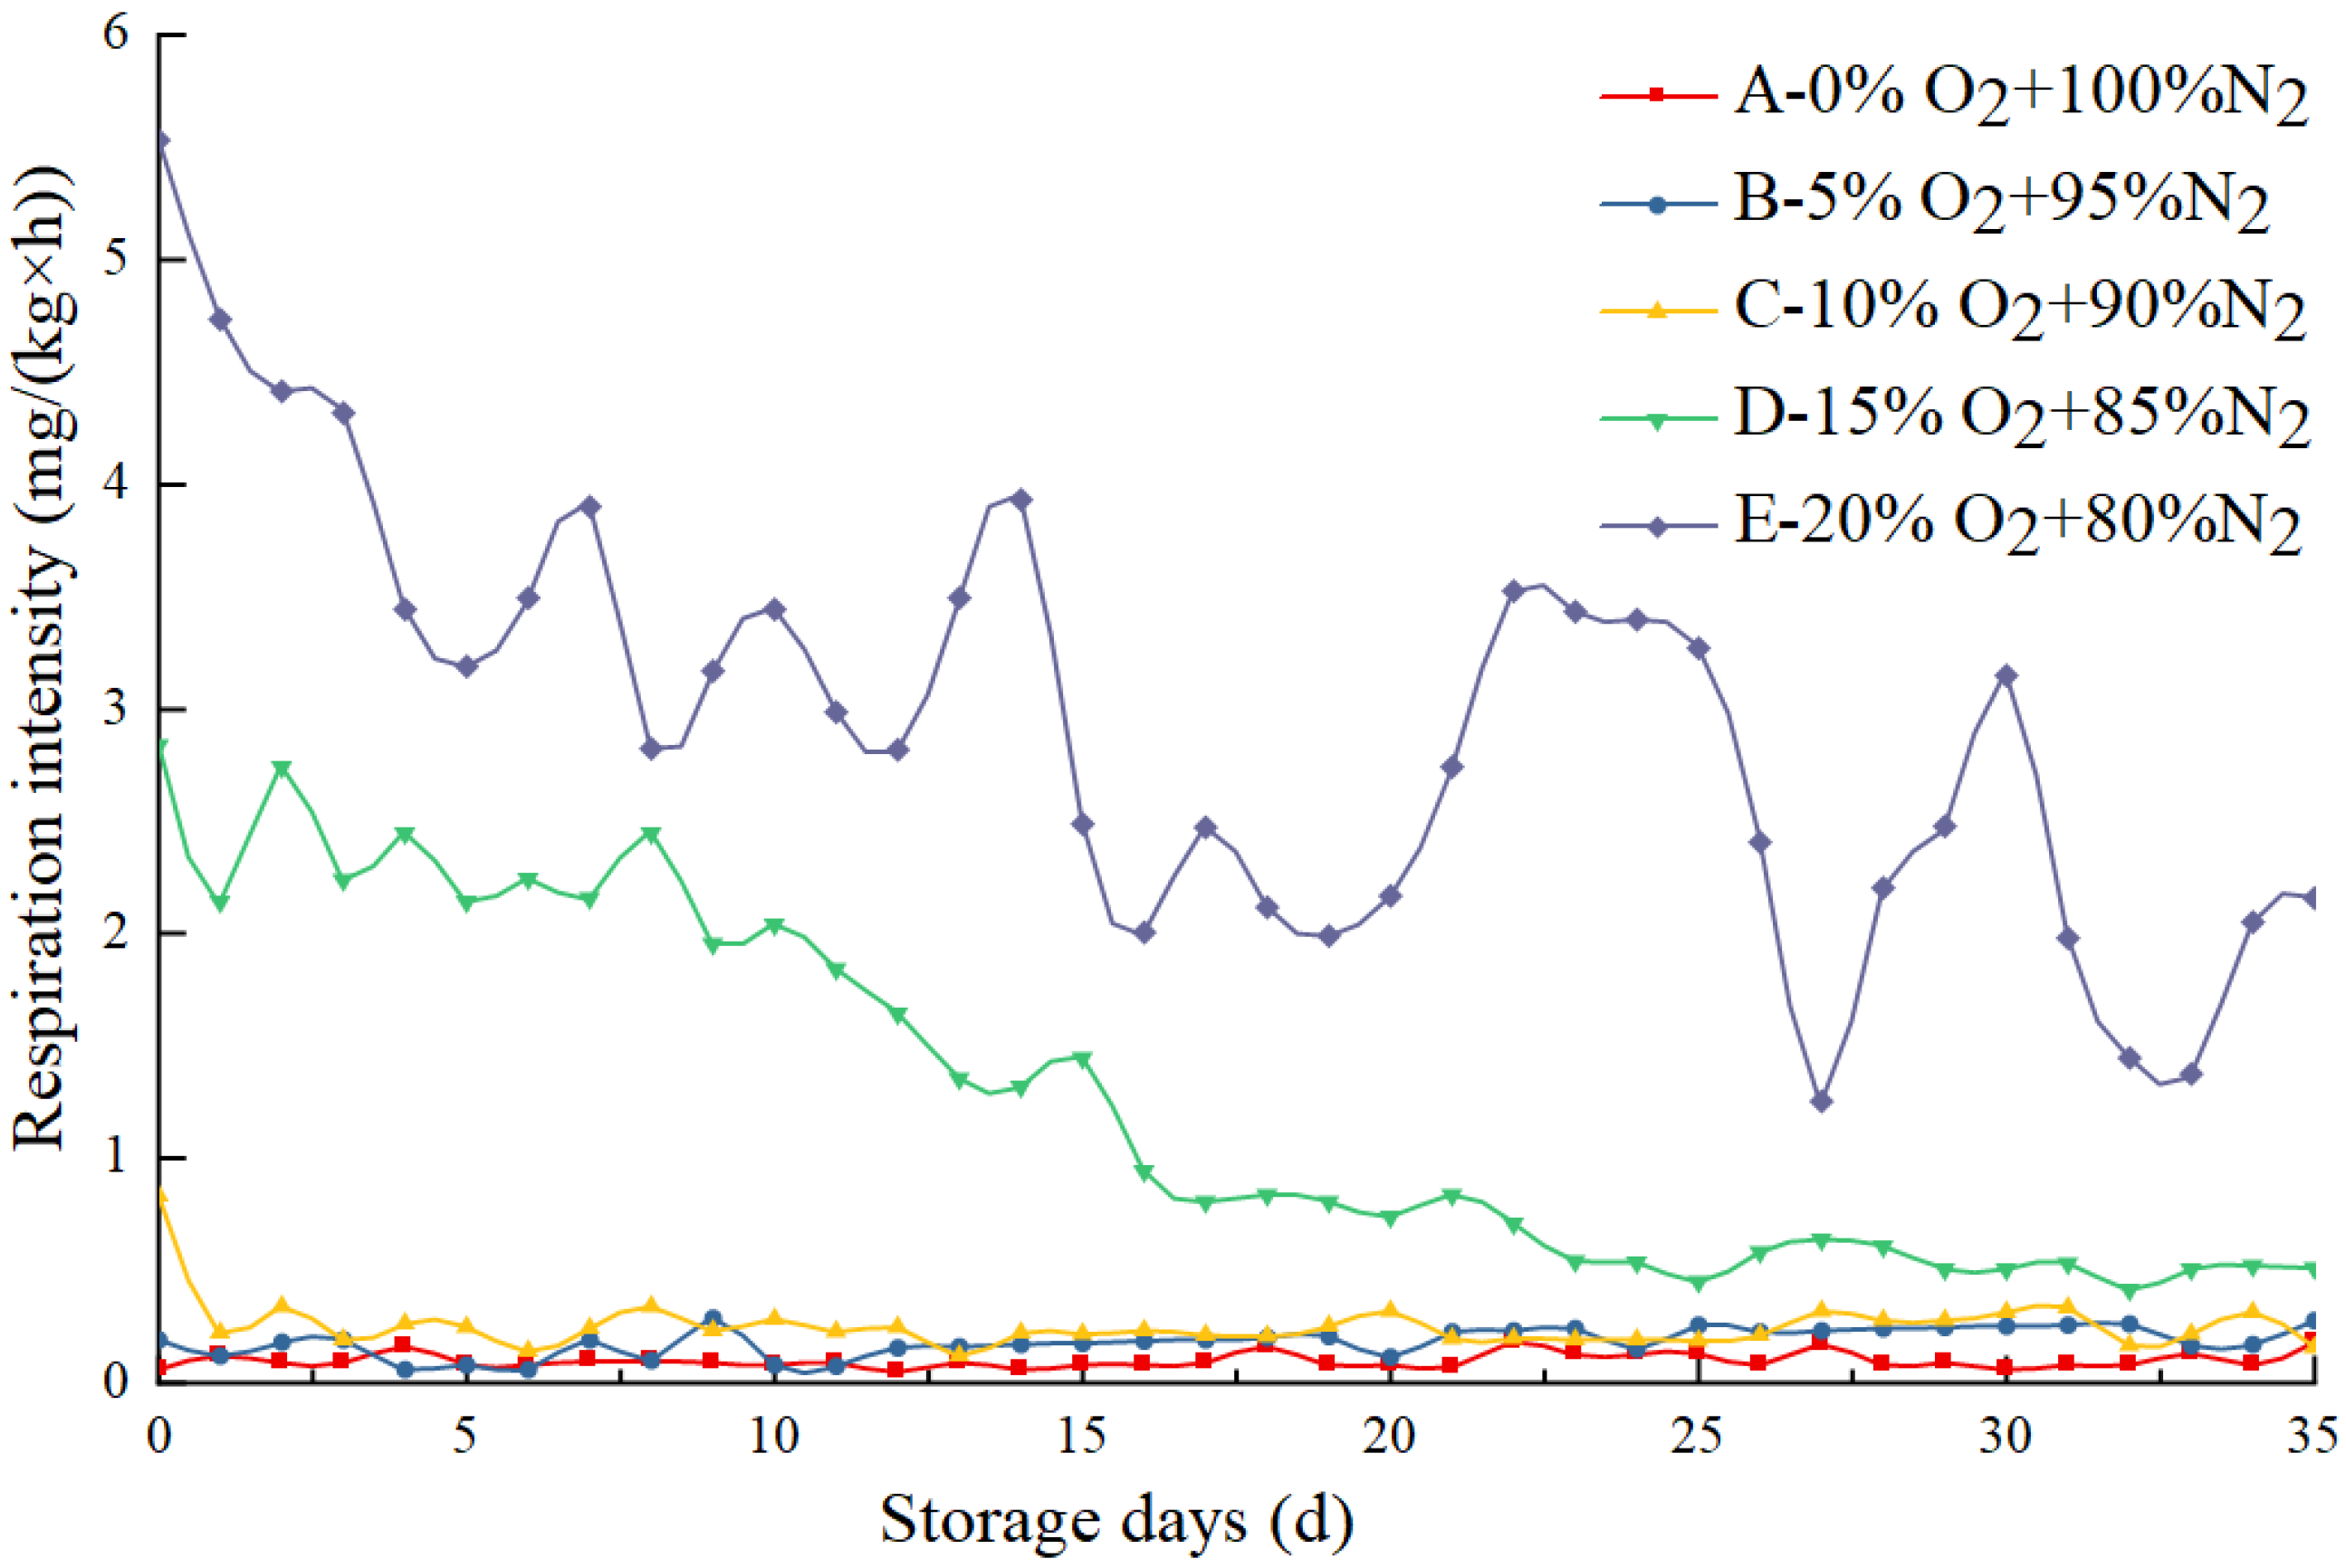
3.1. Effect of Different O2 Concentrations on the Respiration Intensity of Eggs

The respiratory intensity of eggs is closely related to the changes in quality and can be divided into three levels, namely, weak (0–1 mg/(kg × h)), moderate (1–3 mg/(kg × h)), and strong respiratory intensity (>3 mg/(kg × h)). Fresh eggs have a strong respiration effect. As the quality decreases, the respiration intensity decreases gradually. However, when the quality of the eggs deteriorates, the respiratory intensity will increase and peak [20].
There were distinct differences in the respiration intensity of eggs in environments with different O2 concentrations (Figure 2). The breathing intensity of Group A, Group B and Group C can be regarded as constant: Q(A) = 0.10 mg/(kg × h); Q(B) = 0.18 mg/(kg × h); Q(C) = 0.25 mg/(kg × h).The fitted regression line of Group D was described by the Equation (11) and r (D) = 0.9563, RMSE (D) = 0.1728. The fitted regression line of Group E was described by the Equation (12) and r (E) = 0.8451, RMSE (E) = 0.4582.
Q ( D ) = 1.561 + 1.055 × c o s ( 0.09748 x ) 0.3874 × s i n ( 0.09748 x )
Q ( E ) = 26.08 × s i n ( 0.002732 x + 2.983 ) + 0.4007 × s i n ( 0.2182 x + 1.817 ) + 0.505 × s i n ( 0.5418 x + 1.319 ) + 0.4196 × s i n ( 0.8301 x + 1.957 )
The respiration intensity of eggs stored in 20% O2 was higher than that of eggs in a reduced O2 environment. Strong breathing intensity was recorded on days 0–7. With the passage of storage time, the freshness of the eggs gradually decreased. Respiration intensity showed a downward trend as a whole, but an upward trend was observed during the process. Respiratory peaks appeared on the 8th, 10th, 14th, 21st, and 30th days of storage. The eggs stored at 15% O2 concentration exhibited a gradual decrease in respiratory intensity from moderate to weak and the amplitude of respiratory intensity was small. When the O2 concentration was ≤10%, the respiration intensity of eggs was <1 mg/(kg × h), indicating weak respiration. These results showed that O2 concentration in the storage environment of <10% led to a better inhibitory effect on the respiration of eggs.

3.2. Changes in the Quality Indicators of Eggs under Different O2 Concentrations

3.2.1. Changes in the Weight Loss Rate of Eggs under Different O2 Concentrations during Storage

The weight-loss rate not only indicates the degree of egg freshness but is also an important indicator of its economic value. As shown in Table 1, the weight of eggs on the 0th day of the egg age was considered as the control. The weight loss rate of eggs in Group E was significantly higher than that in the other groups from the 5th day of storage (p < 0.05). For the first 15 days, there were no significant differences in the weight loss rate of three groups of eggs that were stored at an O2 concentration <15%. From the 20th day, a significant difference between Groups C and D (p > 0.05) was observed. Combined with the breathing intensity data shown in Figure 2, we found the weight loss rate of the three groups of eggs with weak breathing intensity to be lower.
Table 1. Changes in the weight loss rate of eggs under different oxygen (O2) concentrations during storage.
Storage Days A (0% O2)B (5% O2)C (10% O2)D (15% O2)E (20% O2)
50.43 ± 0.05 b0.39 ± 0.03 b0.35 ± 0.08 b0.28 ± 0.04 b0.76 ± 0.29 a
100.71 ± 0.08 b0.61 ± 0.04 b0.67 ± 0.13 b0.79 ± 0.09 c1.06 ± 0.06 a
150.84 ± 0.09 b0.81 ± 0.17 b0.83 ± 0.14 b0.93 ± 0.09 b1.36 ± 0.16 a
201.01 ± 0.11 bc0.87 ± 0.08 c0.82 ± 0.03 c1.28 ± 0.14 b1.62 ± 0.31 a
251.18 ± 0.14 c1.14 ± 0.20 c1.10 ± 0.14 c1.50 ± 0.18 b1.77 ± 0.30 a
301.51 ± 0.20 bc1.49 ± 0.23 c1.34 ± 0.15 c1.87 ± 0.10 b2.06 ± 0.24 a
351.79 ± 0.16 c1.67 ± 0.10 c1.68 ± 0.33 c2.08 ± 0.23 b2.35 ± 0.28 a
Note: different letters in the same row indicate significant differences between treatments (p < 0.05).

3.2.2. Changes in the Haugh Unit of Eggs under Different O2 Concentrations during Storage

During the storage of eggs, the egg white viscosity decreases to form a thin liquid. The intuitive outcome is the decrease in the height of the egg white [29]. The most commonly used evaluation criterion for egg freshness is the reduction in the Haugh units. A Haugh unit >72 indicates AA-level, 60–72 indicates A-level, 30–60 indicates B-level, and <30 indicates C-level. Grade A and above are suitable for consumer use, Grade B is not suitable for sale, and Grade C is not edible [30]. It can be seen in Table 2 that the Haugh unit of eggs on Day 0 is about 84, indicating that they are AA Grade (≥72). There were no significant differences among the five groups (p > 0.05). During storage, the Haugh units of the five groups of eggs showed a downward trend. Among them, Groups D and E exhibited the fastest downward trend, and the eggs in Group E fell to Grade B (<60) after 30 days, which did not meet the edible standards. On the 35th day of storage, the Haugh units of Groups D and E were significantly lower than those of the other three groups (p < 0.05).
Table 2. Changes in the Haugh unit of eggs at different oxygen (O2) concentrations during storage.
Storage DaysA (0% O2)B (5% O2)C (10% O2)D (15% O2)E (20% O2)
084.31 ± 3.65 a84.50 ± 2.98 a83.29 ± 2.45 a84.41 ± 3.17 a83.49 ± 2.54 a
574.30 ± 4.45 a75.40 ± 5.75 a73.22 ± 4.75 a73.18 ± 6.25 a72.02 ± 2.06 a
1068.60 ± 4.89 a69.61 ± 4.87 a70.67 ± 8.54 a66.49 ± 6.77 a67.06 ± 5.87 a
1568.03 ± 3.82 a66.27 ± 4.76 ab65.30 ± 5.45 b64.27 ± 4.23 b65.90 ± 3.32 b
2067.15 ± 3.98 a65.87 ± 3.82 a63.75 ± 4.98 b64.28 ± 2.89 b63.85 ± 5.32 ab
2566.10 ± 5.66 a64.07 ± 2.45 a62.53 ± 3.06 ab62.88 ± 4.49 b61.15 ± 2.89 b
3064.77 ± 5.74 a65.90 ± 5.85 a63.47 ± 4.01 a60.15 ± 5.76 b58.35 ± 4.93 b
3563.87 ± 3.39 a65.66 ± 3.39 a62.28 ± 5.32 a59.28 ± 3.83 b56.72 ± 3.19 b
Note: different letters in the same row indicate significant differences between treatments (p < 0.05).

3.2.3. Changes in the pH of Eggs Subjected to Different O2 Concentrations during Storage

The pH of egg white is related to the freshness of the egg [31]. The pH of egg white on Day 0 was about 8.6 and there were no significant differences among the five groups of eggs (p > 0.05; Table 3). During the 35-day storage period, the pH of egg whites showed an increasing trend. Eggs stored in an anaerobic environment (0% O2) had the most rapid increase in respiration rate between 0 and 15 days, and the rise in pH slowed down during the middle of the storage period. The eggs in Groups B and C exhibited a slower rise in respiration rate from 0–15 days, which then increased after 15 days. There were no significant differences in pH between Groups D and E in the first 15 days (p > 0.05). After 15 days, the pH of eggs in Group E increased rapidly. There were no significant differences among the three groups with O2 concentration <15% on the 35th day (p > 0.05).
Table 3. Changes in the pH of eggs stored at different oxygen (O2) concentrations.
Storage DaysA (0% O2)B (5% O2)C (10% O2)D (15% O2)E (20% O2)
08.66 ± 0.02 a8.65 ± 0.03 a8.58 ± 0.05 a8.59 ± 0.01 a8.64 ± 0.03 a
58.73 ± 0.03 a8.68 ± 0.04 a8.69 ± 0.02 a8.65 ± 0.02 a8.70 ± 0.12 a
108.88 ± 0.04 a8.71 ± 0.06 b8.73 ± 0.09 b8.70 ± 0.03 b8.75 ± 0.04 b
159.04 ± 0.02 a8.94 ± 0.02 b8.87 ± 0.04 b8.84 ± 0.05 b8.88 ± 0.01 b
209.13 ± 0.04 a9.07 ± 0.03 ab9.04 ± 0.04 b8.90 ± 0.02 c8.98 ± 0.02 b
259.14 ± 0.03 a9.13 ± 0.03 a9.10 ± 0.06 a8.94 ± 0.01 c9.03 ± 0.02 b
309.18 ± 0.04 a9.16 ± 0.02 a9.14 ± 0.01 a8.97 ± 0.01 c9.09 ± 0.07 b
359.23 ± 0.05 a9.21 ± 0.11 a9.20 ± 0.04 a9.09 ± 0.03 b9.16 ± 0.04 a
Note: different letters in the same row indicate significant differences between treatments (p < 0.05).

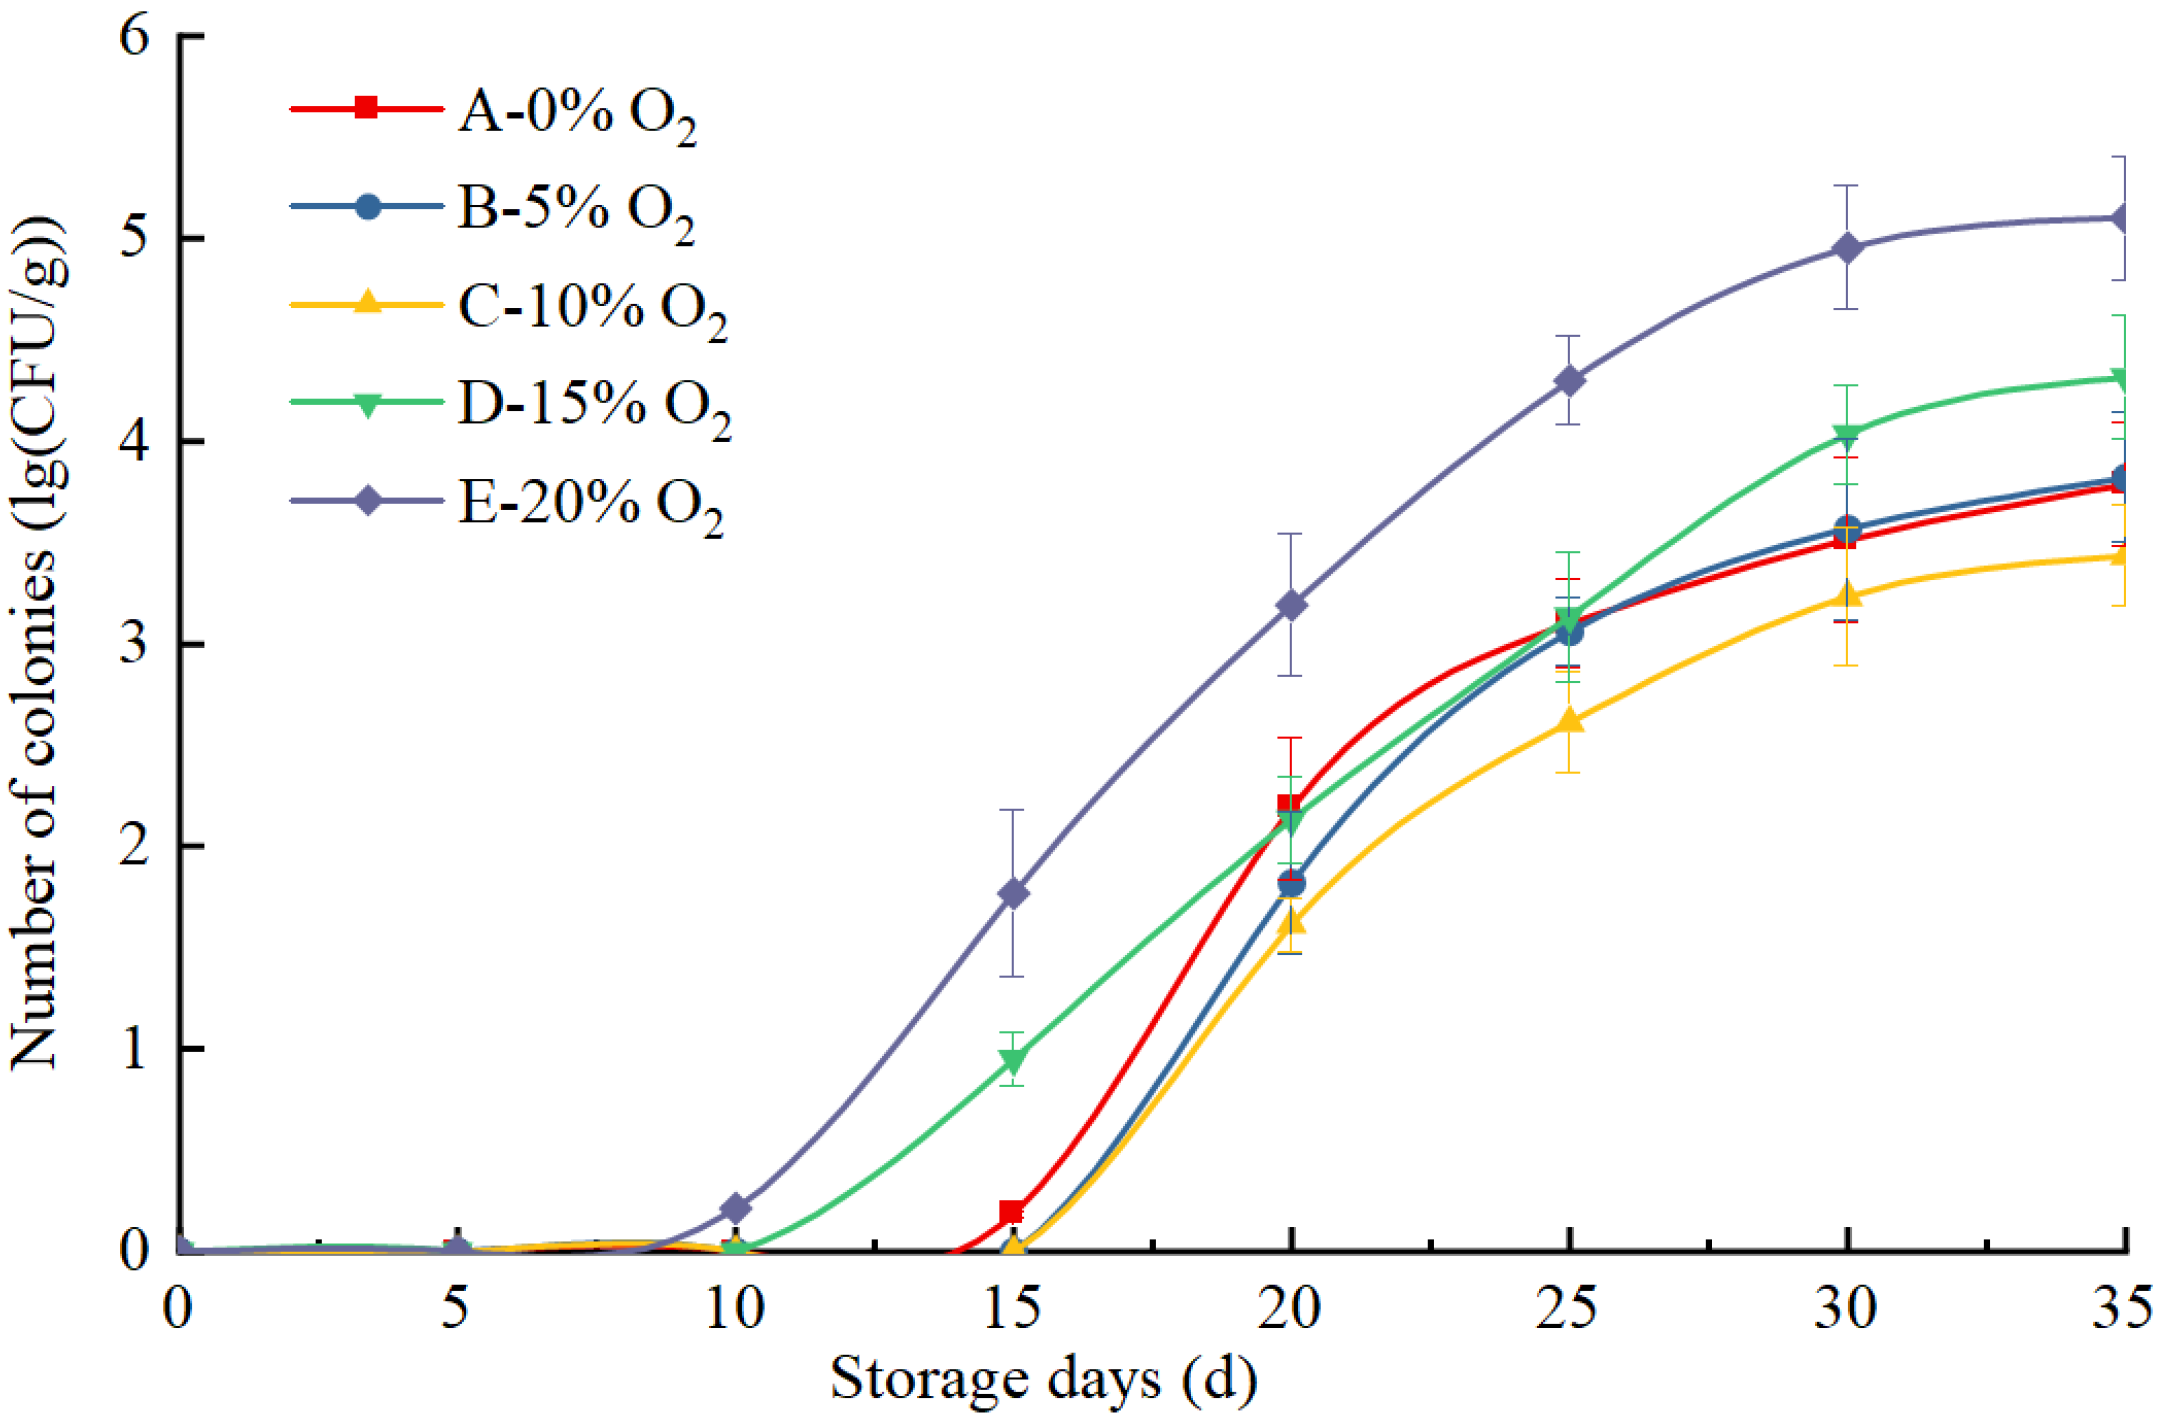
3.2.4. Changes in the Total Number of Colonies in Eggs at Different O2 Concentrations during Storage

Eggs are contaminated with excrement when they are laid and are also contaminated by microorganisms during transportation [32]. The eggshell and eggshell membrane of fresh eggs can effectively block microbial invasion, and the lysozyme in egg white can kill the invading microorganisms. However, as the freshness of the egg decreases, the barrier effect of the eggshell and eggshell membrane decreases, and the lysozyme gradually becomes ineffective. The colony will invade the egg, which can not only affect the storage and freshness of the egg but also harm the health of consumers. There were differences in the number of colonies of eggs stored in environments with different O2 concentrations (Figure 3). The colonies in eggs that were stored in an environment of air multiplied the fastest followed by those in Group D. A large number of colonies were detected on the 15th day of storage and quickly entered an exponential growth period. However, eggs stored in an environment of ≤10% O2 did not enter the breeding period until 20 days later.

3.3. Comprehensive Evaluation of the Storage Effect in Different O2 Concentrations

TOPSIS is a multi-index comprehensive method of evaluation widely used in agricultural production and life [33]. This method was used to evaluate the quality indices of eggs stored for 35 days. The quality indicators of the five groups of eggs were sorted based on the evaluation results and the best storage volume fraction was determined according to the ranking. A comprehensive evaluation was carried out based on the following nine indicators of eggs: weight, yolk color, yolk height, yolk index, Haugh unit, pH, weight loss rate, yolk diameter, and the number of colonies. Among these, egg weight, egg yolk height, egg yolk index, and Haugh unit are very large indicators. Egg yolk color and pH are interval indicators. The egg yolk color range was 11–13 and the pH range was 9–9.3. The weight loss rate, egg yolk diameter, and the number of colonies are very small indicators. MATLAB software was used to standardize all indicators to eliminate the influence of dimensions among the indicators. Distance calculation, scoring, and sorting according to the score were the next steps. The scoring and ranking are shown in Table 4.
In the storage environment with different O2 volume fractions, the order of the score of eggs stored for 35 days was determined to be B > A > C > D > E. Group B with 5% O2 volume fraction and 95% N2 ranked the highest, indicating the best storage conditions for eggs at 25 °C. The storage effect of eggs in Group B was far better than those of Group E, which were stored in an environment of air. The scores of Groups A and C were similar. In terms of economic advantages, the use of 10% O2 incurs lesser costs. Therefore, in actual production and in a real-life setting, the O2 volume fraction in the egg storage environment can be controlled within the range of 5~10%.

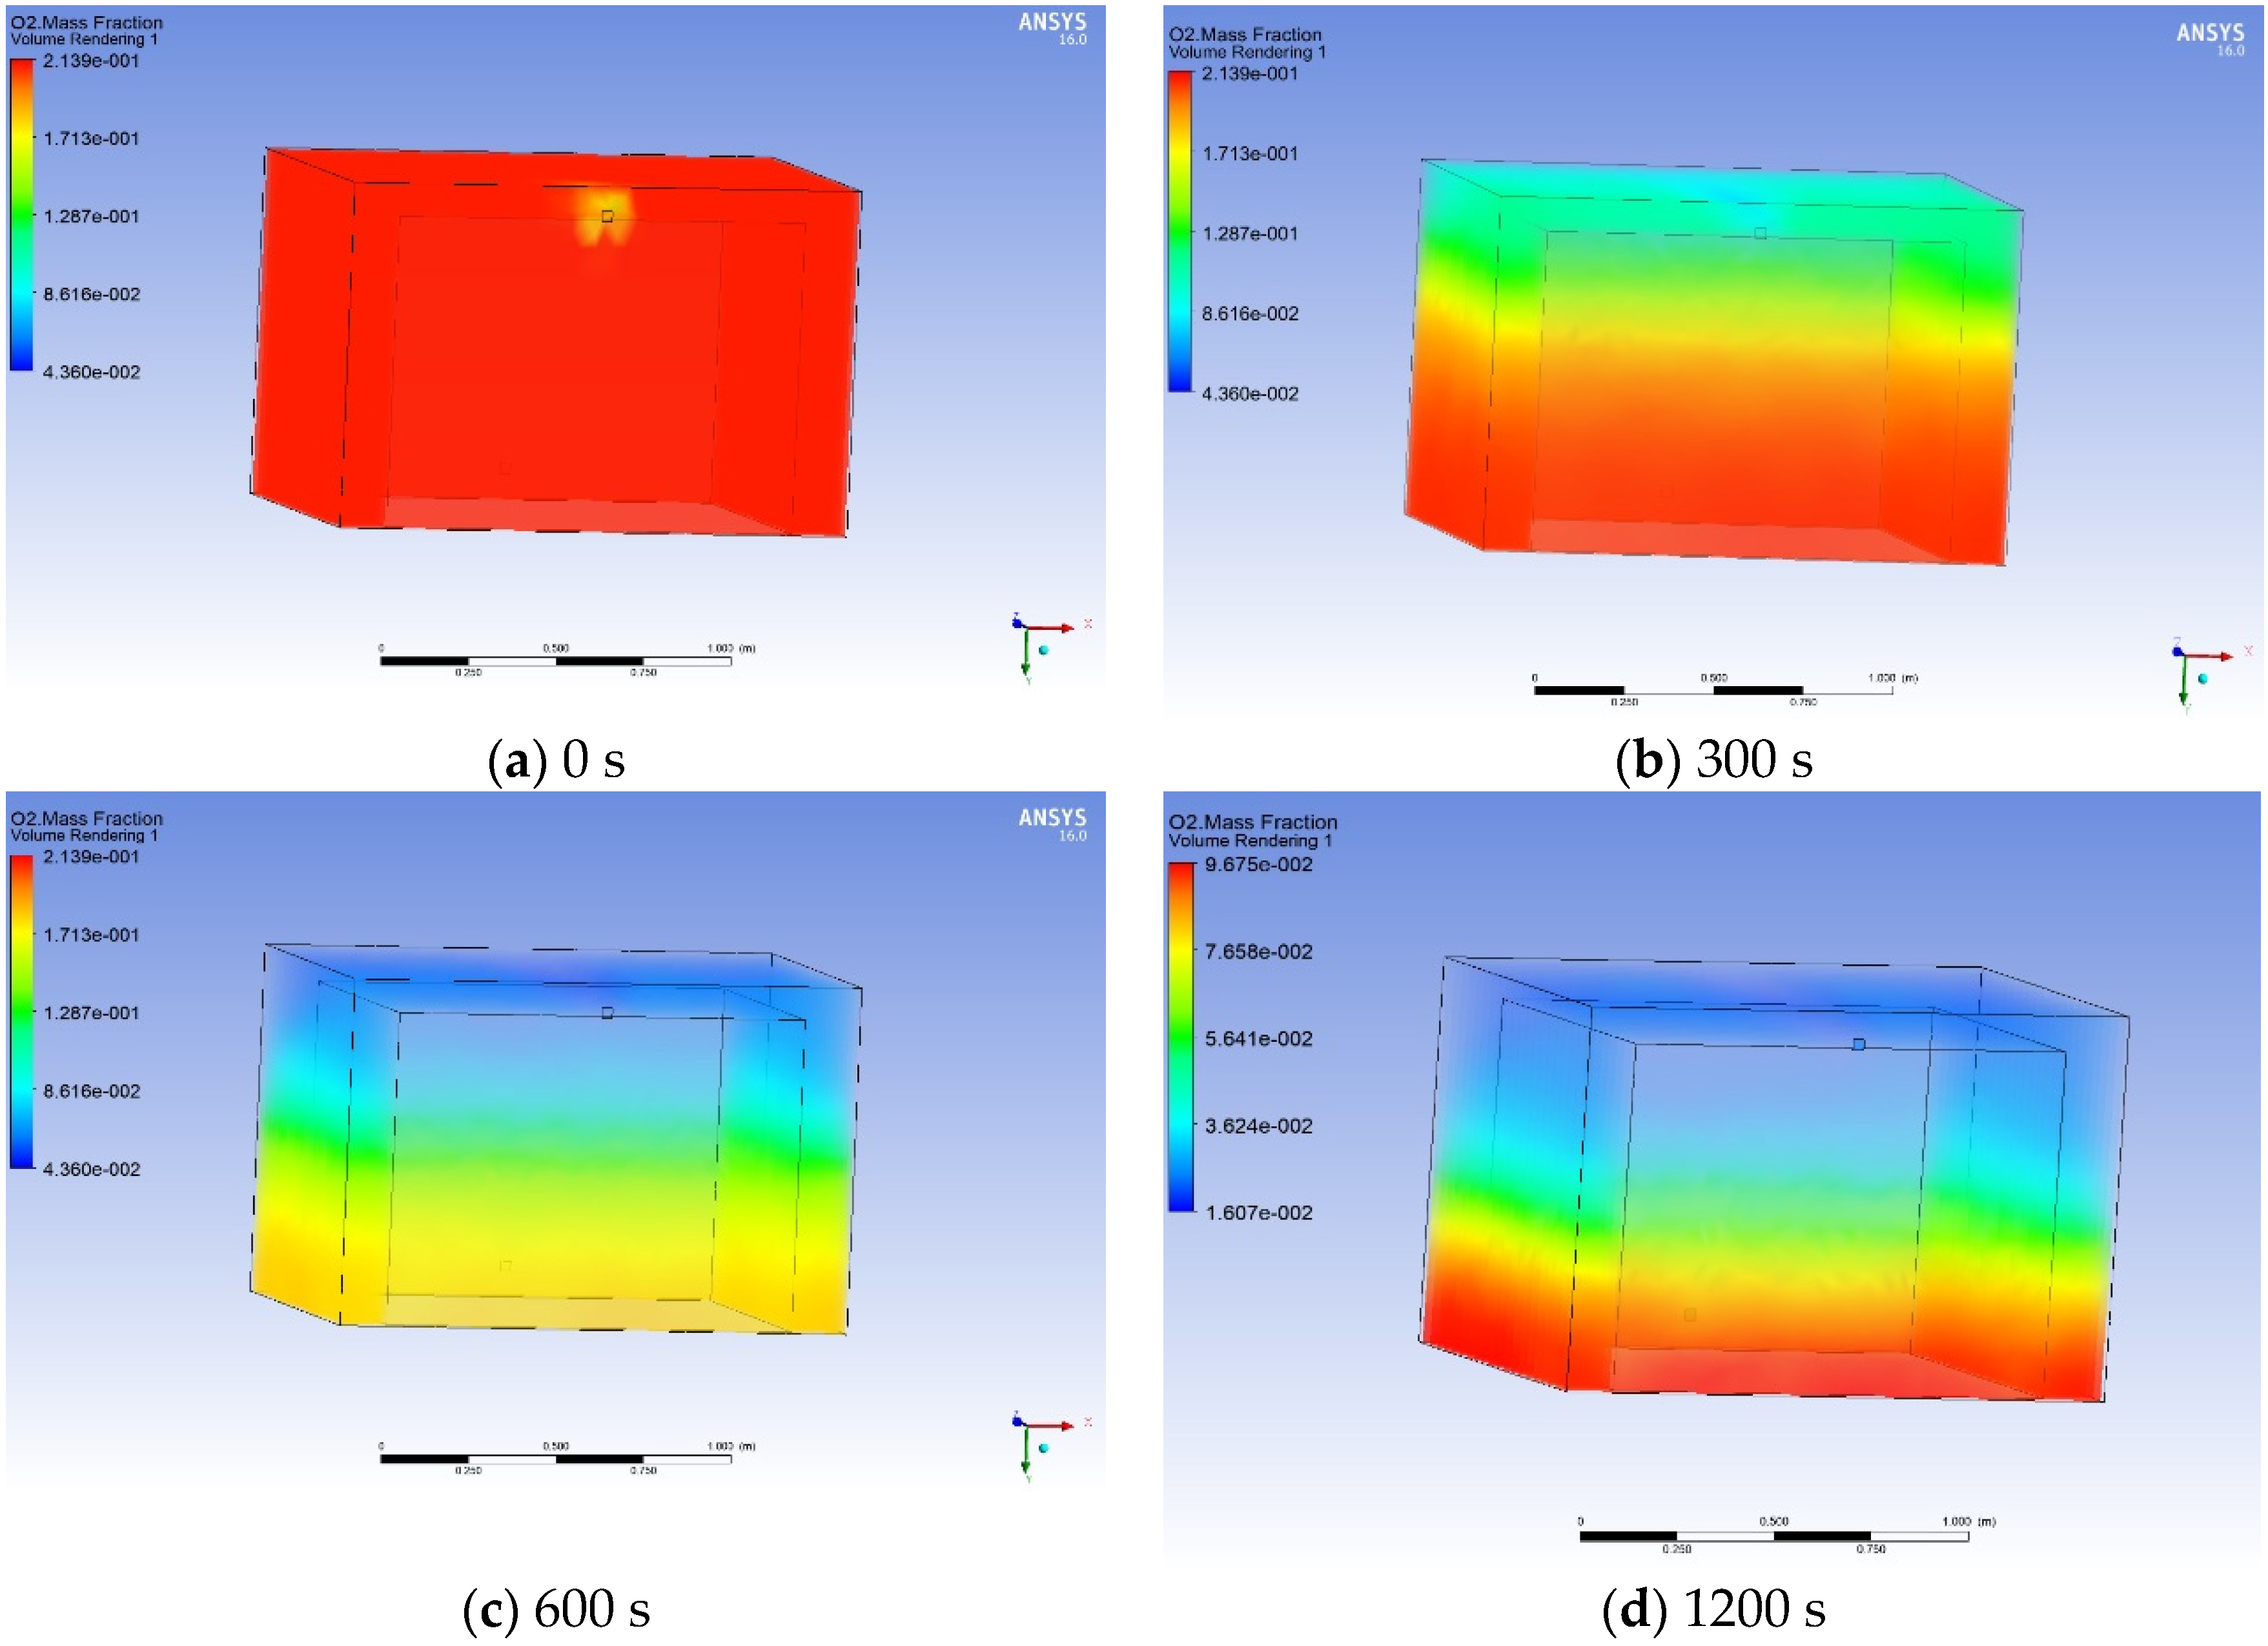
3.4. Process Simulation and Calculation of Air-Conditioning Costs

There is no relevant research on the preservation of eggs in a modified atmosphere in the literature. To better promote this technology for practical applications, it is necessary to simulate the scale-up process in an air-conditioning box. Figure 4 shows the distribution of O2 in the air-conditioning box as the N2 charge was increased. The O2 concentration was about 21% initially, which was consistent with the O2 concentration in the air. After 300 s of N2 filling, the lowest O2 concentration around the air inlet dropped to 4.3%, whereas the O2 concentration at the bottom of the box did not change. After 600 s of N2 filling, the O2 concentration in the upper layer of the air-conditioning box dropped to 5%, but the O2 concentration in the lower layer was about 15%. After 1200 s of N2 filling, the O2 concentration was 1.6% in the upper layer, 5.5% in the middle layer, and 10% in the lower layer. During N2 filling, a concentration difference is bound to be present between the upper and the lower layers due to the upper air inlet and gravity. However, once the N2 filling is stopped, O2 will diffuse with the airflow due to turbulence. Therefore, after 1200 s of N2 filling, the average O2 concentration can meet the storage requirements. In practical applications, a fan can be used to assist with gas mixing.

4. Discussion

One of the current challenges faced by the poultry and egg industries is to extend the shelf life of large quantities of eggs at low costs. Currently, controlled atmosphere storage has not been used for egg storage and agricultural products. Atmosphere technology is generally divided into controlled atmosphere (CA) and modified atmosphere (MA). CA is the active adjustment of the composition of O2, CO2, N2, and other gases in the storage environment by using equipment to introduce gas. MA is based on the respiration of the agricultural component and the selective permeability of the fresh-keeping enclosure bag to achieve an optimal ratio of O2 and CO2 of the storage environment. The goal of both these technologies is to achieve a microenvironmental atmosphere (high CO2 and low O2) that is conducive to storage. CA can be used to accurately match the concentration of gas, although spontaneous atmosphere adjustment is difficult to achieve. The respiratory intensity of eggs is much lower than that of fruits and vegetables. It is difficult to implement an atmosphere effect by relying on the egg’s inherent breathing. Therefore, MA was adopted in this study.
In this study, we reduced the O2 concentration in the storage environment to evaluate the impact of hypoxic conditions on the respiratory intensity and quality of eggs. Further, we determined the possible effect of reduced O2 concentration of the storage environment on egg quality. The optimal O2 concentration for storing eggs was selected. Lastly, the cost of O2 required for these specific settings was determined to better apply it in real-world practice. Some studies have reported that when O2 concentration in the environment is low, the respiration rate is less dependent on temperature [34]. Therefore, the temperature setting chosen for this study was 25 °C. The conditions for achieving this temperature were relatively simple.
In this study, we found that when O2 concentration during storage was <10%, the breathing intensity of eggs was poorly suppressed. Studies have shown that a reduction in the respiratory rate of agricultural products under low O2 levels is not the result of cytochrome oxidase activity, which has a great affinity for O2. Rather, the effect is due to a decrease in the activity of other oxidases such as polyphenol oxidase, ascorbate oxidase, and glycolate oxidase. These oxidases have a lower affinity for O2 [35].
We tested the egg quality and found that the weight loss rate of eggs with lower breathing intensity was reduced. This is because the respiration of an egg entails the consumption of its own substances. Reducing its respiration intensity can slow down the loss of the inherent water. The main reason is that the egg, as a living body with a porous structure, continuously discharges water during respiration. Reducing the respiration intensity of eggs can slow water loss.
At the same time, we found that the rate of decline of the Haugh unit of eggs with weaker breathing intensity was also slower. This could be because the protein structure in the egg white changes during storage and the protease is depolymerized by the hydroxyl ions, thereby affecting the structure of ovomucin-lysozyme. Due to insolubility of the ovomucin-lysozyme complex, the ovomucin gel degrades, resulting in the thinning of the egg white, that is, a reduction in the Haugh unit [36,37]. The decrease in O2 volume fraction in the storage environment inhibits the respiration intensity of eggs (Figure 2), effectively slowing down the changes in the protein structure of the egg white.
We also found that the pH of eggs stored at an O2 concentration of <15% increased faster in the early stages. However, the pH of eggs stored in an O2 concentration >15% increased faster in the later stages. The possible reason is that the breathing intensity of eggs is inhibited in a low O2 content of the storage environment. At this time, anaerobic respiration occurs in eggs and the product of anaerobic respiration is an oxidized inorganic substance. The microorganisms in the eggs from Groups D and E were mainly aerobes, and the organic matter was oxidized to CO2 and water (H2O) during aerobic respiration. The organic components degraded during this process may include carbohydrates, lipids, and organic acids. This process consumes O2 via a series of enzymatic reactions. Glycolysis, tricarboxylic acid cycle, and the electron transfer system are the metabolic pathways of aerobic respiration. The reaction product of CO2 and H2O is acidic [38]; thus, the pH of eggs that underwent aerobic respiration was lower than that of eggs that did not, explaining the lower pH of eggs in Groups D and E in the early stages. Secondly, the pH of eggs has a certain relationship with freshness. From the initial stage of storage to the deterioration of fresh eggs, the trend in pH changes mainly showed an upward trend. The freshness of eggs in Group E was the lowest (Table 2). Therefore, the pH of eggs in Group E increased in the later period likely due to a change in their freshness.
The results show that O2 and N2 in the storage environment affect the growth and reproduction of microorganisms, which is consistent with the results reported by Pietro et al. [39]. N2 is inert, does not react with the contents of eggs [40], and has little effect on the metabolic reactions in eggs. However, the anaerobic environment created by N2 has a selective effect on anaerobic and O2-tolerant lactic acid bacteria [41]. O2 accelerates the proliferation of aerobic bacteria and inhibits the proliferation of anaerobic bacteria [42]. Therefore, the control of O2 levels during egg storage is of great significance to inhibit the respiration of eggs and microbial growth within the egg and prevent deterioration.
The source of N2 gas used for conditioning is generally atmospheric air. N2-production equipment and N2-filling operations are relatively simple and are associated with fairly low costs. The volume of N2 required to fill the air-conditioning box in this study for 1200 s was about 0.54 m3. For manufacturers, using this method to store eggs helps reduce low-temperature damage to eggs and inhibit the growth of microbial colonies, thereby effectively increasing the storage time. Moreover, this method entails an easily manageable temperature requirement and does not necessitate temperature control or changes during spring, autumn, and winter. Thus, our method could be an effective and low-cost option for egg storage and shows potential to be developed further for use in a real-world setting and in production.
Studies have reported that different batches of agricultural products may show a 10% difference in RR [43], while different varieties may show a difference of up to 60% [44]. Our next study will focus on studying the storage of other varieties of eggs in an environment of low O2 to better promote this technology. We also intend to develop and optimize storage control equipment for the air-conditioning technology, which can monitor multiple air-conditioning boxes in real-time and conveniently maintain gas concentrations in the storage environment and meet industrial application standards.

5. Conclusions

In this study, we have reported a new method to extend the shelf life of eggs by storing them in a controlled atmosphere box. By investigating the changes in the respiration intensity and quality of eggs at different O2 concentrations, 5–10% O2 was found to be the most suitable for egg storage. This condition suppresses the breathing intensity of eggs by reducing the O2 concentration during egg storage, thereby slowing down the deterioration of their quality. Moreover, findings from simulation studies revealed that the costs involved in achieving the target conditions in the air-conditioning box were relatively low. Thus, our method could be an effective and low-cost option for egg storage and shows potential to be developed further for use in a real-world setting and in production.

Author Contributions

Conceptualization, Q.W.; methodology, Y.M.; software, Y.M. and Y.T.; validation, Y.M., Y.T. and X.W.; formal analysis, Y.M.; investigation, Y.M. and X.W.; resources, Q.W.; data curation, Y.M.; writing—original draft preparation, Y.M.; writing—review and editing, Y.M. and Q.W.; visualization, Q.W.; supervision, Q.W.; project administration, Q.W.; funding acquisition, Q.W. All authors have read and agreed to the published version of the manuscript.

Funding

This research was funded by the National Natural Science Foundation of China (No.31871863 and No.32072302), Key R & D project of Hubei Province (China) (2020BBB072).

Institutional Review Board Statement

Not applicable.

Informed Consent Statement

Not applicable.

Data Availability Statement

The data presented in this study are available on request from the corresponding author. The data are not publicly available.

Acknowledgments

The authors wish to thank all the reviewers who participated in the review during the preparation of this manuscript.

Conflicts of Interest

The authors declare no conflict of interest.

References

  1. Onyenweaku, E.O.; Ene-Obong, H.N.; Oko, G.E.; Williams, I.O. Contribution of Eggs and Other Cholesterol- containing Foods to Total Dietary Cholesterol Intake, and Their Influence on Serum Lipid Profile of Adults in Calabar, Nigeria. Eur. J. Nutr. 2019, 9, 329–340. [Google Scholar] [CrossRef]
  2. Duan, Y.F.; Wang, Q.H. Optimization of a Predictive Model for Rapid Detection of Egg Freshness Using Visible Near-Infrared Spectra Based on Combination of Feature Selection and Feature Extraction. Food Sci. 2020, 41, 273–278. [Google Scholar]
  3. Fu, D.D.; Wang, Q.H.; Ma, M.H.; Xu, F. Correlation Analysis between Egg Freshness Indexes and S-Ovalbumin Content during Storage. Food Sci. 2018, 39, 1–6. [Google Scholar]
  4. Zheng, Y.; Ding, C.Z.; Ma, J. Price Conduction Effect of Different Market Links in China’s Egg Industry. J. Agro-For. Econ. Manag. 2018, 17, 727–737. [Google Scholar]
  5. Skrypec, S.; Doh, H.; Whiteside, W.S. Effect of oxygen scavenging films and modified atmosphere on the color quality of hot-filled freestone peach puree. J. Food Process Eng. 2021, 44, e13681. [Google Scholar] [CrossRef]
  6. Kaynas, K.; Iftci, H.N. Effect of Controlled and Modified Atmosphere on Storage Quality of Cauliflower (Brassica oleracea L. var. botrytis cv. Iglo) Heads. J. Agric. Fac. Gaziosmanpasa Univ. 2020, 37, 94–101. [Google Scholar]
  7. Pace, B.; Capotorto, I.; Palumbo, M.; Pelosi, S.; Cefola, M. Combined Effect of Dipping in Oxalic or in Citric Acid and Low O2 Modified Atmosphere, to Preserve the Quality of Fresh-Cut Lettuce during Storage. Foods 2020, 9, 988. [Google Scholar] [CrossRef] [PubMed]
  8. Chong, K.L.; Peng, N.; Yin, H.; Lipscomb, G.G.; Chung, T.S. Food sustainability by designing and modelling a membrane-controlled atmosphere storage system. J. Food Eng. 2013, 114, 361–374. [Google Scholar] [CrossRef]
  9. Teixeira, G.; Durigan, J.F. Storage of ‘Palmer’ mangoes in low-oxygen atmospheres. Fruits 2011, 66, 279–289. [Google Scholar] [CrossRef] [Green Version]
  10. Zhao, X.; Zhang, Y.; Ma, Y.; Zhang, L.; Wang, D. Inhibitory mechanism of low-oxygen-storage treatment in postharvest internal bluing of radish (Raphanus sativus) roots. Food Chem. 2021, 364, 130423. [Google Scholar] [CrossRef]
  11. Zhang, X.H. Effects of Low Oxygen on Postharvest Energy Metabolism and Aroma Biosynthesis in Strawberry Fruits. Master’s Thesis, Bohai University, Jinzhou, China, 2020. [Google Scholar]
  12. Rocculi, P.; Cocci, E.; Sirri, F.; Cevoli, C.; Romani, S.; Rosa, M.D. Modified atmosphere packaging of hen table eggs, effects on functional properties of albumen. Poult. Sci. 2011, 90, 1791–1798. [Google Scholar] [CrossRef] [PubMed]
  13. Williams, S.B.; Murdock, L.L.; Dieudonne, B.; Wei, W. Storage of Maize in Purdue Improved Crop Storage (PICS) Bags. PLoS ONE 2017, 12, e0168624. [Google Scholar] [CrossRef]
  14. Xu, L.; Jia, F.; Luo, C.Y.; Zhao, F.H.; Gao, F.; Liu, Y.; Dai, D.T.; Li, X.M. Using low-field nuclear magnetic resonance technology to study the changes of egg white moisture in CO2 storage. Sci. Tech. Food Ind. 2017, 38, 6. [Google Scholar]
  15. Shao, Z.H.; Li, X.M. Comparative analysis of the effects of modified atmosphere packaging, cleaning coating and ultraviolet sterilization treatment on egg quality. Food Sci. Tech. 2019, 44, 73–79. [Google Scholar]
  16. Yuan, X.L.; Gao, J.X.; Du, Y.; Yao, X.J.; Chen, F.; Liu, Y.; Wang, H.W.; Li, X.M. Effects of Different Balanced Gases on the Fresh-keeping Quality of Eggs in Controlled Atmosphere Storage. Sci. Tech. Food Ind. 2014, 35, 303–307. [Google Scholar]
  17. Pasquali, F.; Manfreda, G.; Olivi, P.; Rocculi, P.; Sirri, F.; Meluzzi, A. Modified-atmosphere packaging of hen table eggs: Effects on pathogen and spoilage bacteria. Poult. Sci. 2012, 91, 3253–3259. [Google Scholar] [CrossRef] [PubMed]
  18. Wang, J.J.; Wang, Q.H.; Zhu, Z.H.; Ma, Y.X. Correlation between Egg Internal Quality and Respiration Intensity. Food Sci. 2018, 39, 36–40. [Google Scholar]
  19. Wang, J.J.; Wang, Q.H.; Ma, M.H.; Wang, B. Correlation Between Egg External Quality and Respiration Intensity. Food Sci. 2018, 39, 42–46. [Google Scholar]
  20. Wang, Q.H.; Zhang, T.; Ma, M.H. Oxygen breathing regularity of eggs in storage period monitoring by non-invasive micro-test technique. Trans. Chin. Soc. Agric. Eng. 2014, 30, 255–261. [Google Scholar]
  21. Ma, Y.X.; Wang, Q.H.; Wang, X.B.; Tian, Y.N. Effect of Concentration of Carbon Dioxide on Respiration Intensity and Quality of Eggs. Chin. J. Anal. Chem. 2020, 48, 1728–1736. [Google Scholar]
  22. Haugh, R. The Haugh unit for measuring egg quality. Us Egg Poult. Mag. 1937, 43, 552–573. [Google Scholar]
  23. Curtis, A.C.; Anderson, E.A.; Musgrove, M.T. The effects of commercial cool water washing of shell eggs on Haugh unit, vitelline membrane strength, aerobic microorganisms, and fungi. Poult. Sci. 2010, 89, 160–168. [Google Scholar]
  24. Lalmi, D.; Benseddik, A.; Bensaha, H.; Bouzaher, M.T.; Arrif, T.; Guermoui, M.; Rabehi, A. Evaluation and estimation of the inside greenhouse temperature, numerical study with thermal and optical aspect. Int. J. Ambient. Energy 2021, 42, 1269–1280. [Google Scholar] [CrossRef]
  25. Yang, Q.Y. The Study of Thermal and Humid Environment Characteristics of Controlled Atmosphere (CA) Storage. Master’s Thesis, Xi’an University of Architecture and Technology, Xi’an, China, 2016. [Google Scholar]
  26. Zhou, B. Variation and Distribution of Species Concentration in CA Storage during Reduction Process of Oxygen. Master’s Thesis, Xi’an University of Architecture and Technology, Xi’an, China, 2015. [Google Scholar]
  27. Duncan, D.B. Multiple Range and Multiple F Tests. Biometrics 1955, 11, 1–42. [Google Scholar] [CrossRef]
  28. Ezhilarasan, N.; Vijayalakshmi, C. Optimization of Fuzzy programming with TOPSIS Algorithm. Procedia Comput. Sci. 2020, 172, 473–479. [Google Scholar] [CrossRef]
  29. Tabidi, M.H. Impact of storage period and quality on composition of table egg. J. Environ. Biol. 2011, 5, 856–861. [Google Scholar]
  30. Nematinia, E.; Mehdizadeh, S.A. Assessment of Egg Freshness by Prediction of Haugh Unit and Albumen pH Using an Artificial Neural Network. J. Food Meas. Charact. 2018, 12, 1449–1459. [Google Scholar] [CrossRef]
  31. Fu, D.D.; Wang, Q.H. Predictive Models for the Detection of Egg Freshness, Acidity and Viscosity Using Hyper-Spectral Imaging. Food Sci. 2016, 37, 173–179. [Google Scholar]
  32. Putnik, P.; Kovačević, D.B.; Herceg, K.; Levaj, B. Influence of Respiration on Predictive Microbial Growth of Aerobic Mesophilic Bacteria and Enterobacteriaceae in Fresh-Cut Apples Packaged Under Modified Atmosphere. J. Food Saf. 2017, 37, e12284. [Google Scholar] [CrossRef]
  33. Abdelkrim, A.; Lynda, M.; Youcef, H. Dealing with value constraints in decision making using MCDM methods. J. Comput. Sci. 2020, 44, 101154. [Google Scholar]
  34. Han, S.H.; Han, D.J.; Lee, S.J. Modeling respiration rates of Ipomoea batatas (sweet potato) under hermetic storage system. Food Sci. Biotechnol. 2020, 29, 227–234. [Google Scholar] [CrossRef] [PubMed]
  35. Kader, A.A. Biochemical and physiological basis for effects of controlled and modified atmospheres on fruits and vegetables. Food Technol. 1986, 40, 99–104. [Google Scholar]
  36. Omana, D.A.; Liang, Y.; Kav, N.V.; Wu, J. Proteomic analysis of egg white proteins during storage. Proteomics 2011, 11, 144–153. [Google Scholar] [CrossRef]
  37. Qiu, N.; Ma, M.; Zhao, L.; Liu, W.; Li, Y.Q. Comparative Proteomic Analysis of Egg White Proteins under Various Storage Temperatures. J. Agric. Food Chem. 2012, 60, 7746–7753. [Google Scholar] [CrossRef]
  38. Saenmuang, S.; Al-Haq, M.I.; Samarakoon, H.C.; Makino, Y.; Kawagoe, Y.; Oshita, S. Evaluation of Models for Spinach Respiratory Metabolism Under Low Oxygen Atmospheres. Food Bioprocess Technol. 2012, 5, 1950–1962. [Google Scholar] [CrossRef]
  39. Zhang, B.Y.; Samapundo, S.; Pothakos, V.; Sürengil, G.; Devlieghere, F. Effect of high oxygen and high carbon dioxide atmosphere packaging on the microbial spoilage and shelf-life of fresh-cut honeydew melon. Int. J. Food Microbiol. 2013, 166, 378–390. [Google Scholar] [CrossRef] [PubMed]
  40. Keuschnig, C.; Gorfer, M.; Li, G.; Mania, D.; Frostegrd, S.; Bakken, L.; Larose, C. NO and N2O transformations of diverse fungi in hypoxia, evidence for anaerobic respiration only in Fusarium strains. Environ. Microbiol. 2020, 22, 2182–2195. [Google Scholar] [CrossRef]
  41. Kawasaki, S.; Suzuki, I.; Niimura, Y. Oxygen adaptation mechanism of anaerobic bacteria Microbial ecology under 0–21% oxygen concentrations. Jpn. J. Lact. Acid Bact. 2013, 24, 79–87. [Google Scholar] [CrossRef] [Green Version]
  42. Nassos, P.S.; Jr, K.; Stafford, A.E. Lactic Acid Concentration and Microbial Spoilage in Anaerobically and Aerobically Stored Ground Beef. J. Food Sci. 2010, 50, 710–712. [Google Scholar] [CrossRef]
  43. Talasila, P.C.; Chau, K.V.; Brecht, J.K. Design of rigid modified atmosphere packages for fresh fruits and vegetables. J. Food Sci. 1995, 60, 758–769. [Google Scholar] [CrossRef]
  44. Pretel, M.T.; Souty, M.; Romojaro, F. Use of passive and active modified atmosphere packaging to prolong the postharvest life of three varieties of apricot (Prunus armeniaca, L.). Eur. Food Res. Tech. 2000, 211, 191–198. [Google Scholar] [CrossRef]
Figure 1. Geometric model of the air adjuster.
Applsci 12 00380 g001
Figure 2. Trend of egg respiration intensity during storage.
Applsci 12 00380 g002
Figure 3. Changes in the total number of colonies in egg under different oxygen (O2) concentrations during storage.
Applsci 12 00380 g003
Figure 4. Distribution of oxygen (O2): This figure describes the distribution of O2 at different time points when nitrogen (N2) is introduced into the air-conditioning box. The color corresponds to the density bar on the left side of the image. The figure, in turn, corresponds to the O2 distribution at 0 s, 300 s, 600 s, and 1200 s.
Applsci 12 00380 g004
Table 4. Evaluation results using TOPSIS.
GroupA (0% O2)B (5% O2)C (10% O2)D (15% O2)E (20% O2)
Score0.0220.0250.0210.0180.011
Sorting21345
Publisher’s Note: MDPI stays neutral with regard to jurisdictional claims in published maps and institutional affiliations.

