Article

Numerical Simulation of Ultra-Shallow Buried Large-Span Double-Arch Tunnel Excavated under an Expressway

1
College of Civil Engineering, Tongji University, Shanghai 200092, China
2
Key Laboratory of Geotechnical and Underground Engineering of Ministry of Education, Tongji University, Shanghai 200092, China
3
Xiamen Road and Bridge Construction Group Company Ltd., Xiamen 361026, China
*
Author to whom correspondence should be addressed.
Appl. Sci. 2022, 12(1), 39; https://doi.org/10.3390/app12010039
Submission received: 29 November 2021 / Revised: 16 December 2021 / Accepted: 19 December 2021 / Published: 21 December 2021

Abstract

:
The temporal and spatial effects of a complicated excavation process are vital for an ultra-shallow buried large-span double-arch tunnel excavated under an expressway in service. Numerical simulations are urgent and necessary to understand the effect of the total construction process. Taking Xiamen Haicang tunnel as a research object, the total excavation process of three pilot tunnels and the three-bench reserved core soil method of an ultra-shallow buried large-span double-arch tunnel with a fault fracture zone under an expressway was simulated using software FLAC3D. The deformation of the surface, surrounding rock, underground pipelines, tunnel support structure and partition wall of the three pilot tunnels and the main tunnel was analyzed, and the dangerous areas and time nodes were obtained. When the tunnel was excavated to the fault fracture zone, the deformation of the surface and surrounding rock increased significantly. The rock and soil within 20 m behind the excavation surface of the pilot tunnel were greatly disturbed by the excavation. During the excavation of the main tunnel, the horizontal displacement of the middle partition wall moved slightly towards the main tunnel excavated first. The research results can provide a reference for the construction design of double-arch tunnels.

1. Introduction

The design and construction of double-arch tunnels have been developed for nearly 50 years. In 1974, the first double-arch tunnel was built in Japan, and then this structure was adopted by some European countries. The double-arch tunnel is a special form of tunnel engineering. Two adjacent tunnels are connected by a middle partition wall, which has the advantages of a small footprint, high space utilization, and smooth line connection. Therefore, the double-arch tunnel has been widely used in tunnel construction in recent years [1,2]. However, compared with single-arch tunnels, double-arch tunnels have problems such as large excavation areas, difficulty controlling surrounding rock deformation, and complex structural forces [3]. A significant difference between the double-arch tunnel and the ordinarily separated tunnel is that the double-arch tunnel has a great influence on the stability of the other tunnel and the deviation of the middle partition wall at different construction stages [4].
The double-arch tunnel has many procedures, and the surrounding rock has been disturbed by excavation and unloading, and the stress state has changed many times, which makes the double-arch tunnel is prone to surrounding rock destruction and collapse and other engineering accidents in the construction process, so it has been widely concerned by scholars. At present, many scholars have widely studied the mechanical response of surrounding rock and tunnel structure during the construction of double-arch tunnels by using field monitoring, physical model tests, the analytical method and numerical simulation. At the construction site of a double-arch tunnel, Wu et al. [5] studied the overbreak of the double-arch tunnel through on-site monitoring and found that the overbreak was mainly concentrated at the connection between the middle pilot tunnel and the tunnel. Yan et al. [6] measured the internal force of the secondary lining of a double-arch tunnel at a construction site, and the results showed that the force of the double-arch tunnel lining structure was related to various factors such as construction procedures, geological conditions and location. Lai et al. [7] found through field monitoring that the key areas of the double-arch tunnel were mainly located in the middle partition wall, sidewall and vault. Yuan et al. [8] designed a complete on-site monitoring scheme for a Jinzhulin double-arch tunnel and analyzed the stress of the tunnel support system and the law of vault settlement in detail. In an underground copper ore mine in Poland, Skrzypkowski [9] used string sensors to monitor the behavior of the rock mass between two workings. Taking an earth-pressure-balance shield tunneling project in Guangzhou as an example, Zhang et al. [10] studied the key factors of tunnel boring machine performance and delayed construction schedule, and found that the performance of TBM varies greatly in different strata. Tunnel face collapse, spewing during spoil discharge and disc cutter consumptions are the typical factors affecting construction progress. Yan et al. [11] took the construction efficiency of earth pressure balance shield tunneling in the soft deposit of Tianjin as an example to study the relationship between soil properties and energy consumption, and found that the total energy consumption of shield tunneling machine can be estimated based on the particle size distribution of soil. In terms of physical model test, Li et al. [12] and Yang et al. [13] conducted an in-depth study on the excavation method of cross diaphragm method for the double-arch tunnel through physical model test and numerical simulation. Using shaking table tests, Liu et al. [14] studied the acceleration response of a shallow-buried offset double-arch tunnel under Wenchuan wave, and discussed the influence of unbiased and offset on the acceleration response of a shallow-buried offset double-arch tunnel. Taking a double-arch tunnel of the Yuanmo Expressway in Yunnan Province as the engineering background, Liu et al. [15] conducted indoor model tests of a double-arch tunnel based on the principle of elastic phase similarity, simulated the construction conditions of the double-arch tunnel and studied the stress and displacement distribution of tunnel surrounding rock during construction. Liu et al. [16] simulated the pilot tunnel excavation in a Loess multi-arch tunnel through a large-scale indoor model test. The field monitoring conditions were complex and the physical model test was expensive, and the analytical method proved an effective method for analyzing the mechanical behavior of tunnel-surrounding rock [17], but there are few studies on the analytical solution of the double-arch tunnel at present. Hu et al. [18] combined the unbalanced force transfer method with the force method to give an analytical solution for the internal force of a segmental prefabricated double-arch tunnel lining. Yang et al. [19] proposed a set of analytical solutions to determine the internal forces of shallow buried double-arch tunnel lining structures under symmetric external loads. Lyu et al. [20,21] proposed a new analytical method based on limit equilibrium analysis to calculate the tunnel pressure caused by the surrounding rock of layered double tunnels, and applied it to the pressure analysis of the metro twin-tunnels in Chongqing and Fuzhou, China. Wu et al. [22] simplified the tunnel to homogeneous Timoshenko beams and proposed a new longitudinal structure model considering interring shear dislocation, which can better describe the actual deformation mode of the tunnel. Elbaz et al. [23] combined a data handling type neural network with a genetic algorithm to propose a new model to estimate disc cutter life, which can analyze the monitoring data such as shield performance database, disc cutter consumption, geological conditions and operating parameters. Compared with the above methods, numerical simulation has the characteristics of low cost, time-saving and labor-saving, so it has been widely used in double-arch tunnels. Soliman et al. [24] used the finite element method to study the elastic response of a double-arch tunnel, and found that the stress and deformation analysis of the tunnel must consider the mutual influence of the continuous tunneling of the double-arch tunnel. Wang et al. [25] established a numerical calculation model of the double-arch tunnel by using FLAC3D software, and analyzed the morphological characteristics, evolution process and oblique arch effect of pressure arch in the double-arch tunnel. Li et al. [26] used the actual excavation data of a highway tunnel to establish the calculation model of surrounding rock pressure of double-arch tunnel, analyzed the evolution law of surrounding rock pressure in the excavation process of the double-arch tunnel under different stress states, different construction methods and different tunnel sizes, and studied that the surrounding rock pressure of double arch tunnel presents skew distribution characteristics under various working conditions. Shi et al. [27] conducted a three-dimensional numerical simulation analysis of blasting vibration during the construction process of full-section excavation of the double-arch tunnel, and studied the vibration impact of blasting construction on the middle partition wall in the post excavated the main tunnel of a double-arch tunnel. Li et al. [28] studied surrounding rock stability and internal force of a double-arch tunnel under seepage conditions based on the fluid-structure coupling method. Bai et al. [29,30] carried out the numerical simulation of the excavation process of a double-arch tunnel with the three pilot tunnel method.
In general, scholars have carried out a large number of researches on double-arch tunnels and achieved fruitful results, but there are few researches on the deformation of the surface, surrounding rock, underground pipeline, tunnel support structure and middle partition wall in the total construction process of double-arch tunnels under a running highway. Therefore, the numerical simulation of the total process of tunnel construction is carried out according to the site geological conditions, surrounding environmental conditions, construction method, construction process and support structure system, which can be referred by similar projects.

2. Overview of the Engineering

The double-arch tunnel in the concealed excavation section of Haicang tunnel is located in Huli District, Xiamen City, Fujian Province, China. The starting and ending mileage of the double-arch section of the Haicang tunnel is BK 17 + 825–BK 17 + 982, with a total length of 157 m and a buried depth of about 5 m–16 m. The stratum on the surface of the tunnel site is a miscellaneous fill with a thickness of about 3.0 m, and the lower stratum is silty clay with a thickness of about 2.3–13.5 m. The bedrock is granite, and the weathering degree varies greatly. The thickness of fully weathered and strongly weathered rock layers is about 10–25.7 m, and the rock is weakly weathered. The structural surface of the slightly weathered rock has good shape and distribution, good integrity, high rock strength and poor water permeability. The buried depth of the tunnel is ultra-shallow and the main rock of the tunnel is mainly fully weathered and highly weathered rock and residual soil with poor self-stability. There is a fault fracture zone at BK 17 + 890–BK 17 + 930, and the surrounding rock of the tunnel has poor stability and is prone to collapse, subsidence and water inrush. According to the investigation, it is found that the traffic volume of this section is large and the pipe network is densely arranged. In the tunnel site area of the shallow buried section, there are eight underground pipelines, such as water supply pipe, drain pipe, gas pipe and power cable, and the buried depth is less than 2.5 m. The longitudinal profile of the double-arch tunnel is shown in Figure 1. The project has complex geological conditions, weak lithology, poor stability of tunnel confining pressure and high construction risk. Therefore, controlling the deformation and settlement of tunnel structure, adjacent surface, buried pipelines and surrounding buildings within a reasonable range is a significant difficulty of the project. According to the optimized construction organization design, the final excavation plan is the three pilot tunnel method. The middle pilot tunnel is first excavated, then the non-biased side pilot tunnel is excavated, and finally the biased side pilot tunnel is excavated. The excavation of the main tunnel uses the three-bench reserved core soil method. The main tunnel on the non-biased side is excavated first, and then the main tunnel on the biased side is excavated.

3. Numerical Model

3.1. Establishment of Numerical Model

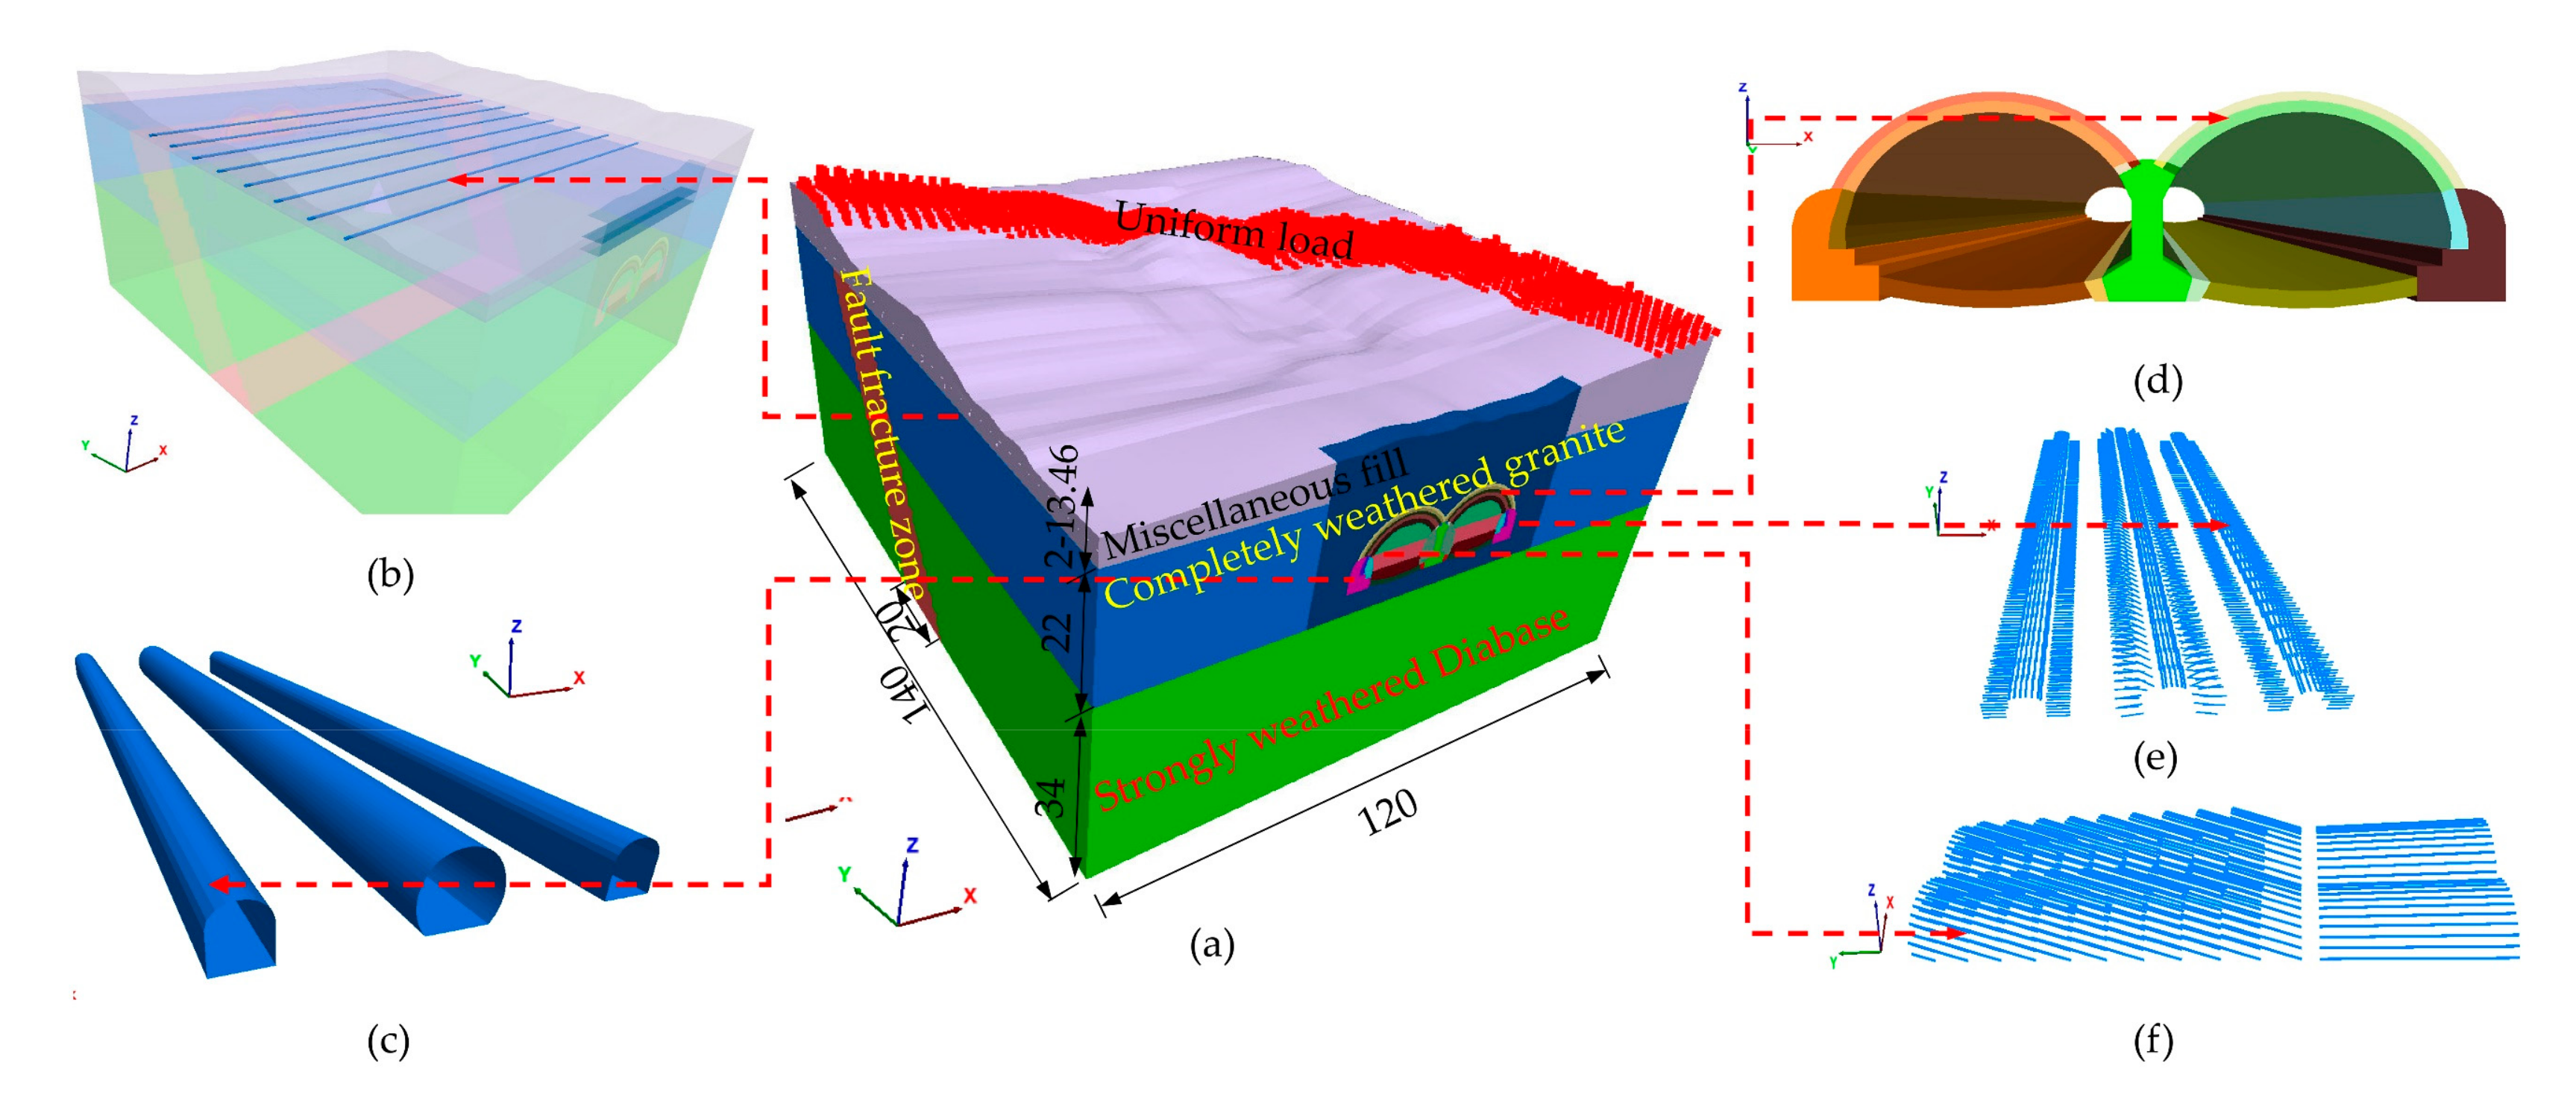
FLAC3D was used to establish the numerical model of the double-arch tunnel. To avoid the influence of boundary condition setting on the simulation results, the boundary of the model was expanded to a certain range based on the study area. In tunnel modeling, it is generally considered that the scope of the affected area was defined between three times and five times of tunnel diameter. Therefore, the length of the model was set as 120.00 m (the maximum single tunnel diameter in this project was 14.6 m). The width of the model was set as 140.00 m according to the excavation length along the longitudinal axis of the tunnel in the actual construction. The surface of the model was established according to the actual terrain and the distance from the highest point to the bottom of the model was 69.46 m. In the model, the fault fracture zone was generalized as an area with a width of 20.00 m in the excavation direction and a dip angle of 60°. As the thickness and distribution range of silty clay were small in practice, silty clay was not considered in the model. The soil layer in the model was divided into four parts, and their types and thicknesses were as follows: miscellaneous fill soil, 2–13.46 m thick; fully weathered granite, 22 m thick; strongly weathered diabase, 34 m thick; The width of the fault fracture zone was 20 m. The rock and soil in the model were established by solid elements. The Xinghu Road on the upper part of the tunnel was an urban expressway, and the road load was simplified to a uniformly distributed load of 21.5 kN/m2, which was applied according to the position of the road in the scene, as shown in Figure 2a. In the model, the underground pipelines were simulated by shell structural units, and were arranged in the form of the longitudinal section of the tunnel, with a total of eight locations with a spacing of 10 m, as shown in Figure 2b. The lining of the three pilot tunnels was simulated by shell structural elements, as shown in Figure 2c. The lining and partition wall of the main tunnel was established by solid units, and their thickness and shape were established according to the actual situation, as shown in Figure 2d. The anchor bolts and advanced small conduits of the pilot tunnel were simplified as anchor cable units. The length of the anchor bolt was 2.5 m, the circumferential spacing was 0.6 m, and the longitudinal spacing was 1 m. The length of the advanced small conduit was 3.5 m, the circumferential spacing was 0.4 m, the longitudinal spacing was 3 m, and the extrapolation angle was 15° with the tunnel axis, as shown in Figure 2e. The long pipe shed at the portal of the main tunnel and the long pipe shed ahead of the tunnel body were also simulated by the anchor cable element. The external diameter of the long pipe shed was 159 mm and the circumferential spacing was 35 cm. The length of the long pipe shed at the entrance of the main tunnel was 40 m, with an elevation of 1°. The length of the long pipe shed ahead of the tunnel body was 20 m, with an elevation of 30°, as shown in Figure 2f.
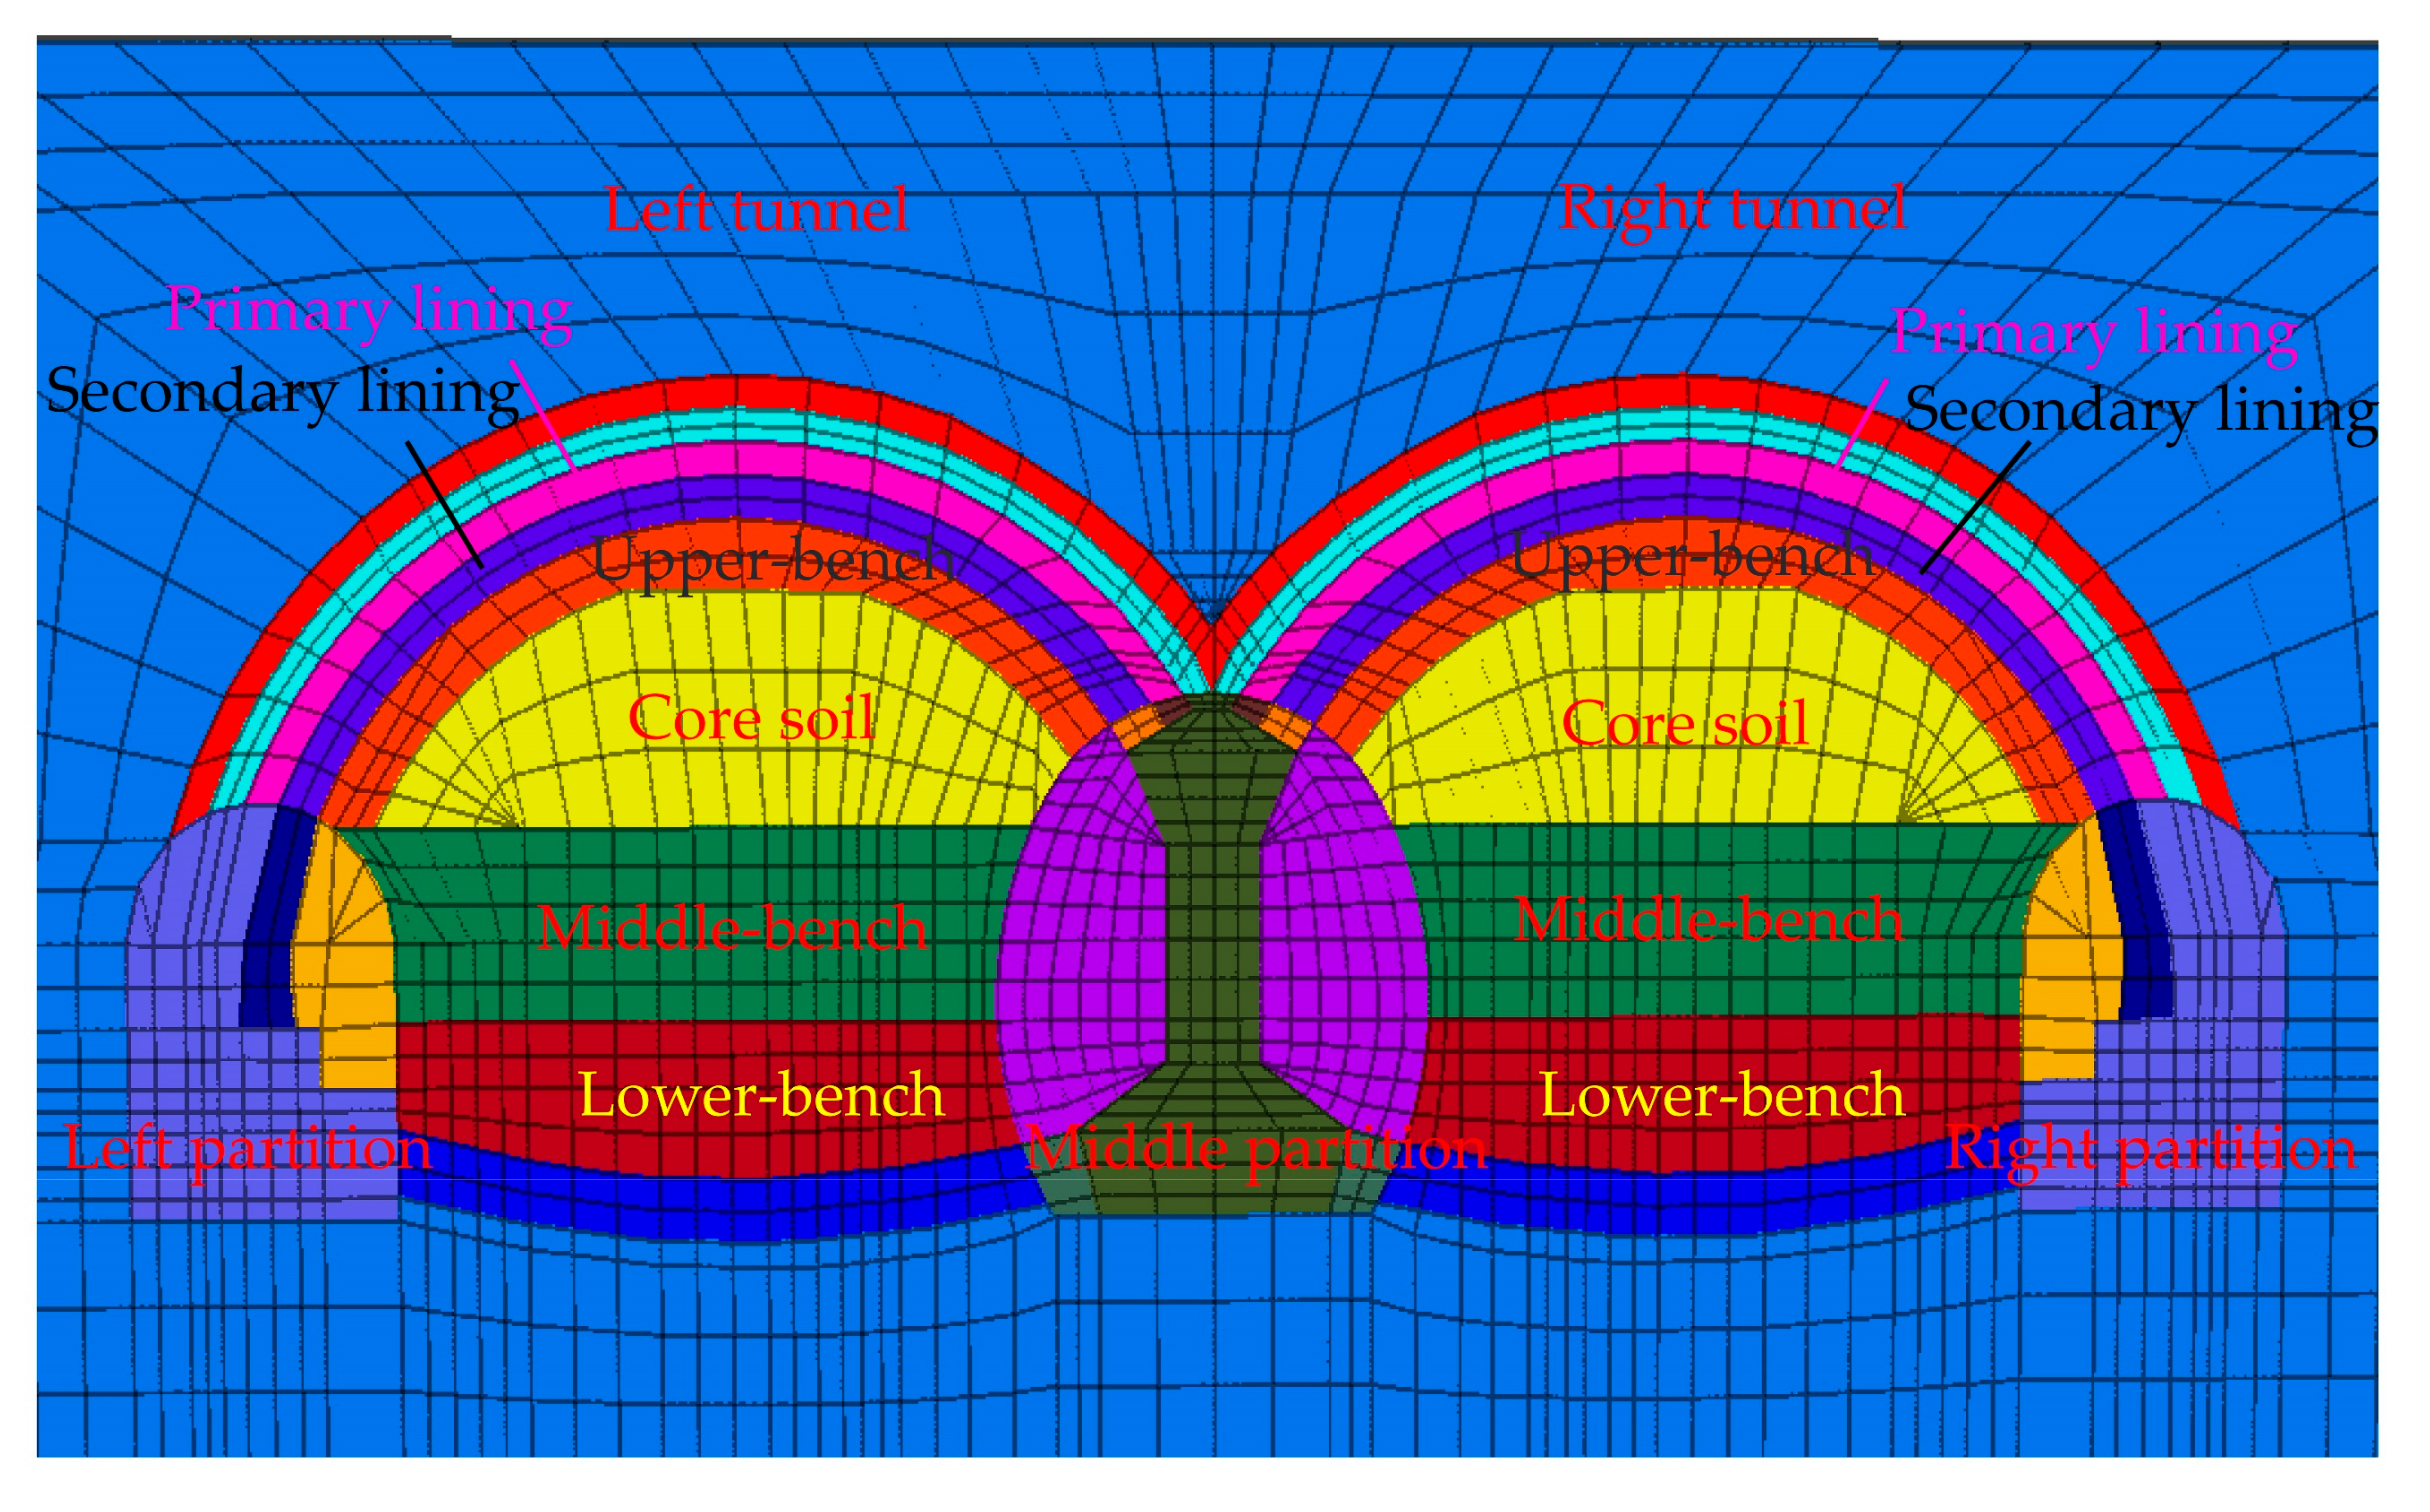
Figure 3 shows the cross-section of the numerical calculation tunnel model. The side pilot tunnel was a straight wall semi-circular arch section, and the middle pilot tunnel was a small radius horseshoe-shaped section. The cross-sectional area of the pilot tunnel was 49.8 m2, and the cross-sectional area of the side pilot tunnel was 26.7 m2, and the two adjacent pilot tunnels were approximately 15 m apart in the horizontal direction. The three-bench reserved core soil method was adopted for the main tunnel, and the excavation section of the single tunnel was 119.3 m2.
The calculation steps in the numerical simulation were based on the on-site construction method and construction process. Before the excavation of the pilot tunnel, the pilot tunnel was supported in advance according to the actual section conditions. The excavation of the pilot tunnel was carried out in the sequence of the middle pilot tunnel, left pilot tunnel and right pilot tunnel. The staggering distance between the middle pilot tunnel and the left pilot tunnel, and the left pilot tunnel and the right pilot tunnel, was 20 m. Before the excavation of the main tunnel, the long pipe shed at the portal was arranged first, and the long pipe shed and small conduit of the tunnel body were arranged during the excavation. The excavation of the main tunnel was carried out in the order of the left main tunnel first and then the right main tunnel; that is, the non-biased side was excavated first and then the biased side.
To reflect the real contact relationship between the partition wall and surrounding rock to the greatest extent, the contact surface between them was considered in this model. The shape and structure of the contact surface were the same as the actual situation. The parameters of the contact surface were calculated according to the empirical formula. The contact surface between the pilot tunnel and the partition wall is shown in Figure 4a. During the excavation of the main tunnel, the lining and inverted arch were simulated by solid elements, and there was also a complex contact relationship with the surrounding rock. When establishing the model, the contact surface was established between the lining and surrounding rock, inverted arch and surrounding rock according to the actual contact situation to reflect the real contact relationship, as shown in Figure 4b,c.

3.2. Material Parameters

According to the investigation report of tunnel surrounding rock in this section, the physical and mechanical parameters of rock, soil and lining in the numerical simulation were determined. In the model, the elastic modulus of the rock and soil in the fault fracture zone was reduced to a certain extent on the basis of the surrounding rock. The rock and soil mass was set as an elastic-plastic constitutive model, and the mechanical behavior conformed to the Mohr-Coulomb failure criterion. The parameters of rock and soil mass and support structure adopted by the double-arch tunnel are shown in Table 1.

4. Numerical Results and Discussion

4.1. Numerical Model Accuracy Verification

In order to confirm that the established numerical model can effectively reflect the actual situation of the site and has certain guiding significance for the actual project, the validity of the established numerical model needs to be verified. The accuracy of the numerical model was verified by comparing the vertical settlement of the left tunnel vault monitoring point 40 m away from the portal with the excavation process and the final vertical settlement of the right main tunnel vault during the excavation of the main tunnel. In the numerical model and field monitoring, the vertical settlement curve of the vault of the left tunnel at the monitoring point 40 m away from the portal during tunnel excavation is shown in Figure 5. It can be seen from the figure that the shape of the vertical settlement curve of the vault at the same position of the numerical model and the field monitoring was similar, and the changing trend was the same. The vertical settlement of the vault of the left tunnel increased with the increase of the excavation depth. When the excavation depth of the left tunnel was 40–50 m, the vertical settlement of the vault increased rapidly, and the vertical deformation of the vault at this position shows a slowly increasing trend.
Subsequently, after the completion of the tunnel excavation, the numerical calculation and field monitoring of the final vertical settlement of the vault of the right tunnel at different distances from the tunnel portal was compared and analyzed, as shown in Figure 6. It can be seen from the figure that at a certain distance from the portal, the simulation results were similar to the monitoring results, and the changing trend was the same. Within the range of 0–90 m from the portal, the vertical settlement of the vault was small. The farther away from the portal, the greater the vertical settlement of the vault. In the numerical calculation, the vertical settlement of the vault varied within 4.09 mm–24.76 mm, and in the field monitoring, the vertical displacement of the vault varied within 3.80 mm–23.3 mm. Comparing the simulated value with the monitored value, it can be found that the monitored value basically fluctuates up and down on both sides of the simulated value, and the two values were similar. In the range of 90–110 m from the portal, due to the existence of fault fracture zone here, the simulation value and monitoring value of vertical settlement of the vault were large, and showed a trend of first increasing and then decreasing. The maximum simulation value reached 30.67 mm and the maximum monitoring value reached 29.5 mm. In this area, there was little difference between the simulated value and the monitored value, and the changing trend was the same. Within the range of 110–140 m from the portal, with the increase of the distance from the portal, the vertical settlement of the vault gradually decreased, and the variation range of vertical displacement was 12.07 mm–21.24 mm (simulated value) and 8.50 mm–14.80 mm (monitored value). The maximum error between the simulated value and the monitored value was 6.44 mm, the minimum error was 0.03 mm and the average error was 1.95 mm. In summary, the three-dimensional numerical model has a good simulation effect.

4.2. Analysis of Numerical Simulation Results of Pilot Tunnel Excavation

4.2.1. Deformation Analysis of Surface and Surrounding Rock

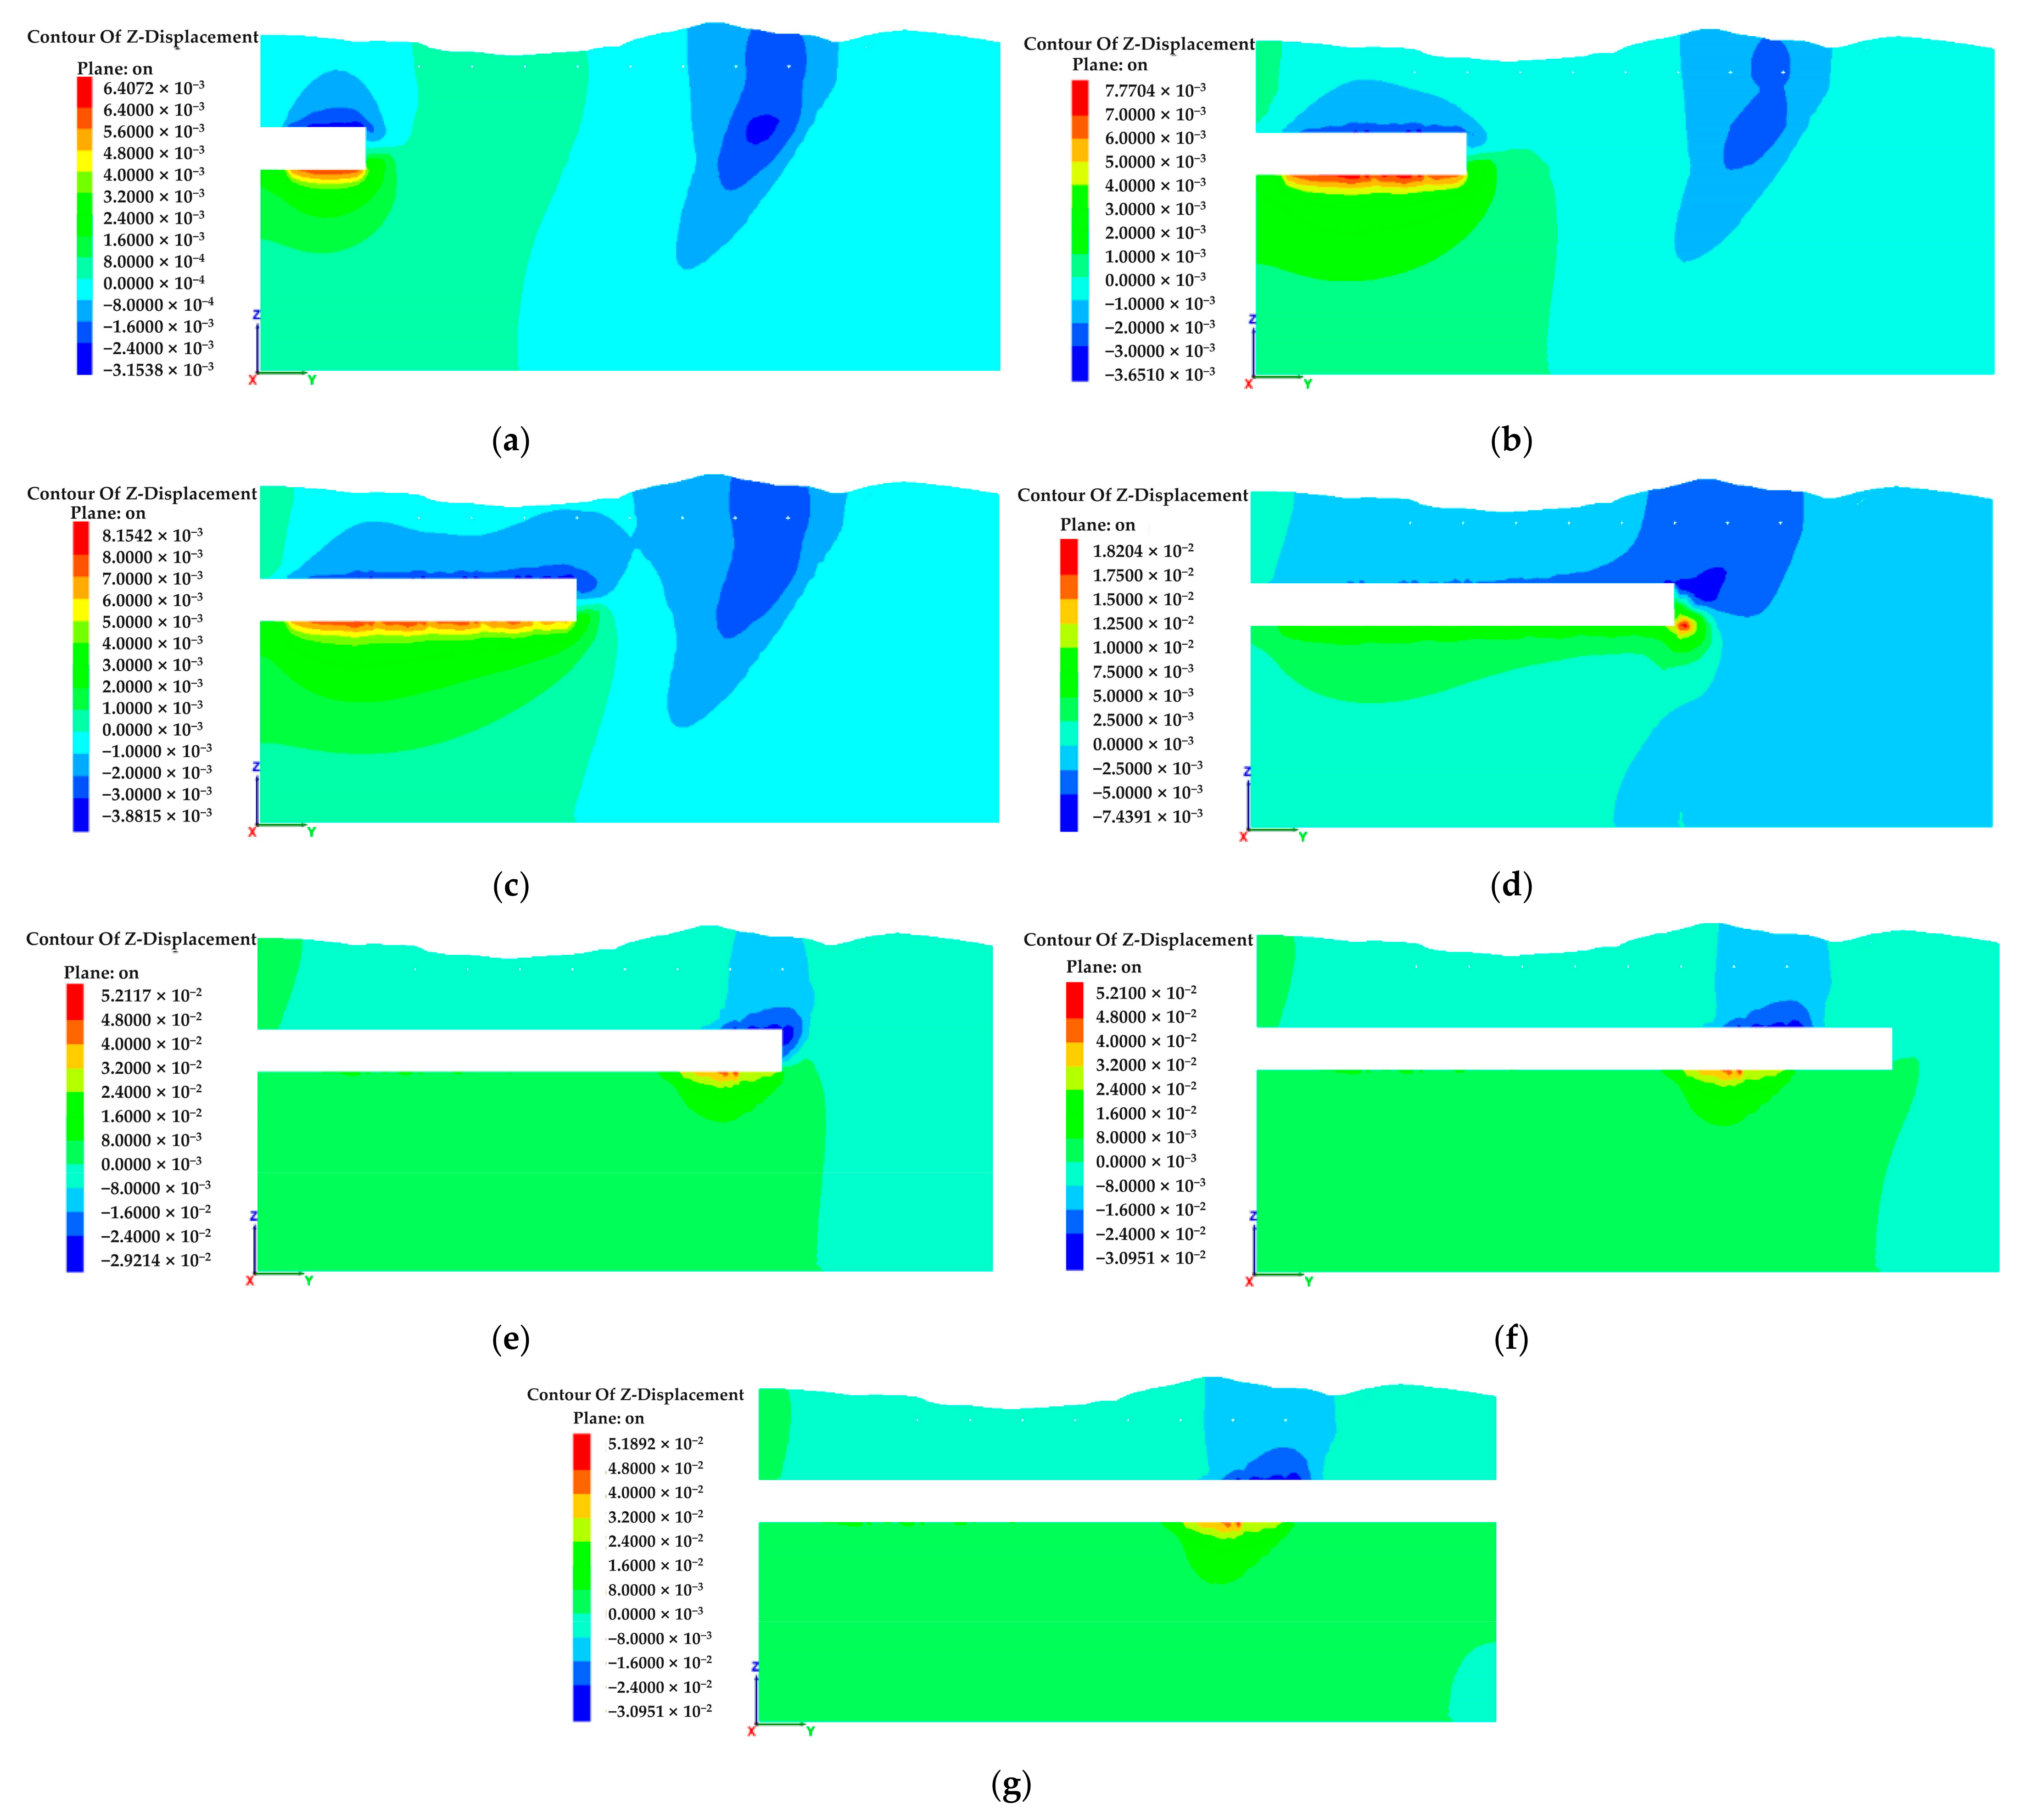
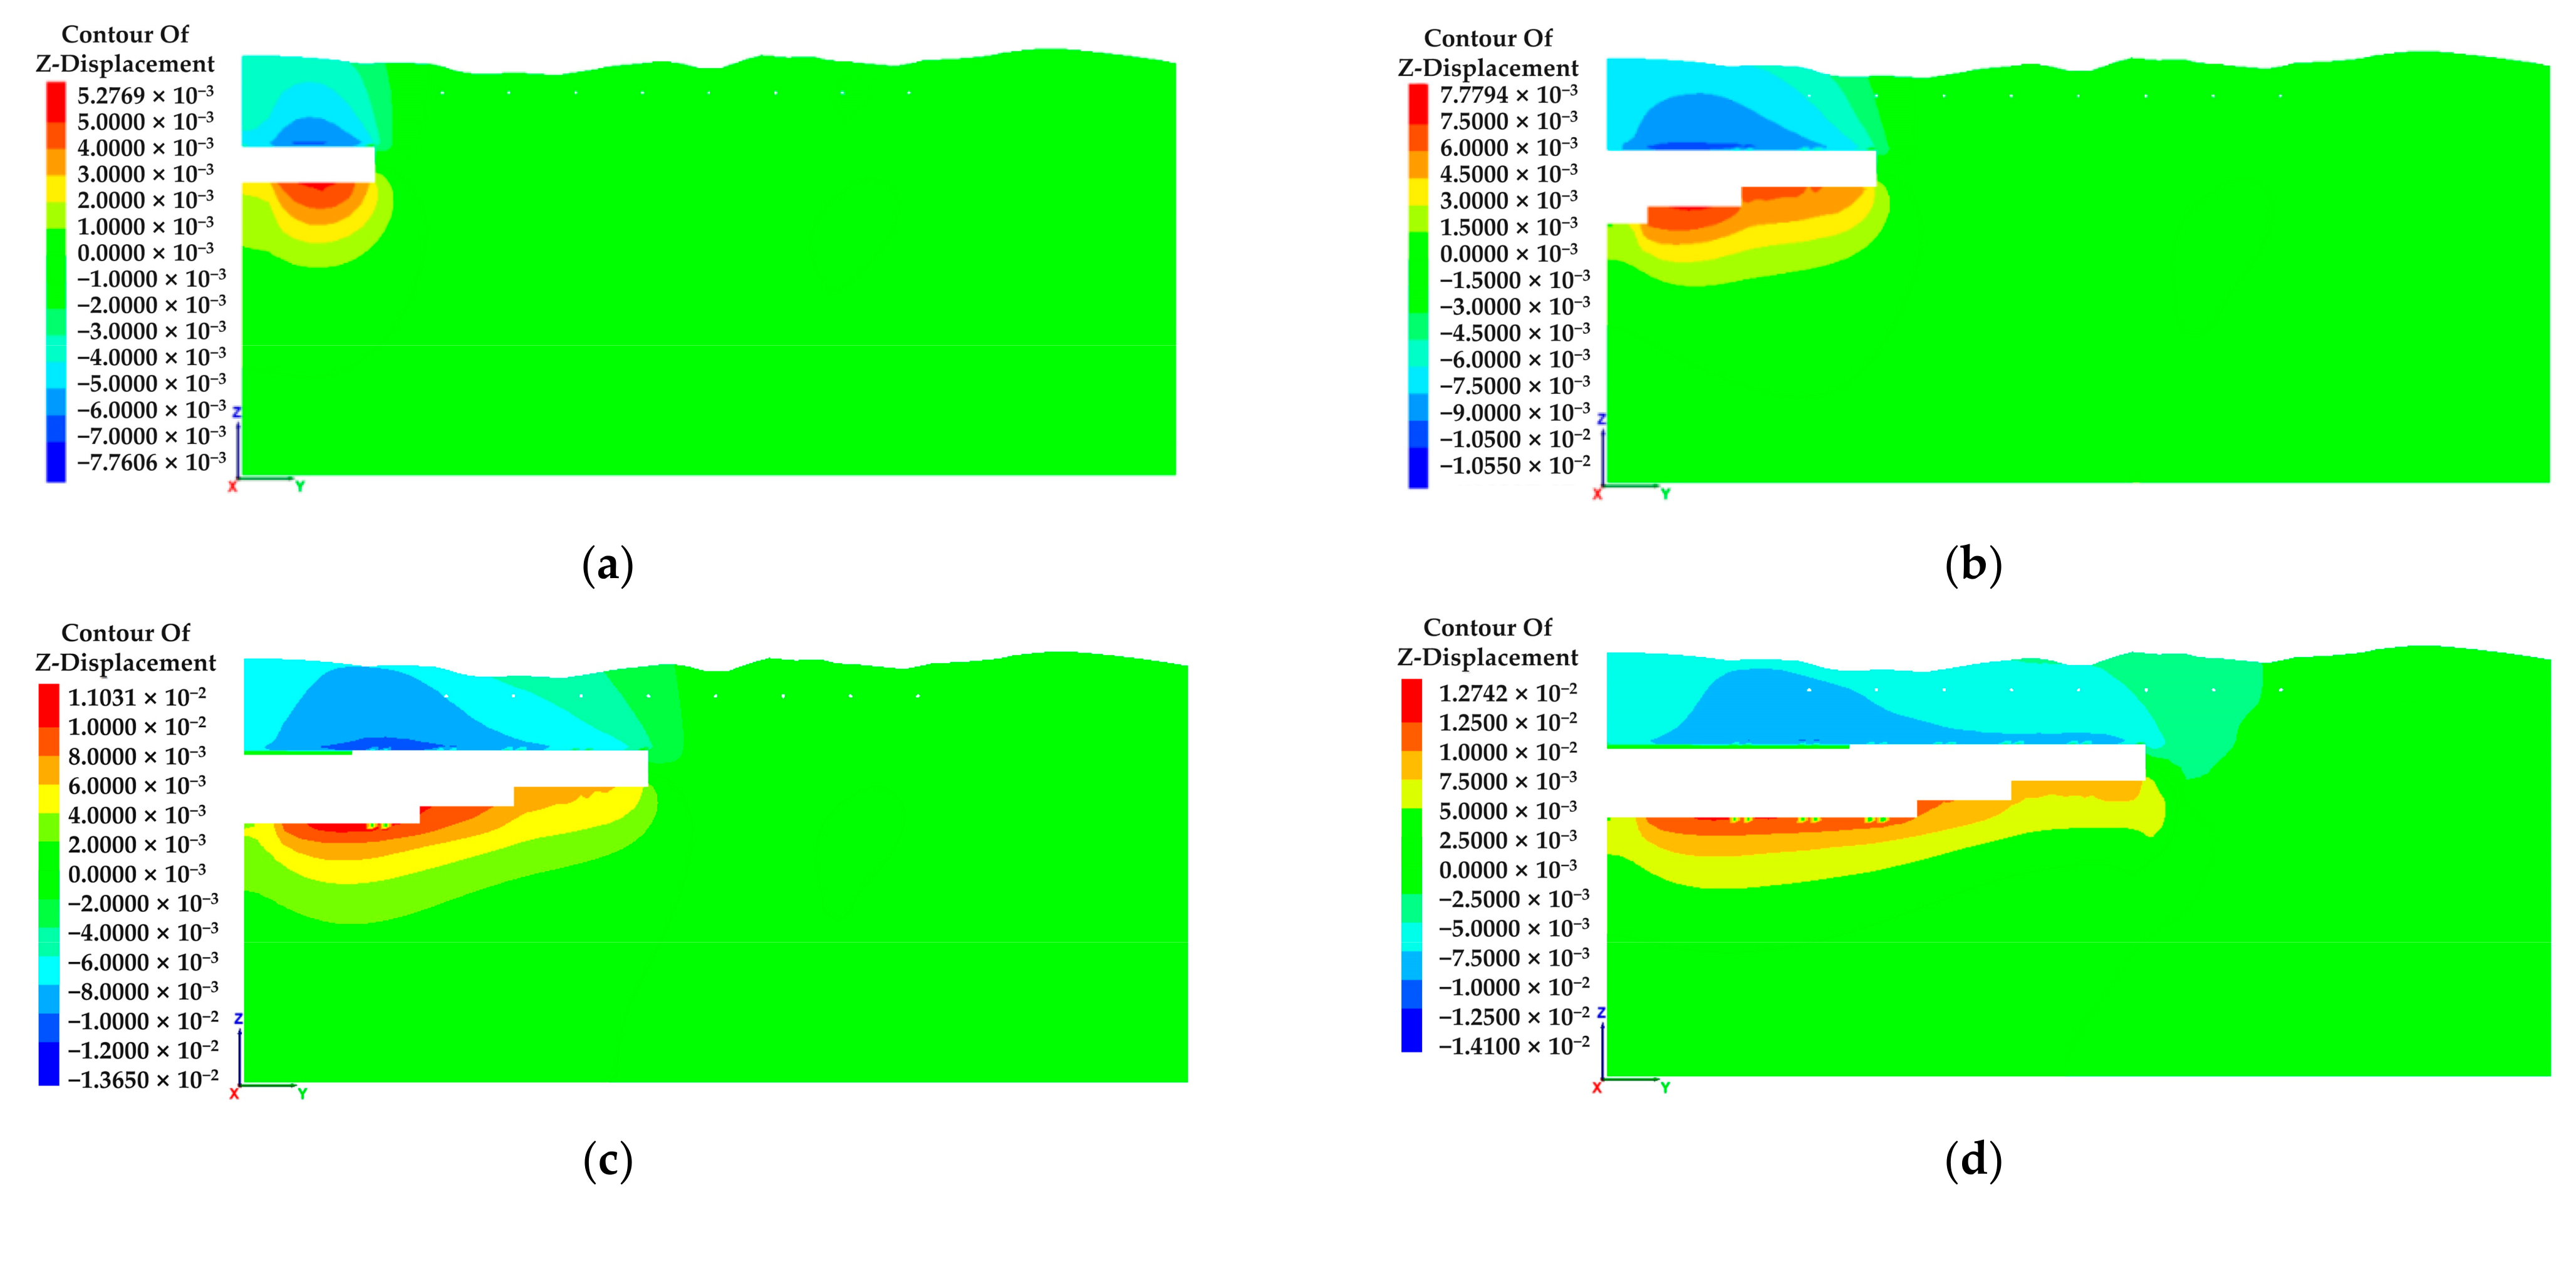
Figure 7 shows the vertical deformation of the surface and surrounding rock on the central axis section of the middle pilot tunnel during the excavation of the pilot tunnel. The Y-direction was the direction of tunnel excavation, and L was the excavation distance of the middle pilot tunnel. Figure 7a–g respectively shows the vertical deformation of the surface and surrounding rock when the middle pilot tunnel was excavated to 20 m, 40 m, 60 m, 80 m, 100 m, 120 m and 140 m. After the excavation of the middle pilot tunnel, the surrounding rock had been deformed to varying degrees, the tunnel vault had subsided, and the arch bottom had uplifted. In the direction of excavation, the surface had different degrees of settlement deformation, and the surface above the tunnel excavation surface and near the fault fracture zone had large settlement deformation. With the increase of the excavation depth of the middle pilot tunnel, the maximum vertical deformation of the surface and surrounding rock continued to increase. The maximum settlement in Figure 7a–g were 3.15 mm, 3.65 mm, 3.88 mm, 7.44 mm, 29.2 mm, 31.0 mm and 31.0 mm, respectively. When the middle pilot tunnel was excavated to the distribution section of the fault fracture zone (Y = 100 m), the vertical deformation of the surface and surrounding rock increased suddenly, and the settlement of the vault increased obviously. Therefore, special attention should be paid to the change of rock and soil strain during construction in this area.
Figure 8a–e shows the horizontal deformation of the surface and surrounding rock in the cross-section at Y = 0 m, 40 m, 60 m, 80 m and 100 m after the completion of pilot tunnel excavation. The rock and soil mass around the three pilot tunnels had different degrees of horizontal displacement, which showed that the rock and soil mass at the arch waist of the pilot tunnel tended to move in the middle of the pilot tunnel. The horizontal deformation of rock and soil around the middle pilot tunnel was large, and the horizontal deformation of rock and soil around the side pilot tunnel was small. Due to the bias phenomenon caused by terrain and the influence of the excavation sequence of the pilot tunnel, the horizontal displacement on the right side of the pilot tunnel (the displacement in the negative direction of the X-axis in the figure) was generally greater than that on the left side. Therefore, in the process of pilot tunnel excavation, it was necessary to pay special attention to the change of the horizontal displacement of the surrounding rock on the middle pilot tunnel and the right side of the side pilot tunnel. Observing the section diagrams at different locations after the completion of the pilot tunnel excavation, it can be found that as the excavation depth increased, the horizontal displacement of the rock and soil around the pilot tunnel continued to increase. The maximum horizontal displacements of the surrounding rocks at the five cross-sections were, respectively, 6.27 mm, 6.74 mm, 6.96 mm, 10.2 mm and 29.0 mm; the horizontal displacement of the rock and soil around the pilot tunnel increased significantly near the fault fracture zone.
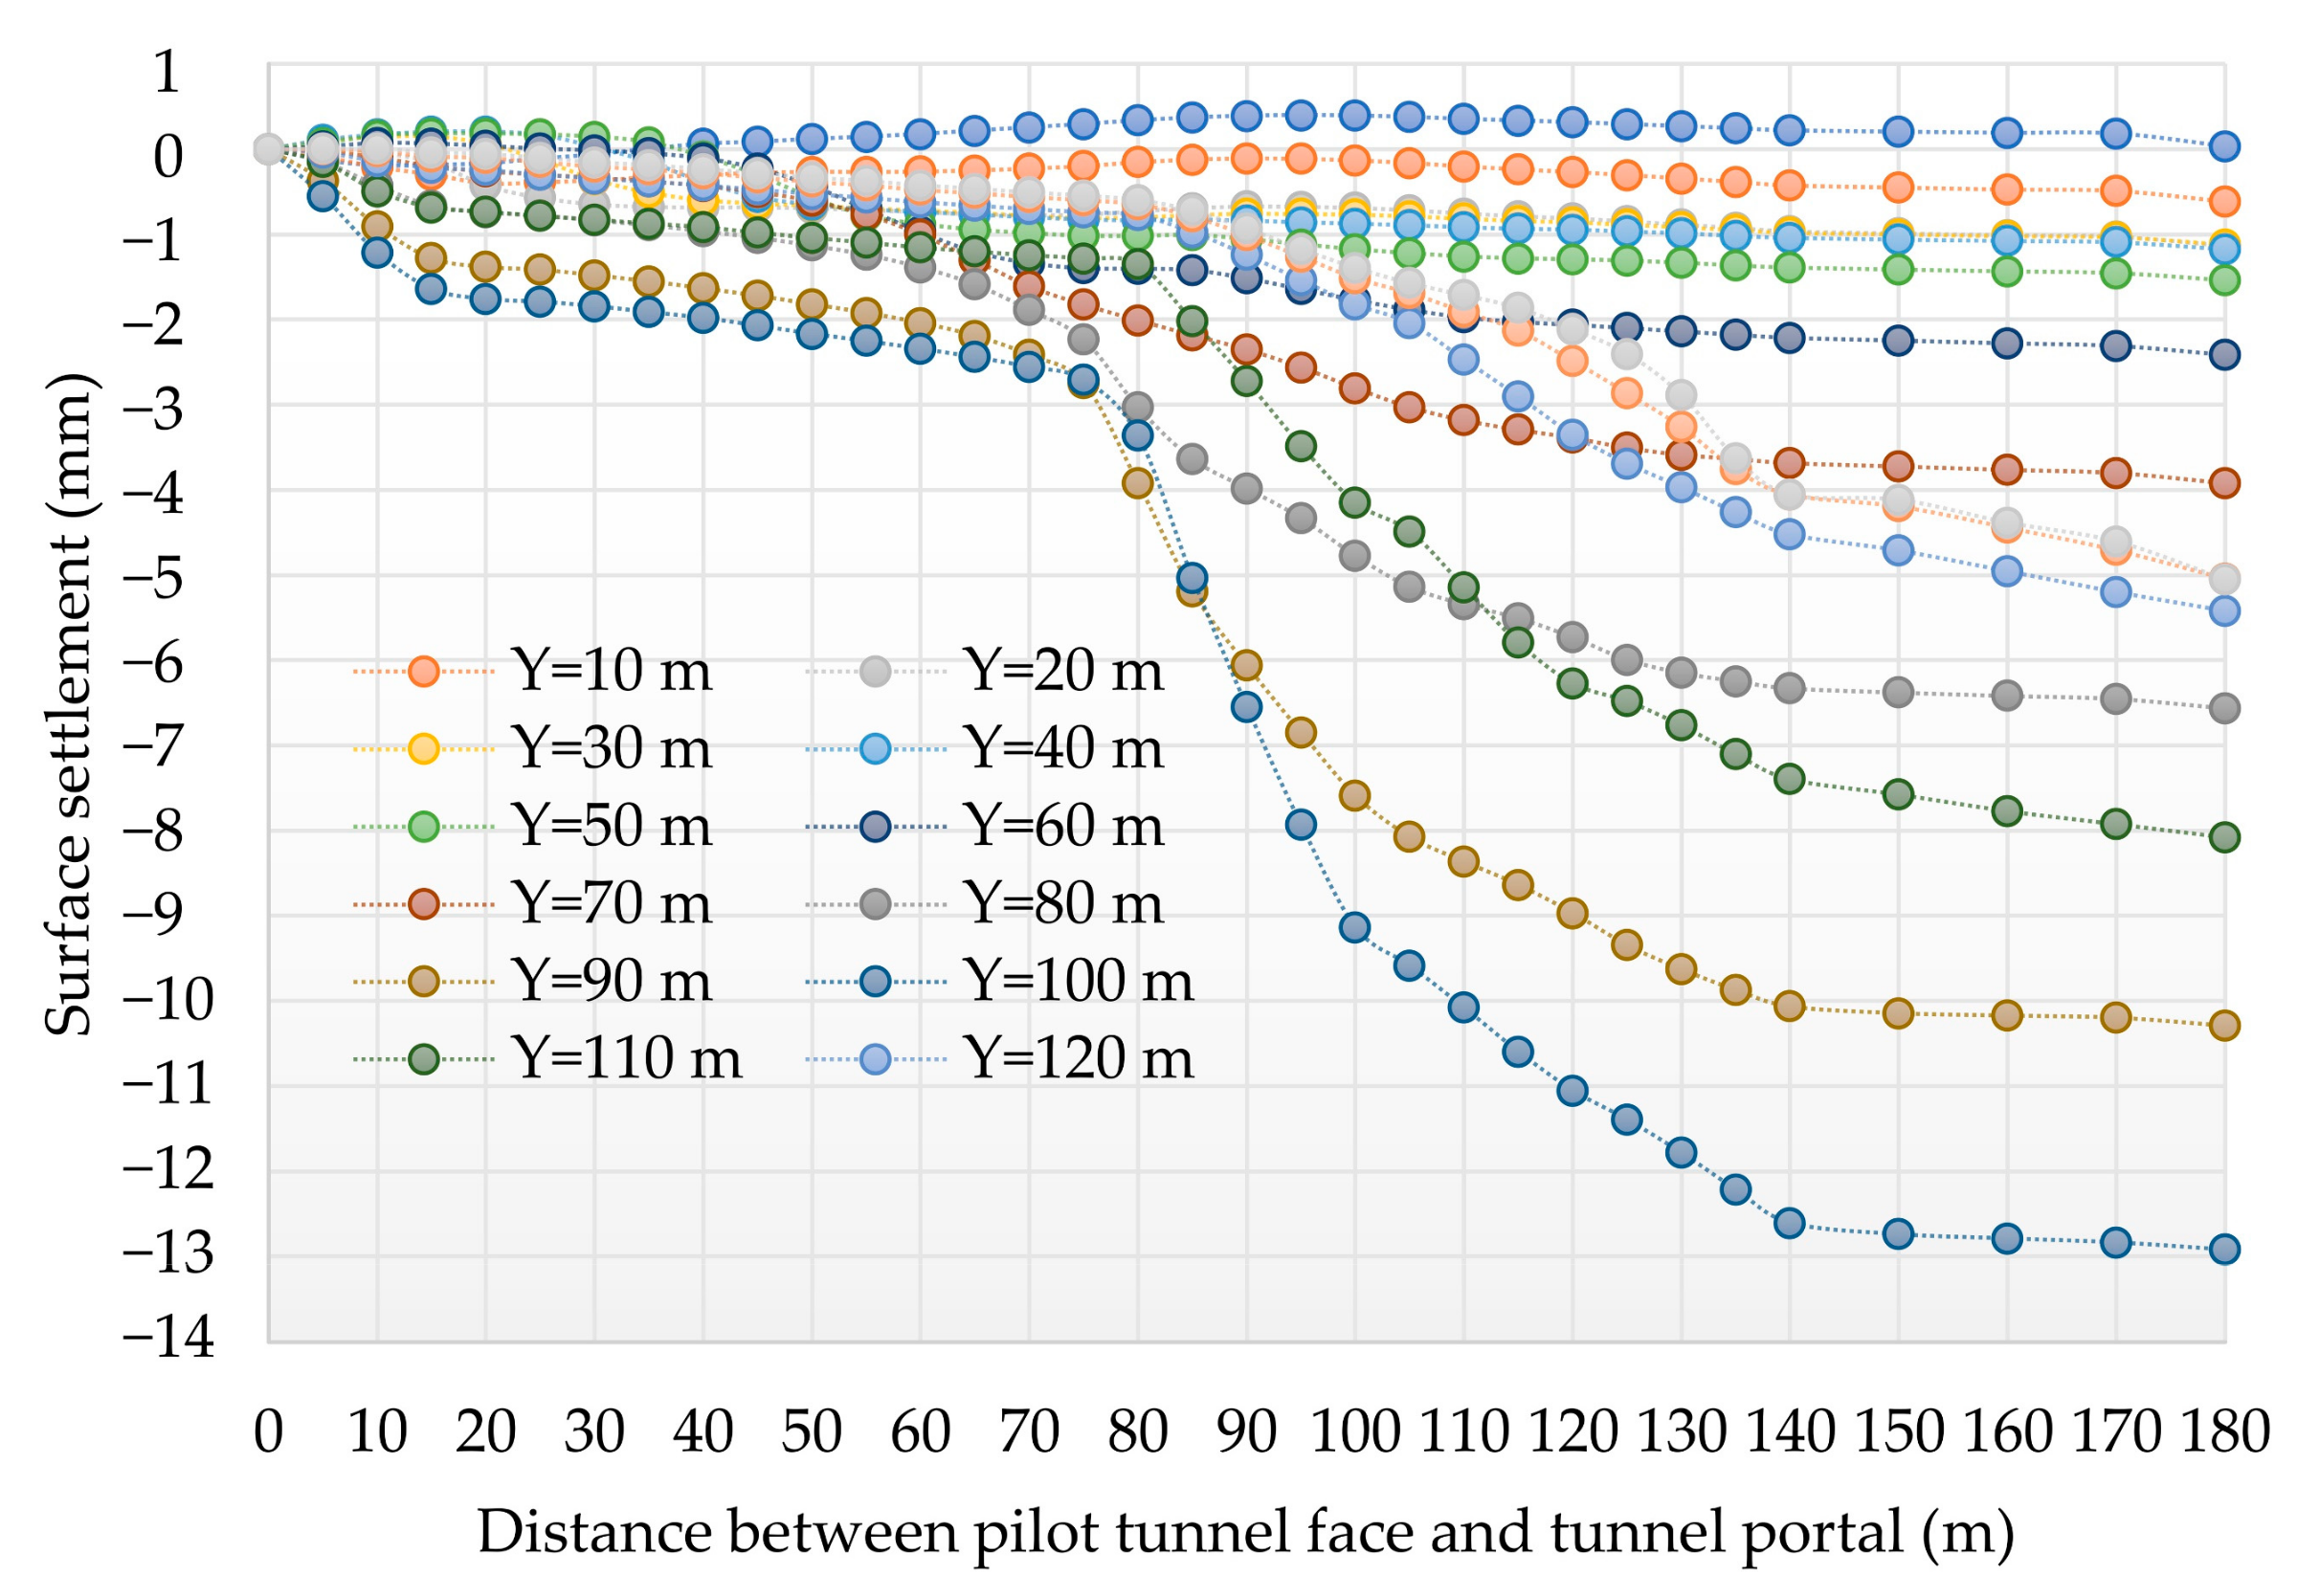
Figure 9 shows the surface settlement during the pilot tunnel excavation, and the abscissa was the pilot tunnel excavation process expressed by the excavation distance. The excavation of the three pilot tunnels was carried out in sequence, and the excavation interval was 20 m, that was, after the excavation of the middle pilot tunnel (140 m) was completed, another 40 m side pilot tunnel needed to be excavated. Therefore, the abscissa 0–140 m indicated the excavation of the middle pilot tunnel, and 140–180 m represented the excavation time of the remaining side pilot tunnel. Y = 0 m, 10 m … 140 m indicated the distance between the surface settlement monitoring point above the central axis of the middle pilot tunnel and the tunnel portal. As the excavation of the pilot tunnel continued, the surface settlements at various locations continued to increase. When the excavation surface advanced to about 20 m in front of the monitoring point, the settlement increased sharply, indicating that the rock and soil within 20 m behind the excavation surface was greatly disturbed by the excavation. Comparing the final settlement values of various locations, it can be found that the surface settlement value of the portal section was small, and the surface settlement value of the section away from the portal was large. Since the surface monitoring points corresponding to Y = 90 m and Y = 100 m were located near the fault fracture zone, the strength of the surrounding rock was low, so their final settlement was greater than the surrounding surface settlement.

4.2.2. Lining Deformation Analysis

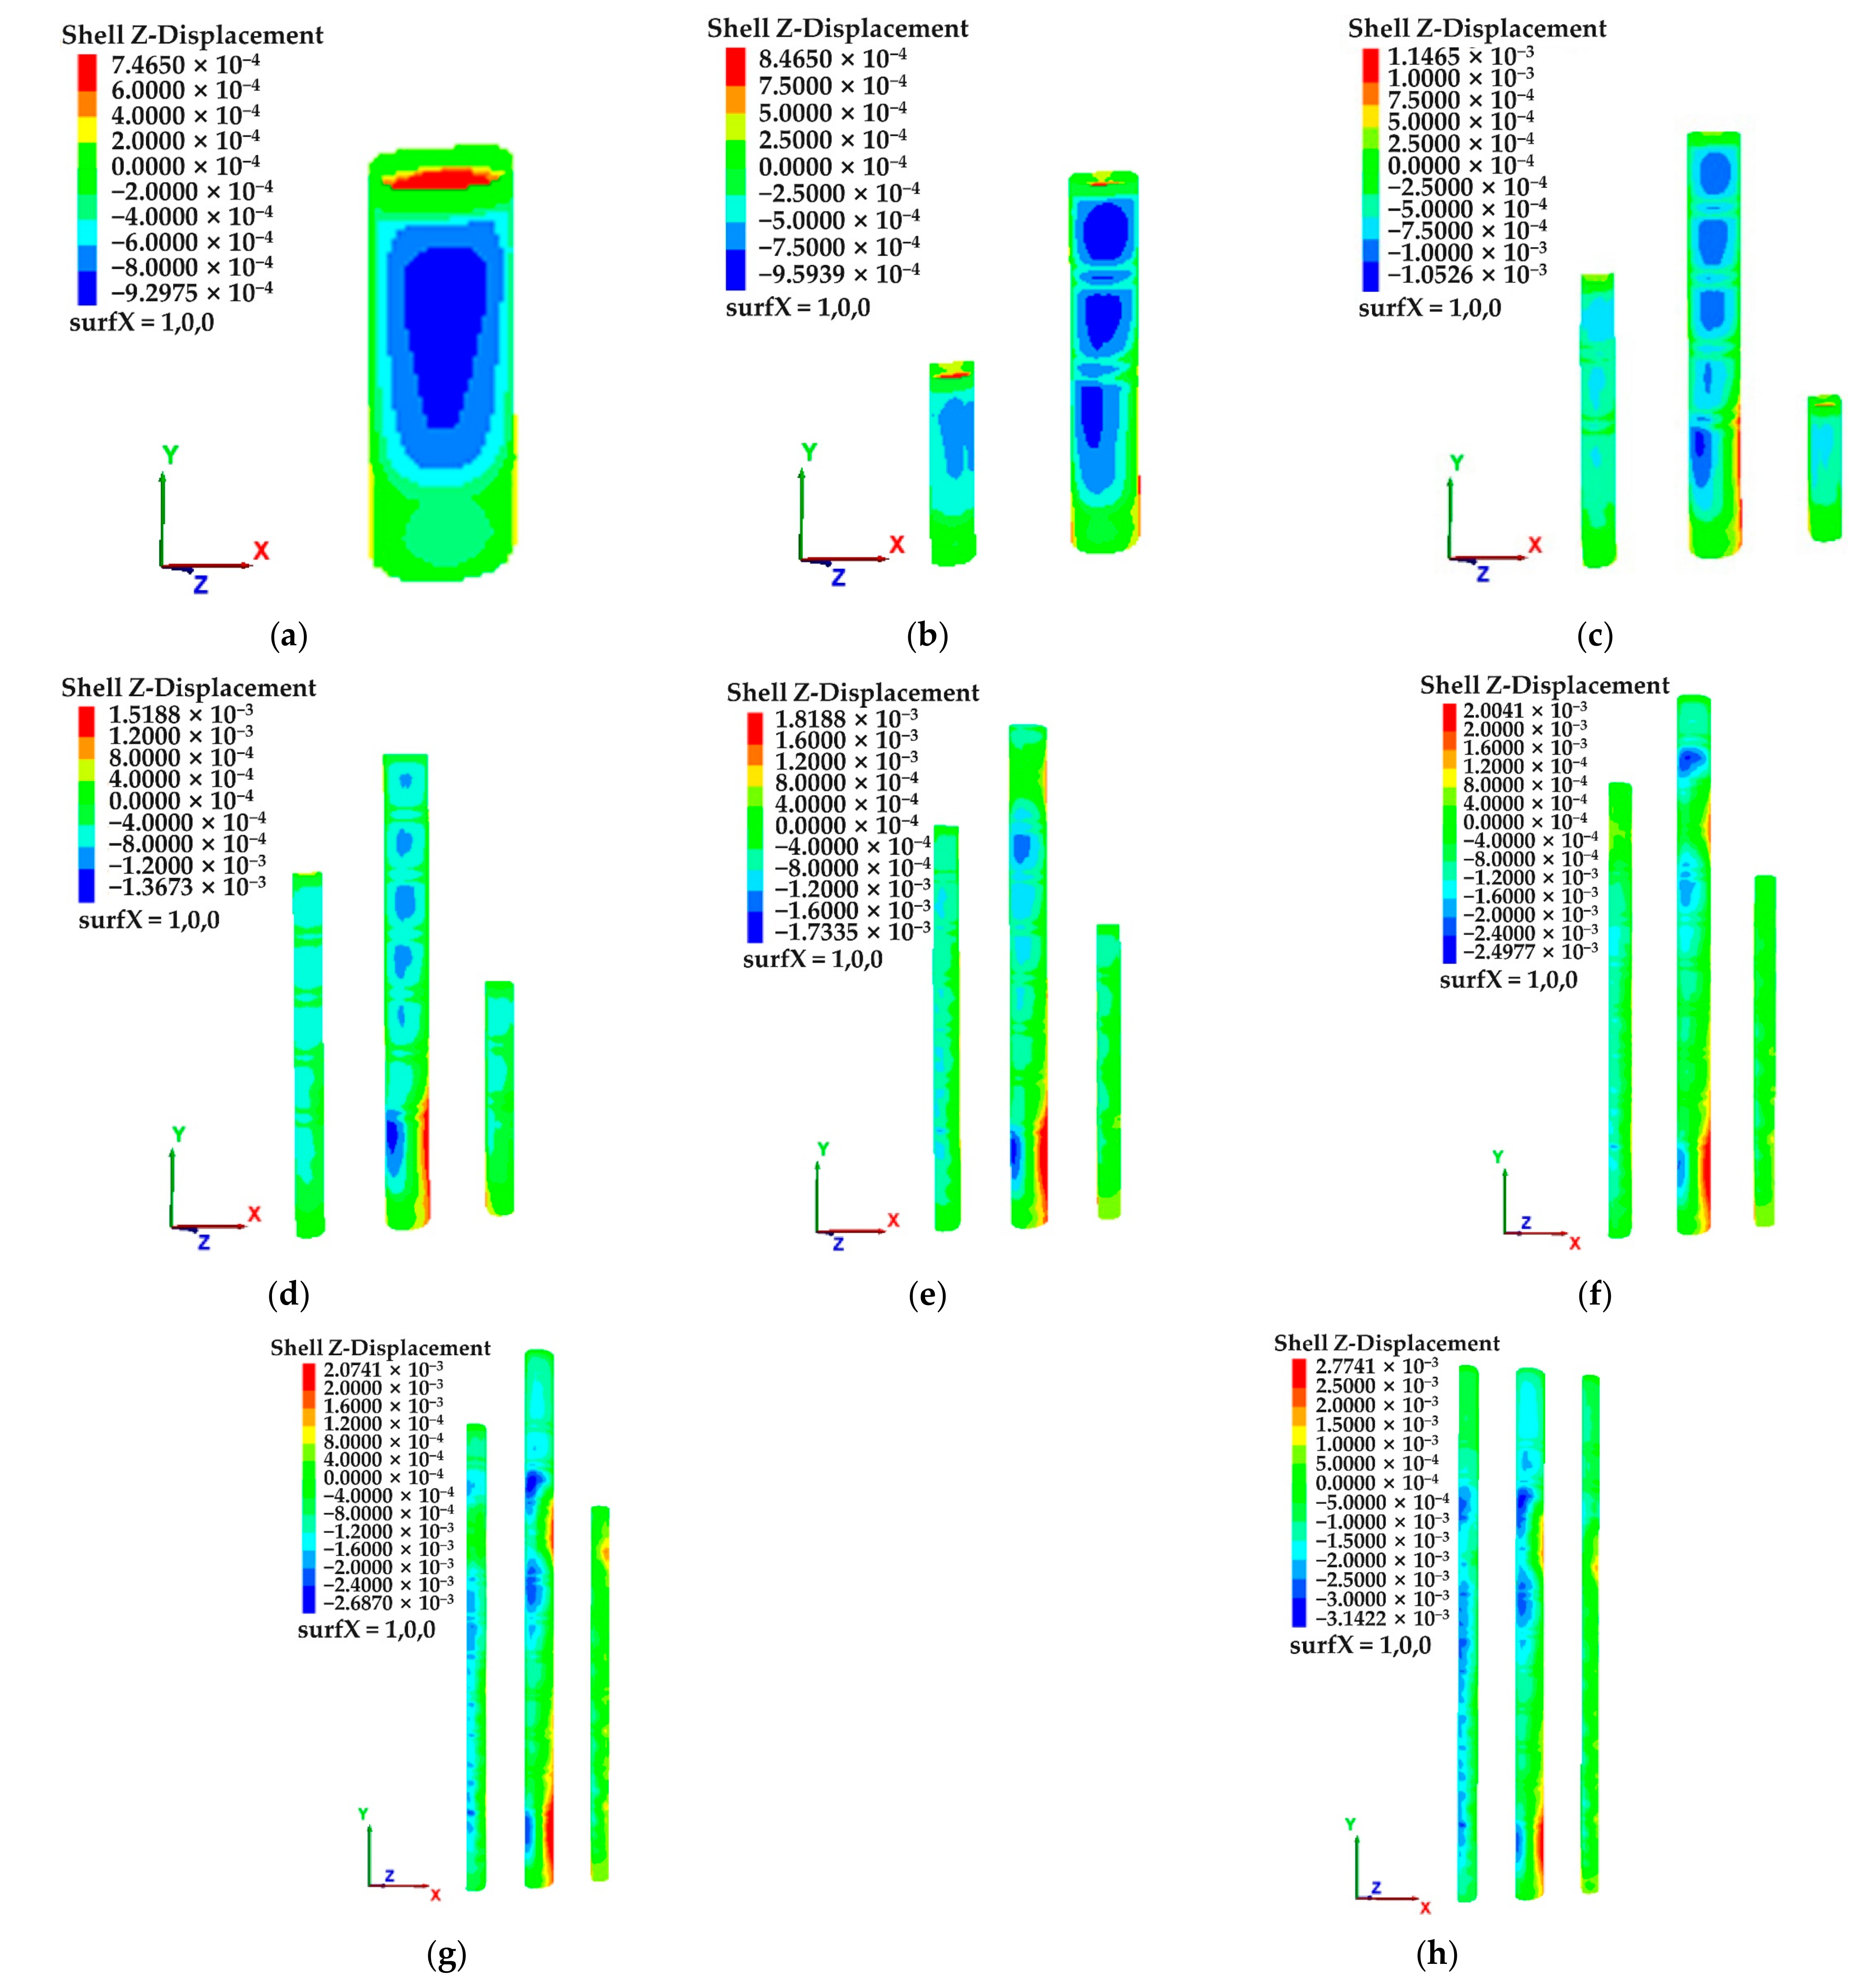
Figure 10a–h show the vertical deformation of the lining when the middle pilot tunnel was excavated to 20 m, 40 m, 60 m, 80 m, 100 m, 120 m and 140 m, and when all the pilot tunnels were excavated. The pilot tunnel lining structure was deformed to a certain extent under the surrounding rock pressure formed by excavation and unloading, and the lining at the vault was mainly settlement deformation. The vault settlement of the middle pilot tunnel was significantly greater than that of the side pilot tunnel, and the vault settlement of the left pilot tunnel was significantly greater than that of the right pilot tunnel. Therefore, it was necessary to pay more attention to the changes in the vertical deformation of the lining structure during the construction of the main tunnel excavated first. The lining structure on the right side of the middle pilot tunnel generally had rebound uplift, which may be related to the tunnel bias pressure. Considering the small rebound value, it would mostly not affect the stability of the lining structure. Comparing the vertical deformation of the lining structure when the pilot tunnel was excavated to different positions, with the continuous advancement of the pilot tunnel excavation process, the vertical deformation of the lining continued to increase, and the maximum vertical deformation of the lining at eight locations was 0.93 mm, 0.96 mm, 1.05 mm, 1.37 mm, 1.73 mm, 2.50 mm, 2.69 mm and 3.14 mm in turn. The permissible deformation of the lining was 45 mm. In general, the vertical deformation of the lining caused by the excavation of the pilot tunnel was small, indicating that the design of the lining structure was reasonable, which was beneficial to ensure the safe and smooth construction of the pilot tunnel of the shallow buried tunnel.
Figure 11 shows the vault settlement of the middle pilot tunnel during the pilot tunnel excavation. The abscissa was the excavation process of the pilot tunnel expressed by the excavation distance, and the ordinate was the vault settlement of the middle pilot tunnel. Since the sequence of pilot tunnel excavation was middle pilot tunnel—left pilot tunnel—right pilot tunnel, and the excavation interval was 20 m, that was, 40 m side pilot tunnel still needed to be excavated after the excavation of middle pilot tunnel (140 m), so the abscissa 0–140 m represented the excavation time of middle pilot tunnel and 140–180 m represented the excavation time of remaining side pilot tunnel. Y = 0 m, 10 m … 140 m indicated the distance between the vault monitoring point on the central axis of the middle pilot tunnel and the tunnel portal. The settlement of the vault of the middle pilot tunnel continued to increase with the excavation process of the pilot tunnel. When the pilot tunnel was excavated near the fault fracture zone (Y = 100 m), the vault settlement was the largest, which was 25.6 mm. Observing the change of vault settlement value at each position, the vault settlement increased sharply about 20 m in front of the excavation face, indicating that the rock and soil within 20 m behind the excavation face were greatly disturbed by the excavation. In the process of pilot tunnel excavation, special attention should be paid to its stress-strain state to prevent collapse, surge and other accidents. The vault settlement of the left and right pilot tunnels had the same variation law as that of the middle pilot tunnel.
Figure 12 shows the vault settlement curve of three pilot tunnels after the completion of pilot tunnel excavation. The abscissa was the distance between the upper bench face and the portal during the excavation of each pilot tunnel. With the increase of excavation footage, the vault settlement of the three pilot tunnels increased first and then decreased. The settlement and defamation laws of the vault were different at different positions. Within the range of 0–50 m, the vault settlement of the left pilot tunnel was significantly greater than that of the middle pilot tunnel and the right pilot tunnel. Within the range of 50–80 m, the vault settlement of the right pilot tunnel was greater than that of the middle pilot tunnel and the left pilot tunnel. In the range of 80–140 m, the vault settlement of the middle pilot tunnel was significantly greater than that of the left pilot tunnel and the right pilot tunnel. The maximum vault settlement of the three pilot tunnels was obtained near the range of 90–100 m, which was located in the fault fracture zone. The maximum vault settlement of the middle pilot tunnel was significantly greater than that of the two side pilot tunnels, and the maximum vault settlement of the left pilot tunnel and the right pilot tunnel were similar.

4.2.3. Deformation Analysis of Supporting Structure

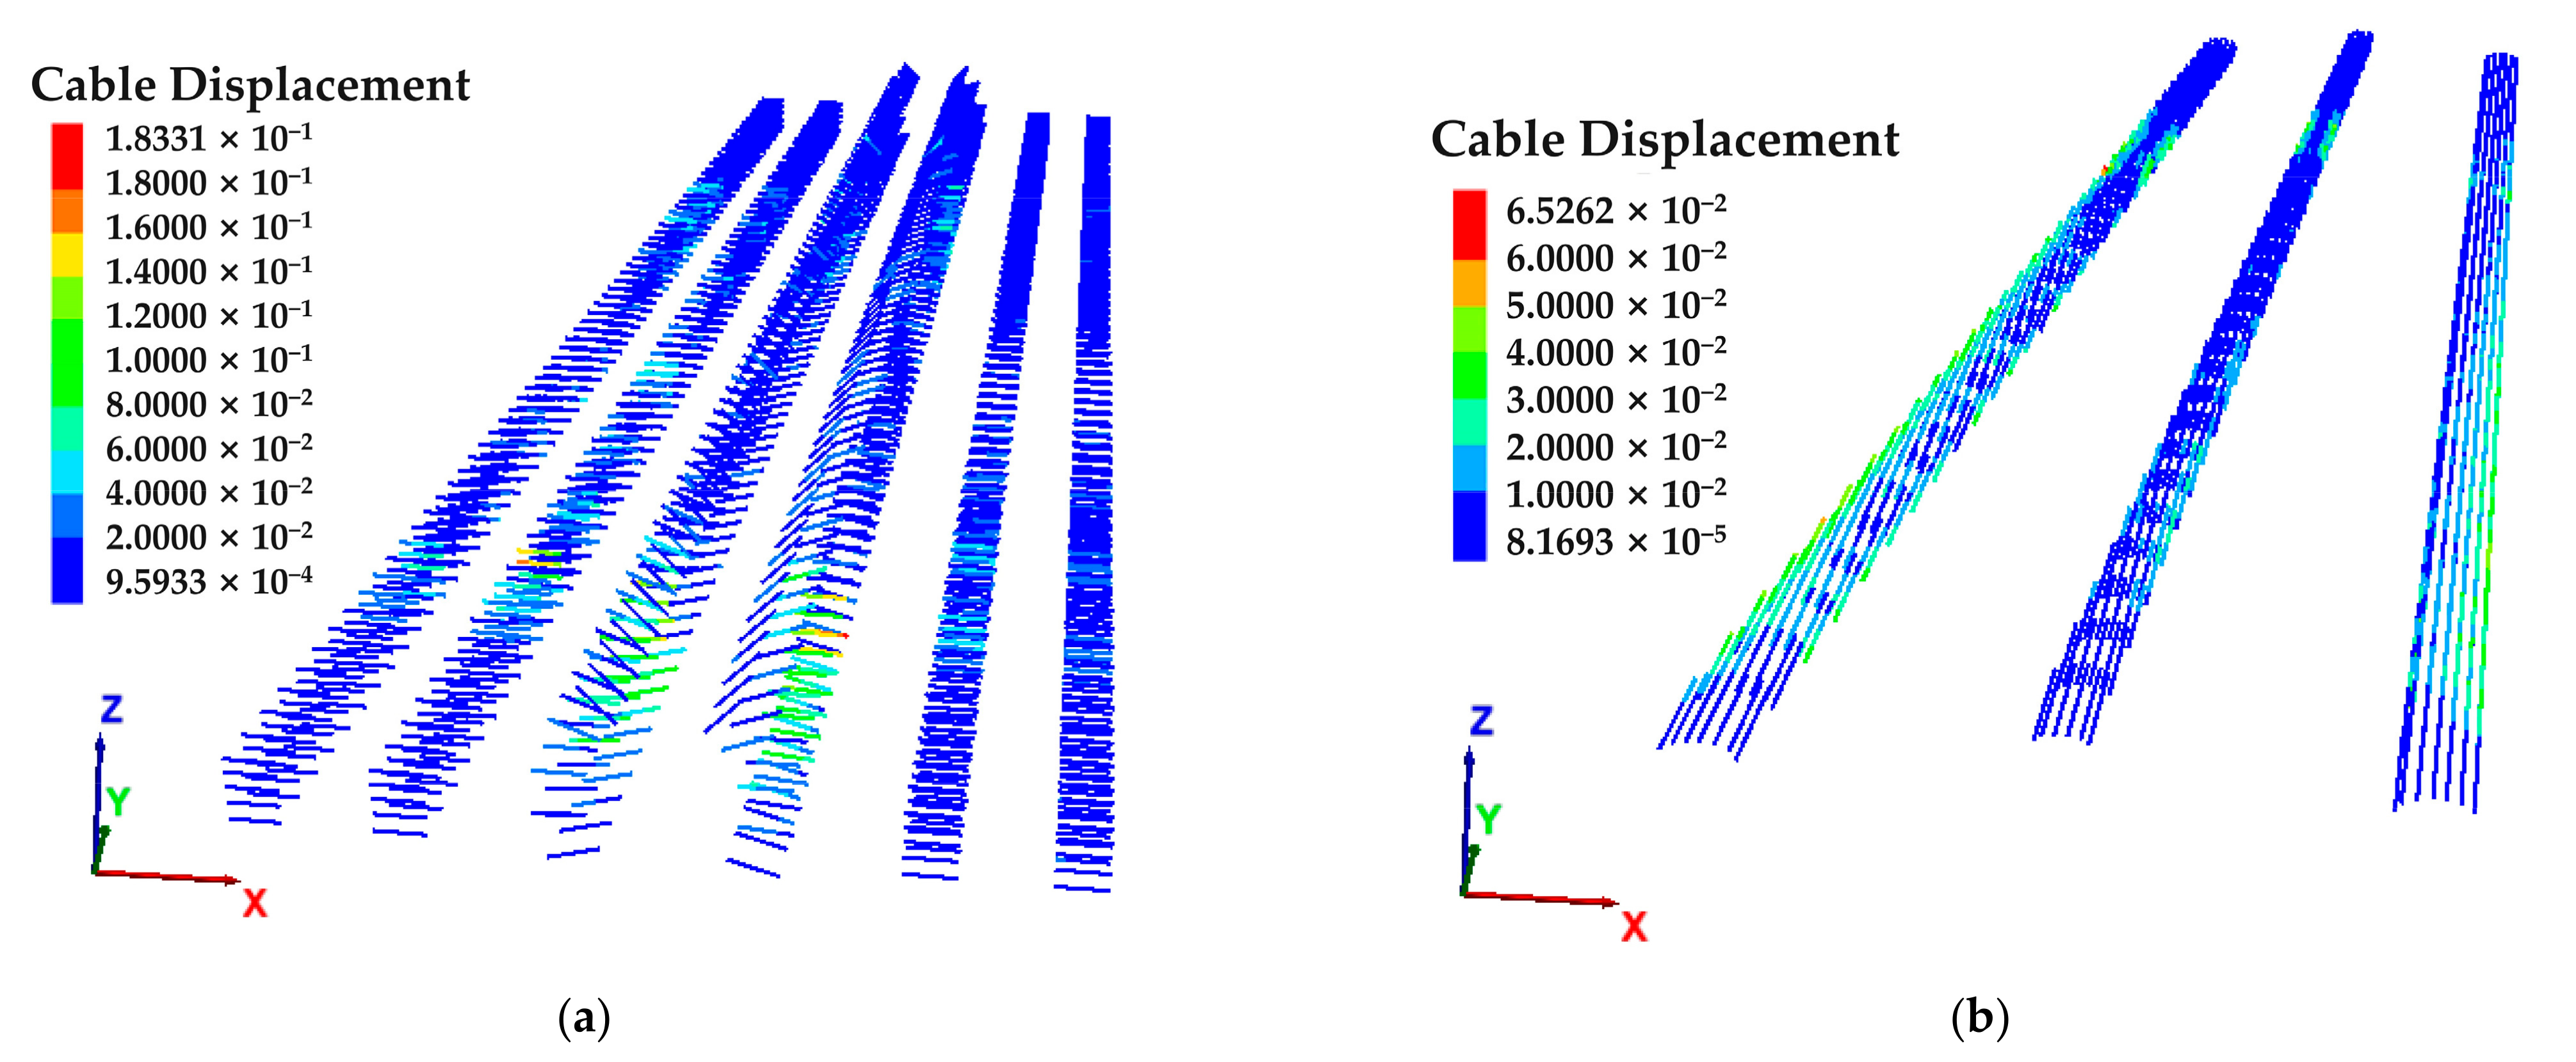
Figure 13 shows the deformation of the normal supporting anchor bolt and the advanced supporting pipe after pilot tunnel excavation. Due to the influence of pilot tunnel excavation unloading, after the surrounding rock stress was released, part of the surrounding rock pressure directly acted on the anchor bolt connected with it, resulting in varying degrees of deformation of the anchor bolt. On the whole, the deformation of the anchor bolt was small, and the magnitude was basically 10−4 m. Within 30 m of the middle pilot tunnel and the left pilot tunnel, there were some bolts with large deformation locally, with a maximum deformation of 183 mm. The bolts may have reached the yield state or even been damaged. The deformation of the advance support conduit was small, and the maximum deformation was located on both sides of the left and right pilot tunnels, with the maximum deformation of 30 mm. The permissible deformation of the advance support conduit was 50 mm. Therefore, higher design standards and parameters should be used to improve the yield strength of the bolt when the bolt was used to strengthen the surrounding rock at the portal section of the pilot tunnel.

4.3. Analysis of Numerical Simulation Results of Main Tunnel Excavation

After the pilot tunnel excavation, the main tunnel excavation shall be carried out after the surface and surrounding rock deformation were stable. The main tunnel was excavated by the three-bench reserved core soil method. Before the formal excavation, the long pipe shed at the portal was arranged first. During the excavation, the long pipe shed and small conduit of the tunnel body were arranged. The excavation of the main tunnel was carried out in the order of excavating the left main tunnel first and then the right main tunnel. The staggering distance between the upper bench face of the left main tunnel and the right main tunnel was 30 m, and the distance between the upper bench and the middle bench, and the middle bench and the lower bench, was 20 m and 15 m, respectively, and the secondary lining of the main tunnel lagged behind the inverted arch by 10 m.

4.3.1. Deformation Analysis of Surface and Surrounding Rock

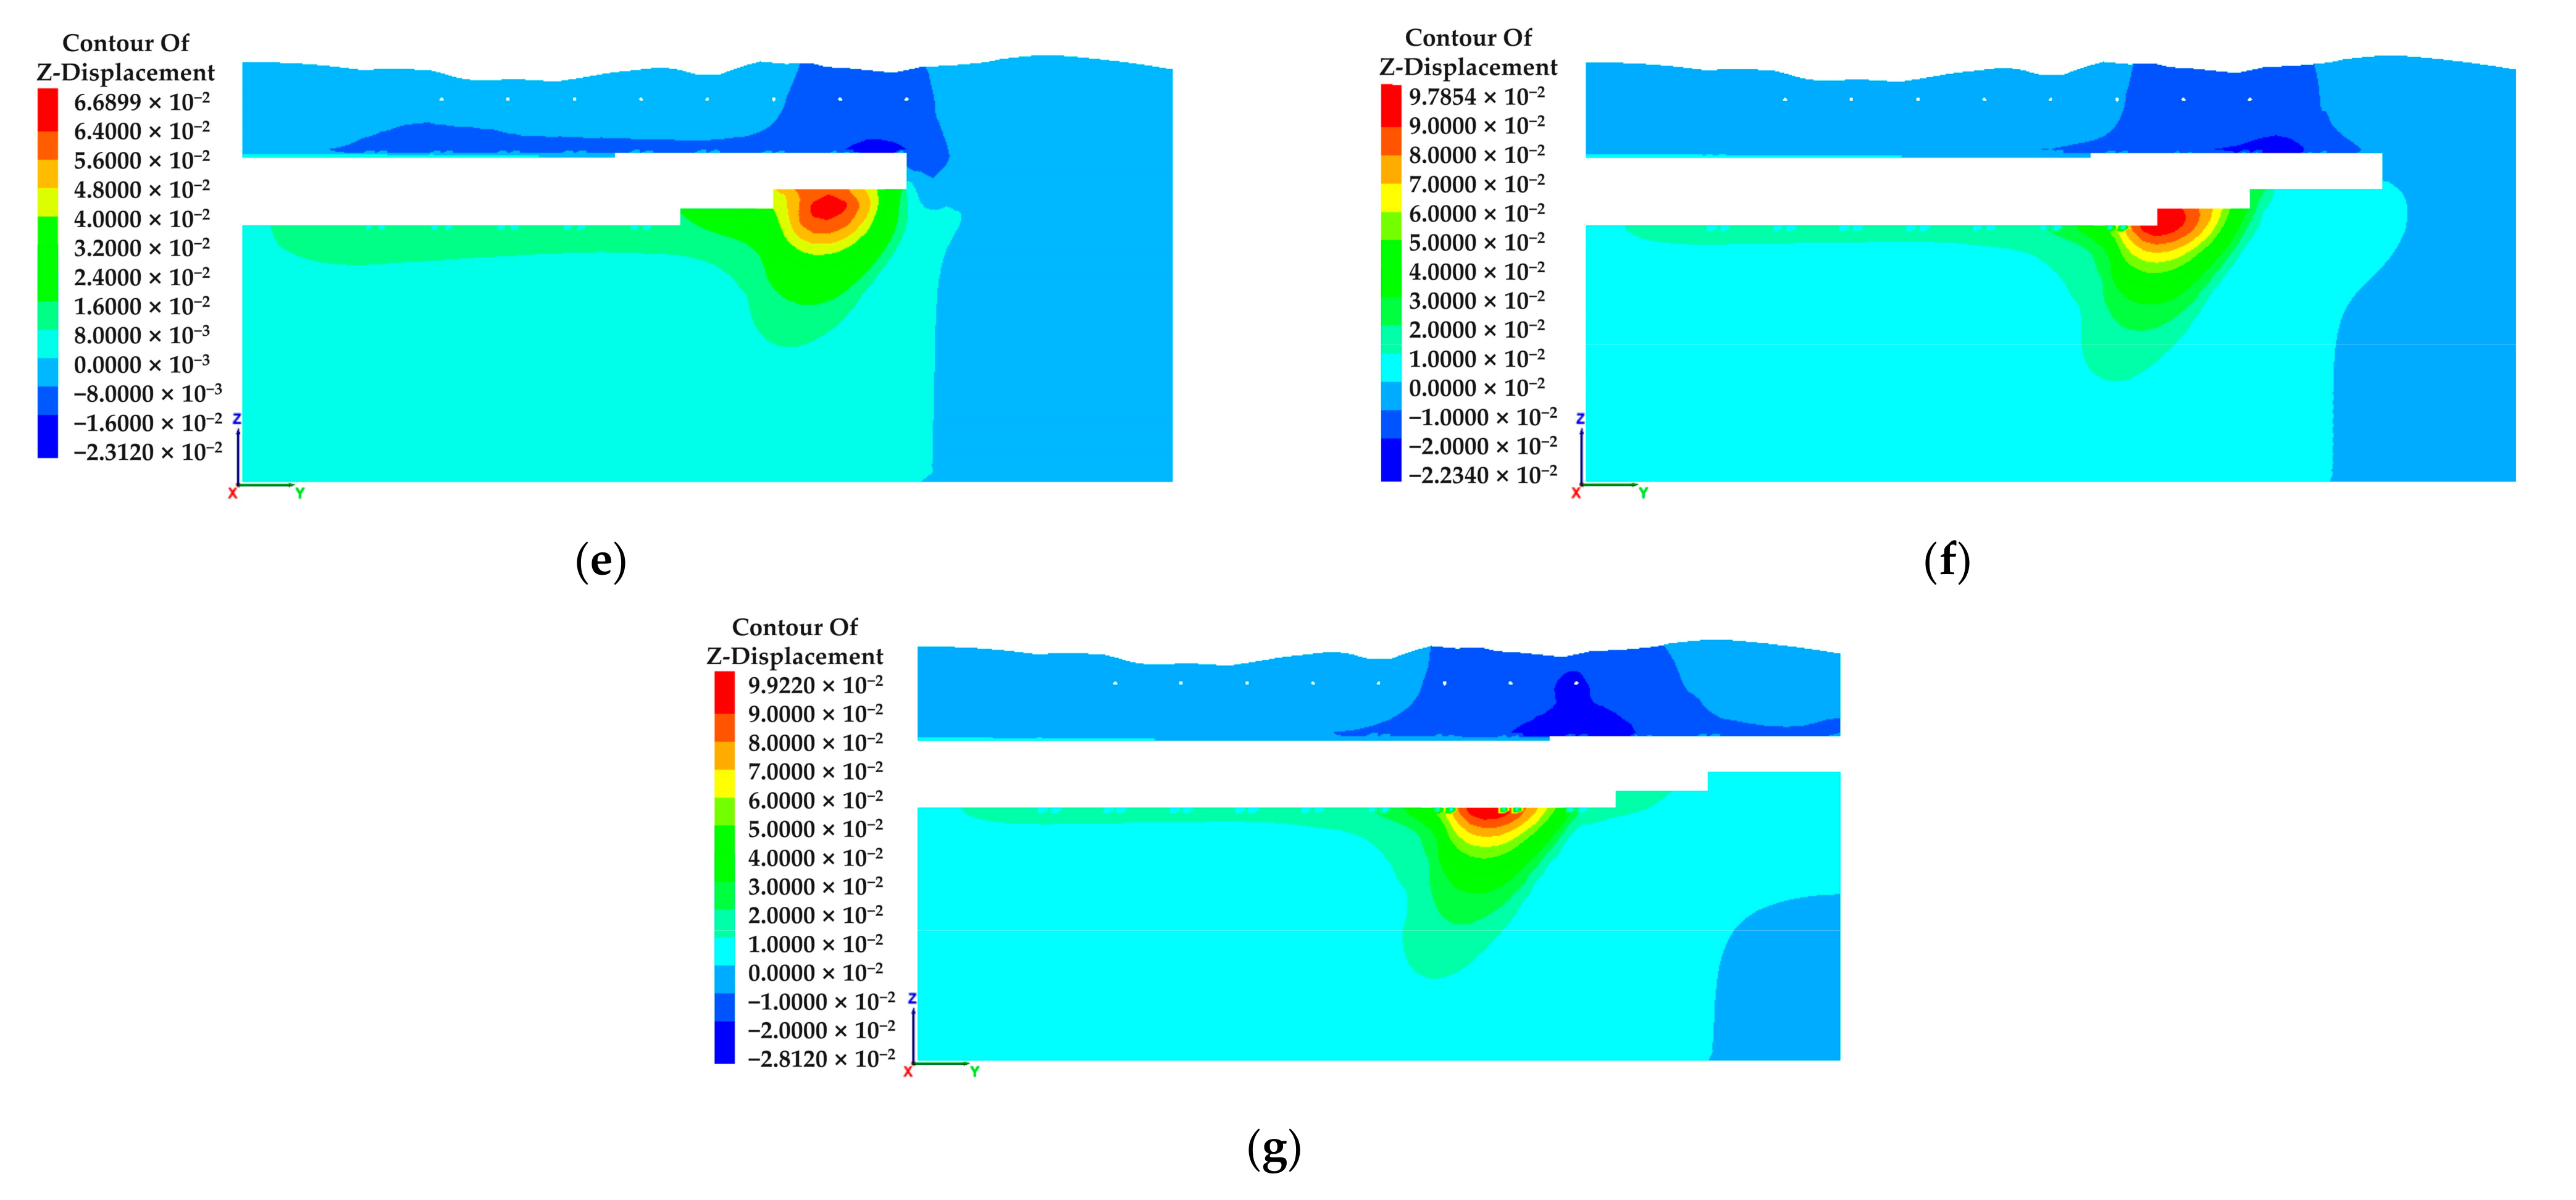
Figure 14 shows the vertical deformation of the surface and surrounding rock with the central axis of the left tunnel as the section during the excavation of the main tunnel. Figure 14a–g shows the excavation of the upper bench face of the left main tunnel to 20 m, 40 m, 60 m, 80 m, 100 m, 120 m and 140 m. Due to the redistribution of stress caused by the excavation unloading, the surrounding rock at the vault of the left main tunnel had subsidence deformation, the surrounding rock at the arch bottom had uplift deformation, and the surface had settlement deformation to varying degrees. With the continuous progress of the excavation of the left main tunnel, the settlement value of the tunnel vault was increasing, and the maximum values were 7.76 mm, 10.6 mm, 13.7 mm, 14.1 mm, 23.1 mm, 22.3 mm and 28.1 mm, respectively. When the upper bench face of the left main tunnel advanced near the fault fracture zone, the settlement of the tunnel vault increased by 9 mm. Therefore, during the excavation of the left main tunnel, attention should be paid to the impact caused by the sudden change of the strength of the surrounding rock near the construction interface. The geological exploration in front of the excavation face should be done well before the excavation face advances to the fault fracture zone.
Figure 15 shows the horizontal deformation of the surface and surrounding rock after excavation of the main tunnel. Figure 15a–c shows the horizontal deformation of the surface and surrounding rock on the section perpendicular to the Y-axis when the excavation depth Y = 40 m, 100 m, and 130 m, in which Y = 40 m and Y = 130 m respectively represent the section at a certain distance before and after the fault fracture zone, Y = 100 m is the section through the fractured zone. Due to the excavation and unloading of the main tunnel, the surrounding rocks on both sides of the main tunnel tended to move towards the middle. The horizontal displacement of the arch foot and arch waist on the left and right sides of the left tunnel was large, and the horizontal displacement of the arch crown and arch bottom was small. The horizontal displacement of the stratum near the middle partition wall was small. The maximum horizontal displacement of Y = 40 m, 100 m and 130 m sections were 6.23 mm, 20.8 mm and 5.70 mm, respectively. It can be seen that the horizontal displacement of the stratum near the fault fracture zone was much greater than that of the stratum at other positions.
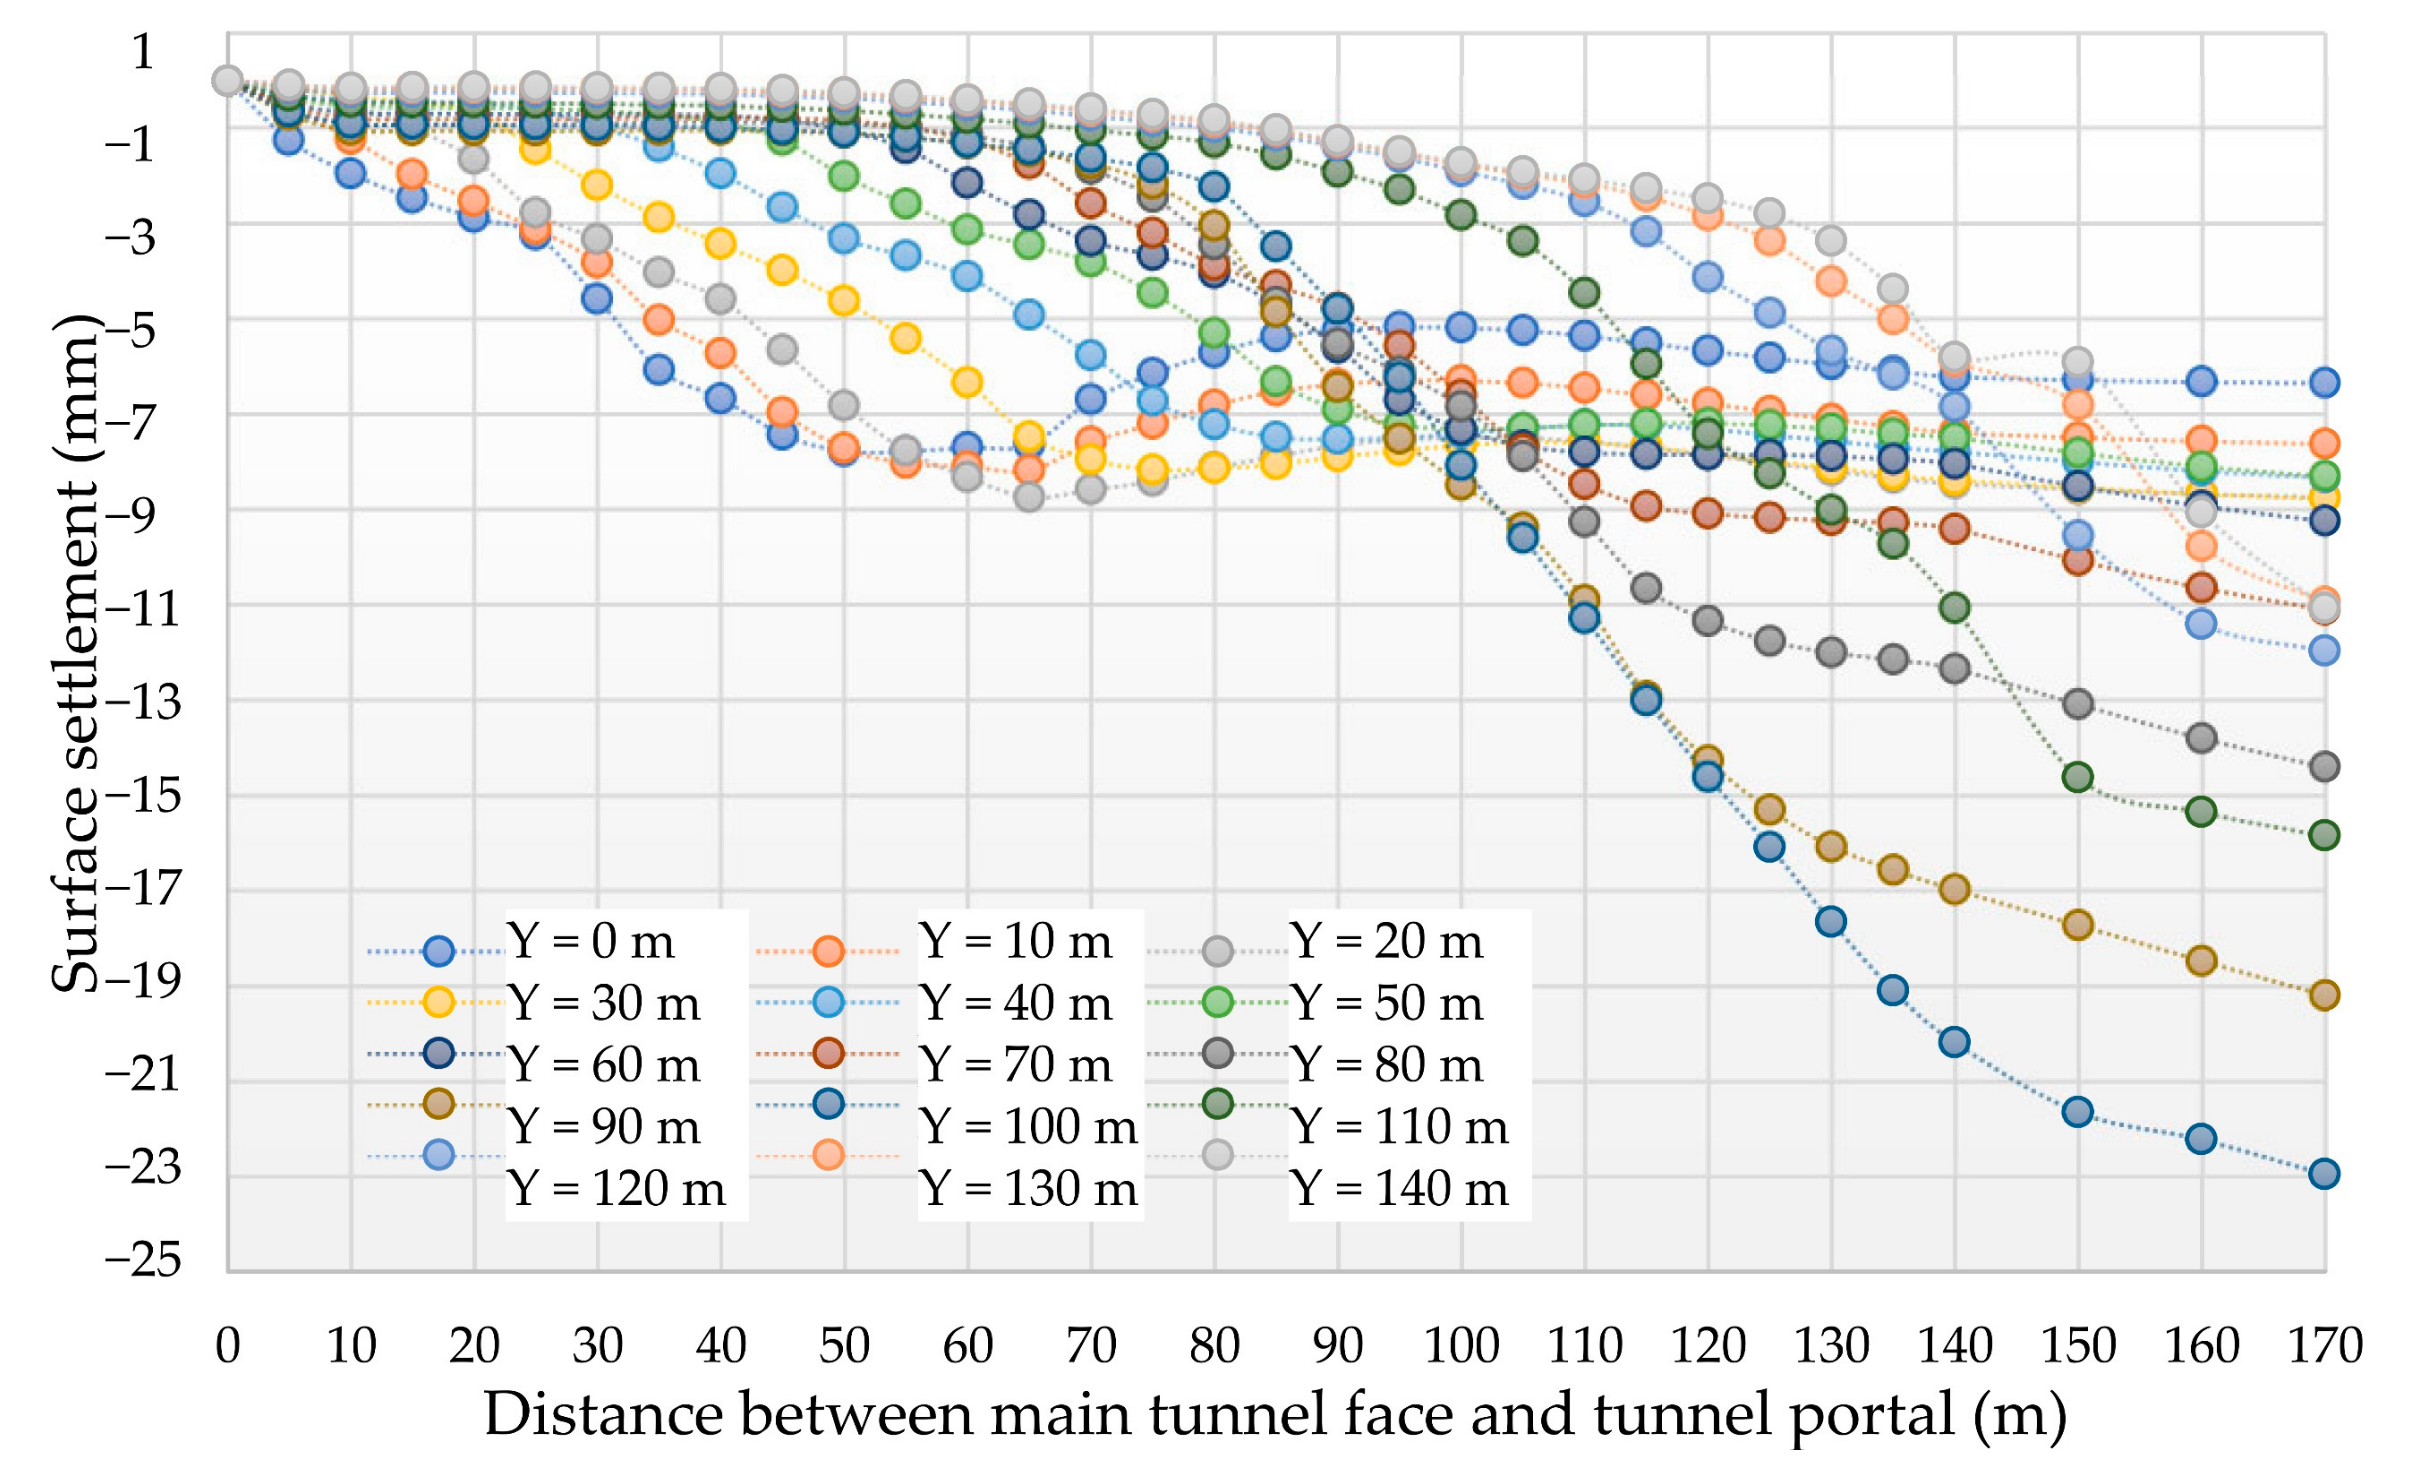
Figure 16 shows the surface settlement during the excavation of the main tunnel. The abscissa was the excavation process of the main tunnel expressed by the excavation distance, and the ordinate was the surface settlement displacement. Since the excavation sequence of the main tunnel was to excavate the left tunnel first and then the right tunnel, and the excavation interval was 30 m, that was, after the excavation of the left tunnel (140 m), it still needed to excavate another 30 m of the right tunnel, so the abscissa 0–140 m represented the excavation time of the left tunnel and 140–170 m represented the excavation time of the remaining right tunnel. Y = 0 m, 10 m ···140 m indicated the distance between the surface settlement monitoring point above the central axis of the middle partition wall and the portal. The surface settlement at each position increased with the progress of the main tunnel excavation. Observing the interval where the settlement value suddenly increased, it can be found that when the excavation face advanced to about 20 m before the location, the surface settlement increased sharply, indicating that the rock and soil mass within 20 m behind the excavation face was greatly disturbed by the excavation.

4.3.2. Lining Deformation Analysis

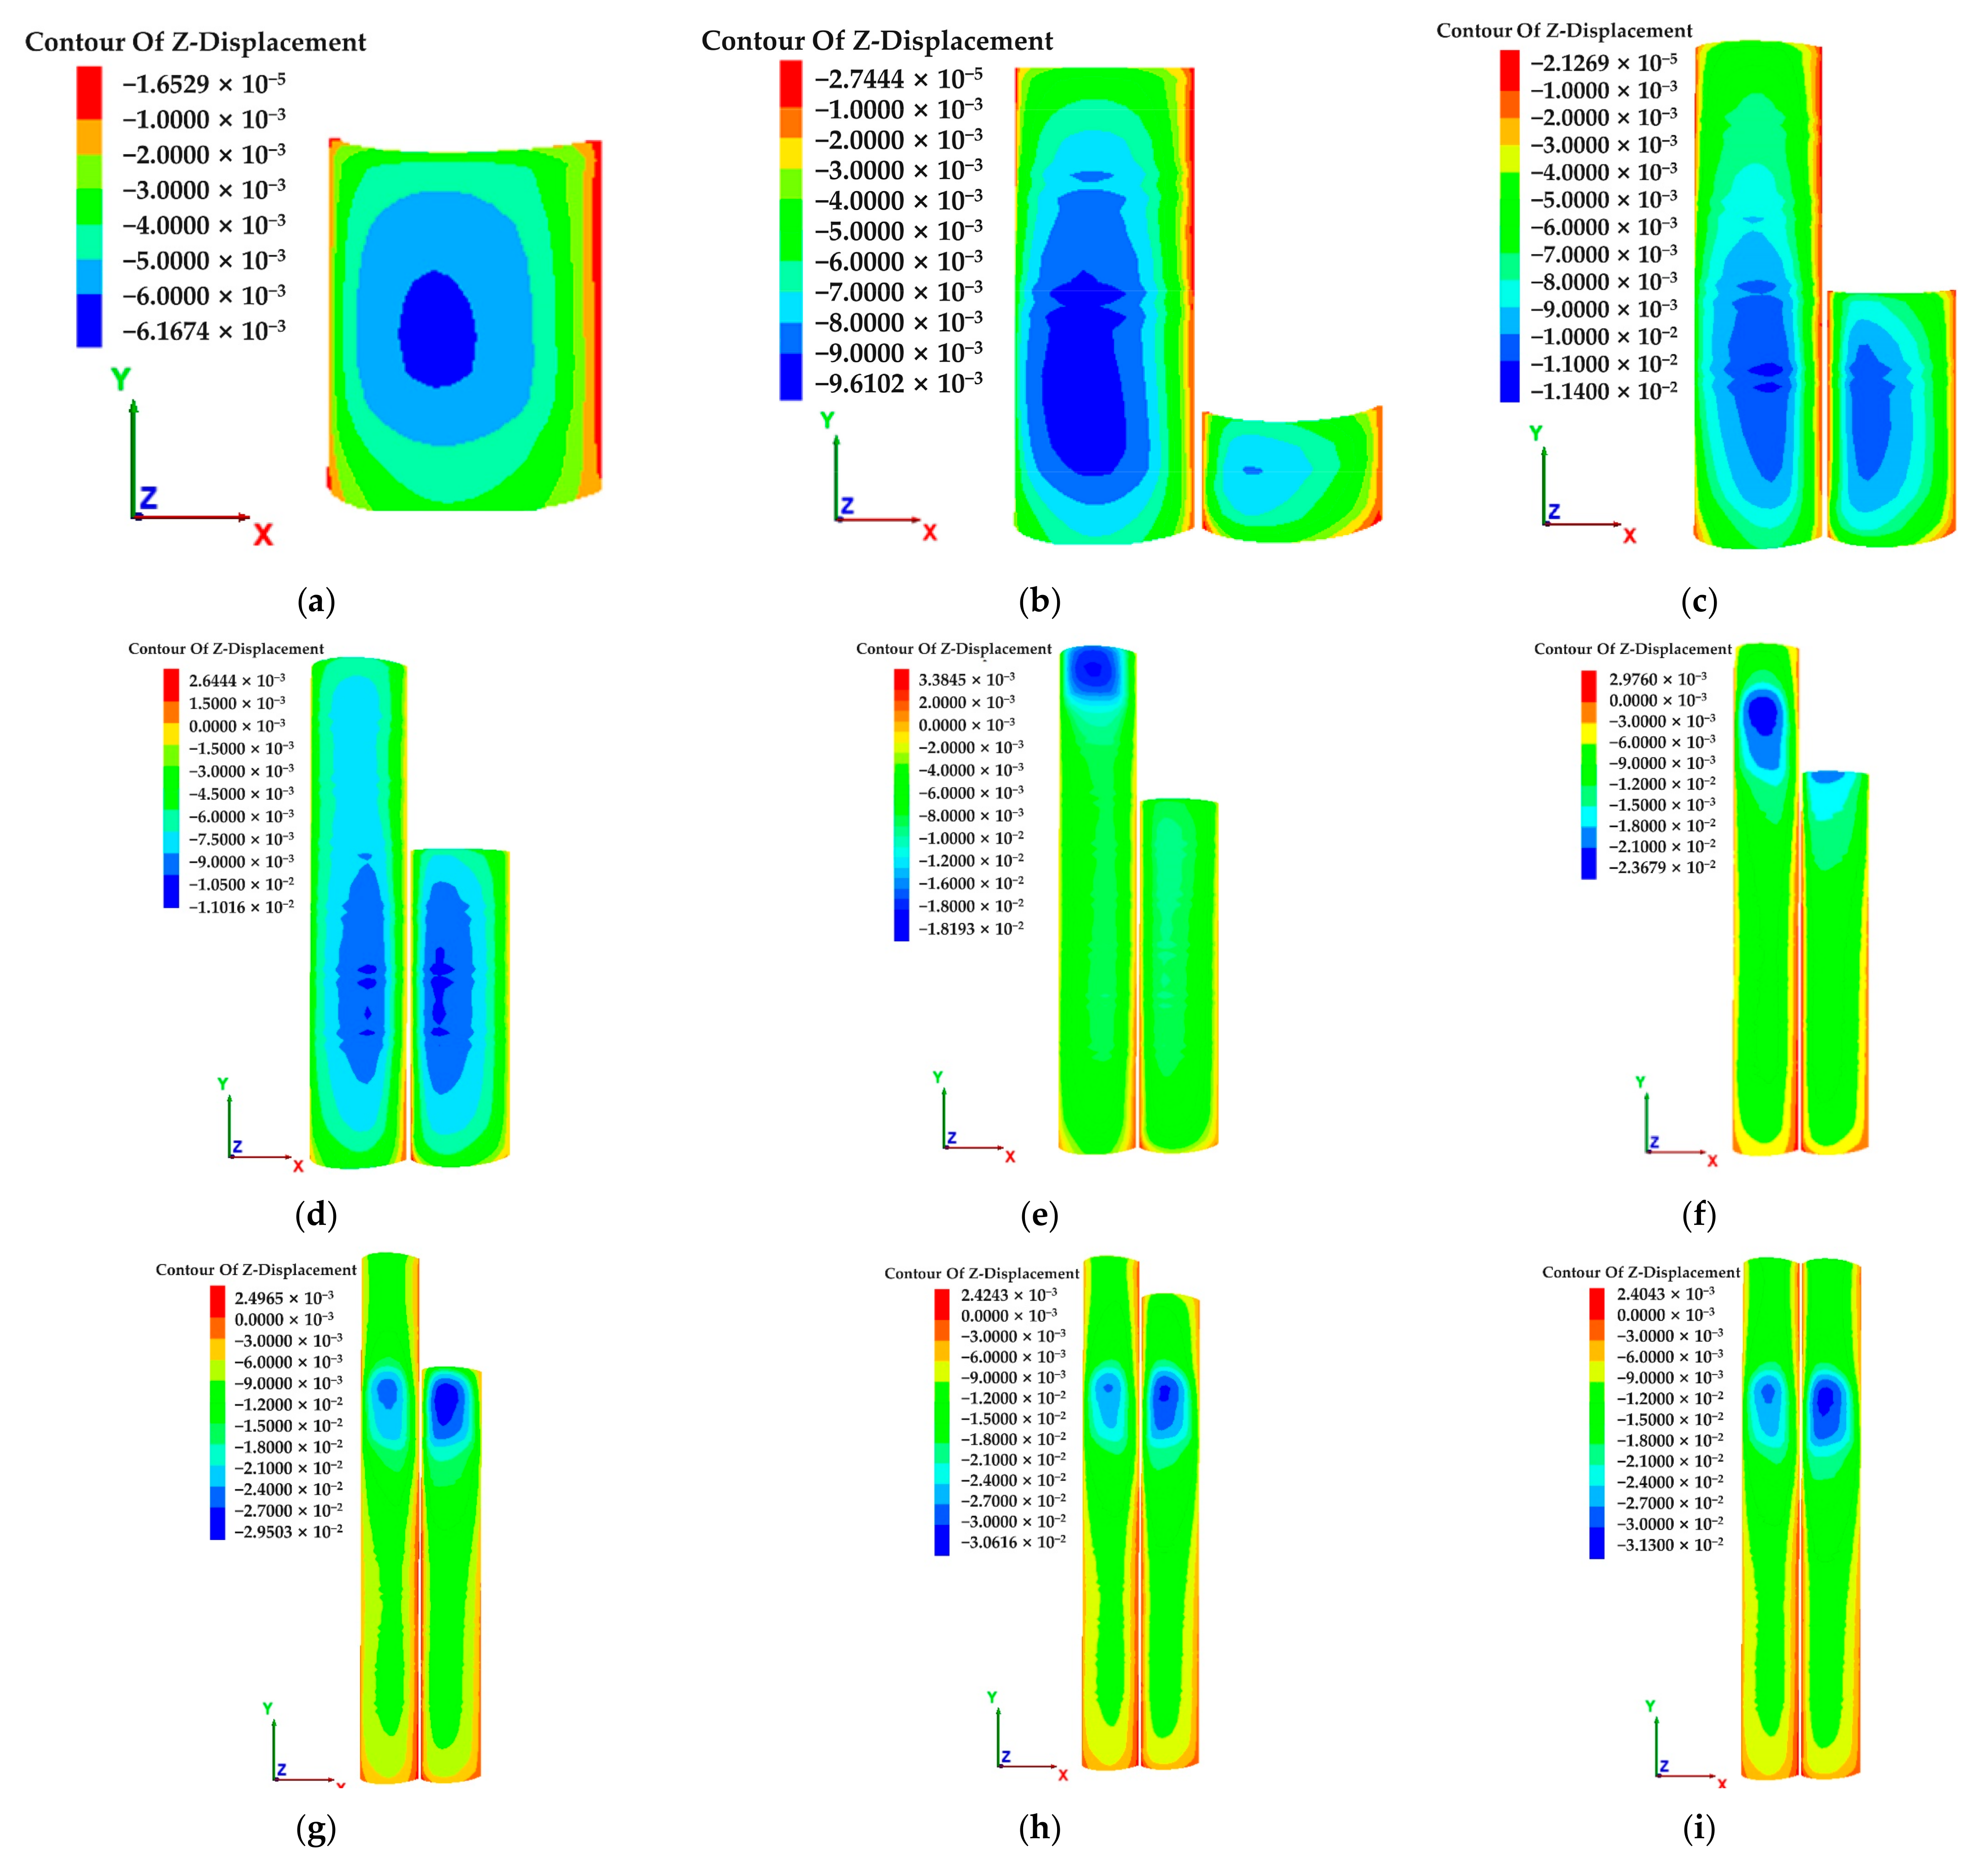
The vertical displacement of the lining structure was an important monitoring object in the construction of a double-arch tunnel. This indicator can intuitively reflect whether there was a greater risk in the tunnel excavation process. Figure 17 shows the vertical deformation of the vault lining corresponding to different excavation distances. The excavation distance shown in Figure 17a–i is that the left tunnel face advances to 20 m, 40 m, 60 m, 80 m, 100 m, 120 m and 140 m, the right tunnel excavates to 130 m and all main tunnel excavation ends. The settlement of the tunnel vault continued to increase with the progress of the main tunnel excavation. The maximum settlement values of the vault on the nine statistical nodes were 6.17 mm, 9.61 mm, 11.4 mm, 11.0 mm, 18.2 mm, 23.7 mm, 29.5 mm, 30.6 mm and 31.3 mm, respectively. When the left tunnel was excavated into the fault fracture zone, the vertical deformation of the vault lining increased greatly, which was 7.2 mm. Therefore, in the actual construction, the existing orientation of the fault fracture zone shall be accurately given in combination with the advanced geological prediction. When crossing the distribution area of the fault fracture zone, the construction process shall be adjusted to reduce the excavation footage. The primary support shall be carried out as soon as possible to minimize the deformation of the lining structure.
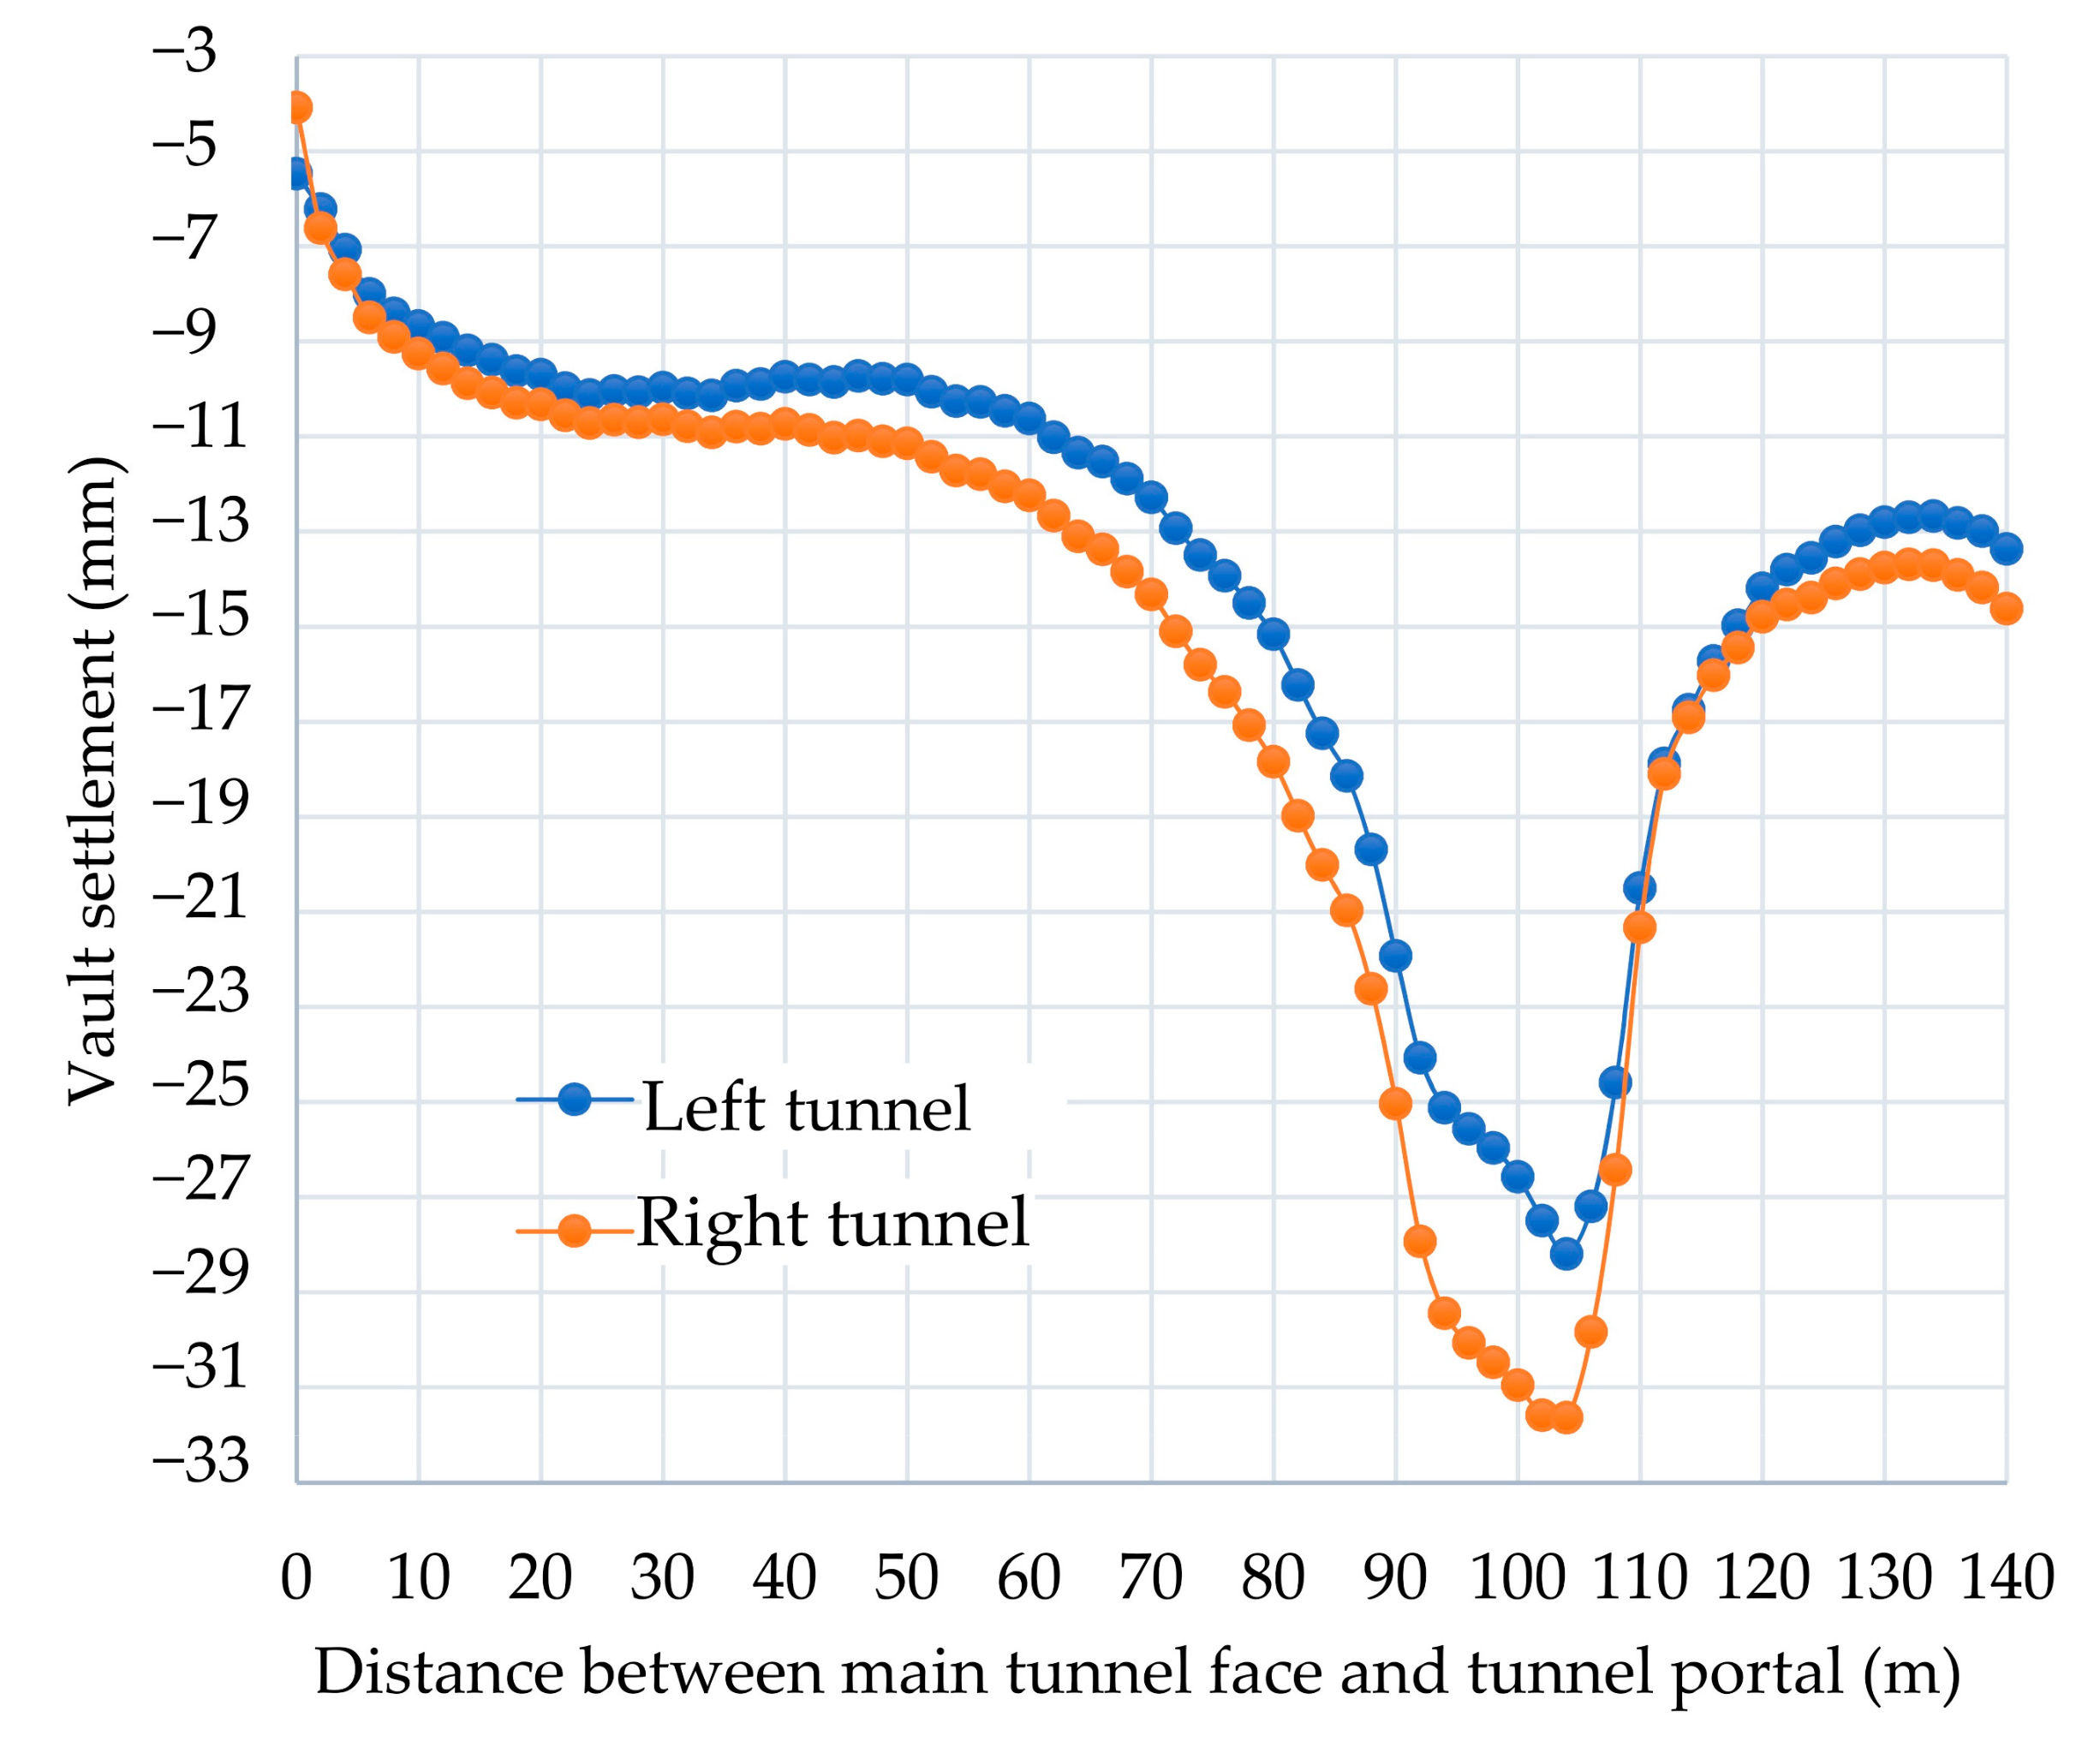
During the construction process, due to the different excavation sequences of the left and right caves, there may be some differences in the vertical deformation of the vaults of the left and right main tunnels. Figure 18 shows the settlement deformation of the left and right main tunnel after the excavation of the main tunnel is completed. With the increase of the distance from the portal, the settlement displacement of the vault of the left main tunnel and the right main tunnel first increased and then decreased. In the fault fracture zone, the vault settlement displacement was large, and the maximum vault settlement of the left main tunnel and the right main tunnel was 28.2 mm and 31.6 mm respectively. The maximum settlement of the vault of the right main tunnel was greater than the maximum settlement of the vault of the left main tunnel. Controlling tunnel vault deformation was the key step to controlling the deformation of the whole tunnel [31]. Therefore, in the actual construction, the monitoring of vault settlement in the fault fracture zone should be strengthened and special attention should be paid to the change of vault settlement during the excavation of the post excavated main tunnel.

4.3.3. Deformation Analysis of the Middle Partition Wall

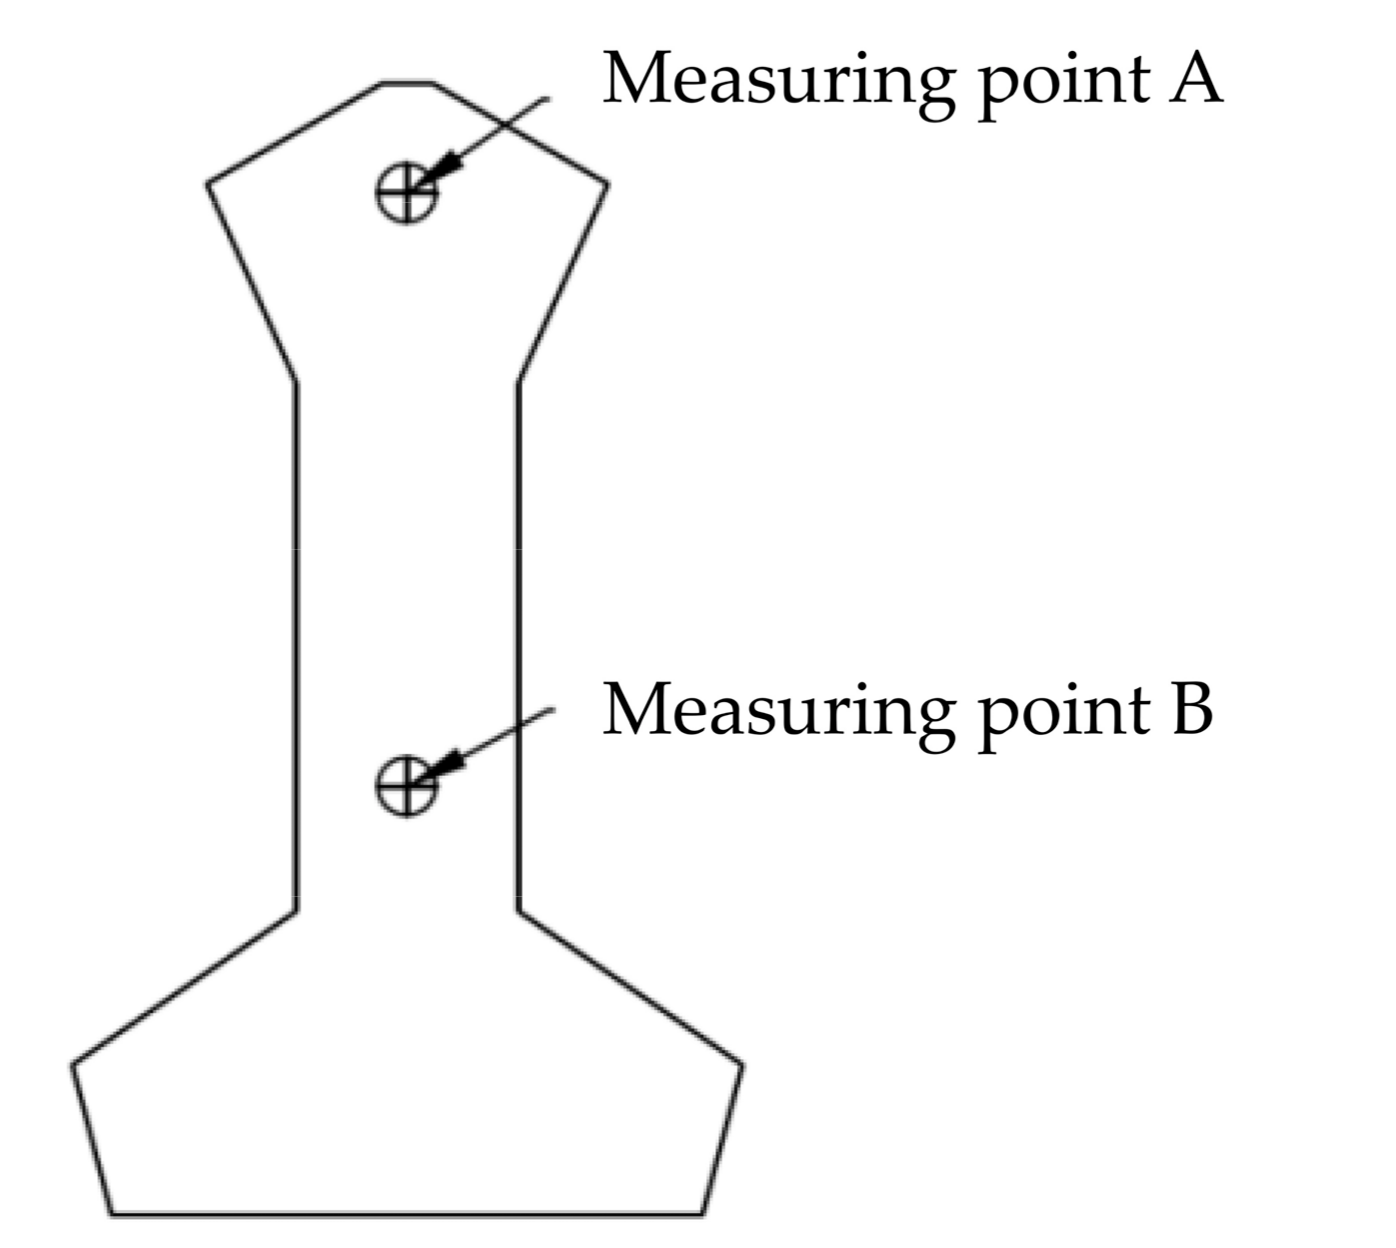
The middle partition wall was an important part of the supporting structure of the double-arch tunnel. The stress of this part was complex and changeable with the construction process. In the tunnel supporting structure, the deformation and stress of the middle partition wall cannot be ignored, and its structural stability was related to the overall stability of the double-arch tunnel supporting structure [32]. As the tunnel excavation created free faces on both sides of the middle partition wall, the risk of structural damage to the middle partition wall was greatly increased. Under the pressure of surrounding rock, the horizontal displacement of the middle partition wall was often too large, affecting the stress of the middle partition wall and even the overall support structure. Additionally, due to the different contact area, structural form and bearing pressure, the horizontal displacement of the top and bottom of the middle partition wall were often quite different, so the torsional deformation of the middle partition wall structure cannot be ignored. The measurement point A above the partition wall and the measurement point B on the abdomen were selected as the monitoring points for the horizontal deformation of the partition wall, as shown in Figure 19. The degree of torsional deformation of the partition wall was represented by the difference between the horizontal displacements of the top measurement point A and bottom measurement point B.
Figure 20 shows the displacement of the middle partition wall at different sections after the main tunnel excavation. Figure 20a–g shows the tunnel cross-sections as Y = 20 m, 40 m, 60 m, 80 m, 100 m, 120 m and 140 m. The displacement values of the middle partition walls at the seven sections were different, and the directions were also different. The maximum displacement of the middle partition wall in seven sections was 1.59 mm, 1.71 mm, 2.25 mm, 6.51 mm, 6.24 mm, 2.73 mm and 1.83 mm, respectively. At the Y = 80 m and Y = 100 m sections, the displacement of the middle partition wall was relatively large. This was because the location was located in the fault fracture zone, the rock and soil was weak, the stability was poor, and the supporting structure was complicated. Therefore, the middle partition wall had a large deformation under the pressure of surrounding rock. On the Y = 20 m section, the vertical displacement of the middle partition wall was upward, indicating that under the reinforcement of rotary jet grouting pile, the surrounding rock strength of the portal section was high, the self-supporting capacity was strong, the surrounding rock pressure on the top of the middle partition wall was small, and the downward vertical displacement was not obvious. As the distance between the section and the portal increased, the direction of the vertical displacement of the partition wall gradually developed downward. The horizontal displacement direction of the middle partition wall at each section was the negative direction of the x-axis, that was, it moved towards the free face of the left tunnel (the main tunnel excavated first). Therefore, during the excavation of the main tunnel, the influence of the excavation sequence on the horizontal displacement of the middle partition wall was that the middle partition wall moved slightly towards the main tunnel excavated first. Therefore, during the excavation of the main tunnel, the influence of the excavation sequence on the horizontal displacement of the partition middle wall was that the partition middle wall moved slightly towards the main tunnel excavated first. The displacement amount and displacement direction of the top and bottom of the middle partition wall at each section were different, indicating that the tunnel excavation caused a certain degree of torsional deformation of the middle partition wall.
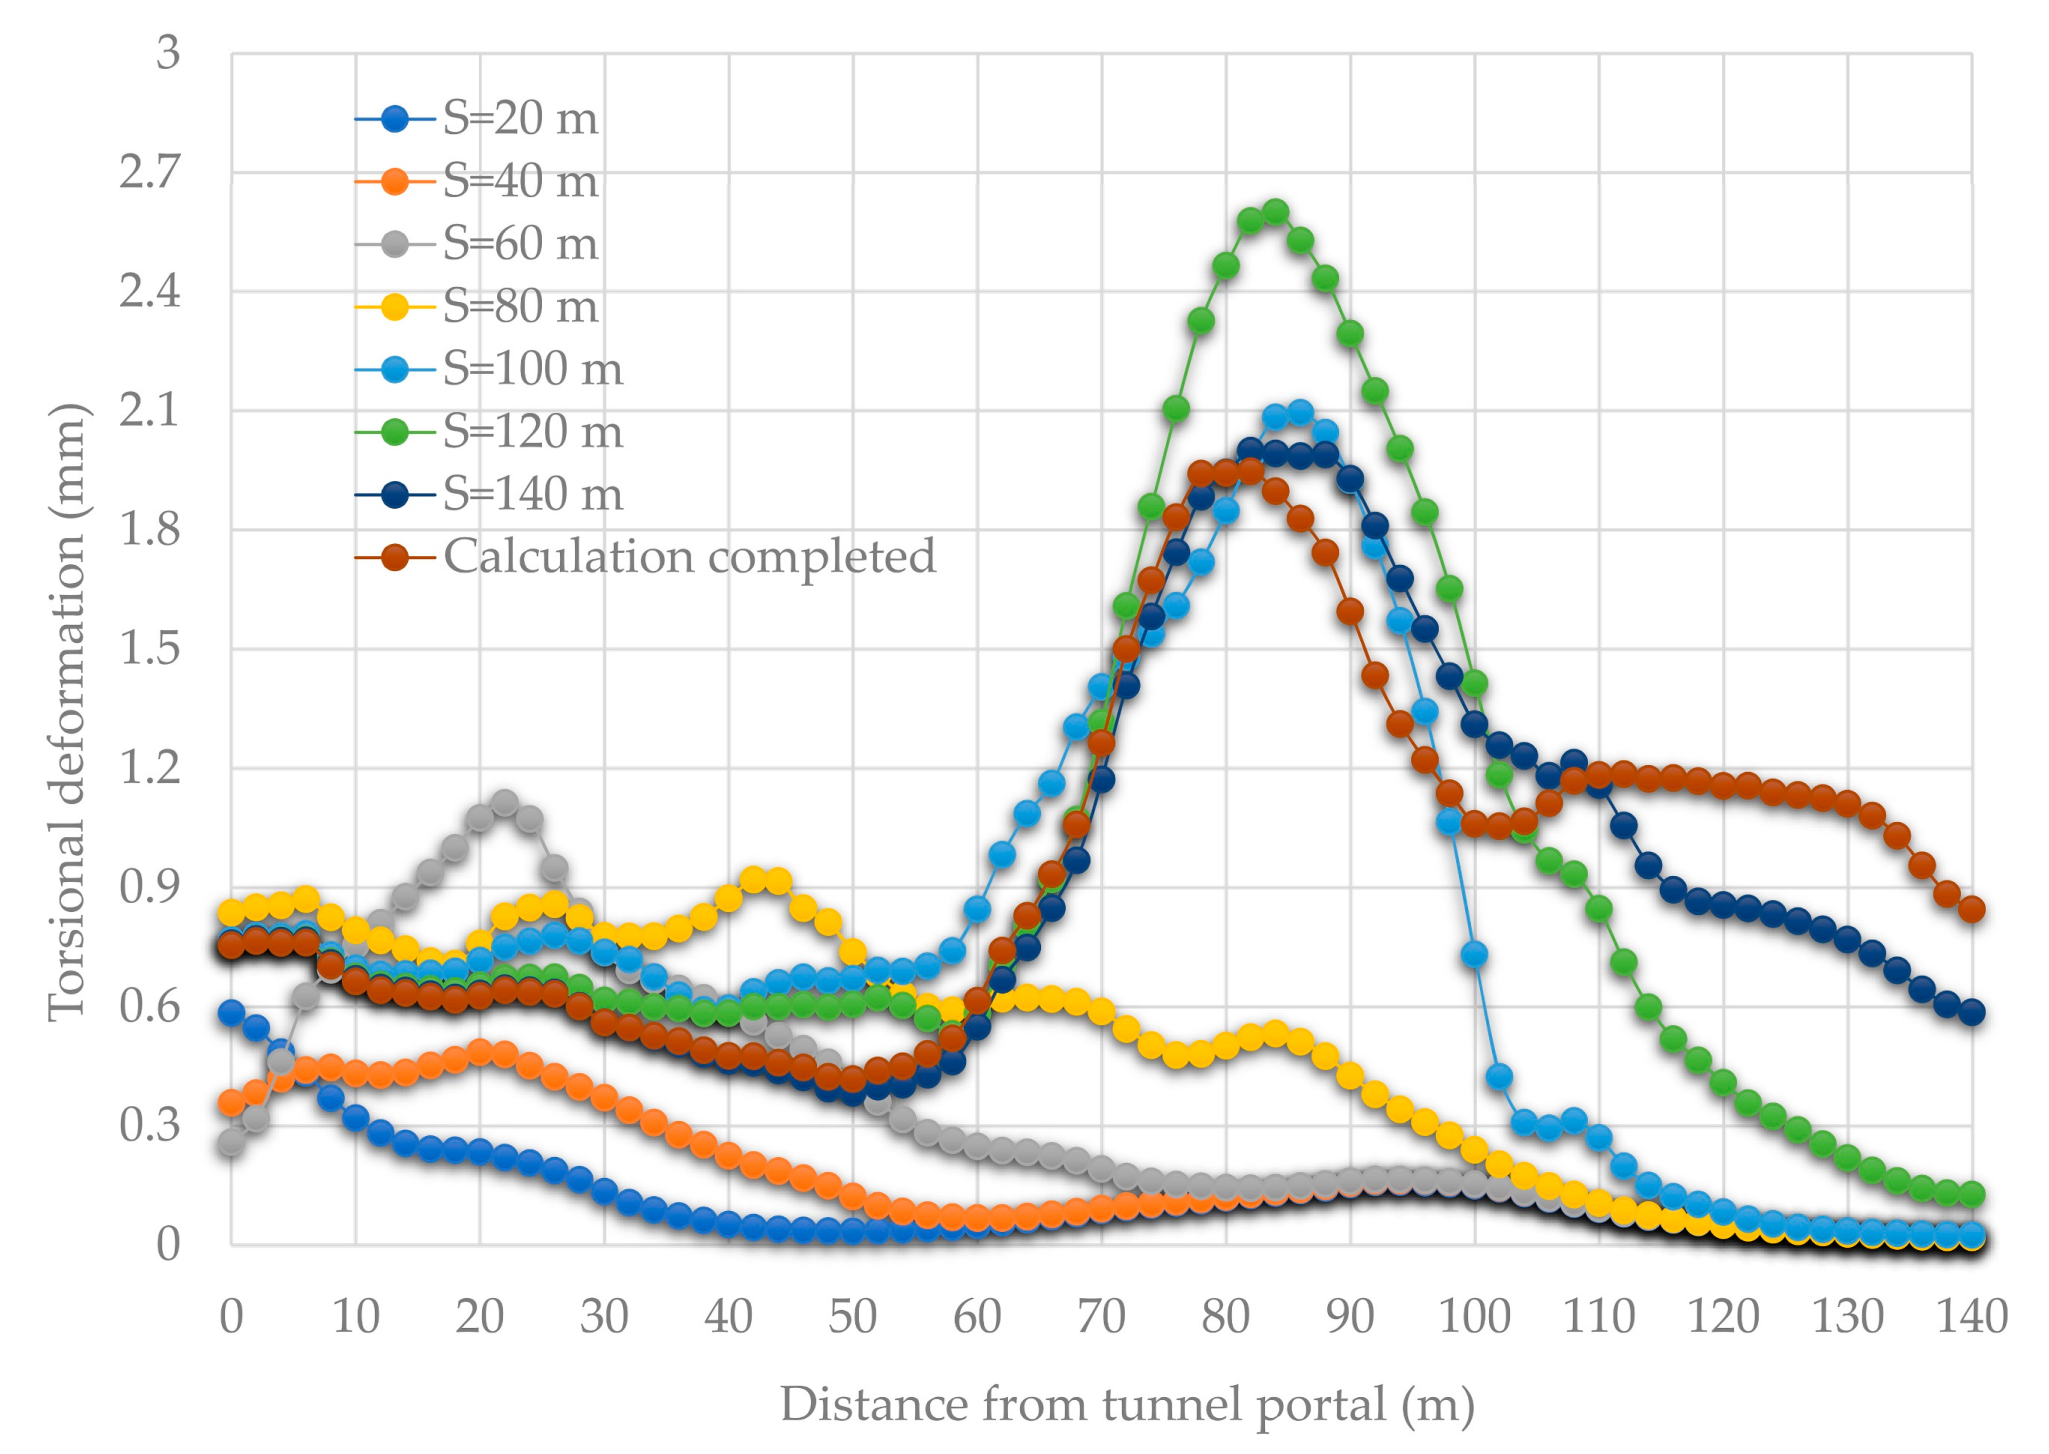
Figure 21 shows the torsional deformation of the middle partition wall during excavation of the main tunnel. S in the legend was the tunnel excavation progress expressed by the distance from the upper bench face of the left main tunnel to the tunnel portal. According to the excavation sequence of the left tunnel first and then the right tunnel, after the left tunnel was excavated 140 m, the right tunnel still needed to be excavated for another 30 m until the calculation was complete. In the section within the range of 110–140 m, the maximum torsional deformation of the central partition wall was obtained when the calculation was completed, while in the range of 0–110 m, the maximum torsional deformation of the central partition wall was obtained during the excavation process. The torsional deformation of the middle partition wall in the fault fracture zone was large, especially when the excavation face was pushed into this area, and the torsional deformation increased abruptly, with a maximum value of 2.6 mm. The maximum torsional deformation at each section of the middle partition wall varied between 0.5–2.6 mm. When excavating the rock and soil before the fault fracture zone (excavation progress S ≤ 80 m), attention should be paid to the torsional deformation of the middle partition wall within 20–50 m. When excavating the rock and soil after the fault fracture zone (excavation progress S ≥ 100 m), attention should be paid to the torsional deformation of the middle partition wall near the excavation face. When excavating the rock and soil mass in the fault fracture zone, the monitoring of the torsional deformation of the middle partition wall in this range should all be strengthened.

4.3.4. Deformation Analysis of Underground Pipelines

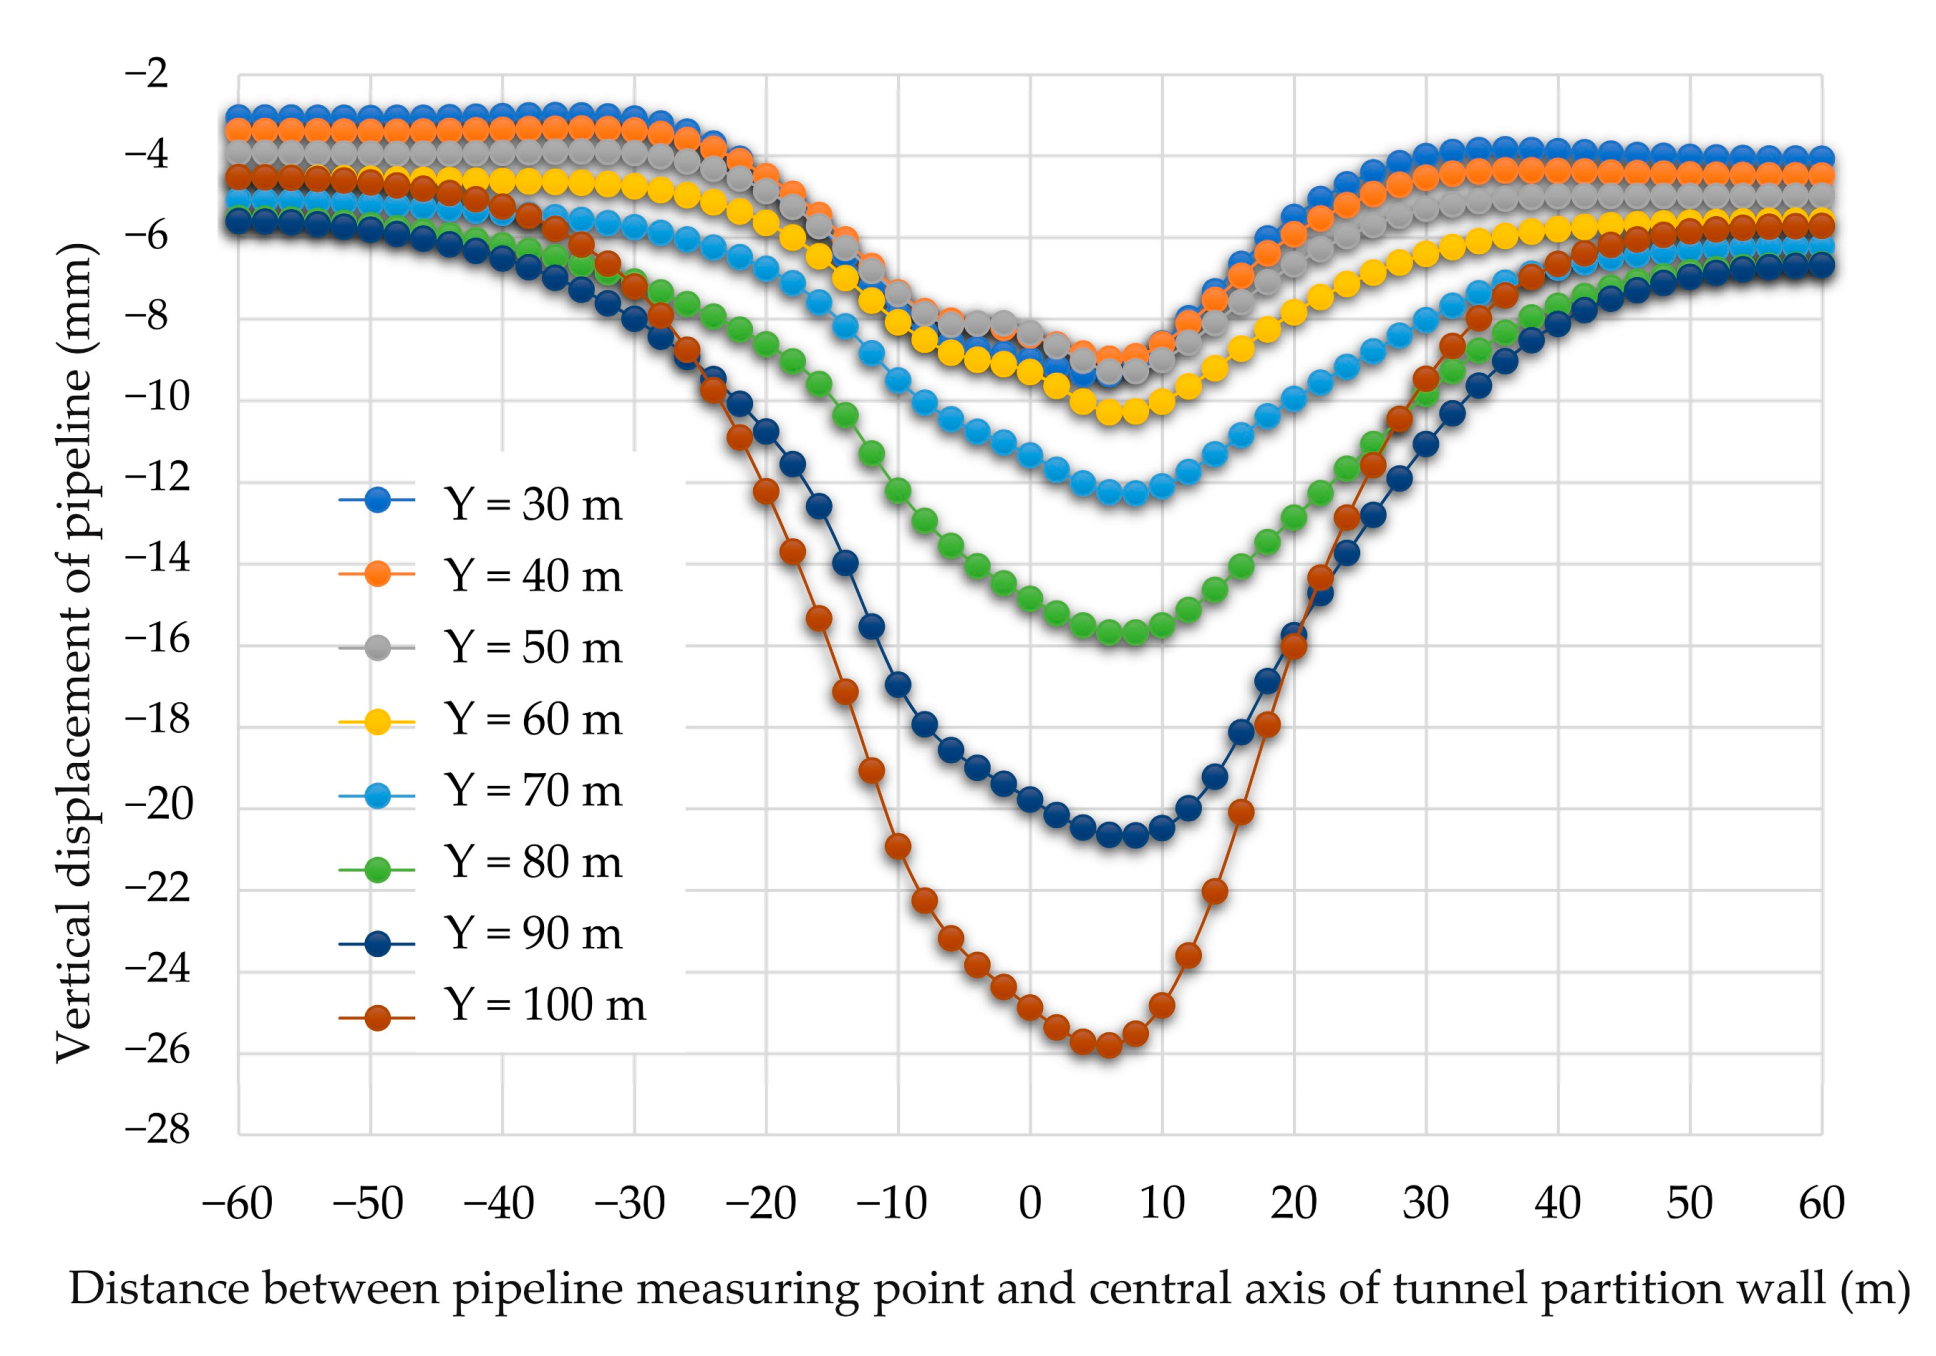
The vertical deformation of 8 underground pipelines is shown in Figure 22. Legend Y indicated that the distance between the pipeline and the portal is 30 m, 40 m, 50 m, 60 m, 70 m, 80 m, 90 m and 100 m, respectively. The maximum vertical displacement of each underground pipeline was obtained near the central axis of the middle partition wall, and this position was closer to the right tunnel due to the influence of the excavation sequence of the main tunnel and the bias phenomenon. The farther away from the portal, the greater the vertical displacement of the underground pipeline, indicating that the impact of tunnel excavation on the underground pipeline was continuous and strong propagation. The vertical deformation of all pipelines in the tunnel site area should be continuously monitored during the excavation process, rather than only focusing on the underground pipeline near the excavation surface. The vertical displacement of underground pipelines near the fault fracture zone was generally greater than that at other locations.

5. Conclusions

To investigate the mechanical behavior of the total construction process of the double-arch tunnel, taking the Xiamen Haicang super-shallow-buried large-span double-arch tunnel as background, the total excavation process of a double-arch tunnel under a running highway was simulated by using FLAC3D. The following conclusions were obtained.
(1)
When the tunnel was excavated to the fault fracture zone, the maximum vertical deformation of the surface, surrounding rock and vault increased suddenly, and the horizontal displacement of rock and soil around the pilot tunnel increased obviously. When crossing the distribution area of the fault fracture zone, the excavation footage should be reduced, and the primary support should be applied as soon as possible after the excavation was completed.
(2)
The vertical deformation of the lining caused by pilot tunnel excavation was small, indicating that the lining structure design was reasonable.
(3)
Among the three pilot tunnels, the vault settlement of the middle pilot tunnel was the largest, and the maximum settlement of the left pilot tunnel and the right pilot tunnel was similar. The rock and soil within 20 m behind the excavation face were greatly disturbed by excavation.
(4)
During the excavation of the main tunnel, the horizontal displacement of the central partition wall moved slightly towards the main tunnel excavated first.
(5)
During the excavation of the double-arch tunnel, the maximum vertical displacement of the underground pipeline occurred at the position where the central axis of the middle partition wall deviates to the post excavated the main tunnel.
By analyzing the mechanical behavior in the total construction process from the perspective of deformation, the potential risk areas and time nodes can be obtained. In the future, a comprehensive study needs to be carried out from the perspective of stress and plastic zone. Load-structure method and analytical solution can be introduced to discuss the loading on arch during construction.

Author Contributions

J.W., Z.W. and A.C. carried out the main research task and wrote the manuscript. J.W. proposed the original idea and contributed to the revision of the obtained results and the whole manuscript. Z.S., X.L. (Xiao Lin) and L.S. performed utilization on-site. X.L. (Xiaotian Liu), H.L. and Y.S. performed an investigation. All authors have read and agreed to the published version of the manuscript.

Funding

This research was funded by the Shanghai Municipal Science and Technology Project (18DZ1201301; 19DZ1200900); Xiamen Road and Bridge Group (XM2017-TZ0151; XM2017-TZ0117); the project of Key Laboratory of Impact and Safety Engineering (Ningbo University), Ministry of Education (CJ202101); Shanghai Municipal Science and Technology Major Project (2021SHZDZX0100) and the Fundamental Research Funds for the Central Universities; Key Laboratory of Land Subsidence Monitoring and Prevention, Ministry of Natural Resources of the People’s Republic of China (No. KLLSMP202101); Suzhou Rail Transit Line 1 Co., Ltd. (SURT01YJ1S10002); China Railway 15 Bureau Group Co., Ltd. (CR15CG-XLDYH7-2019-GC01); the National Natural Science Foundation of China (Grant No. 41907230).

Data Availability Statement

The data presented in this study are available on request from the corresponding author.

Conflicts of Interest

The authors declare no conflict of interest.

References

  1. Hwang, J.H.; Kikumoto, M.; Kishida, K.; Kimura, M. Dynamic stability of multi-arch culvert tunnel using 3-D FEM. Tunn. Undergr. Space Technol. 2005, 21, 384. [Google Scholar] [CrossRef]
  2. Wang, J.; Xia, C.C.; Zhu, H.H.; Li, Y.S.; Lin, Z.L.; Chen, X.J. Site monitoring and analysis of non-symmetrical muti-arch highway tunnel. Chin. J. Rock Mech. Eng. 2004, 23, 267–271. [Google Scholar] [CrossRef]
  3. Zhou, Z.Q.; Li, S.C.; Li, L.P.; Sui, B.; Shi, S.S.; Zhang, Q.Q. Causes of geological hazards and risk control of collapse in shallow tunnels. Rock. Soil Mech. 2013, 34, 1375–1382. [Google Scholar] [CrossRef]
  4. Yuan, F.; Liu, X.R.; Zu, L. Optimization of distance between excavation faces of unsymmetrical loaded loess double-arch tunnel. Chin. J. Tunn. Undergr. Space Eng. 2011, 7, 257–262. [Google Scholar] [CrossRef]
  5. Wu, J.M.; Chen, X.C.; Li, W.Q.; Peng, J.Z.; Zhang, A.L. Forecast of overbreak and analysis of cause of formation in double-arch tunnels in Jinliwen highway. Hydrogeol. Eng. Geol. 2005, 5, 56–59. [Google Scholar] [CrossRef]
  6. Yan, Q.X.; Zhang, C.; Lin, G.; Wang, B. Field monitoring of deformations and internal forces of surrounding rocks and lining structures in the construction of the gangkou doublearched tunnel—A case study. Appl. Sci. 2017, 7, 169. [Google Scholar] [CrossRef] [Green Version]
  7. Lai, J.X.; Qiu, J.L.; Fan, H.B.; Chen, J.X.; Hu, Z.N.; Zhang, Q.; Wang, J.B. Structural safety assessment of existing multiarch tunnel: A case study. Adv. Mater. Sci. Eng. 2017, 2017, 1697041. [Google Scholar] [CrossRef] [Green Version]
  8. Yuan, Y.; Wang, Q.H.; Du, G.P.; Li, D. In-situ testing study on lining system of double-arched tunnel. Chin. J. Rock. Mech. Eng. 2005, 24, 480–484. [Google Scholar] [CrossRef]
  9. Skrzypkowski, K. Case Studies of Rock Bolt Support Loads and Rock Mass Monitoring for the Room and Pillar Method in the Legnica-Głogów Copper District in Poland. Energies 2020, 13, 2998. [Google Scholar] [CrossRef]
  10. Zhang, N.; Shen, S.L.; Zhou, A.N.; Lyu, H.M. Challenges of earth-pressure-balance tunnelling in weathered granite with boulders. P. I. Civil. Eng. Geotec. 2020, 174, 372–389. [Google Scholar] [CrossRef]
  11. Yan, T.; Shen, S.L.; Zhou, A.; Lyu, H.M. Construction efficiency during shield tunnelling through soft deposit in Tianjin, China. Tunn. Undergr. Space Technol. 2021, 112, 103917. [Google Scholar] [CrossRef]
  12. Li, S.C.; Yuan, C.; Feng, X.D.; Li, S.C. Mechanical behaviour of a large-span double-arch tunnel. KSCE J. Civ. Eng. 2016, 20, 2737–2745. [Google Scholar] [CrossRef]
  13. Yang, J.S.; Gou, D.M.; Zhang, Y.X. Field measurements and numerical analyses of double-layer pipe roof reinforcement in a shallow multiarch tunnel. Transp. Res. Rec. J. Transp. Res. Board. 2008, 2050, 145–153. [Google Scholar] [CrossRef]
  14. Liu, C.; Yang, H.; Jiang, X.L.; Shi, H.T. Shaking table test and numerical simulation for acceleration response laws of shallow-buried biased double-arch tunnel. J. Vibroeng. 2019, 21, 1188–1200. [Google Scholar] [CrossRef]
  15. Liu, T.; Shen, M.R.; Tao, L.B.; He, Z.M.; Yuan, Y. Model test and 3d numerical simulation study on excavation of double-arch tunnel. Chin. J. Rock Mech. Eng. 2006, 25, 1802–1808. [Google Scholar] [CrossRef]
  16. Liu, X.R.; Liu, J.; Huang, L.H.; Wang, Z.J.; Chen, H.J.; Feng, Y. Model test and pressure arch analysis for excavation of loess double arch tunnel. J. ZheJiang Univ. 2018, 52, 1140–1149. [Google Scholar] [CrossRef]
  17. Vitali, O.P.M.; Celestino, T.B.; Bobet, A. Analytical solution for tunnels not aligned with geostatic principal stress directions. Tunn. Undergr. Space Technol. 2018, 82, 394–405. [Google Scholar] [CrossRef]
  18. Hu, X.; Zhang, Z.; Teng, L. An analytical method for internal forces in DOT shield-driven tunnel. Tunn. Undergr. Space Technol. 2009, 24, 675–688. [Google Scholar] [CrossRef]
  19. Yang, S.; Dai, R.; Ai, Z.B.; Li, X.C.; Zhang, C.; Huang, X. Analytical solutions for the mechanical responses of shallow double-arched tunnel subjected to symmetric loads. Adv. Civ. Eng. 2021, 2021, 8867536. [Google Scholar] [CrossRef]
  20. Lyu, H.M.; Shen, S.L.; Zhou, A.; Chen, K.L. Calculation of pressure on the shallow-buried twin-tunnel in layered strata. Tunn. Undergr. Space Technol. 2020, 103, 103465. [Google Scholar] [CrossRef]
  21. Lyu, H.M.; Shen, S.L.; Zhou, A.; Chen, K.L. A novel method to calculate pressure on the twin-tunnel in layered strata. MethodsX 2020, 7 (Suppl. S2), 101126. [Google Scholar] [CrossRef]
  22. Wu, H.N.; Shen, S.L.; Liao, S.M.; Yin, Z.Y. Longitudinal structural modelling of shield tunnels considering shearing dislocation between segmental rings. Tunn. Undergr. Space Technol. 2015, 50, 317–323. [Google Scholar] [CrossRef]
  23. Elbaz, K.; Shen, S.L.; Zhou, A.; Yin, Z.Y.; Lyu, H.M. Prediction of disc cutter life during shield tunneling with AI via the incorporation of a genetic algorithm into a GMDH-type neural network. Engineering 2021, 7, 238–251. [Google Scholar] [CrossRef]
  24. Ahrens, E. Two-and three-dimensional analysis of closely spaced double-tube tunnels. Tunn. Undergr. Space Technol. 1993, 8, 13–18. [Google Scholar] [CrossRef]
  25. Wang, S.R.; Wang, Y.G.; Li, C.L. Evolution characteristics analysis of pressure—Arch of a highway tunnel under different stress conditions. J. Eng. Sci. Technol. Rev. 2016, 9, 99–105. [Google Scholar] [CrossRef]
  26. Li, C.L.; Wang, S.R.; Wang, G.Y.; Fang, C.; Fan, Y. Skewed pressure characteristics of equivalent load in double-arch tunnel. J. Eng. Technol. Sci. 2016, 48, 345–358. [Google Scholar] [CrossRef] [Green Version]
  27. Shi, Y.X.; Wang, M.N.; Li, Q. Analysis of influence of blasting vibration on middle wall of a double-arch tunnel. Rock Soil Mech. 2007, 28, 1275–1279. [Google Scholar] [CrossRef]
  28. Li, D.Y.; Li, X.B.; Zhang, W.; Gong, F.Q.; Huang, B.R. Stability analysis of surrounding rock of multi-arch tunnel based on coupled fluid-solid theorem. Chin. J. Rock Mech. Eng. 2007, 26, 1056–1064. [Google Scholar] [CrossRef]
  29. Bai, J.S.; Zhao, S.B.; Qi, B.; Yang, K.F. Study on the structure deformation of large-span shallow-buried multi-arch tunnel in soft stratum. Chin. Civ. Eng. J. 2017, 50, 45–50. [Google Scholar] [CrossRef]
  30. Yang, K.; Dong, F.; Zhang, Y.; Zhang, Z.Y.; Huang, J. Study on the key technology of urban large span double arch tunnel using drilling and blasting method. Technol. Highw. Transp. 2018, 34, 24–32. [Google Scholar] [CrossRef]
  31. Huang, R.Q.; Xiao, H.B. Deformation mechanism of a shallow double-arch tunnel in a sloping rock mass. Bull. Eng. Geol. Environ. 2009, 69, 89–97. [Google Scholar] [CrossRef]
  32. Zhang, Z.Q.; He, C. Study on mechanical behaviours of designing and construction for center pillar of double-arched tunnel. Chin. J. Rock Mech. Eng. 2006, 25, 1632–1638. [Google Scholar] [CrossRef]
Figure 1. Longitudinal profile of the double-arch tunnel.
Applsci 12 00039 g001
Figure 2. Numerical calculation model: (a) Double-arch tunnel model (unit: m); (b) Underground pipeline model; (c) The lining of the three pilot tunnels; (d) The lining and partition wall of the main tunnel; (e) The anchor bolts and advanced small conduits of the pilot tunnel; and (f) The long pipe shed.
Applsci 12 00039 g002
Figure 3. Cross-section of the numerical calculation tunnel model.
Applsci 12 00039 g003
Figure 4. The contact surface: (a) The contact surface between the pilot tunnel and the partition wall; (b) The contact surface between the lining and surrounding rock; and (c) The contact surface between the inverted arch and surrounding rock.
Applsci 12 00039 g004
Figure 5. Vertical settlement of left tunnel vault at 40 m away from the portal.
Applsci 12 00039 g005
Figure 6. Vertical settlement of the vault of the right tunnel.
Applsci 12 00039 g006
Figure 7. Vertical deformation of surface and surrounding rock during pilot tunnel excavation (unit: m): (a) L = 20 m; (b) L = 40 m; (c) L = 60 m; (d) L = 80 m; (e) L = 100 m; (f) L = 120 m; and (g) L = 140 m.
Applsci 12 00039 g007
Figure 8. Horizontal deformation of surface and surrounding rock after pilot tunnel excavation (unit: m): (a) Y = 20 m; (b) Y = 40 m; (c) Y = 60 m; (d) Y = 80 m; and (e) Y = 100 m.
Applsci 12 00039 g008
Figure 9. Surface settlement during pilot tunnel excavation.
Applsci 12 00039 g009
Figure 10. Vertical deformation of lining during pilot tunnel excavation (unit: m): (a) L = 20 m; (b) L = 40 m; (c) L = 60 m; (d) L = 80 m; (e) L = 100 m; (f) L = 120 m; (g) L = 140 m; and (h) The pilot tunnel excavation is completed.
Applsci 12 00039 g010
Figure 11. Vault settlement of middle pilot tunnel during pilot tunnel excavation.
Applsci 12 00039 g011
Figure 12. Vault settlement of three pilot tunnels during pilot tunnel excavation.
Applsci 12 00039 g012
Figure 13. Deformation of supporting structure (unit: m): (a) Normal supporting bolt; (b) Advance supporting pipe.
Applsci 12 00039 g013
Figure 14. Vertical deformation of surface and surrounding rock during excavation of main tunnel (unit: m): (a) L = 20 m; (b) L = 40 m; (c) L = 60 m; (d) L = 80 m; (e) L = 100 m; (f) L = 120 m; (g) L = 140 m.
Applsci 12 00039 g014aApplsci 12 00039 g014b
Figure 15. Horizontal deformation of surface and surrounding rock after excavation of main tunnel (unit: m): (a) Y = 40 m; (b) Y = 100 m; (c) Y = 130 m.
Applsci 12 00039 g015
Figure 16. Surface settlement during excavation of the main tunnel.
Applsci 12 00039 g016
Figure 17. Vertical deformation of vault lining during main tunnel excavation (unit: m): (a) L = 20 m; (b) L = 40 m; (c) L = 60 m; (d) L = 80 m; (e) L = 100 m; (f) L = 120 m; (g) L = 140 m; (h) Excavation of right tunnel to 130 m; (i) The main tunnel excavation is completed.
Applsci 12 00039 g017
Figure 18. Vault settlement of the main tunnel.
Applsci 12 00039 g018
Figure 19. Deformation monitoring point of the middle partition wall.
Applsci 12 00039 g019
Figure 20. Displacement of middle partition wall at different sections (unit: m): (a) Y = 20 m; (b) Y = 40 m; (c) Y = 60 m; (d) Y = 80 m; (e) Y = 100 m; (f) Y = 120 m; (g) Y = 140 m.
Applsci 12 00039 g020
Figure 21. Torsional deformation of the middle partition wall.
Applsci 12 00039 g021
Figure 22. Vertical deformation of underground pipelines.
Applsci 12 00039 g022
Table 1. Model material parameters.
MaterialDensity (kg/m3)Elastic Modulus (MPa)Poisson’s Ratio Frictional Angle (°)Cohesive Force (kPa)Coefficient of Permeability
(10−6 m·s)
Thickness (m)
Miscellaneous fill151010.760.3219.426.852.522~13.46
Completely weathered granite163013.000.3523.449.463.0010
Strongly weathered Diabase1680200.000.330.556.553.0032
Fault fracture zone143018.000.4222.026.9516.025
Pipeline140020000.340.01
Contact surfacesKn = 964.7Ks = 964.730.4242
The pilot tunnel lining250025,0000.230.24
Inverted arch initial support260034,000.000.150.3
Partition 250030,000.000.20
Primary lining260034,000.000.150.3
Secondary lining255032,000.000.150.22
Publisher’s Note: MDPI stays neutral with regard to jurisdictional claims in published maps and institutional affiliations.