Article

Atlas-Based Evaluation of Hemodynamic in Ascending Thoracic Aortic Aneurysms

1
Department of Engineering, Università Degli Studi di Palermo, Viale delle Scienze, 90128 Palermo, Italy
2
Department for the Treatment and Study of Cardiothoracic Diseases and Cardiothoracic Transplantation, IRCCS-ISMETT, 90100 Palermo, Italy
3
Radiology Unit, Department of Diagnostic and Therapeutic Services, IRCCS-ISMETT, 90100 Palermo, Italy
*
Author to whom correspondence should be addressed.
Appl. Sci. 2022, 12(1), 394; https://doi.org/10.3390/app12010394
Submission received: 25 November 2021 / Revised: 30 December 2021 / Accepted: 30 December 2021 / Published: 31 December 2021

Abstract

:
Atlas-based analyses of patients with cardiovascular diseases have recently been explored to understand the mechanistic link between shape and pathophysiology. The construction of probabilistic atlases is based on statistical shape modeling (SSM) to assess key anatomic features for a given patient population. Such an approach is relevant to study the complex nature of the ascending thoracic aortic aneurysm (ATAA) as characterized by different patterns of aortic shapes and valve phenotypes. This study was carried out to develop an SSM of the dilated aorta with both bicuspid aortic valve (BAV) and tricuspid aortic valve (TAV), and then assess the computational hemodynamic of virtual models obtained by the deformation of the mean template for specific shape boundaries (i.e., ±1.5 standard deviation, σ). Simulations demonstrated remarkable changes in the velocity streamlines, blood pressure, and fluid shear stress with the principal shape modes such as the aortic size (Mode 1), vessel tortuosity (Mode 2), and aortic valve morphologies (Mode 3). The atlas-based disease assessment can represent a powerful tool to reveal important insights on ATAA-derived hemodynamic, especially for aneurysms which are considered to have borderline anatomies, and thus challenging decision-making. The utilization of SSMs for creating probabilistic patient cohorts can facilitate the understanding of the heterogenous nature of the dilated ascending aorta.

1. Introduction

Ascending thoracic aortic aneurysm (ATAA) is a permanent dilatation of the aortic wall, with risk stratification based on the maximum aortic diameter measured by diagnostic imaging [1]. Elective repair of ATAAs is carried out for aortic diameter ≥ 50 mm, but aggressive management in case of predisposing risk factors as the bicuspid aortic valve (BAV) and hypertension is recommended [2]. If the aortic dilatation is not surgically treated, the risk of aneurysm rupture or dissection can be as high as 50% in patients with aortic diameter > 50 mm [3]. The estimated incidence of ATAAs is 5.0 per 100,000 individuals per year [4], and individuals with BAV have greater risk of aortic dilatation at young age than patients with the morphological normal tricuspid aortic valve (TAV) [2]. However, the maximum aortic diameter criterion is widely recognized as a poor prognostic biomarker of the likelihood of aneurysm complications as it fails to predict acute events in small-sized ATAAs. There is, therefore, a general consensus on the need for the development of new risk stratification strategies not only based on the aortic size, and this is a consequence of the awareness of aneurysm heterogeneity presenting different patterns of aortic dilatation (i.e., the aortic root phenotype, the tubular aorta, and the diffusive involvement of the aortic dilatation) and bicuspid phenotypes (i.e., the anterior–posterior cusp fusion or the right–left cusp fusion) [5].
Population-based modeling has been adopted to meaningful effect in biomechanics by capturing the impact of the patient-to-patient anatomical variations on both cardiac [6,7,8] and vascular disease progression and development [9,10,11]. Statistical shape modeling (SSM) has the potential to address the challenging quantification of the complex nature of the aneurysm disease over time. The development of a computational atlas of image-based shapes allows a quantitative and qualitative evaluation of the anatomic variability as a descriptor of all geometrical shape information and its variations around a mean shape or template. The aortic shape variation is decomposed into a few key components using principal component analysis (PCA) to identify specific anatomic features for a given patient population. Once the shape atlas is built, the mean template can be virtually deformed from low −3 standard deviation (σ) to high 3 σ values of each shape mode to visualize the anatomical shape boundaries. The understanding of the mechanistic link between the shape and function can reveal important insight not only on the aneurysm disease, but also for the development of novel risk metrics not based on the aortic size [12,13]. According to Laplace’s law, the large ATAA wall experiences a greater level of intramural stress than a nonaneurysmal aorta [14]. The intramural stress was demonstrated to provide better predictive capability than the aortic size [15,16], even in the classic versus the bovine aortic arch [17]. Computational flow analyses have also evinced different patterns of fluid shear forces and eccentric flow in ATAAs with different morphological features [18,19] and valve phenotypes [20]. In the setting of the aortic arch coartaction, SSM was used to assess the link between shape features and biomechanical descriptors [9] as well as detect shape cluster of patients at high risk of complications [21].
The overall goal of the present study is to carry out an atlas-based disease assessment of the computational flow dynamic of the dilated ascending aorta. An SSM was created to parametrize the aortic shape and its variability to consider different aneurysm patterns and aortic valve phenotype (i.e., the BAV ATAA versus the TAV ATAA). For each patient group, the mean shape was deformed upon the first three principal shape modes, and then the relationship between shape and computational flow parameters was investigated to quantify the hemodynamic in borderline aneurysm geometries.

2. Materials and Methods

2.1. Patient Study Population

The ATAA shape variability was investigated for a total of n = 106 patients with different patterns of aortic dilatations and valve morphologies. Patients underwent computed tomography angiography (CTA) for aortic size evaluation as part of their care. All imaging and clinical data were subjected to internal review board approval while informed consent was collected for each patient. Patients were discerned into a first group (n = 53) with TAV ATAAs and a second group (n = 53) of BAV ATAAs with both the anterior–posterior and right–left cusp valve fusion types. Exclusion criteria were the presence of left ventricular dilatation, severe aortic stenosis and regurgitation, evidence of uncontrolled stage II/III hypertension, or mitral and cardiac congenital diseases, as documented in previous studies [22,23]. Patient demographics and clinical data were collected for each patient (Table 1).

2.2. ATAA Reconstruction

CTA scans at systolic peak were segmented by means of semiautomatic thresholding and manual mask editing techniques implemented in the medical imaging software (Mimics v21, Materialise, Leuven, Belgium) [24,25,26,27]. Postprocessing of model masks was performed imposing smoothing and wrapping algorithms to soften the 3D ATAA surface. Models involved the valve morphology at fully opened shape, but the three supra-aortic branches (i.e., the brachiocephalic trunk, left common carotid artery, and left subclavian artery) were not included in the segmentation process. This was carried out to highlight the shape variability of the ascending aortic segment and avoid any unrelated geometric variability altering the subsequent operations of alignment and registration.

2.3. SSM Approach

The mean aortic shape of TAV ATAA and BAV ATAA groups and their variations around the mean were computed by SSM using a custom script in MATLAB (R2020, MathWorks Inc., Natick, MA, USA) [10]. In brief, ATAA models were resampled at sufficient resolution to quantify all shape features. Then, an iterative closest-point algorithm was adopted to pair and align each sampled point of the aneurysm surface with the reference shape. The latter was identified as the closest shape to the mean aortic diameter of our patient population (see Table 1). Alignment was accomplished by transformations minimizing the overall distance among aortic surface pairs and was repeated until the template shape significantly reduced its bias to the initial reference shape.
The aligned aneurysm models were used for the PCA methodology to reduce the complex 3D shape variability into few components or “shape modes”, which numerically represent a linear space of maximum variation directions with data projection through orthogonal transformations [6]. The eigenvectors of the covariance matrix represented the principal component modes, and the corresponding eigenvalues indicated the proportion of the total variance explained by each shape mode [6]. The deformation of the mean patient template from low (−3 σ) to high (+3 σ) standard deviations of each mode’s deformation provided the geometrical influence of each shape mode [11]. The major contribution of data variability was quantified by the first mode, and each succeeding modes held the highest residual variance possible of specific anatomical features of aneurysm shape variability.

2.4. Computation Flow Analysis
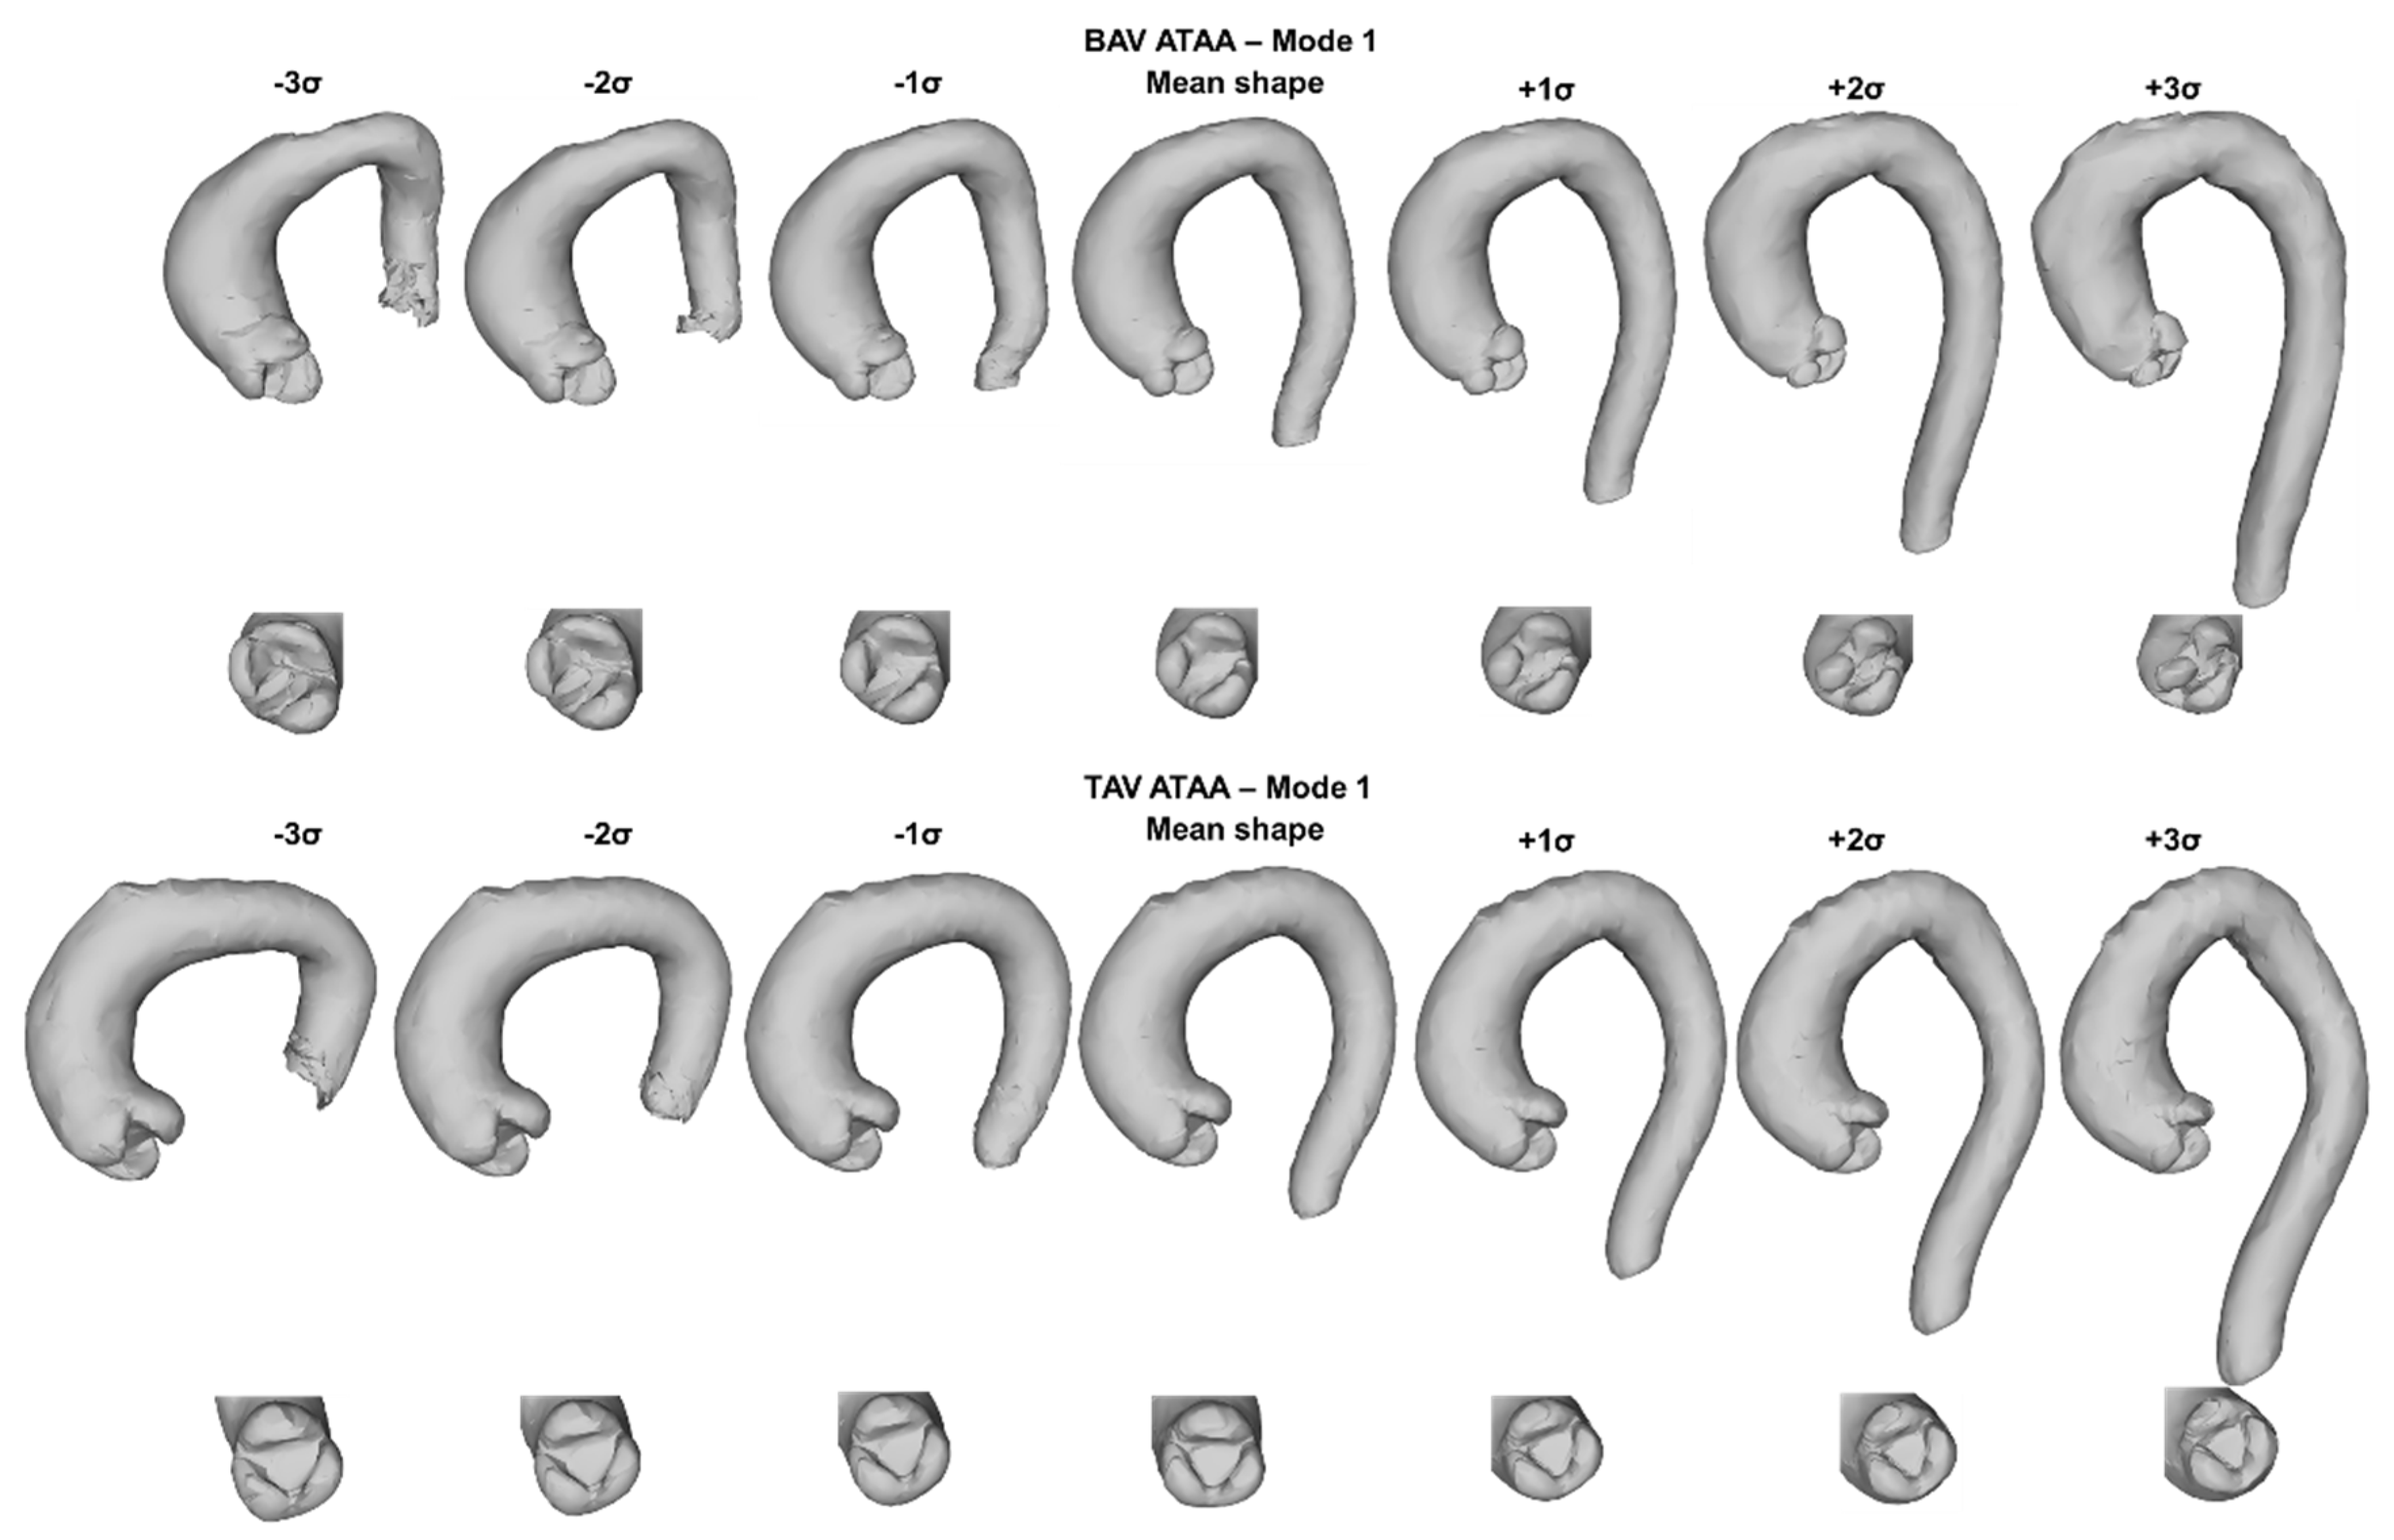
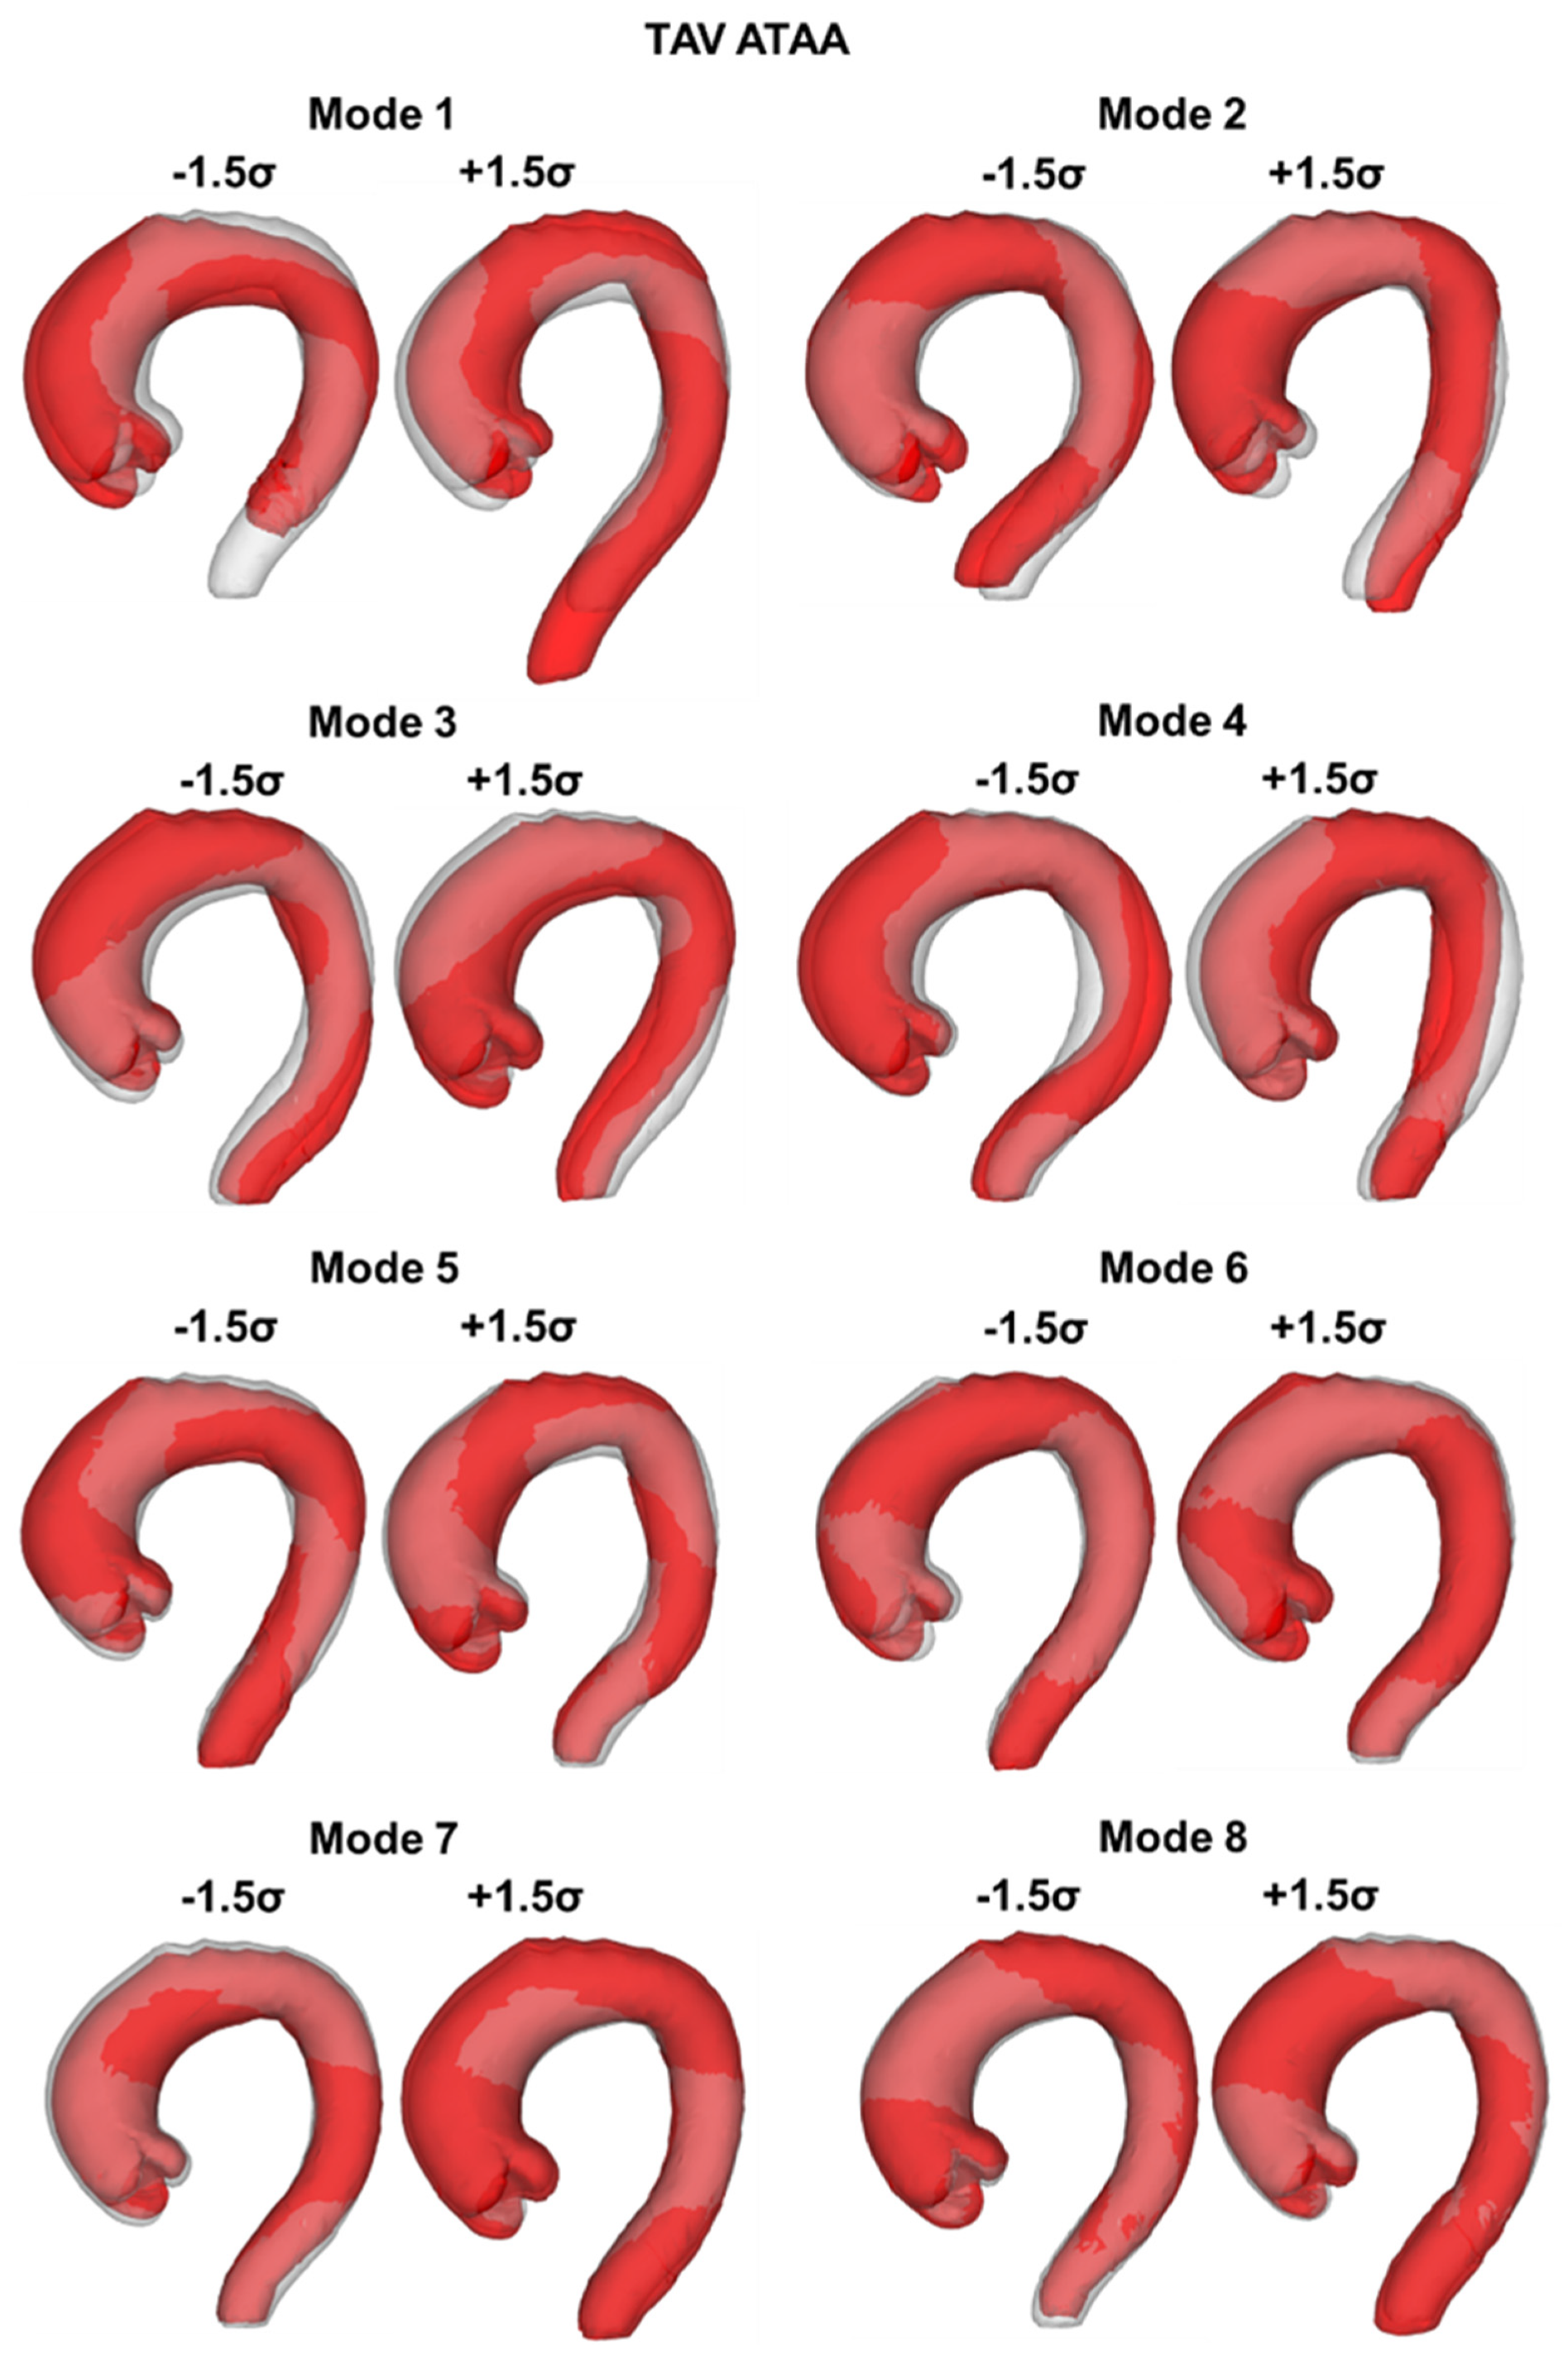
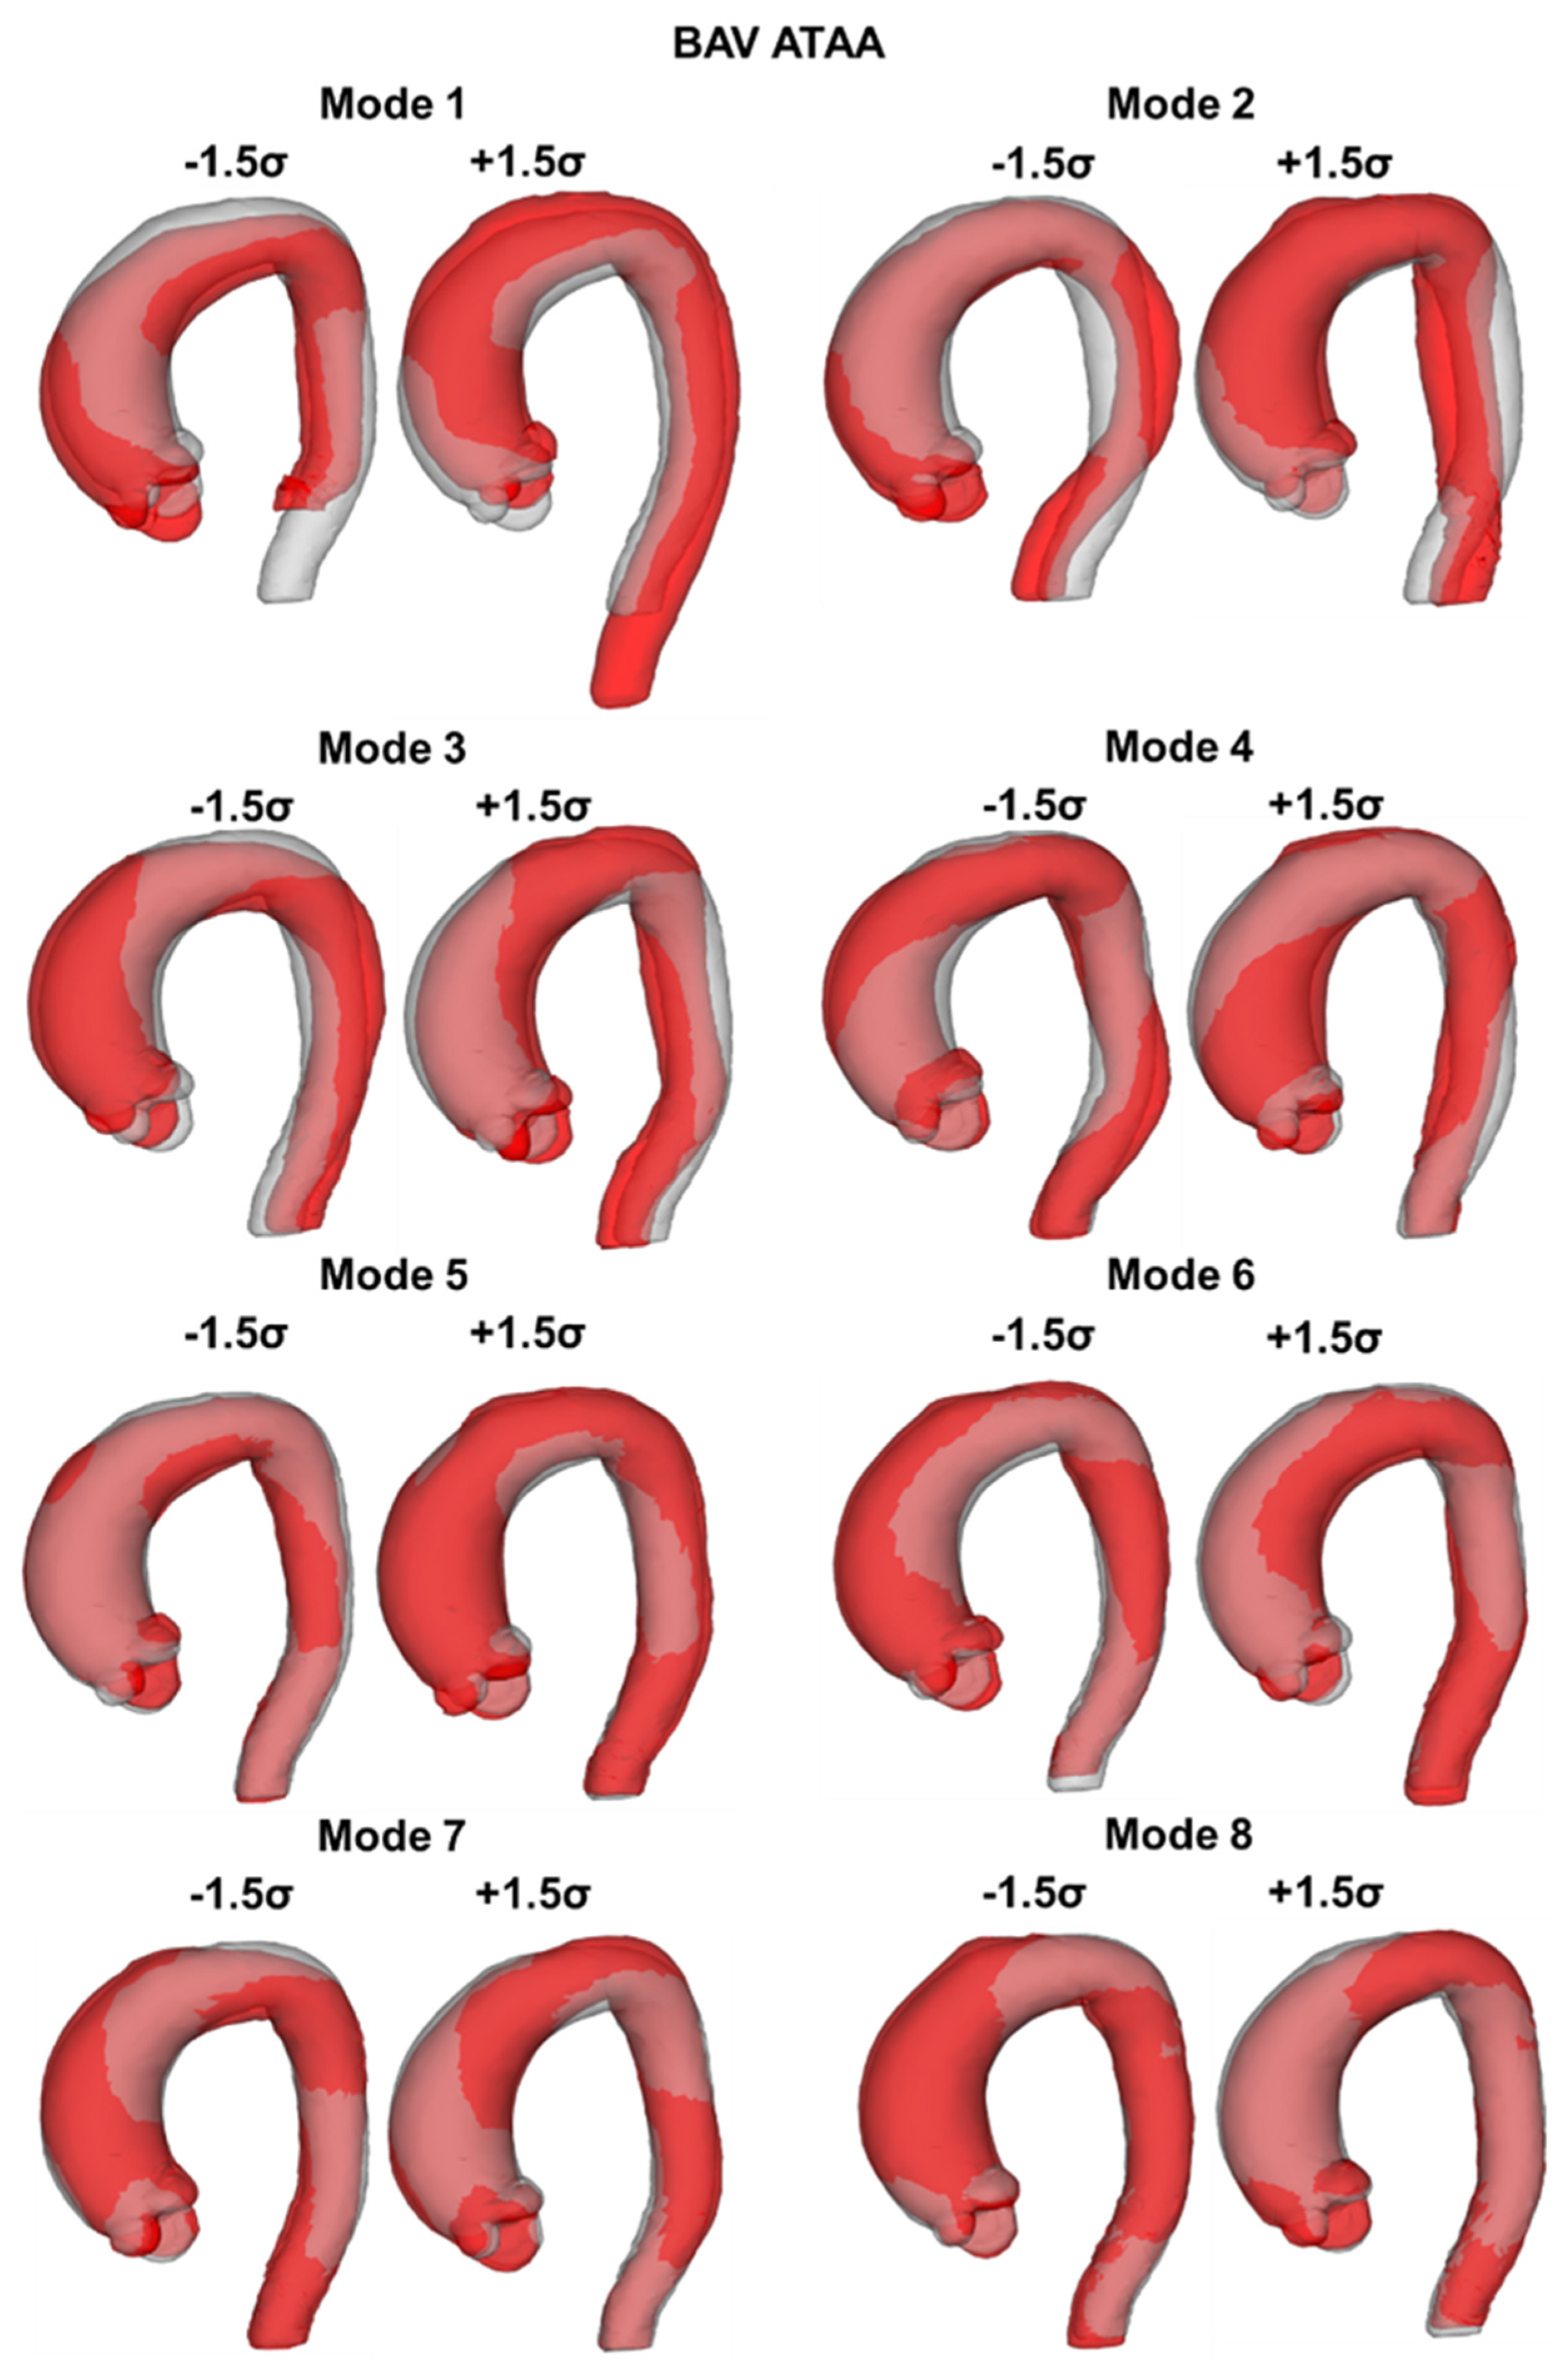
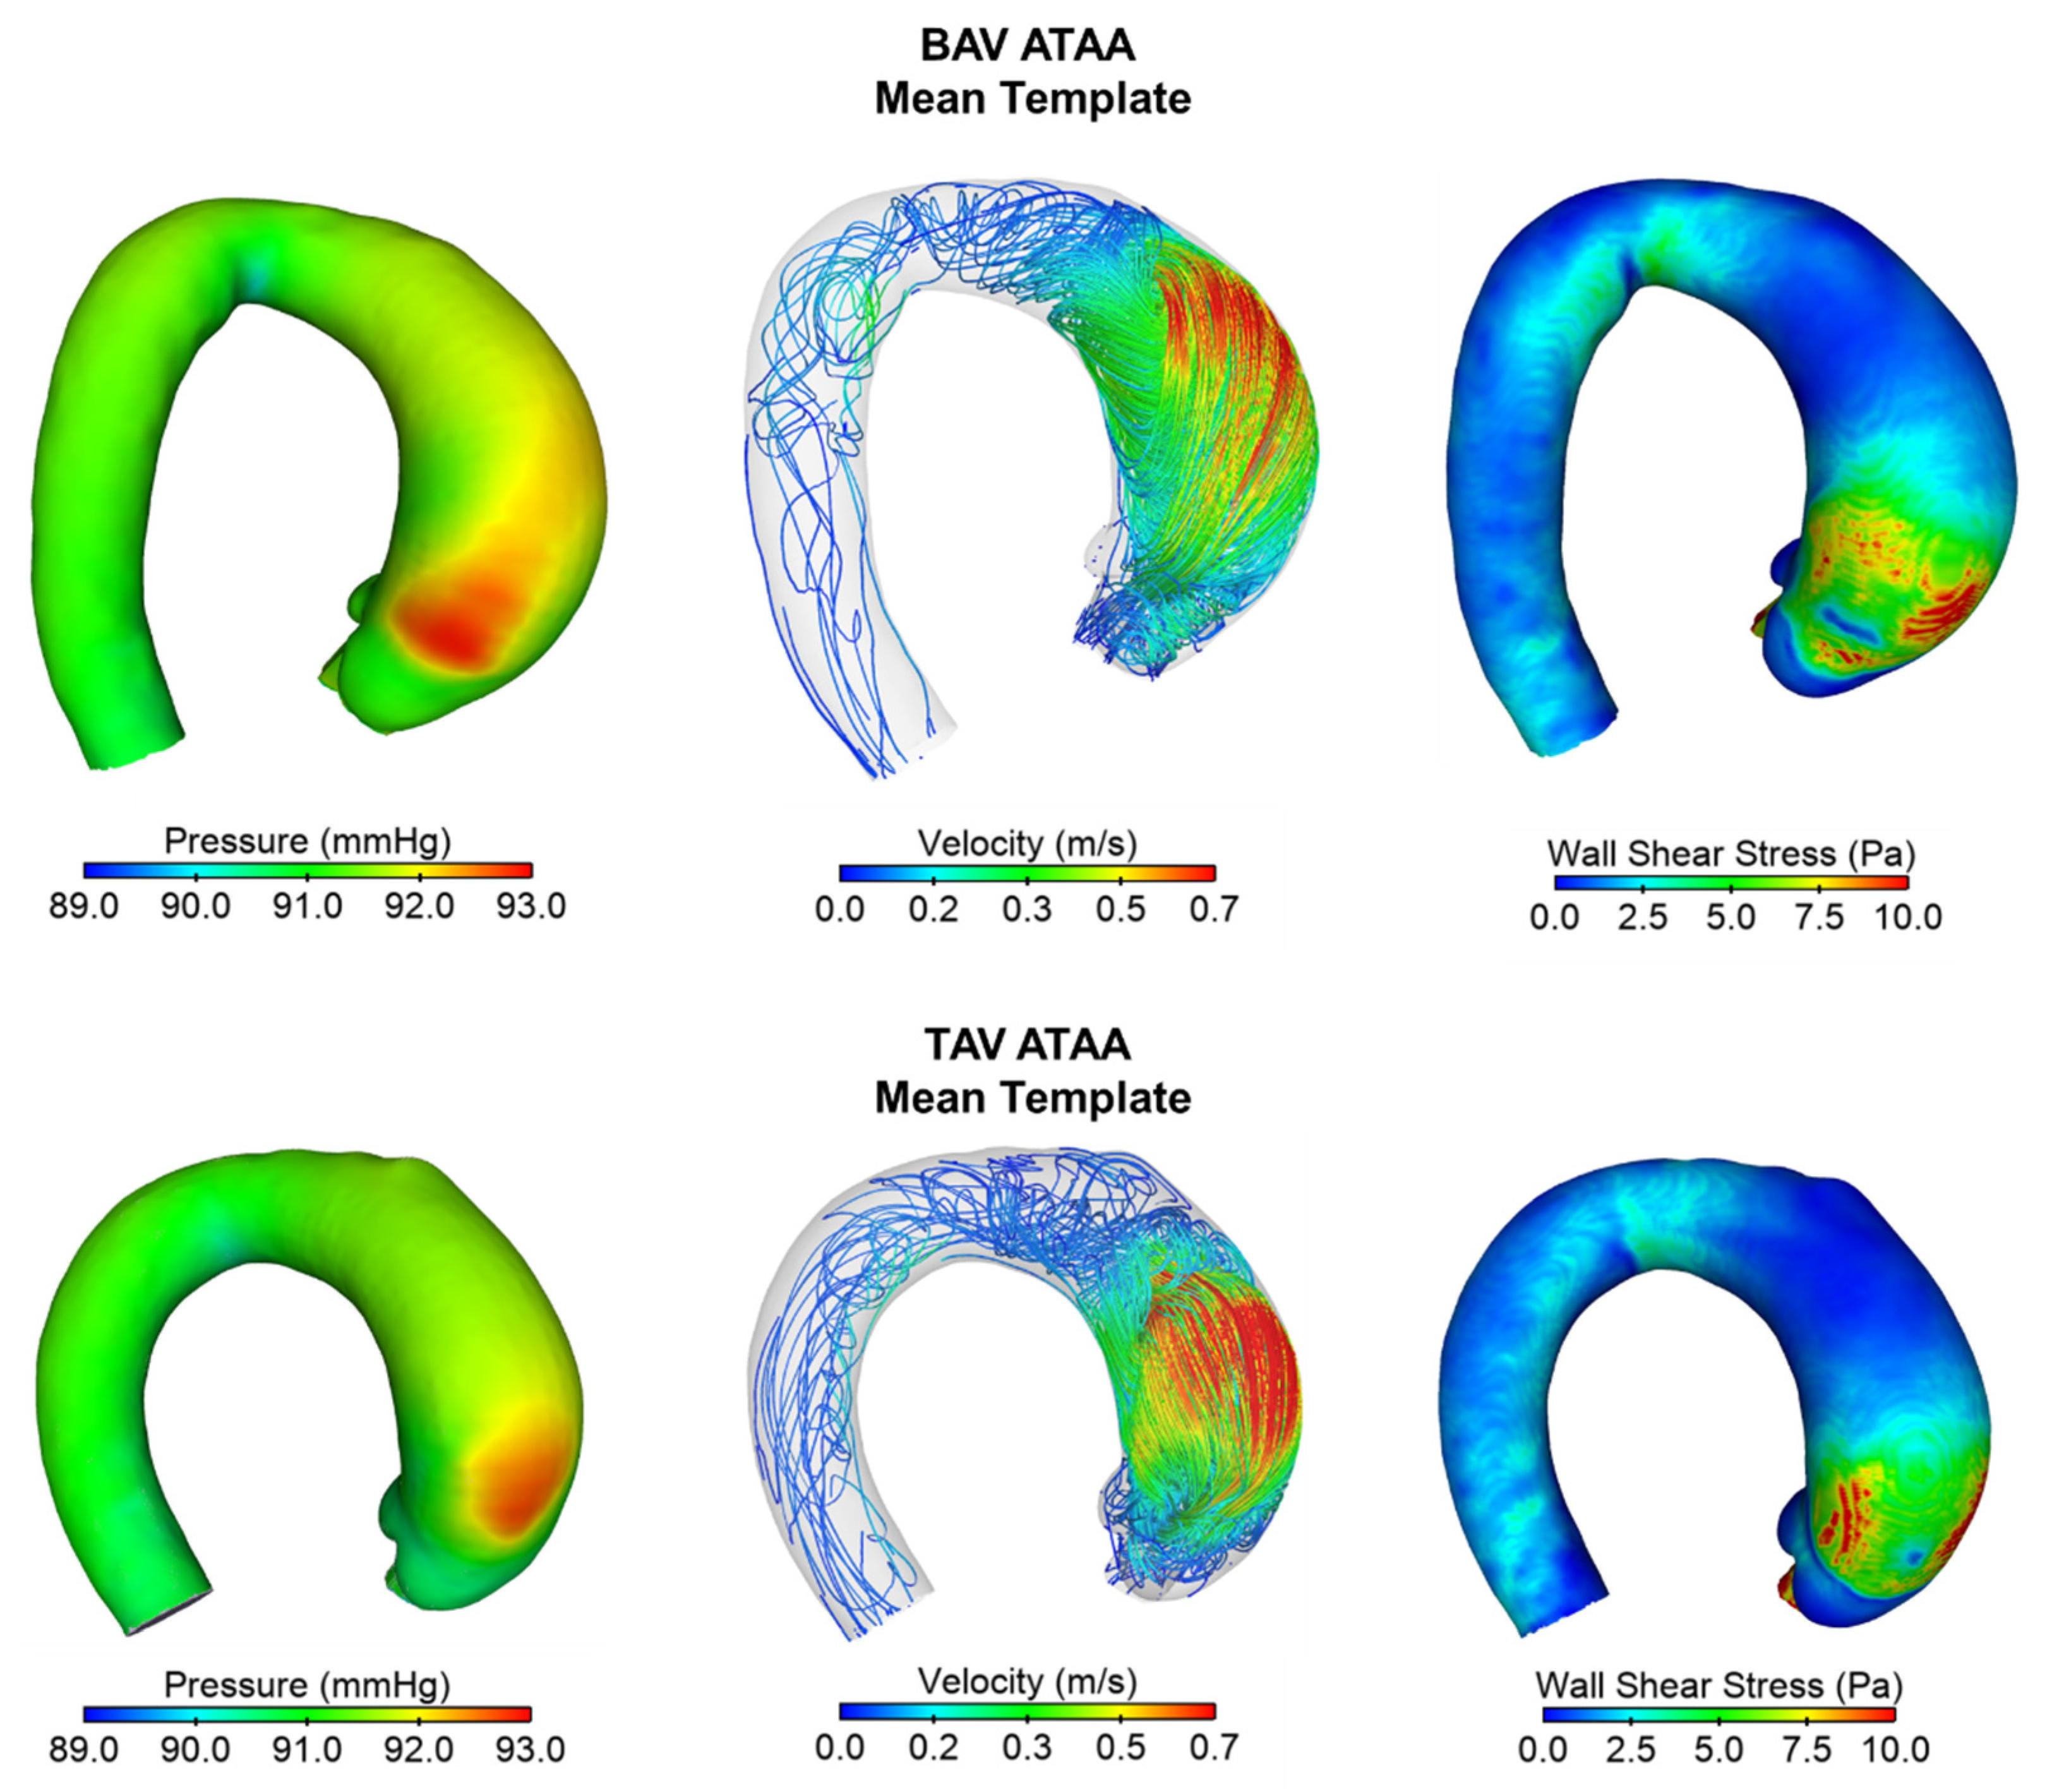
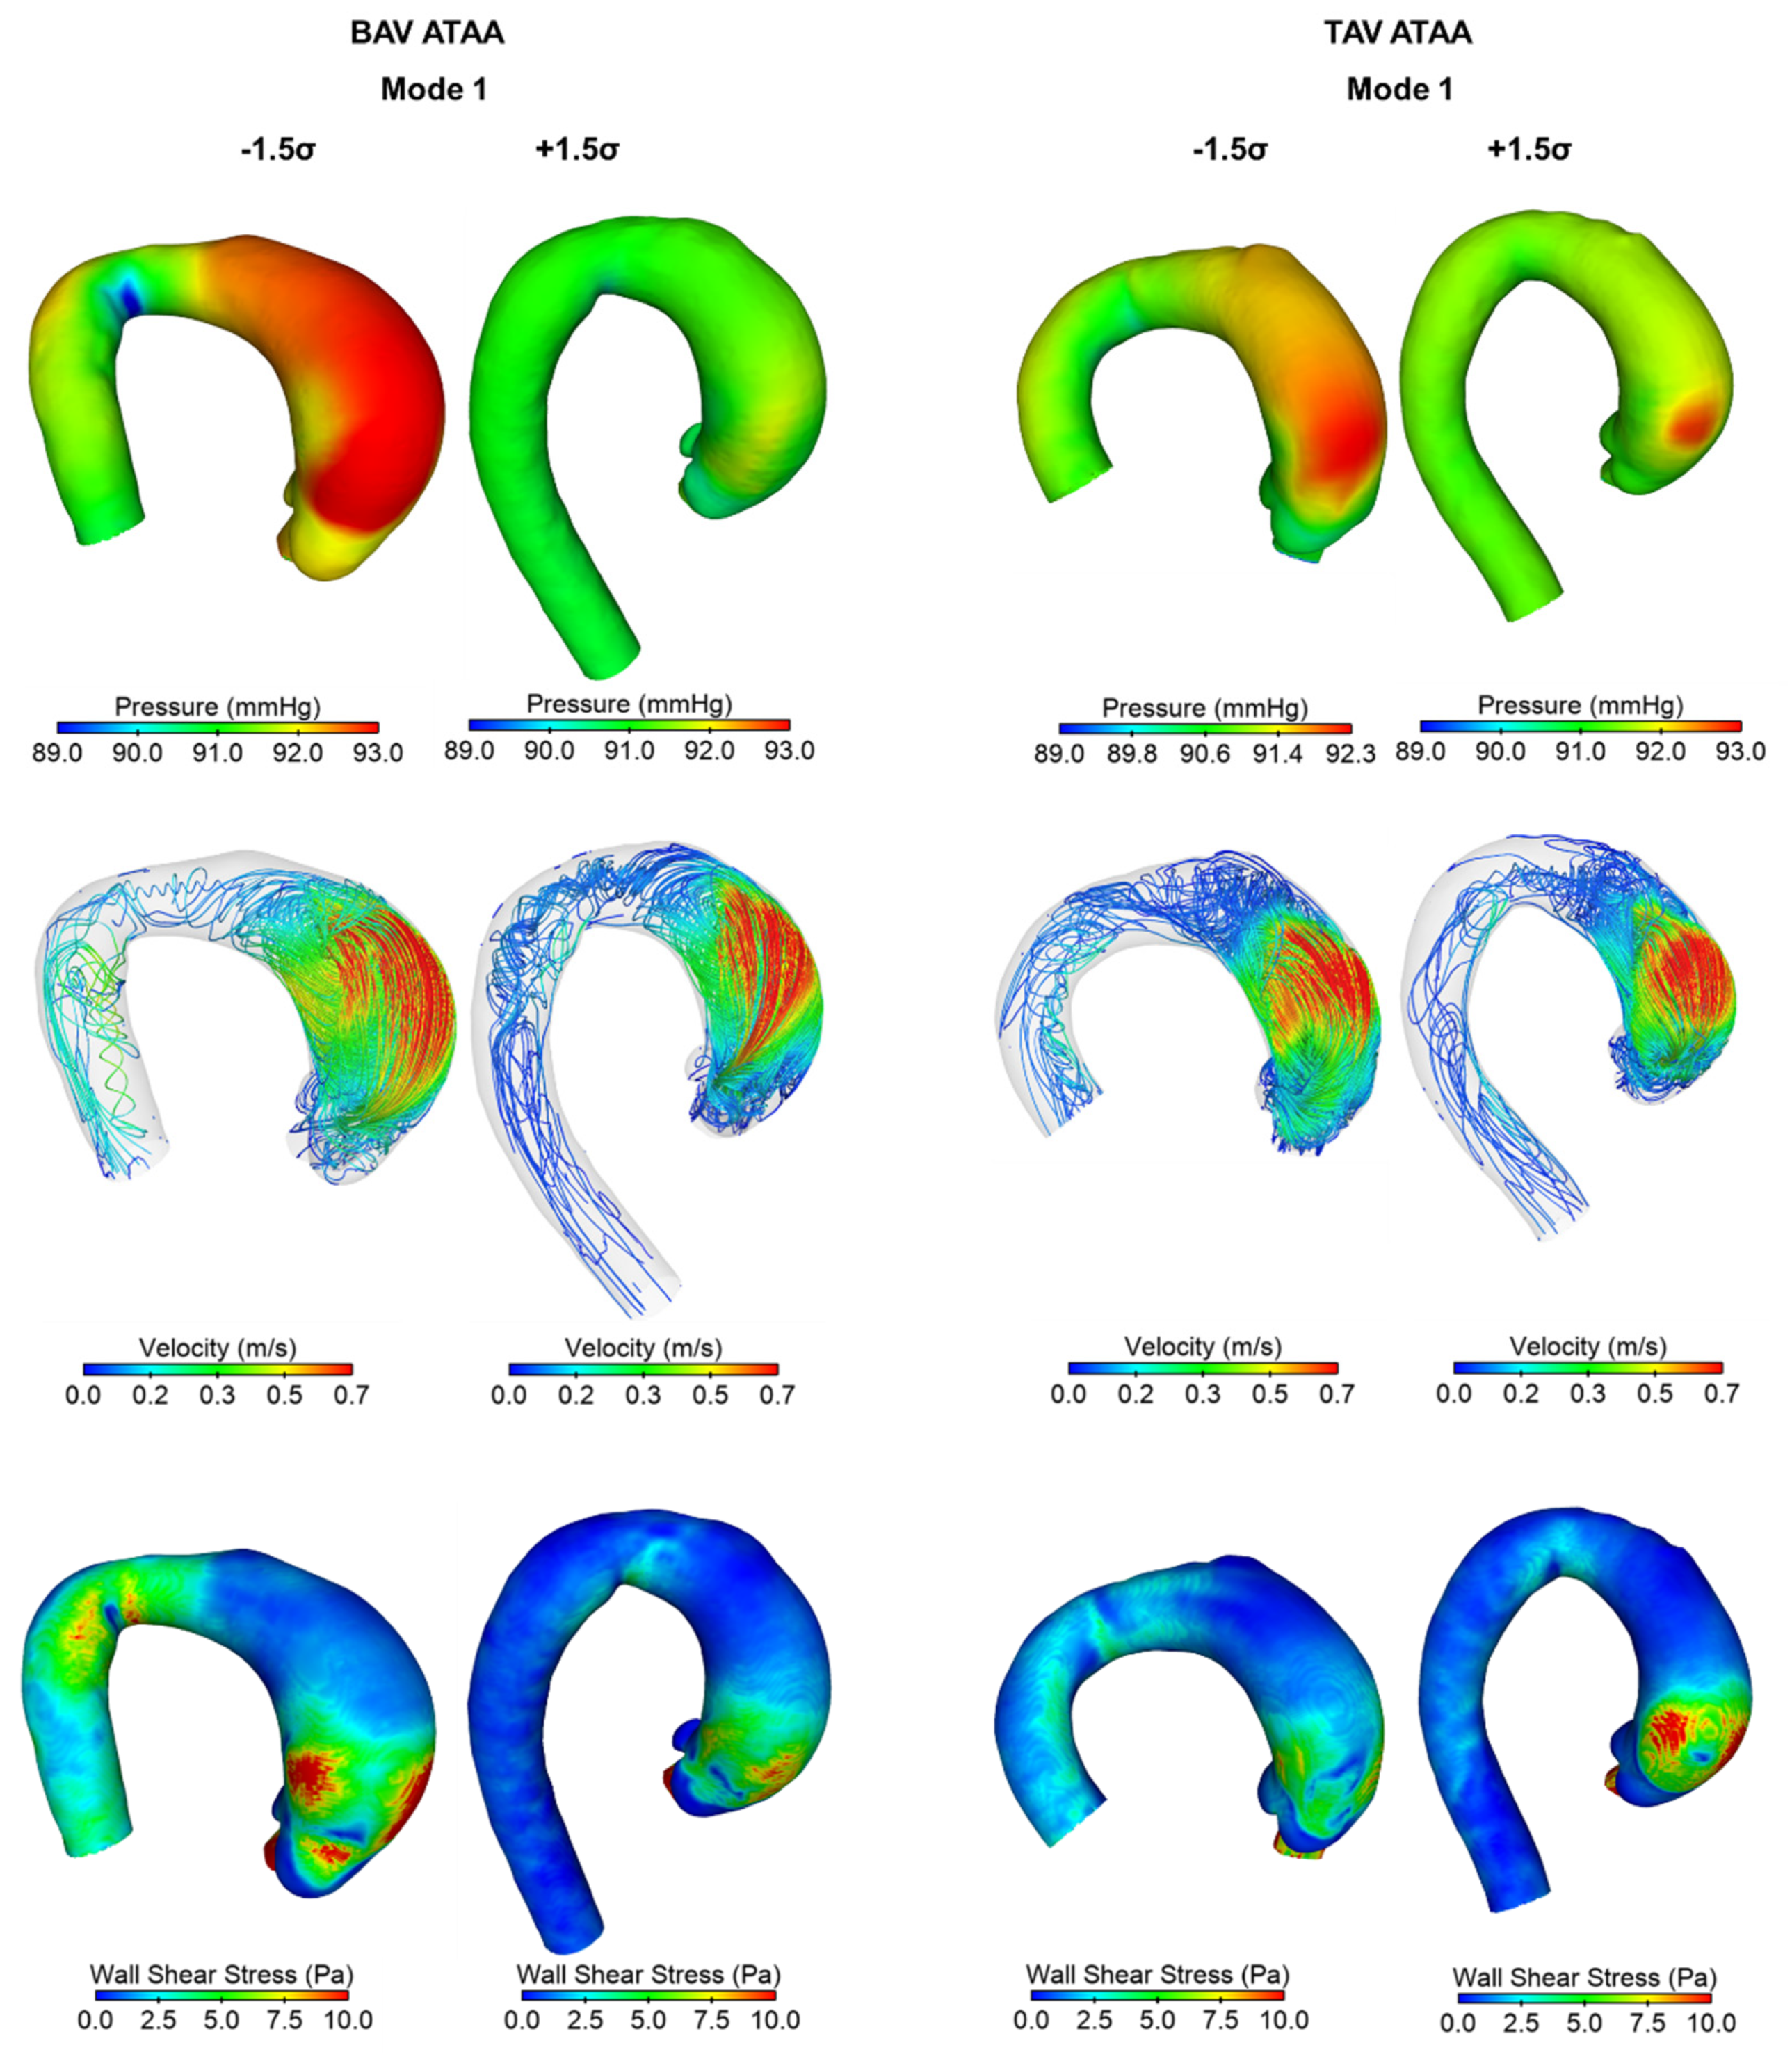
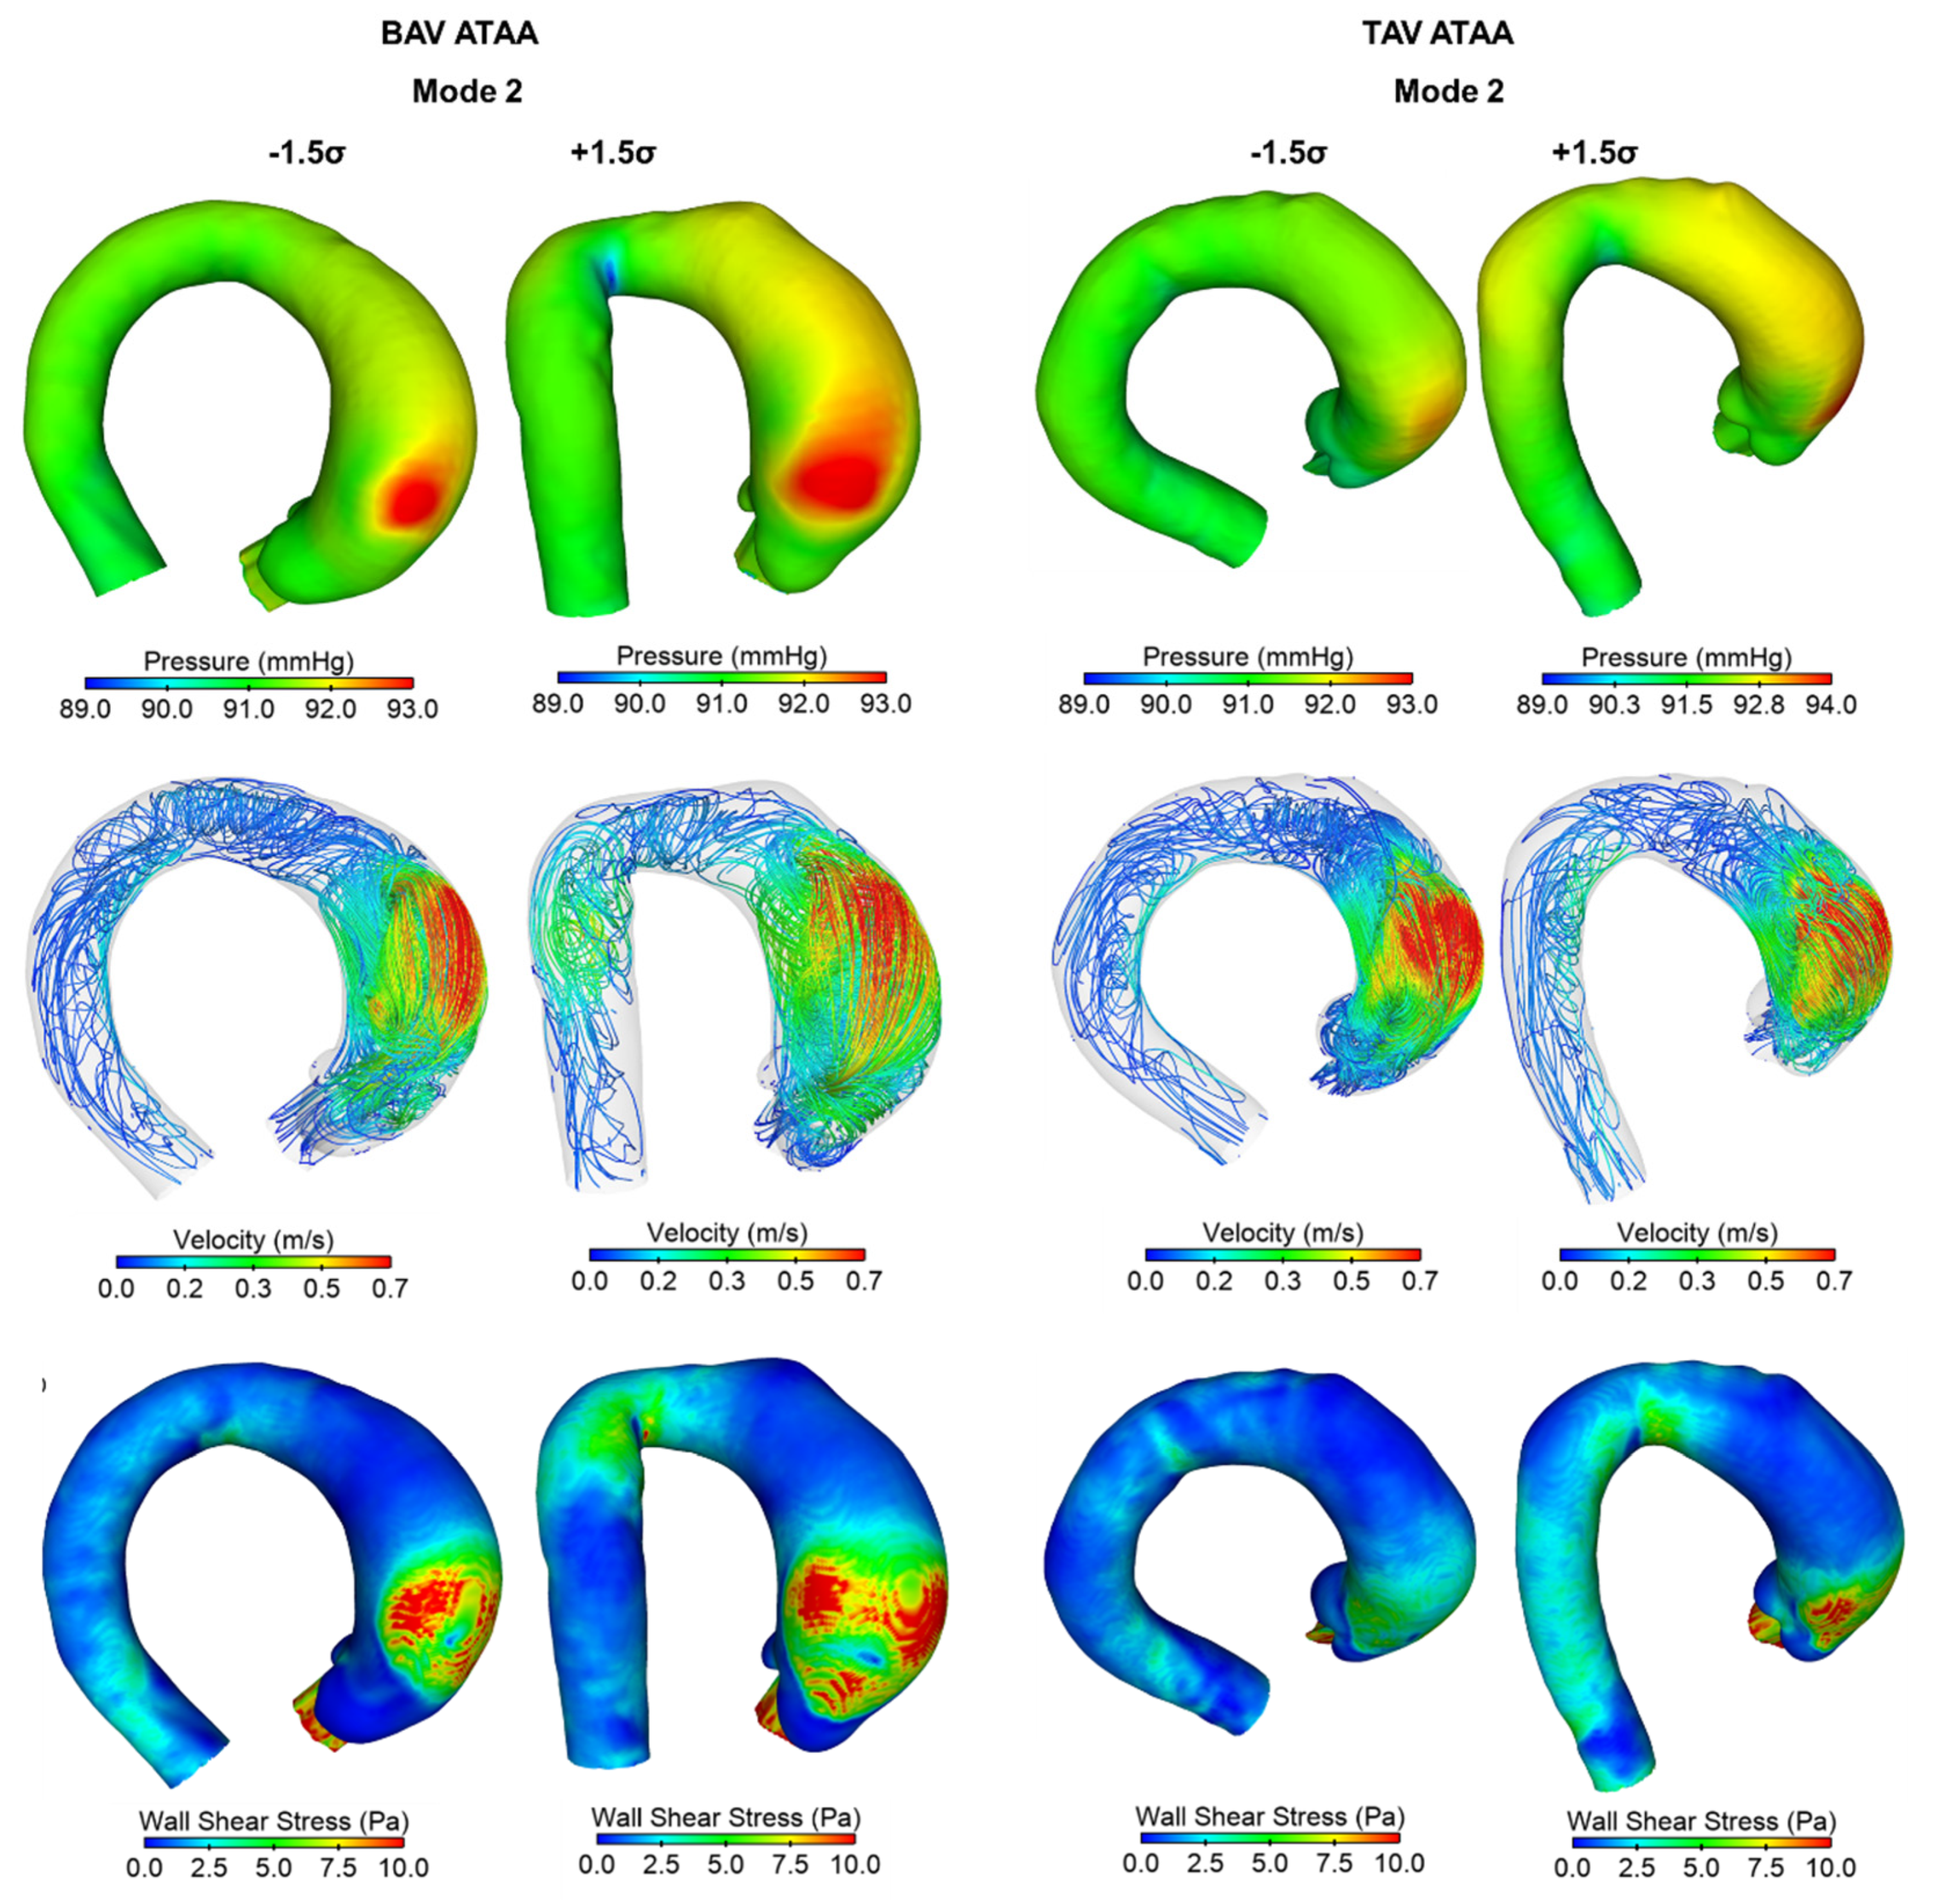
Once the SSM for both TAV ATAA and BAV ATAA groups was developed, the first three shape modes were deformed with respect to the mean shape in order to quantify the aneurysm-related hemodynamic by computational flow analysis [28,29]. To avoid excessive distortion and ensure computational stability, we deformed the mean shape upon a shape boundary of ±1.5 σ for the first three modes. We decided to include the first three modes to assess the impact of 80% shape variability on the resulting flow dynamic. After deformation of the mean template, the resulting shape was used to generate several models, each representing a few borderline aneurysm case scenarios. The model was meshed with unstructured tetrahedral elements and element size near the aortic wall of 0.4 mm, approximately.
Unsteady transient simulations were carried out assuming the blood as a laminar non-Newtonian flow with viscosity portrayed by the Carreau model and density of 1060 kg/m3 [30]. The blood flow was assumed to be laminar as this usually occurs in large vessels due to the low mean flow velocity. For the BAV ATAA template model, we found an average Reynolds number of 1434 at mid-height of the ascending aorta. Though the Reynolds number is low, the composition of the fluid could lead to different flow regimes such as the laminar–turbulent and the fully developed transitional regimes. In the areas of changes in the fluid flow direction, the acceleration field could lead to the separation of the dense part of the blood by modifying the velocity profile. The Navier–Stokes equations governing fluid motion were solved with an implicit algorithm in FLUENT v21 (ANSYS Inc., Canonsburg, PA, USA), using the SIMPLE pressure–velocity coupling algorithm and second-order pressure interpolation method. Numerical solution was assumed to converge with the residual of the continuity equation set at 10−7 at all-time steps. The optimal time step was 0.0025 s as determined by time independency assessment. For the inflow, all models were set with a representative parabolic flow profile with fundamental frequency of 1 Hz and peak velocity of 1.2 m/s, as described previously [31]. For the descending aorta, the outflow boundary condition was imposed using a three-element Windkessel model with population-average values of the vascular resistance and compliance. Both inlet and outlet were extended three diameters normal to the aorta cross section to ensure a stable flow in the ATAA model. Flow simulations were run for three consecutive cardiac cycles, with result analysis carried out for the last cardiac cycle. Postprocessing was performed using EnSight (v21, ANSYS Inc., Canonsburg, PA, USA) to compute the following flow parameters: (a) flow streamlines at systole, (b) time-averaged blood pressure over one cardiac cycle, and (c) peak systolic wall shear stress (WSS).

3. Results

The trend of shape probability as a function of σ appears to follow a Gaussian distribution, as shown by Figure 1A. Specifically, the shape probability represents the chance that the specific deformed shape will occur for a given value of the shape boundary. This curve evinces that, for shape deviations of 0.5 σ, 1 σ, 1.5 σ, 2 σ, 2.5 σ, and 3 σ, the deformed shape probability is 30.85%, 15.87%, 6.68%, 2.28%, 0.62%, and 0.14%, respectively. Figure 1B shows the scree plot with the cumulative variance described by each SSM for either TAV ATAA or BAV ATAA. For the ATAA patient population here investigated, the PCA demonstrates that 90% of the overall shape variability can be captured by the first seven modes for BAV ATAAs and eight modes for TAV ATAAs.
Each shape mode was correlated to distinct morphological features of the aneurysm and aortic valve type using visual assessment. Figure 2 highlights that Mode 1 accounts for nearly 50% of the overall shape variability and is mainly associated with a proportional aneurysm size change (scale factor) and slightly by aortic arch unfolding. Videos S1 and S2 display an animation of Mode 1 for BAV ATAA and TAV ATAA, respectively. For high values of the shape space, the template deformation shows a long and unfolded geometry of the dilated aorta. In a different way, low values of σ lead to small and unfolded ascending aortic geometries. The aortic valve shows clockwise rotations for TAV ATAAs while BAV ATAAs have high values of the orifice area for low standard deviations and small values for high standard deviations.
Figure 3 and Figure 4 evince the first eight shape modes for both BAV ATAA and TAV ATAA. For both aortic valve morphologies, Mode 2 manifests changes in the aortic aneurysm curvature from highly tortuous aortic shapes to straight aortic segments. Mode 3 indicates variations in the aortic valve phenotypes and accounts for nearly 10% of aneurysm shape variability. The remaining shape modes are associated with the aortic valve rotation and inclination with respect to sagittal and coronal planes, as well as changes in the aortic valve geometry.
Figure 5 illustrates flow parameters for the mean template as obtained by computational flow analyses. For BAV ATAAs, the peak systolic flow velocity has a helical flow pattern characterized by high velocities in the aortic wall periphery and a slow moving flow in the aneurysm centerline. In a different way, the mean template of TAV ATAAs has an uniform flow field distribution at systole. Indeed, flow patterns highlight the effect of different modalities of aortic wall flow impingements, resulting in local changes in the blood pressure and shear forces. Maxima of time-averaged blood pressure are found in the major curvature of the aortic wall for the mean template of TAV ATAAs and near the anterior side of the mean aortic wall template of BAV ATAAs. WSSs are highest in the region between the sinotubular junction and mid-ascending aorta.
Figure 6, Figure 7 and Figure 8 show hemodynamic parameters of BAV ATAA and TAV ATAA atlases from Mode 1 to 3. In all deformed models, the deformation of the mean template upon the shape boundary of ±1.5 σ determines a remarkable difference in the hemodynamic parameters, with key changes according to the aneurysm scale (Mode 1), vessel tortuosity (Mode 2), and aortic valve phenotype (Mode 3). Among different shape modes, the magnitude of WSS evinces the highest changes from low and high shape deviations.

4. Discussion

This study proposed an atlas-based disease assessment by means of computational flow analysis from statistical shape analysis of ATAAs. Using a large number of patients’ CT scans, we developed two SSMs according to the type of the aortic valve morphology to determine the mean shape and its geometrical variation likely caused by the complex nature of the aneurysm disease. Then, the ATAA-related atlases were virtually deformed into possible aneurysm configurations by applying shape deformation to quantify the hemodynamic of critical ATAA geometries. Results highlighted that principal shape modes like the aneurysm size and tortuosity are linked to the flow parameters.. Among these, the systolic WSS exhibited the largest difference between low to high shape deviations. The atlas-based disease evaluation here proposed has demonstrated the ability to reveal the hemodynamic impairment induced by specific aneurysm features and aortic valve phenotypes (i.e., the BAV versus TAV phenotype). This approach can reveal important insights on the aneurysm hemodynamic, especially for patients who are considered to have borderline aneurysm anatomies, and thus challenging clinical decision-making.
BAV and hypertension are common predisposing factors to aneurysm development and progression [2]. The larger the blood pressure is, the higher the intramural stress exerted on the aortic wall. In a different way, bicuspid morphologies can determine hemodynamic disturbances on the diseased aortic wall with differences occurring for the anterior–posterior valve fusion versus the right–left cusp fusion [32]. Several investigations including computational fluid dynamics [19,33], fluid–solid interaction analysis [34], and 4D flow MRI [32,35] have clearly demonstrated the value of the WSS parameter on the weakening of the ATAA wall when combined with biomarker assessment [23,36]. Moreover, clinical evidence has demonstrated varying degrees of aortic dilatation patterns, each with distinct clinical course [37]. This heterogenous manifestation of the aneurysm disease and progression has driven the research of many investigators that developed new classification schemes based on the patterns of ATAA shape (i.e., the tubular dilated aorta versus the aortic root phenotype) and local diameter measurements taken at several anatomic levels of the ascending aorta [38,39]. However, none of the proposed classification schemes showed good prognostic significance because failed to fully capture the 3D configuration of the aneurysmal aorta. Using the atlas-based evaluation of aneurysm disease proposed here, we can observe shape features at a level of detail hitherto impossible with conventional diagnostic imaging. Once the SSM atlas is computed, the impact of morphological features on the resulting hemodynamic parameters can be obtained, deforming the dilated aorta and its valve for developing realistic models built upon real patient geometries. Such an approach has the potential to generate large cohorts of ATAA models that can be used to predict the biomechanical response of the aneurysmal aorta using deep learning techniques, as recently reported by Liang and colleagues [40].
Shape modes in the current SSM were related to computational flow analyses obtained by varying each shape mode upon ±1.5 σ of the mean template. While Modes 1 and 2 (accounting for nearly 70% of total shape variation) represented changes in the ascending aortic geometry, the remaining modes were associated with alterations in the aortic valve morphologies, including the orientation, rotation, and size of the aortic valve. These findings corroborate the PCA-based analysis developed by Casciaro et al. [41] for the healthy aorta. They reported that the main shape contributors are vessel size, aortic arch unfolding, and symmetry. In this study, Mode 1 was found to be the main shape contributor of both the aneurysm diameter and aortic size, thereby impacting the resulting WSS and blood pressure distributions exerted on the weaken aortic wall. For BAV ATAAs, the small aortic model (−1.5 σ) had a 2.5-fold increase in the blood pressure and a 21.4-fold fold increase in the WSS magnitude with respect to those of the large ATAA model (+1.5 σ). Indeed, the shear stress parameter was the variable that exhibited the largest differences among shape boundaries for all investigated shape modes. Similar changes in the distribution of WSS and blood pressure magnitudes were found for TAV ATAAs, suggesting that valve morphologies do not significantly impact aneurysm hemodynamic across different aneurysm dimensions. These relationships between aneurysm size and flow parameters can explain recent clinical findings demonstrating that the ascending aortic length is a valuable prognostic indicator together with aneurysm size for the stratification of the aortic dissection risk. In a large patient study group, Wu and collaborators [42] estimated an odds ratio of 12.4-fold greater in ATAAs with aortic length ≥13 cm (as computed from the aortic annulus to the origin of the innominate artery) compared with ATAAs with length of <9 cm. They concluded that ascending aortic length and aneurysm size, taken together, are more powerful predictors than the aortic diameter alone. It can be observed that these two morphological parameters are indeed representative of Mode 1 shape variations here modeled by the SSM.
For both BAV ATAA and TAV ATAA, Mode 2 reflected variations in the tortuosity of the ascending aneurysmal aorta, being more curved with low deformations of the mean template than high mean-template deformations. The less tortuous ATAA had both blood pressure and WSS with more uniform distributions on the major curvature of the aortic wall as compared to those locally focused on the tortuous ATAA wall. This is likely due to differences in the flow jet impingement between shape boundaries as shown by velocity streamlines. As a consequence, the aneurysmal aorta can manifest local bulging of the ascending aorta, as commonly seen in the clinical practice of ATAA surgery. In a different way, Mode 3 was representative of the aortic-valve cusp fusion imparting different distributions on WSS forces and flow velocities. Computational flow studies [19,33] and 4D flow MRI [32] have widely shown that a right–left fusion pattern can result in a flow jet locally directed towards the right anterior aortic wall. This can result in a nested helical flow with low velocity in the aneurysm axis and high velocity in the ATAA wall periphery (see Figure 8). Our computational flow analysis performed for Mode 3 with +1.5 σ estimated a flow jet towards the posterior aorta, with increased shear stress values at the right posterior side of the aorta as compared to those resulting from the flow impingement on the anterior aorta (i.e., shape space of −1.5 σ). These alterations in the spatial distribution of flow parameters are a consequence of changes in the valve orientation, as depicted by Mode 3, and likely determine differences in aneurysm progression and, ultimately, patient outcome. Though the mechanistic link between WSS and vascular weakening has been demonstrated in ATAAs [23,36], the correlation of ascending aortic dilatation rates with BAV phenotypes has not been fully addressed. Propagation patterns of BAV-induced hemodynamic disturbances are still not uniform in patients with BAV with the same valve cusp fusions, and this could be in part due to patient selection criteria and the effect of confounding clinical and demographic variables [43].
Though the proposed SSM method was developed to be used for population-based computational flow analyses, there are several limitations. The PCA method used in this investigation has limitations for accurately capturing shape variations with excessive rotation and bending. This can be observed by the presence of wrapping and distortion effects seen in the distal descending aorta when deformations are at high boundary of the shape space (i.e., ±3 σ). Based on these observations, the PCA method provided acceptable models with ±1.5 σ, as represented by a 6.68% chance to obtain the deformed aneurysm configuration. For high shape deviations, the resulting model can likely influence the computational flow stability because of mesh distortion and negative element volume associated with distorted geometries. For SSM with 2D shapes [44], the PCA method was demonstrated to generate unrealistic geometries when the Mode 1 was varied to three standard deviations above the mean shape. As reported by Cosentino et al. [10], shape vectors for each patient with ATAA can be obtained from PCA and then used to assess the correlation between morphological features (i.e., aortic size and tortuosity) and biomechanical functional parameters (i.e., WSS). In this study, the SSM was adopted to generate a virtual patient cohort and assess the hemodynamic in borderline ATAA shapes. The current SSM method is also specific to develop computational flow modeling. In this study, the supra-aortic vessels were removed to avoid bias in the alignment of ATAA models and prevent the assessment of shape variations related to patient-to-patient differences in supra-aortic vessel geometries (i.e., the classic versus the bovine aortic arch). This assumption can likely change the resulting hemodynamic environment of the ascending aorta. There are also potential improvements in the proposed methodology with regards to the boundary conditions. For all shape modes, we used standards inflow and outflow profiles by neglecting the difference in the patient physiology. In a previous investigation, statistically significant correlations were found between shape modes and functional parameters collected from Doppler ultrasound [10]. Thus, established probabilistic methods can be adopted to estimate boundary conditions from probability distributions and thus tailor more realistic inflow and outflow profiles to each shape mode [44]. Moreover, the solution of the fluid-governing equations is time-consuming, so simulations were carried out for the first three shape modes (i.e., a total of 14 simulations). As a standard computational fluid dynamic approach was used, the aortic valve was assumed as rigid and segmented at fully opened shape from CT scan at systole. In future studies, for realistic flow simulation, fluid–solid interaction will be used to simulate the motion of the aortic valve during the cardiac beating. In a different way, the ATAA leads to stiffening of the aortic wall so that the assumption of a rigid aortic wall is reasonable, as reported in numerical comparison between computational fluid dynamic and fluid–solid interaction techniques [45,46]. It is known in SSM that shape modes representing a relatively small percent of the total variation could have a large effect on the resulting biomechanics, though high modes are influenced by noise due to imaging and segmentation processes. Future studies can be undertaken to fully investigate the flow disturbances for high shape deformations and thus capture the influence of key anatomic features.

5. Conclusions

Atlas-based disease quantifications by computational flow dynamics derived from SSM can represent a valuable tool to reveal insights on the hemodynamic alterations induced by shape and aortic valve variations of the aneurysmal ascending aorta. Remarkable differences were found on the flow patterns, blood pressure, and fluid shear forces when the mean ATAA template was deformed upon a shape boundary of ±1.5 σ. Among flow parameters, the WSS parameter highlighted the highest changes among shape boundaries. The approach presented here can facilitate the use of probabilistic computational tools to study the heterogenous nature of ATAAs in the future.

Supplementary Materials

The following are available online at https://www.mdpi.com/article/10.3390/app12010394/s1, Video S1: Animation of Mode 1 for BAV ATAAs. Video S2: Animation of Mode 1 for TAV ATAAs.

Author Contributions

Conceptualization, M.P. and S.P.; methodology, C.C. and V.A.; software, C.C.; validation, G.G., G.M.R., and M.P.; formal analysis, S.P.; resources, S.P.; data curation, V.A., G.G., and G.M.R.; writing—original draft preparation, C.C., V.A., G.G., G.M.R., M.P., and S.P.; writing—review and editing, C.C., V.A., G.G., G.M.R., M.P., and S.P.; funding acquisition, S.P. All authors have read and agreed to the published version of the manuscript.

Funding

This work was supported by a “Ricerca Finalizzata” grant from the Italian Ministry of Health (GR-2011-02348129) to Salvatore Pasta.

Institutional Review Board Statement

The study was conducted according to the guidelines of the Declaration of Helsinki and approved by the Institutional Review Board of ISMETT (protocol code IRRB/04/04 and date of approval 14.04.20).

Informed Consent Statement

Informed consent was obtained from all subjects involved in the study.

Conflicts of Interest

The authors declare no conflict of interest.

References

  1. Elefteriades, J.A.; Farkas, E.A. Thoracic aortic aneurysm clinically pertinent controversies and uncertainties. J. Am. Coll. Cardiol. 2010, 55, 841–857. [Google Scholar] [CrossRef] [PubMed]
  2. Verma, S.; Yanagawa, B.; Kalra, S.; Ruel, M.; Peterson, M.D.; Yamashita, M.H.; Fagan, A.; Currie, M.E.; White, C.W.; Wai Sang, S.L.; et al. Knowledge, attitudes, and practice patterns in surgical management of bicuspid aortopathy: A survey of 100 cardiac surgeons. J. Thorac. Cardiovasc. Surg. 2013, 146, 1033–1040.e4. [Google Scholar] [CrossRef] [PubMed] [Green Version]
  3. Pape, L.A.; Tsai, T.T.; Isselbacher, E.M.; Oh, J.K.; O’Gara, P.T.; Evangelista, A.; Fattori, R.; Meinhardt, G.; Trimarchi, S.; Bossone, E.; et al. Aortic diameter ≥5.5 cm is not a good predictor of type A aortic dissection—Observations from the international registry of acute aortic dissection (IRAD). Circulation 2007, 116, 1120–1127. [Google Scholar] [CrossRef] [PubMed] [Green Version]
  4. Beckman, J.A. Aortic aneurysms: Pathophysiology, epidemiology and prognosis. In Vascular Medicine; Creager, M.A., Dzau, V.J., Loscalzo, J., Eds.; Saunders Elsevier: Philadelphia, PA, USA, 2006. [Google Scholar]
  5. Della Corte, A.; Michelena, H.I.; Citarella, A.; Votta, E.; Piatti, F.; Lo Presti, F.; Ashurov, R.; Cipollaro, M.; Forte, A. Risk Stratification in Bicuspid Aortic Valve Aortopathy: Emerging Evidence and Future Perspectives. Curr. Probl. Cardiol. 2021, 46, 100428. [Google Scholar] [CrossRef]
  6. Zhang, X.; Cowan, B.R.; Bluemke, D.A.; Finn, J.P.; Fonseca, C.G.; Kadish, A.H.; Lee, D.C.; Lima, J.A.; Suinesiaputra, A.; Young, A.A.; et al. Atlas-based quantification of cardiac remodeling due to myocardial infarction. PLoS ONE 2014, 9, e110243. [Google Scholar] [CrossRef]
  7. Cutugno, S.; Ingrassia, T.; Nigrelli, V.; Pasta, S. On the Left Ventricular Remodeling of Patients with Stenotic Aortic Valve: A Statistical Shape Analysis. Bioengineering 2021, 8, 66. [Google Scholar] [CrossRef]
  8. Young, A.A.; Frangi, A.F. Computational cardiac atlases: From patient to population and back. Exp. Physiol. 2009, 94, 578–596. [Google Scholar] [CrossRef] [Green Version]
  9. Bruse, J.L.; McLeod, K.; Biglino, G.; Ntsinjana, H.N.; Capelli, C.; Hsia, T.Y.; Sermesant, M.; Pennec, X.; Taylor, A.M.; Schievano, S.; et al. A statistical shape modelling framework to extract 3D shape biomarkers from medical imaging data: Assessing arch morphology of repaired coarctation of the aorta. BMC Med. Imaging 2016, 16, 40. [Google Scholar] [CrossRef]
  10. Cosentino, F.; Raffa, G.M.; Gentile, G.; Agnese, V.; Bellavia, D.; Pilato, M.; Pasta, S. Statistical Shape Analysis of Ascending Thoracic Aortic Aneurysm: Correlation between Shape and Biomechanical Descriptors. J. Pers. Med. 2020, 10, 28. [Google Scholar] [CrossRef]
  11. Sophocleous, F.; Biffi, B.; Milano, E.G.; Bruse, J.; Caputo, M.; Rajakaruna, C.; Schievano, S.; Emanueli, C.; Bucciarelli-Ducci, C.; Biglino, G. Aortic morphological variability in patients with bicuspid aortic valve and aortic coarctation. Eur. J. Cardiothorac. Surg. 2019, 55, 704–713. [Google Scholar] [CrossRef]
  12. Lee, J.J.; D’Ancona, G.; Amaducci, A.; Follis, F.; Pilato, M.; Pasta, S. Role of computational modeling in thoracic aortic pathology: A review. J. Card. Surg. 2014, 29, 653–662. [Google Scholar] [CrossRef] [PubMed]
  13. Cosentino, F.; Scardulla, F.; D’Acquisto, L.; Agnese, V.; Gentile, G.; Raffa, G.; Bellavia, D.; Pilato, M.; Pasta, S. Computational modeling of bicuspid aortopathy: Towards personalized risk strategies. J. Mol. Cell. Cardiol. 2019, 131, 122–131. [Google Scholar] [CrossRef] [PubMed]
  14. Gsell, M.A.F.; Augustin, C.M.; Prassl, A.J.; Karabelas, E.; Fernandes, J.F.; Kelm, M.; Goubergrits, L.; Kuehne, T.; Plank, G. Assessment of wall stresses and mechanical heart power in the left ventricle: Finite element modeling versus Laplace analysis. Int. J. Numer. Methods Biomed. Eng. 2018, 34, e3147. [Google Scholar] [CrossRef] [PubMed] [Green Version]
  15. Gomez, A.; Wang, Z.; Xuan, Y.; Wisneski, A.D.; Hope, M.D.; Saloner, D.A.; Guccione, J.M.; Ge, L.; Tseng, E.E. Wall Stress Distribution in Bicuspid Aortic Valve-Associated Ascending Thoracic Aortic Aneurysms. Ann. Thorac. Surg. 2020, 110, 807–814. [Google Scholar] [CrossRef]
  16. Wang, Z.; Flores, N.; Lum, M.; Wisneski, A.D.; Xuan, Y.; Inman, J.; Hope, M.D.; Saloner, D.A.; Guccione, J.M.; Ge, L.; et al. Wall stress analyses in patients with ≥5 cm versus <5 cm ascending thoracic aortic aneurysm. J. Thorac. Cardiovasc. Surg. 2021, 162, 1452–1459. [Google Scholar] [CrossRef]
  17. Martin, C.; Sun, W.; Elefteriades, J. Patient-specific finite element analysis of ascending aorta aneurysms. Am. J. Physiol. Heart Circ. Physiol. 2015, 308, H1306–H1316. [Google Scholar] [CrossRef] [Green Version]
  18. Pasta, S.; Gentile, G.; Raffa, G.M.; Bellavia, D.; Chiarello, G.; Liotta, R.; Luca, A.; Scardulla, C.; Pilato, M. In Silico Shear and Intramural Stresses are Linked to Aortic Valve Morphology in Dilated Ascending Aorta. Eur. J. Vasc. Endovasc. Surg. 2017, 54, 254–263. [Google Scholar] [CrossRef]
  19. Capellini, K.; Vignali, E.; Costa, E.; Gasparotti, E.; Biancolini, M.E.; Landini, L.; Positano, V.; Celi, S. Computational fluid dynamic study for aTAA hemodynamics: An integrated image-based and RBF mesh morphing approach. J. Biomech. Eng. 2018, 140, 111007. [Google Scholar] [CrossRef]
  20. Faggiano, E.; Antiga, L.; Puppini, G.; Quarteroni, A.; Luciani, G.B.; Vergara, C. Helical flows and asymmetry of blood jet in dilated ascending aorta with normally functioning bicuspid valve. Biomech. Model. Mechanobiol. 2013, 12, 801–813. [Google Scholar] [CrossRef]
  21. Bruse, J.L.; Zuluaga, M.A.; Khushnood, A.; McLeod, K.; Ntsinjana, H.N.; Hsia, T.Y.; Sermesant, M.; Pennec, X.; Taylor, A.M.; Schievano, S. Detecting Clinically Meaningful Shape Clusters in Medical Image Data: Metrics Analysis for Hierarchical Clustering Applied to Healthy and Pathological Aortic Arches. IEEE Trans. Biomed. Eng. 2017, 64, 2373–2383. [Google Scholar] [CrossRef] [Green Version]
  22. Agnese, V.; Pasta, S.; Michelena, H.I.; Mina, C.; Romano, G.M.; Carerj, S.; Zito, C.; Maalouf, J.F.; Foley, T.A.; Raffa, G.; et al. Patterns of ascending aortic dilatation and predictors of surgical replacement of the aorta: A comparison of bicuspid and tricuspid aortic valve patients over eight years of follow-up. J. Mol. Cell. Cardiol. 2019, 135, 31–39. [Google Scholar] [CrossRef]
  23. Pasta, S.; Agnese, V.; Gallo, A.; Cosentino, F.; Di Giuseppe, M.; Gentile, G.; Raffa, G.M.; Maalouf, J.F.; Michelena, H.I.; Bellavia, D.; et al. Shear Stress and Aortic Strain Associations with Biomarkers of Ascending Thoracic Aortic Aneurysm. Ann. Thorac. Surg. 2020, 110, 1595–1604. [Google Scholar] [CrossRef]
  24. Pasta, S.; Gentile, G.; Raffa, G.M.; Scardulla, F.; Bellavia, D.; Luca, A.; Pilato, M.; Scardulla, C. Three-dimensional parametric modeling of bicuspid aortopathy and comparison with computational flow predictions. Artif. Organs 2017, 41, E92–E102. [Google Scholar] [CrossRef]
  25. Comelli, A.; Dahiya, N.; Stefano, A.; Benfante, V.; Gentile, G.; Agnese, V.; Raffa, G.M.; Pilato, M.; Yezzi, A.; Petrucci, G.; et al. Deep learning approach for the segmentation of aneurysmal ascending aorta. Biomed. Eng. Lett. 2021, 11, 15–24. [Google Scholar] [CrossRef]
  26. Fratini, L.; Macaluso, G.; Pasta, S. Residual stresses and FCP prediction in FSW through a continuous FE model. J. Mater. Process. Technol. 2009, 209, 5465–5474. [Google Scholar] [CrossRef]
  27. Fratini, L.; Pasta, S. Residual stresses in friction stir welded parts of complex geometry. Int. J. Adv. Manuf. Technol. 2012, 59, 547–557. [Google Scholar] [CrossRef]
  28. Scardulla, F.; Pasta, S.; D’Acquisto, L.; Sciacca, S.; Agnese, V.; Vergara, C.; Quarteroni, A.; Clemenza, F.; Bellavia, D.; Pilato, M. Shear stress alterations in the celiac trunk of patients with a continuous-flow left ventricular assist device as shown by in-silico and in-vitro flow analyses. J. Heart Lung Transplant. Off. Publ. Int. Soc. Heart Transplant. 2017, 36, 906–913. [Google Scholar] [CrossRef] [PubMed]
  29. Pasta, S.; Cannata, S.; Gentile, G.; Di Giuseppe, M.; Cosentino, F.; Pasta, F.; Agnese, V.; Bellavia, D.; Raffa, G.M.; Pilato, M.; et al. Simulation study of transcatheter heart valve implantation in patients with stenotic bicuspid aortic valve. Med. Biol. Eng. Comput. 2020, 58, 815–829. [Google Scholar] [CrossRef]
  30. Khan, M.; Sardar, H.; Gulzar, M.M.; Alshomrani, A.S. On multiple solutions of non-Newtonian Carreau fluid flow over an inclined shrinking sheet. Results Phys. 2018, 8, 926–932. [Google Scholar] [CrossRef]
  31. Rinaudo, A.; Pasta, S. Regional variation of wall shear stress in ascending thoracic aortic aneurysms. Proc. Inst. Mech. Eng. Part H J. Eng. Med. 2014, 228, 627–638. [Google Scholar] [CrossRef]
  32. Mahadevia, R.; Barker, A.J.; Schnell, S.; Entezari, P.; Kansal, P.; Fedak, P.W.; Malaisrie, S.C.; McCarthy, P.; Collins, J.; Carr, J.; et al. Bicuspid aortic cusp fusion morphology alters aortic three-dimensional outflow patterns, wall shear stress, and expression of aortopathy. Circulation 2014, 129, 673–682. [Google Scholar] [CrossRef] [Green Version]
  33. Youssefi, P.; Gomez, A.; He, T.; Anderson, L.; Bunce, N.; Sharma, R.; Figueroa, C.A.; Jahangiri, M. Patient-specific computational fluid dynamics-assessment of aortic hemodynamics in a spectrum of aortic valve pathologies. J. Thorac. Cardiovasc. Surg. 2017, 153, 8–20.e3. [Google Scholar] [CrossRef] [Green Version]
  34. Campobasso, R.; Condemi, F.; Viallon, M.; Croisille, P.; Campisi, S.; Avril, S. Evaluation of Peak Wall Stress in an Ascending Thoracic Aortic Aneurysm Using FSI Simulations: Effects of Aortic Stiffness and Peripheral Resistance. Cardiovasc. Eng. Technol. 2018, 9, 707–722. [Google Scholar] [CrossRef] [Green Version]
  35. Barker, A.J.; Lanning, C.; Shandas, R. Quantification of Hemodynamic Wall Shear Stress in Patients with Bicuspid Aortic Valve Using Phase-Contrast MRI. Ann. Biomed. Eng. 2010, 38, 788–800. [Google Scholar] [CrossRef] [Green Version]
  36. Guzzardi, D.G.; Barker, A.J.; van Ooij, P.; Malaisrie, S.C.; Puthumana, J.J.; Belke, D.D.; Mewhort, H.E.; Svystonyuk, D.A.; Kang, S.; Verma, S.; et al. Valve-Related Hemodynamics Mediate Human Bicuspid Aortopathy: Insights From Wall Shear Stress Mapping. J. Am. Coll. Cardiol. 2015, 66, 892–900. [Google Scholar] [CrossRef] [Green Version]
  37. Della Corte, A.; Bancone, C.; Quarto, C.; Dialetto, G.; Covino, F.E.; Scardone, M.; Caianiello, G.; Cotrufo, M. Predictors of ascending aortic dilatation with bicuspid aortic valve: A wide spectrum of disease expression. Eur. J. Cardiothorac. Surg. 2007, 31, 397–404, discussion 404–405. [Google Scholar] [CrossRef] [Green Version]
  38. Della Corte, A.; Bancone, C.; Dialetto, G.; Covino, F.E.; Manduca, S.; Montibello, M.V.; De Feo, M.; Buonocore, M.; Nappi, G. The ascending aorta with bicuspid aortic valve: A phenotypic classification with potential prognostic significance. Eur. J. Cardiothorac. Surg. 2014, 46, 240–247, discussion 247. [Google Scholar] [CrossRef] [Green Version]
  39. Schaefer, B.M.; Lewin, M.B.; Stout, K.K.; Gill, E.; Prueitt, A.; Byers, P.H.; Otto, C.M. The bicuspid aortic valve: An integrated phenotypic classification of leaflet morphology and aortic root shape. Heart 2008, 94, 1634–1638. [Google Scholar] [CrossRef] [PubMed]
  40. Liang, L.; Liu, M.; Martin, C.; Sun, W. A deep learning approach to estimate stress distribution: A fast and accurate surrogate of finite-element analysis. J. R. Soc. Interface 2018, 15, 20170844. [Google Scholar] [CrossRef] [PubMed] [Green Version]
  41. Casciaro, M.E.; Craiem, D.; Chironi, G.; Graf, S.; Macron, L.; Mousseaux, E.; Simon, A.; Armentano, R.L. Identifying the principal modes of variation in human thoracic aorta morphology. J. Thorac. Imaging 2014, 29, 224–232. [Google Scholar] [CrossRef] [PubMed]
  42. Wu, J.; Zafar, M.A.; Li, Y.; Saeyeldin, A.; Huang, Y.; Zhao, R.; Qiu, J.; Tanweer, M.; Abdelbaky, M.; Gryaznov, A.; et al. Ascending Aortic Length and Risk of Aortic Adverse Events: The Neglected Dimension. J. Am. Coll. Cardiol. 2019, 74, 1883–1894. [Google Scholar] [CrossRef] [PubMed]
  43. Uretsky, S.; Gillam, L.D. Nature versus nurture in bicuspid aortic valve aortopathy: More evidence that altered hemodynamics may play a role. Circulation 2014, 129, 622–624. [Google Scholar] [CrossRef] [PubMed] [Green Version]
  44. Campbell, J.Q.; Petrella, A.J. Automated finite element modeling of the lumbar spine: Using a statistical shape model to generate a virtual population of models. J. Biomech. 2016, 49, 2593–2599. [Google Scholar] [CrossRef] [PubMed] [Green Version]
  45. Mendez, V.; Di Giuseppe, M.; Pasta, S. Comparison of hemodynamic and structural indices of ascending thoracic aortic aneurysm as predicted by 2-way FSI, CFD rigid wall simulation and patient-specific displacement-based FEA. Comput. Biol. Med. 2018, 100, 221–229. [Google Scholar] [CrossRef] [PubMed]
  46. Reymond, P.; Crosetto, P.; Deparis, S.; Quarteroni, A.; Stergiopulos, N. Physiological simulation of blood flow in the aorta: Comparison of hemodynamic indices as predicted by 3-D FSI, 3-D rigid wall and 1-D models. Med. Eng. Phys. 2013, 35, 784–791. [Google Scholar] [CrossRef]
Figure 1. (A) Shape probability curve as a function of standard deviation; (B) scree plot of PCA-related shape modes for BAV ATAA and TAV ATAA.
Applsci 12 00394 g001
Figure 2. Graphic representation of ATAA and its valve for Mode 1 at different values of σ for both BAV ATAA and TAV ATAA.
Applsci 12 00394 g002
Figure 3. Dominant shape modes shown by deforming the mean TAV ATAA template (grey color) from low (−1.5 σ) to high (+1.5 σ) shape boundaries (red color).
Applsci 12 00394 g003
Figure 4. Dominant shape modes shown by deforming the mean BAV ATAA template (grey color) from low (−1.5 σ) to high (+1.5 σ) shape boundaries (red color).
Applsci 12 00394 g004
Figure 5. Distribution of time-averaged pressure (left), flow velocity (middle), and WSS (right) in both TAV and BAV ATAA mean templates.
Applsci 12 00394 g005
Figure 6. Pressure (top), flow velocity (center), and WSS (bottom) for BAV and TAV ATAA models for Mode 1 at ±1.5 σ.
Applsci 12 00394 g006
Figure 7. Pressure (top), flow velocity (center), and WSS (bottom) for BAV and TAV ATAA models for Mode 2 at ±1.5 σ.
Applsci 12 00394 g007
Figure 8. Pressure (top), flow velocity (center), and WSS (bottom) for BAV and TAV ATAA models for Mode 3 at ±1.5 σ.
Applsci 12 00394 g008
Table 1. Clinical and demographic characteristics of patient study population. Mann–Whitney test with α = 0.05.
Patient CharacteristicsBAV ATAATAV ATAAp-Value
Age (years)58 ± 165 ± 10.390
Male (%)85.063.90.234
BSA (m2)3.5 ± 6.22.4 ± 3.50.078
HR (bpm)72.9 ± 10.872.8 ± 13.00.769
MAP (mmHg)93.4 ± 9.591.9 ± 8.10.107
SV (mL)77.7 ± 30.877.1 ± 26.90.455
CO (L/min)5.5 ± 2.25.5 ± 2.50.952
Hypertension (%)51.560.20.987
Note: BSA = body surface area; HR = heart rate; MAP = mean arterial pressure; SV = stroke volume; CO = cardiac output.
Publisher’s Note: MDPI stays neutral with regard to jurisdictional claims in published maps and institutional affiliations.

