Abstract
Integrated multitrophic aquaculture (IMTA) is a versatile technology emerging as an ecological and sustainable solution for traditional monoculture aquacultures in terms of effluent treatment. Nevertheless, IMTA is still poorly applied in aquaculture industry due to, among other reasons, the lack of effective, low-investment and low-maintenance solutions. In this study, one has developed a practical and low maintenance IMTA-pilot system, settled in a semi-intensive coastal aquaculture. The optimisation and performance of the system was validated using Ulva spp., a macroalgae that naturally grows in the fishponds of the local aquaculture. Several cultivation experiments were performed at lab-scale and in the IMTA-pilot system, in static mode. The specific growth rate (SGR), yield, nutrient removal, N and C enrichment, protein and pigment content were monitored. Ulva spp. successfully thrived in effluent from the fish species sea bream (Sparus aurata) and sea bass (Dicentrarchus labrax) production tanks and significantly reduced inorganic nutrient load in the effluent, particularly, NH4+, PO43− and NO3−. The enrichment of nitrogen in Ulva spp.’s tissues indicated nitrogen assimilation by the algae, though, the cultivated Ulva spp. showed lower amounts of protein and pigments in comparison to the wild type. This study indicates that the designed IMTA-pilot system is an efficient solution for fish effluent treatment and Ulva spp., a suitable effluent remediator.
Keywords:
estuary; macroalgae; effluent; bioremediation; aquaculture; sustainability; stable isotopes 1. Introduction
Aquaculture is an important economic sector growing worldwide to meet the current demand of fish consumption [1]. Water quality and fish health are some of the main concerns of semi-intensive and intensive productions [2]. The gross investment on this area has been mostly on infrastructures to effectively increase production, that is to grow more fish per area [3,4], while ensuring product quality.
Meanwhile, aquaculture productions worldwide produce effluents enriched with nutrients and suspended solids derived from the remains of uneaten feed and waste from fish metabolisms [5]. The discharge of these nutrient-rich effluents into the aquatic environment can cause harmful effects in these ecosystems, such as eutrophication [1,6,7]. Although European directives promote greener and sustainable processes [1,8,9], aiming at protecting aquatic ecosystems, the treatment of fish effluent is still quite disregarded.
Integrated multitrophic aquaculture (IMTA) is a versatile opportunity that transforms waste resultant from aquaculture into profit by upbringing economic attractive species, such as macroalgae, mussels, oysters, capable of extracting nutrients in particulate and diluted phases in aquaculture effluent, cleaning it [10]. Macroalgae-based IMTA systems can be very effective effluent treatment units for coastal aquacultures, particularly when using macroalgae with high ability for removing nutrients [11].
In Europe, IMTA systems have been mainly applied to offshore aquacultures. For instance, macroalgae, such as kelps (class Phaeophyceae), are produced by using nutrients released from off-shore fish facilities [12,13,14]. In the coastal aquaculture industry, IMTA is currently poorly applied despite the advantages of these systems.
Many factors can contribute for this, for instance, aquaculture producers, especially small- and medium-sized enterprises, are mainly focused in improving their monoculture activity and generally sceptical regarding IMTA systems, tending to perceive these culture systems as secondary, unproductive and time-consuming. Moreover, the application of these solutions represents a significative initial investment and requires learning new skills and more complex lines of production [13,14]. Such perception is generally incited by the lack of knowledge and inexperience on markets and production methods [13], but also by the lack of effective, low-investment and low-maintenance solutions.
With that in mind, a simple and low maintenance IMTA-pilot system was settled in a semi-intensive coastal aquaculture and its performance was validated for the green macroalgae Ulva spp. (Chlorophyta) culture. Our aim was to develop a solution for coastal aquacultures, with the least impact possible to the aquaculture’s normal functioning, that enables the treatment of their effluents before discharge, reducing the anthropogenic pressure on estuarine and coastal ecosystems, and ensuring compliance with the current laws and regulations. Concomitantly, a new sub-product with economical value will be produced. The increase of profit associated to the production and trade of macroalgae can be, in the future, an incentive for the implementation of such solutions.
Herein, the IMTA-pilot system was applied to an aquaculture production unit of fishponds adjacent to an estuarine area, which produces sea bream (Sparus aurata) and sea bass (Dicentrarchus labrax). Such units are commonly found in Portugal and south of Europe and typically settled near estuaries [15].
These productions units do not generally present water treatment facilities and rely on water flow provided during favourable moon cycles and currents to proceed with water changes in the facilities. Produced effluents are generally discharged untreated into the estuary after a brief residence in an effluent channel. These type of aquaculture units could benefit from a polyculture system where IMTA modules could be installed in the effluent channels or annexed to each fishpond unit to bioremediate the produced effluent by reducing the nutrient load.
Ulva spp. was chosen to first validate the performance of the designed IMTA-system, as this genus is an easy-working and versatile macroalgae available in many estuarine and coastal ecosystems, presenting high growth rates and high ability to remove nutrients, its culture requires very low assistance and is commonly applied in IMTA or algae growing systems [16,17].
This green macroalgae seasonally grows in the tanks of the aquaculture, where the IMTA-pilot system was settled, associated with other species, such as the red macroalgae Gracillaria sp., when high nutrient content and phototrophic conditions are favourable. Moreover, the interest in Ulva spp. has been growing over the last two decades due to its interesting potential for biotechnological applications such as biofuel, fertiliser and feed industries [18,19,20], making this macroalgae a valuable product for aquaculture producers.
2. Materials and Methods
2.1. Study Site Characterisation
A pilot-IMTA system was settled in a local aquaculture of sea bream and sea bass (40.12 North, −8.836 East, Lavos, Figueira da Foz, Portugal) and was composed by six semi-transparent plastic cubic tanks (High-Density Polyethylene (HDPE), 1000 L) with galvanised frame and UN 31HA1/Y food certification (SIIE—Sociedade Internacional de Embalagens, S.A.).
The pilot system was aligned into two parallel rows (3 tanks per row). An aeration system was installed in each row, presenting a membrane air compressor (AirPump DB-100, flow ≈ 6 m3/h) connected to a perforated hose (Ethylene Propylene Diene Methylene rubber (EPDM)), spirally fixed on the bottom of each tank. The top of the tanks was protected by a white mesh.
A submersible pump (HCP-IC215T, 1.5 Hp, 2″ (400 V), flow ≈ 25 m3/h) was installed in one of the aquaculture tanks (where sea bass and sea bream are produced) and connected to the pilot system through a PVC pipe. At the inlet of each tank row, an in-line filtration system of two 50 µm filters was installed to filter the effluent and reduce the presence of suspended solid material. No alterations to the normal functioning of the aquaculture were made throughout the experimental trials.
For the trials, specimens of Ulva spp. were generally collected in Mondego river estuary and in Buarcos coast. Mondego river estuary is an 860 ha transitional area divided by an alluvium-formed island (Murraceira island) in two arms—North and South–with dissimilar hydromorphological characteristics. Approximately 2 km long, the north arm can reach 5 to 10 m of depth during high tide. The south arm is 7 km long and is shallower than the north arm, reaching 2 to 4 m of depth during high tide.
Both estuary margins are subjected to continuous anthropogenic pressure given its location next to an urban center (Figueira da Foz city (Portugal)), holding Figueira da Foz harbour (at the north arm), small mercantile and fishing harbours, several small and medium-sized enterprises (salt-works, aquaculture farms, paper and canning industries) and receiving run-off from upstream agriculture activities [21]. The south arm presents longer water residence than north arm and the constant flow of nutrients from anthropogenic activities promotes the proliferation of macroalgae, marine and salt marsh plants all year [22].
With a WNW-ESE orientation, Buarcos is a rocky bay located north to the city of Figueira da Foz, which extends until Cabo Mondego, a natural sea cliff [23]. This area is a relevant touristic area, the shoreline being highly populated in summer period. This area has low influence from the river since the costal currents are generally north–south oriented [23]. This rocky area is characterised for having one of the most diverse macroalgae communities in Portugal, probably due to its location within a transitional area of cool and temperate waters which provides high variation of species round the year [24].
2.2. Sampling
Specimens of Ulva spp. (5–10 cm thalli) were collected from the south arm of Mondego estuary in June and November and in Buarcos bay (for experiment 2.3.2 (AQUA1)). Green specimens of Ulva spp. were collected and placed in plastic bags with sea or estuarine water, depending on the sampling site. Then, the algal samples were placed in ice chest cooler boxes and transported to the laboratory. Water (≈10 L) from each sampling site was also collected in previously disinfected plastic bottles.
In the laboratory, the collected sea and estuarine water was filtered, using 0.5 µm glass fibre filters, and used for cleaning the collected algae. Sediment, small organisms and epiphytes were removed with the filtered water using cotton swabs and absorbent paper for a more precise result. Part of the macroalgae samples were used in the experimental assays described below, another part stored, at −80 °C, in a Premium U410 Upright Freezer (New Brunswick) and another part was dried at 40 °C in an oven Heraeus Instruments 6000 series for further analyses.
2.3. Experimental Design
2.3.1. Experiments at Laboratorial Scale
Cultivation Assays
Two experimental assays were conducted in laboratorial and controlled conditions. The experiments were conducted with specimens collected at Mondego estuary in different seasons (late spring and late autumn) to assess the influence of seasonality in Ulva spp. growth and ability to remove nutrients.
Both assays were performed in a climate room, with an average temperature of 19 °C and a photoperiod cycle of 16 h day: 8 h night with constant light (1 Klux). The growth system was composed by six 10 L rectangular tanks with an aeration system mimicking the pilot-IMTA system settled in the local aquaculture.
For experiment LU1 (performed in late spring), specimens of Ulva spp. (density ≈ 1.8 g/L) were cultivated (free in tank) in 8 L of fish effluent (pre-filtered with 38 µm mesh) for 24 days. The experiment was performed in triplicate. Furthermore, three tanks with fish effluent and no algae addition were used as control. Effluent salinity registered an average value of 33.18 ± 1.3 PSU and 7.88 ± 0.33 for pH, during the experiment, and oxygen percentage was maintained above 75%. Effluent was changed every 6 days. During each renewal, physico-chemical parameters were registered, algae biomass was drained and weighed, and aliquots of effluent were taken from each tank (d6, d12, d18, d24) as well as from the recently collected effluent (d0, d6, d12, d18, d24), for nutrient analysis.
For experiment LU2 (performed in late autumn), the cultivation assay was performed as described in LU1: Ulva spp. was cultivated in three tanks (biomass density of 1 g/L in 8 L of effluent, 3 replicates) and fish effluent and no algae addition were used as control (3 replicates). Ulva spp. was allowed to grow for 8 days. Effluent salinity registered an average value of 31.92 ± 1.40 PSU and 7.6 ± 0.5 for pH, during the experiment, and oxygen percentage was maintained above 75%. Effluent replacement was performed after 4 days. Aliquots of effluent were taken from each tank every day for nutrient analysis to assess the daily depletion of nutrient. In addition, during medium renewal (d0, d4 and d8), aliquots from the recently collected effluent were also collected, physico-chemical parameters were measured, and algae biomass was weighed.
After each effluent renovation (in LU1 and LU2), the initial density of algal biomass was maintained and the remaining part of Ulva spp. was dried at 40 °C, powdered using a ball mill mixer (MM400, Retsch, Dusseldorf, Germany) and stored until further analysis.
Oxygen Production–Consumption
Two stocks of Ulva spp. (algal density 30 g/L. collected in late autumn in Mondego estuary) were maintained separately, for 28 days, in seawater (32 ± 3 PSU, volume 8 L) and in fish effluent (17 ± 2 PSU, volume 8 L). Constant aeration and light (1KLux) was assured, as well as, an average room temperature of 19 °C and a photoperiod cycle of 12 h day: 12 h night. Media renewal was performed every 4 days to avoid nutrient depletion.
Oxygen production and consumption by Ulva spp. grown in different media was assessed by periodical measurement of oxygen levels. For that, fifteen glass flasks (500 mL) were filled with autoclaved seawater, previously filtered (0.5 μm porosity glass fiber filter), and the initial oxygen level was measured. Then, one gram of Ulva spp. cultivated in seawater and one gram of Ulva spp. cultivated in fish effluent were placed separately in autoclaved seawater (5 replicates per each variable). Autoclaved seawater without algae addition (5 replicates) was used as control. All replicates’ containers were randomly distributed and sealed with Bemis™ Parafilm™ to reduce gas exchanges. Then, oxygen level was measured every 4 h for a total period of 24 h in all flasks. After that period, the experiment set was dismantled, and the algae were placed in the respective growth media tank and maintained until further measurement. This procedure was repeated at day 0, 12 and 28.
Oxygen measurements were performed with a ProfiLine™ Oxi 3310 Portable Dissolved Oxygen Meter (WTW ™, Weilheim, Germany) with a sensitivity range of 0 to 90mg/L, accuracy of σ 0.5% of value and resolution of 0.1 mg/L.
2.3.2. Cultivation Assays in a Pilot-IMTA System
Two experimental assays were performed in the pilot system settled in a local aquaculture (see description in Section 2.1) in different seasons (late spring and late autumn). The tank system was subjected to environmental and climatic conditions, so physico-chemical parameters were frequently registered throughout each trial (at the beginning, at medium renewal and at the end of each experiment).
For experiment AQUA1 (performed in late spring), specimens of Ulva spp. collected in Buarcos Bay and in Mondego estuary were grown (free in the tank) in fish effluent (300 L) for 22 days. The aim was to evaluate the performance of coastal Ulva spp. vs estuarine Ulva spp. in terms of growth and nutrient removal. A biomass density of 0.1 g/L was initially used and the experiment was conducted in triplicate, with coastal and estuarine Ulva spp. being randomly distributed among tanks. Effluent renewal was performed every four days and algae samples (5 g) were collected every eight days, part being dried at 40 °C and powdered and another part being stored at −80 °C until further analyses. The remaining algae was weighed once again and placed in the corresponding tank. Throughout the assay, effluent temperature varied between 19.57 and 28.5 °C, salinity presented an average value of 34.6 ± 1.13 PSU, pH 7.65 ± 1.06 and oxygen percentage 95.99 ± 18.64%.
For experiment AQUA2 (performed in late autumn), specimens of estuarine Ulva spp. were grown in 300 L of fish effluent for 26 days. The assay was run in triplicate. The tanks were randomly distributed: three tanks to which an algae density of 0.1 g/L was added and three tanks with fish effluent and no algae addition as control. Ulva spp. was allowed to grown and effluent renewal in all tanks was performed every six days. Throughout the assay, effluent temperature varied between 9.6 and 14.9 °C, salinity presented an average value of 26.3 ± 2.43 PSU, pH 8 ± 0.53 and oxygen percentage 102.7 ± 10.13%.
During each renewal, aliquots of effluent were taken from each tank as well as from the renewed effluent for nutrient analysis. In addition, algae biomass was drained and weighed. Algae samples (5 g) were collected, part being dried at 40 °C and powdered and another part being stored at −80 °C until further analyses. The remaining algae was weighed once again and placed in the corresponding tank.
2.4. Analyses
2.4.1. Specific Growth Rate and Yield
The Average SGR was calculated for all the experiments and were expressed as daily fresh growth (SGR = g.wwt.d−1) and were determined in accordance with Evans and calculated as [25]
where W0 and Wt correspond to the initial and final wet weight (wwt) in grams and t0 and tt are initial and final time in days [26].
SGR = [ln (Wt /W0)]/(tt − t0)
The yield value was expressed in (Y = g wwt m−2 d−1) and was calculated using the following equation:
Y = (Wt − W0)/(tt − t0)/SA
W0 and Wt correspond to the initial and final wet weight (wwt) in grams and t0 and tt are initial and final time in days and SA is the superficial area of the tank in m2 [25].
2.4.2. Nutrient Analysis
The collected aliquots collected in the cultivation assays were filtered using glass fibre filters (0.5 μm porosity) and stored at −20 °C until analysis. The concentration of NH4+, NO2−, NO3−, PO43− and Si was measured using a Skalar San++ Autoanalyser (Skalar, Breda, The Netherlands) following adapted and optimised methodologies (NO2−, NO3− [27,28] NH4+ [29], PO43− [30], Si [31]. Calibration curves were performed for each parameter: 40–1000 μg N-NH3/L, 40–1000 N-NO2−/L, 40–1000 μg N-NO3−/L, 20–500 μg P-PO43−/L and 100–5000 μg Si/L. The limit of quantification (LOQ) of the methods were 40 μg N-NH3/L, 40 μg N-NO2−/L, 40 μg N-NO3−/L, 20 μg P-PO43−/L and 100 μg Si/L. The limits of detection (LOD) were 12 μg N-NH3/L, 12 μg N-NO2−/L, 12 μg N-NO3−/L, 6 μg P-PO43−/L and 30 μg Si/L.
Nutrient removal efficiencies (NRE, in percent) were calculated, using macroalgae fresh weight, following the Aníbal et al. [32]:
where C0 and Ct are nutrient concentrations (in μg/L) of the freshly collected effluent and of treated effluent collected at medium change, respectively.
NRE = 100 − (100 × (Ct/C0)
2.4.3. Isotope Analytic Techniques
The carbon and nitrogen isotopic composition were determined in dried Ulva spp. using a Flash EA 1112 Series elemental analyser (Thermo Fisher Scientific, Waltham, MA, USA) coupled on line via Finning ConFlo III interface to a Thermo delta V S mass spectrometer (Thermo Fisher Scientific, Waltham, MA, USA), accordingly to the method in [33]. The carbon and nitrogen isotope ratios are expressed in delta (δ) notation, defined as the parts per thousand (‰) deviation from a standard material (PDB limestone for δ13C and atmospheric nitrogen for δ15N):
δ13C or δ15N = [(Rsample/Rstandard) − 1] × 1000 where R = 13C/12C or 15N/14N.
The precision of the measurement was 0.2‰ for both carbon and nitrogen. Samples were weighed in a UMX2 Ultra-microbalance (weight range of 0.500 to 0.750 mg) and encapsulated in tin capsules.
2.4.4. Pigments Quantification
Forty milligrams of frozen algal tissue (−80 °C) was weighed and homogenised in 5 mL 80% acetone using a homogeniser T 10 basic ULTRA-TURRAX 30,000 rpm (IKA, Staufen, Germany). The extraction occurred for 24 h at 5 °C protected from light. The extracts were then centrifuged at 4000 rpm for 30 min at 4 °C. Absorbance measurements of supernatant were carried out at 470 nm, 645 nm and 662 nm wavelengths in a Jenway 6715 UV/Vis spectrophotometer (Fischer Scientific, Atkinson, NH, USA), using acetone 80% as blank. The concentrations of chlorophyll a and b and carotenoids (expressed in mg/mL) were calculated following the formulas [34]
Chl a = 11.75 A662 − 2.350 A645
Chl b = 18.61 A645 − 3.960 A662
2.4.5. Protein Content Quantification
The total concentration of protein in samples was measured in microplate through Bradford method [35]. One-hundred-and-fifty milligrams of frozen algal biomass (−80 °C) was homogenised in 2mL of ice-cold potassium phosphate buffer (100 mM K2HPO4/KH2PO4; 10% polyvinylpyrrolidone; pH 7, using a homogeniser T 10 basic ULTRA-TURRAX 30,000 rpm. Mitochondrial fractions were obtained after centrifugation at 10351 rpm for 20 min at 4 °C. The supernatant was removed to a new Eppendorf (2 mL) and stored at −80 °C until analysis. For protein determination, a calibration curve was performed using a standard solution of 1 mg/mL of γ-globulins from bovine blood, ≥99% (Sigma). Ten microliters of algal extracts reacted for 15 min with 250 μL of Bradford solution (PanReac Applichem) and absorbance measurements were performed at a wavelength of 600 nm.
Crude protein content was also estimated by applying a factor 6.25 to the percentage of nitrogen measured in the algae’s tissue as described in (Section 2.4.2 [36]). This factor is applied for general foodstuff and is known to overestimate the protein content of macroalgae. Nevertheless, as previous authors, it was applied for direct comparison with literature data, so the term crude protein was used [36,37].
2.5. Data and Statistical Analysis
All data compiled in figures and tables were expressed as mean values and respective standard deviation based on three replicates per variable. For SGR, yield, isotopic ratio of 15N/14N and 13C/12C, protein levels, oxygen production and pigments levels, statistical differences were evaluated among the different days of sample collection using analysis of variance (ANOVA) and the Tukey’s pairwise comparisons. The same statistical tests were employed to determine the significance of the differences among freshly collected effluent and medium with or without macroalgae regarding nutrient concentrations. Unpaired t-student test was performed when two variables were compared (p < 0.05), namely, differences between Ulva spp. from estuary and coast (AQUA 1), Ulva spp. cultivated in effluent and seawater used in 2.3.1.2 and nutrient concentration registered in freshly collected effluent and effluent where Ulva spp. was cultivated (AQUA2). The statistical package used was GraphPad Prism 6 software (version 6, San Diego, CA, USA) and p < 0.05 was used to determine statistically significant results.
3. Results
3.1. Specific Growth Rate and Yield of Ulva spp.
Ulva spp. successfully grew in fish effluent in the lab-scale cultivation system and in the IMTA-pilot system. In experiments LU1 and LU2, higher SGR and yields were attainted in the first two weeks of cultivation (Table 1). In that period, higher SGR were registered in LU2 (Ulva spp. collected in late autumn) in comparison to LU1 (Ulva spp. collected in late spring), although in terms of yield no statistical differences were found.

Table 1.
Specific growth rate (SGR, % day−1) and yield (g wet weight/m2/day) of Ulva spp., collected in Mondego estuary, cultivated in fish effluent, for 24 (late spring, LU1) and 9 days (late autumn, LU2), in a lab-scale cultivation system. Values are presented as mean ± standard deviation, n = 3.
In AQUA1, Ulva spp. from Mondego estuary thrived in fish effluent since the beginning of the experiment, whereas for Ulva spp. from coast, positive SGR and yield were only registered after d7 (Table 2). The growth of algae from both sampling sites started to decrease after d14, and negative SGR and yield were registered for d14 and d22. In late autumn (AQUA2), Ulva spp. continuously grew in fish effluent, showing higher SGR and yield in the beginning of the cultivation period, as it was observed for lab-scale experiments.

Table 2.
Specific growth rate (SGR, % day−1) and yield (g wet weight/m2/day) of Ulva spp. cultivated in fish effluent, for 22 (AQUA1) and 26 days (AQUA2), in an IMTA-pilot system. In AQUA1, Ulva spp. was collected in Mondego estuary and Figueira da Foz coast in late spring. In AQUA2, Ulva spp. from Mondego estuary (late autumn) was used. Values are presented as mean ± standard deviation, n = 3.
3.2. Nutrient Depletion
A general reduction of nutrients concentration was observed in media where Ulva spp. was cultivated, whatever the season and the cultivation system used (lab-system or IMTA system). The nutrient load of fresh collected effluent varied during each experiment and among experiments (d0 and medium change (MC) in Table 3 and Table 4 and Figure 1 and Figure 3), depending on the functioning of the aquaculture.

Table 3.
Levels of nutrients measured in freshly collected fish effluent (d0 and in each medium change (MC)) and in the collected media from control and Ulva spp. (late spring) tanks before each medium change (d6, d12, d18 and d24)–experiment LU1. Values are presented as mean ± standard deviation, n = 3. Different letters indicate statistical differences. [PO43−] were also determined, concentrations being below the limit of quantification (20 μg P-PO43−/L).

Table 4.
Levels of nutrients measured in fish effluent, freshly renovated in the IMTA cultivation system (d0 and in each medium change (MC)), and in the collected media from Ulva spp. (late autumn) tanks before each medium change (d8, d14, d20 and d26)–experiment AQUA2. Values are presented as mean ± standard deviation, n = 3. Different letters indicate statistical differences. NO3− levels were also determined, concentrations being below the limit of quantification (40 μg N-NO3−/L).
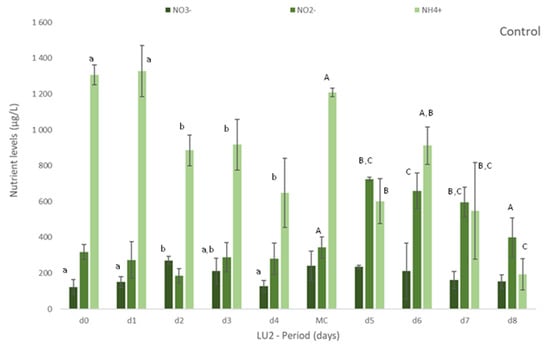
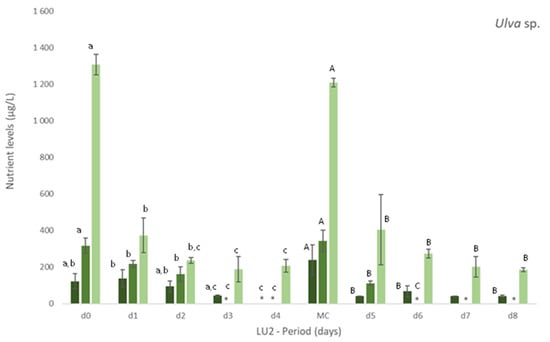
Figure 1.
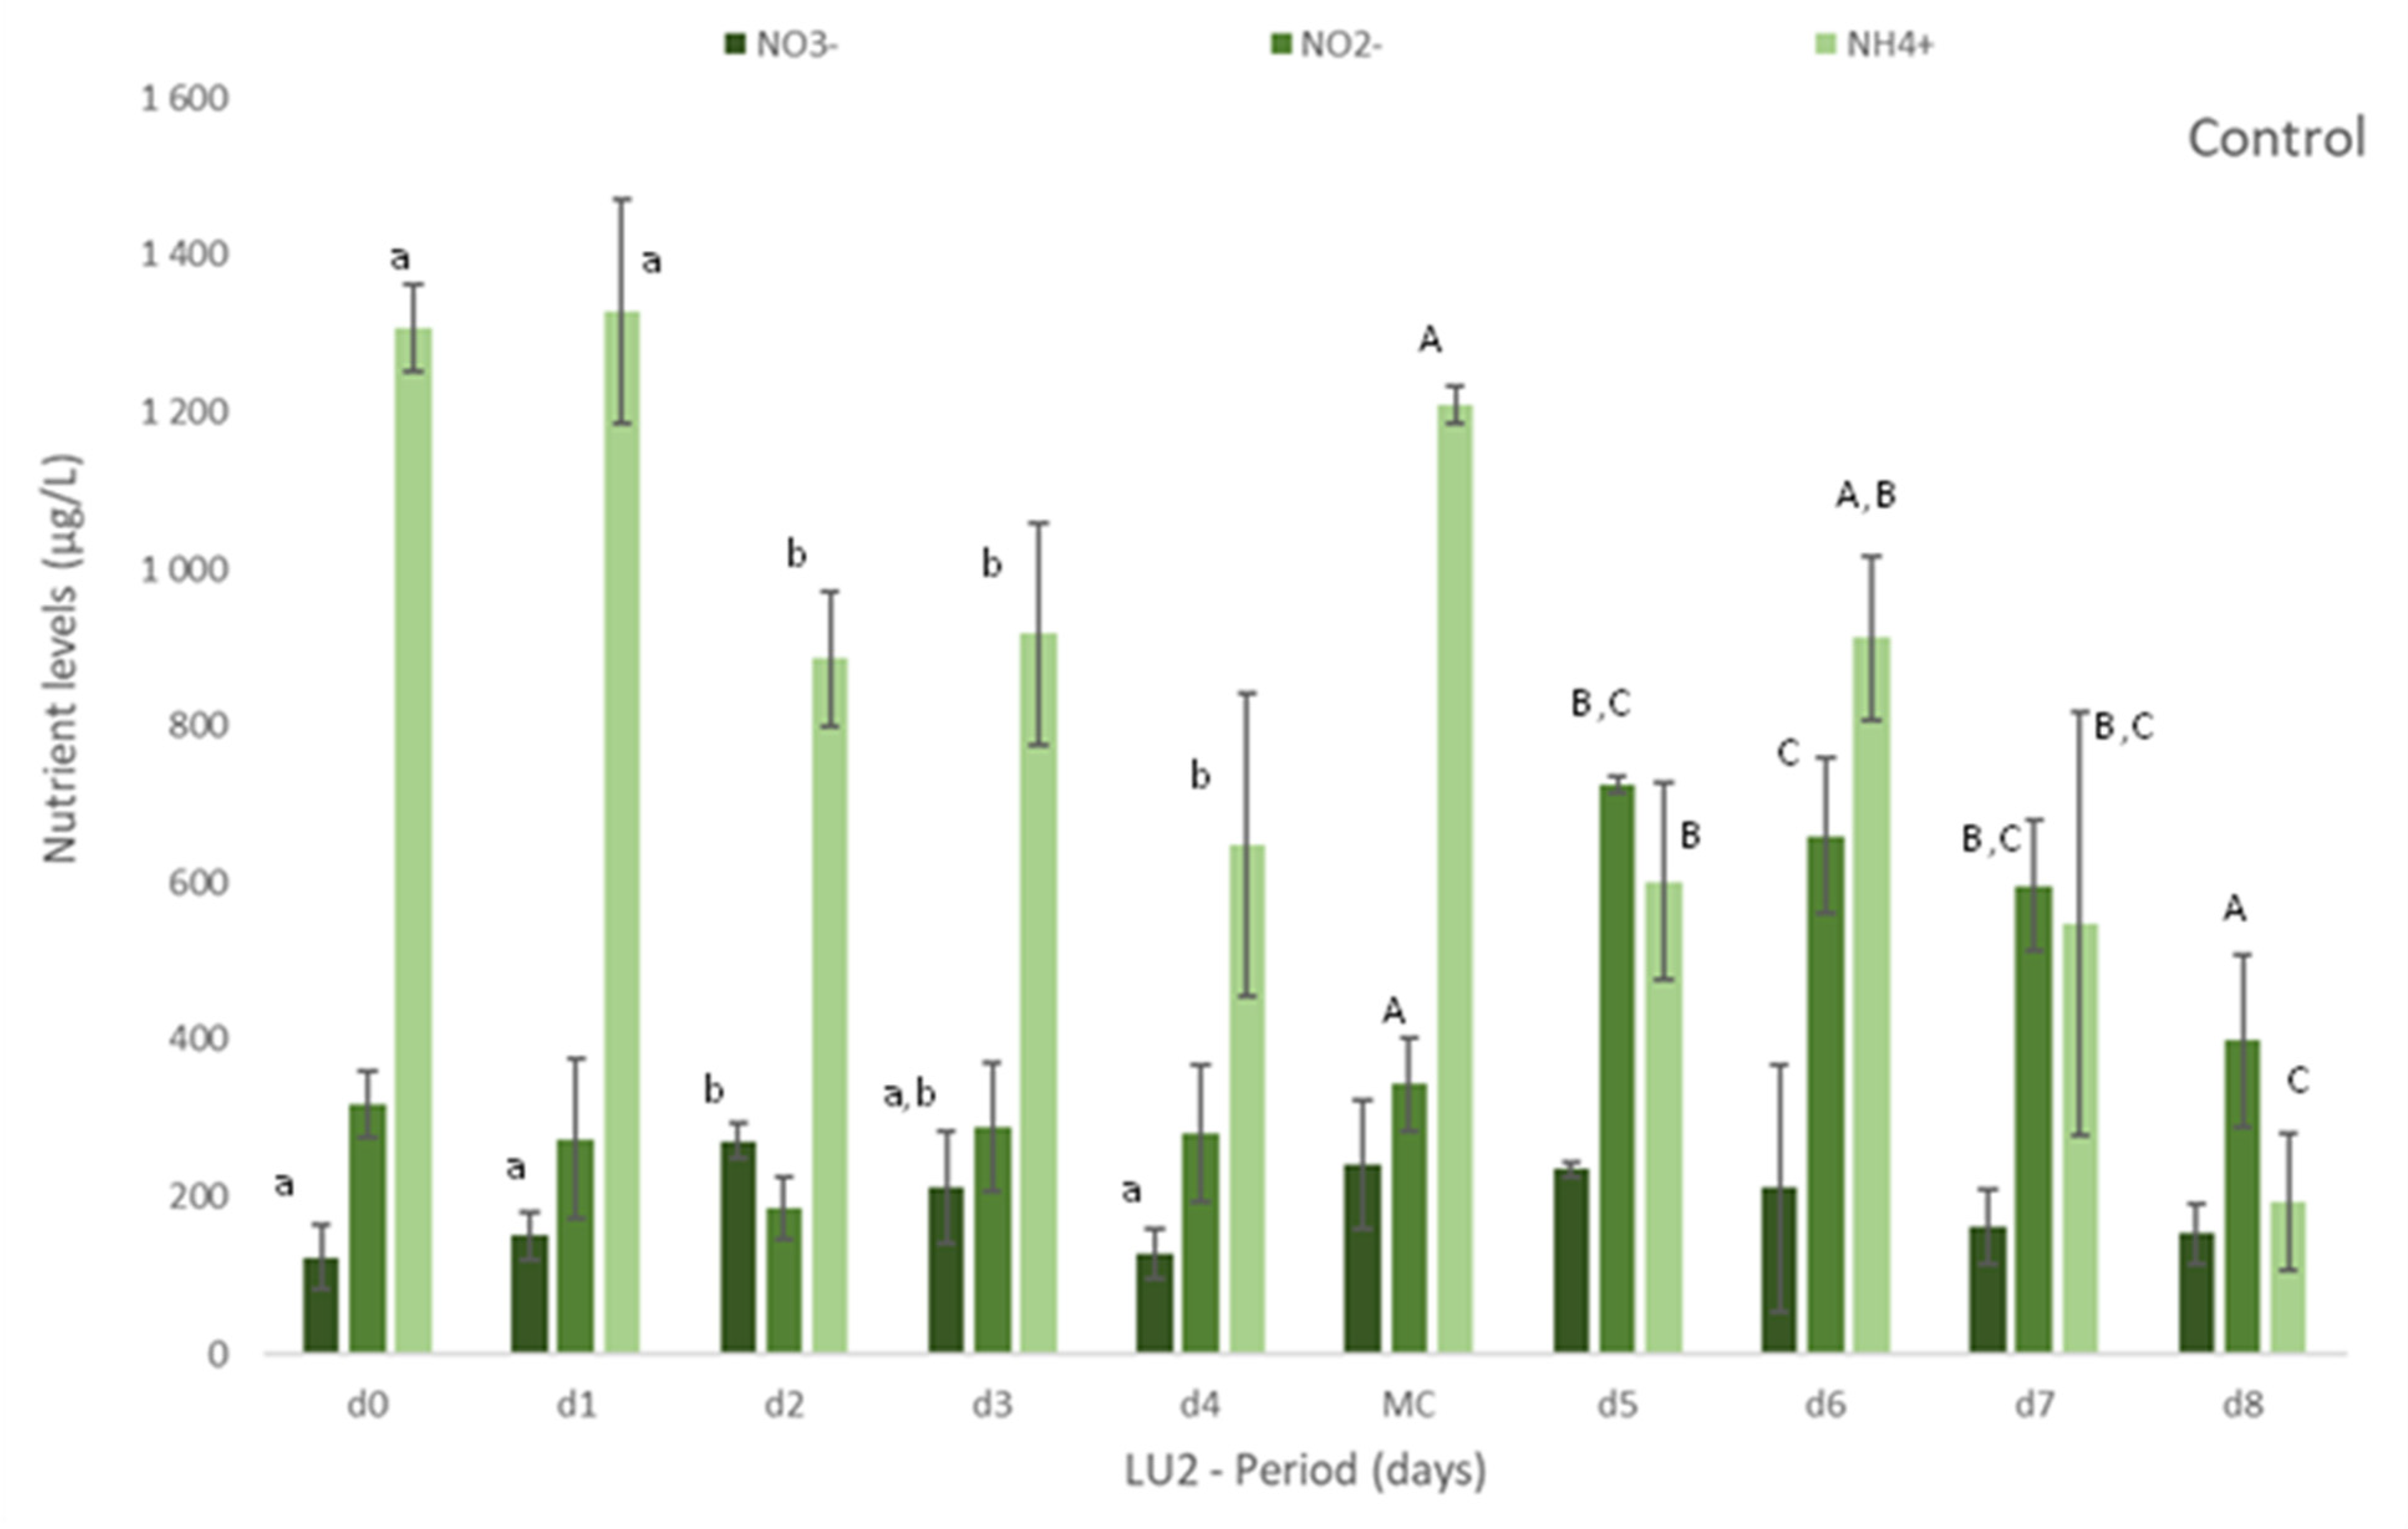
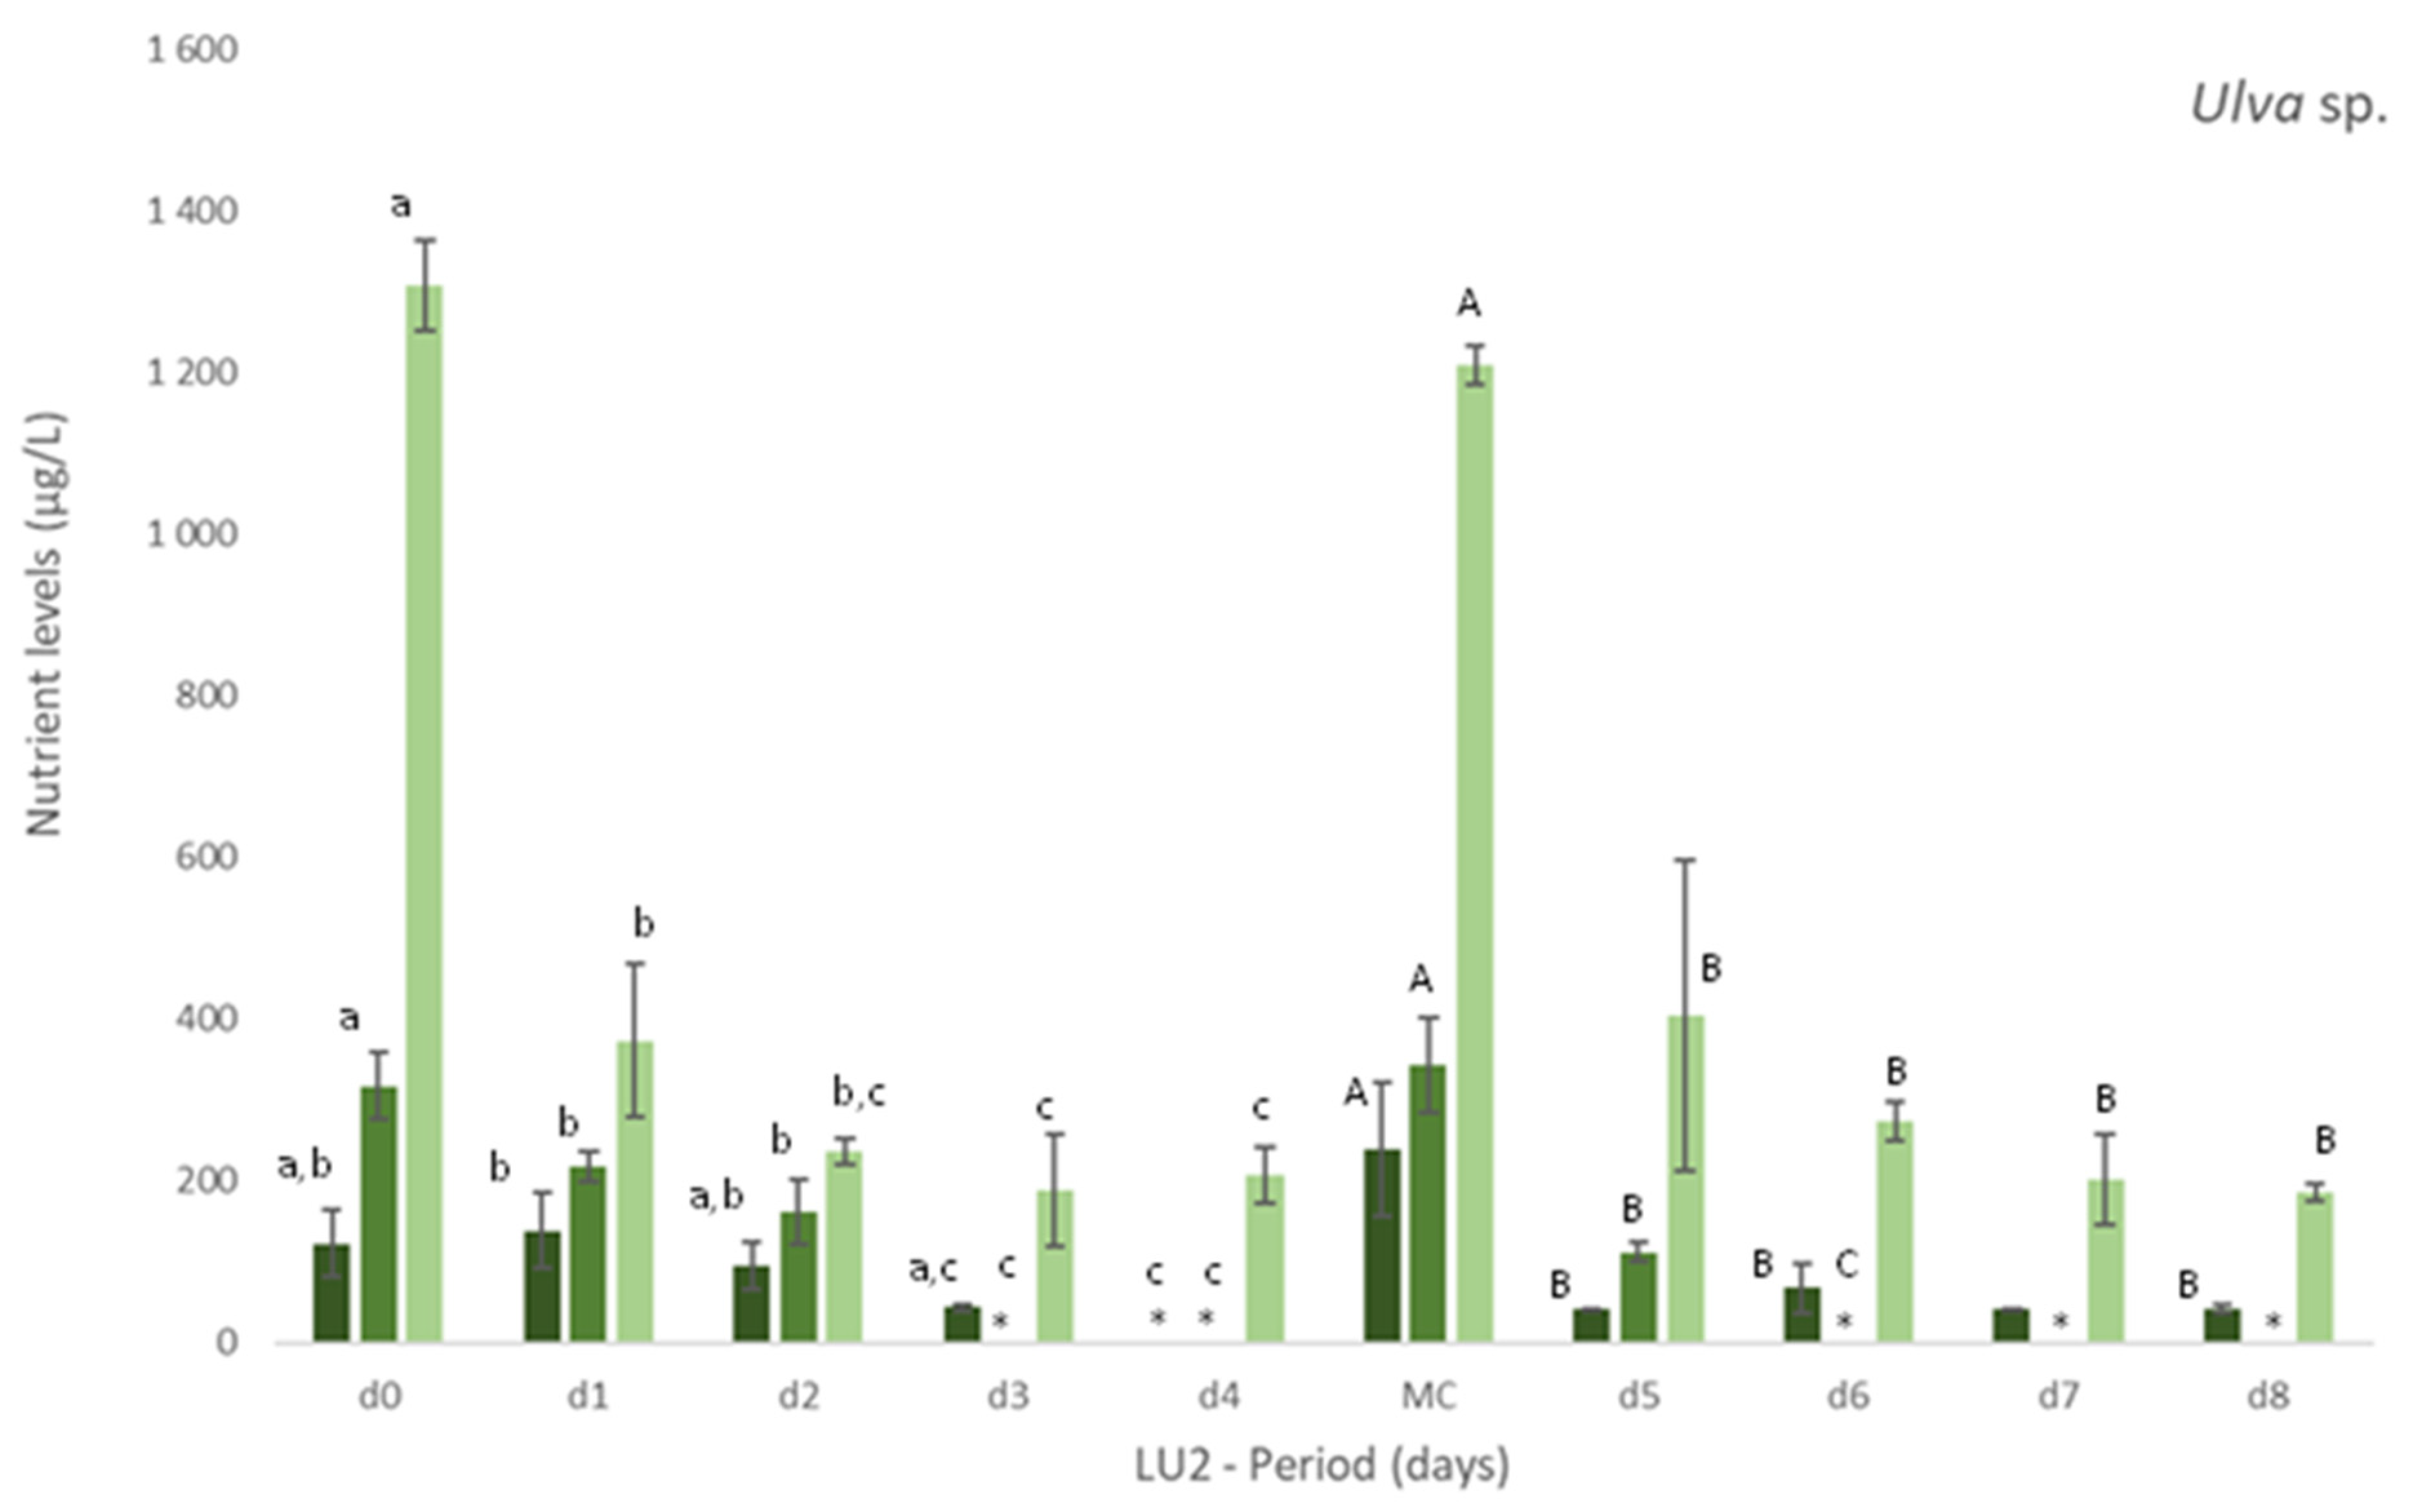
Levels of nutrients measured in freshly collected fish effluent (d0 and in medium change (MC)) and in the media from control and Ulva spp. (late autumn) tanks collected in four consecutive days before medium change (d1, d2, d3, d4) or the end of the experiment (d5, d6, d7 and d8)–experiment LU2. Values are presented as mean ± standard deviation, n = 3. Nutrient levels are expressed in μg/L. * Values below the limit of quantification (40 μg N-NO3−/L and 40 μg N-NO2−/L). Whenever there were statistical differences, it was expressed. For each nutrient, different letters show statistical differences. PO43− levels were also determined, concentrations being below the limit of quantification (20 μg P-PO43−/L) in control and Ulva spp. media. Freshly collected effluent presented 44 ± 4 μg P-PO43-/L in d0 and 32 ± 1 μg P-PO43−/L in MC.
More specifically, in experiment LU1, it was registered a statistically significant (p < 0.05) decrease in [NO3−] and [Si] in Ulva spp. tanks (Table 3) in comparison to freshly collected effluent (d0 and in each MC of d6, d12 and d18) and control (no macroalgae). Nitrite, on the other hand, was depleted either in the presence or absence of macroalgae. In NH4+ case, only in the first 6 days, [NH4+] decreased significantly (p < 0.05) regarding the effluent and control. From d6 to d24, no significant changes on [NH4+] were registered.
On experiment LU2, the concentration of nutrients was daily monitored to better understand the removal rate vs removal timing of nutrients. Figure 1 clearly demonstrates the gradual removal of NO3−, NO2− and NH4+ in media with Ulva spp. in comparison to freshly collected effluent and control. A natural depletion of nutrients can occur as observed in Figure 1 (Control), but the presence of Ulva spp. showed to significantly increase (p < 0.05) their removal (Figure 1 Ulva spp.).
Nitrate levels decreased significantly, even to levels below 40 μg N-NO3−/L (limit of quantification), after 3 or 4 days of Ulva spp. cultivation. Similarly, after 2 or 3 days, nitrite was also depleted to levels below 40 μg N-NO2−/L (LOQ).
The levels of NH4+ diminished significantly in Ulva spp. tanks, when compared to freshly collected effluent. Although statistical differences among days were not always registered during the period of cultivation, a tendency to a decrease for all the nutrients was observed during the experiment (Figure 1). With regard to Si, Ulva spp. also statistically reduced [Si] in effluent in opposition to control, for which no statistical differences were found in comparison to freshly collected effluent (data not shown). NRE values differ between LU1 and LU2, except for NO3− (NRE > 65% in spring and autumn): NRE < 24% in spring and NRE > 80% in autumn, for NH4+, and 45% < NRE < 79% in spring and 24% < NRE < 59% in autumn, for Si.
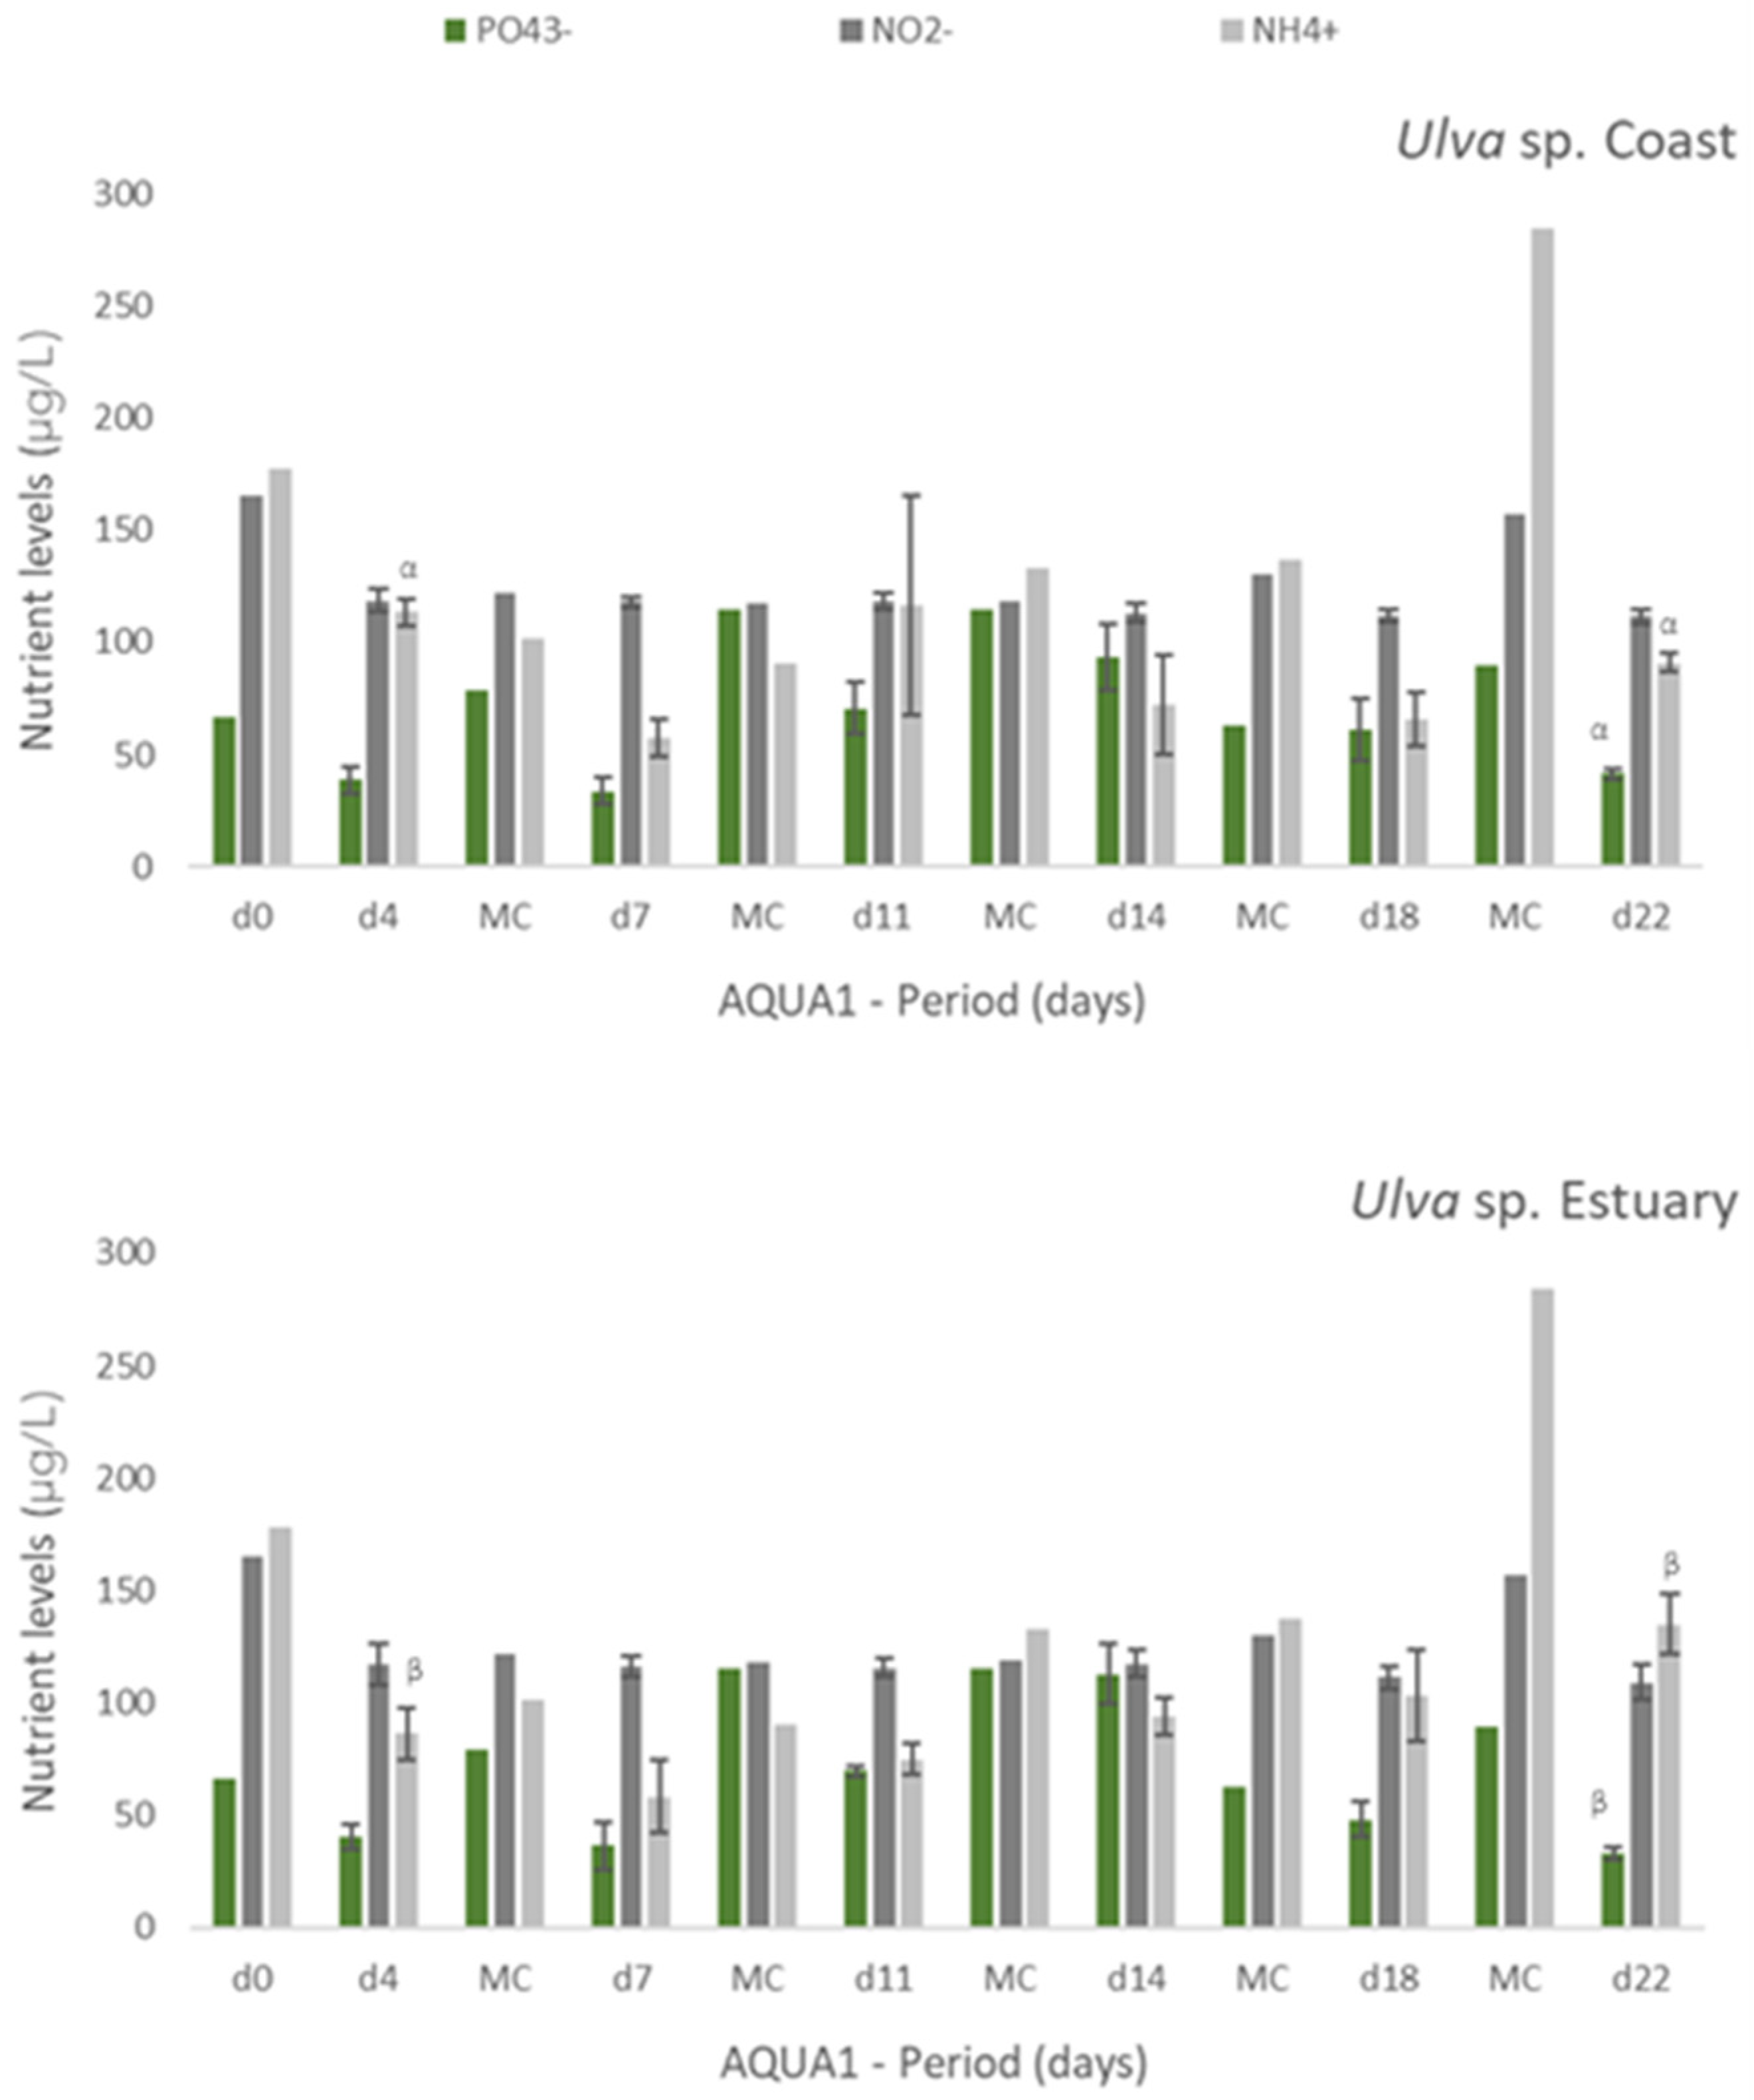
Experiments AQUA1 (late spring) and AQUA2 (late autumn) were performed in the IMTA-pilot system and subjected to the natural climatic conditions of the estuarine environment. In AQUA1, Ulva spp. from two different locations—coast and estuary—were cultivated in fish effluent. Figure 2 presents the levels of nutrients registered during the cultivation period in freshly collected effluent (d0 and all MC until d18, only one measurement possible) and effluent where Ulva spp. was cultivated (n = 3). Generally, a tendency for nutrients removal was registered after 3 or 4 days of cultivation of either estuarine or coastal Ulva spp., especially for NH4+. Concerning NO2−, such tendency was more pronounced, for either tested Ulva spp., at the end of the cultivation period (d18 and d22). No significant differences were found between coastal and estuarine Ulva spp., in terms of nutrients removal, except for [NH4+] in d4 and d22 and [PO43−] in d22. For Si, no significant decrease was registered, except at d18 and d22, in relation to freshly collected effluent. Moreover, no significant differences were found between [Si] in coastal and estuarine Ulva spp. tanks (data not shown).
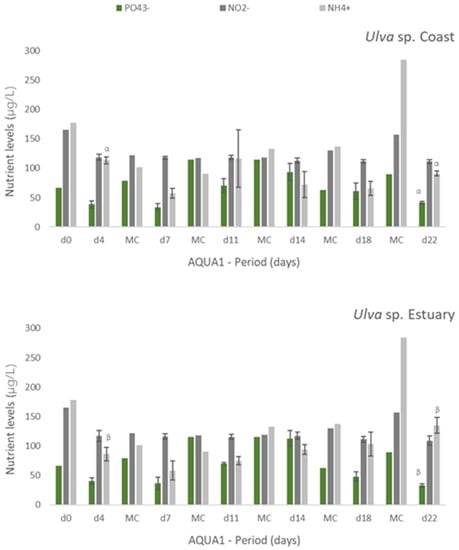
Figure 2.
Levels of nutrients measured in fish effluent, freshly renovated in the IMTA cultivation system (d0 and in medium change (MC)) and in the media from the tanks with Ulva spp. from coast and estuary (late spring) collected before medium change (d4, d7, d11, d14, d18 and d22)–experiment AQUA1. Values are presented as mean ± standard deviation, n = 3 (For d0 and all MC, n = 1). Nutrient levels are expressed in μg/L. Whenever there were statistical differences between coast and estuary Ulva spp., it was expressed. For each nutrient, different letters show statistical differences. NO3− levels were also determined, concentrations being below the limit of quantification (40 μg N-NO3−/L). In MC d18, effluent presented 106 μg N-NO3−/L.
In AQUA 2, [PO43−] decreased significantly (p < 0.05) after each medium change (Table 4). For NO2−, significant nutrient removal occurred at d8, when [NO2−] was initially high (639 ± 45 μg N-NO2−/L), and at d26. Ammonium concentration also decreased significantly at the end of the period of cultivation after 20 and 26 days. No statistically significant removal was registered for Si, except at d20, when [Si] was considerably lower than that of freshly collected effluent. After 22days (AQUA1) and 26 days (AQUA2) of experiment, some variation in NRE values as observed in lab-scale experiments:
- ▪ in spring, 63%, 30%, 53% and 80% for PO43−, NO2−, NH4+ and Si, respectively;
- ▪ in autumn, 41%, 13%, 59% and 21% for PO43−, NO2−, NH4+ and Si, respectively.
3.3. Natural 15N and 13C Values of Ulva spp.
Stable isotopic ratios of N and C was monitored in Ulva spp. cultivated in the lab-scale cultivation and in the pilot-IMTA systems during the cultivation periods tested. At lab-scale, Ulva spp. was significantly enriched in δ15N after 24 days (LU1; d0 samples 12.49 ± 0.27 vs. d24 samples 17.19 ± 0.49), and after 8 days (LU2; d0 samples 10.64 ± 0.43 vs. d24 samples 13.98 ± 1.12) in fish effluent (p < 0.0001; Table 5). The green macroalgae δ13C signatures were significantly depleted after 24 days (LU1; d0 samples −10.21 ± 0.32 vs. d24 samples −20.48 ± 1.02), and after 8 days (LU2; d0 samples −12.27 ± 0.16 vs. d4 and d8 samples, −15.78 ± 1.65 and −18.01 ± 0.75, respectively) in fish effluent (p < 0.0001; Table 5).

Table 5.
Isotopic ratio of 15N/14N and 13C/12C obtained for: Ulva spp., collected in Mondego estuary, cultivated in fish effluent, for 24 (late spring, LU1) and 9 days (late autumn, LU2), in a lab-scale cultivation system; Ulva spp., collected in Mondego estuary and Figueira da Foz coast in late spring and cultivated in fish effluent for 22 days (AQUA1) in an IMTA-pilot system; and Ulva spp., collected in Mondego estuary, cultivated in fish effluent for 26 days (late autumn, AQUA2). Values are presented as mean ± standard deviation, n = 3. Different letters indicate statistical differences. The symbol # expresses statistical differences between data regarding estuarine and coastal Ulva spp.
By contrast, in the IMTA cultivation assays, no significant variation in δ15N values in the green macroalgae were observed during the experiments (Table 5, AQUA1 and AQUA2), except for the macroalgae collected in the estuary, becoming significantly depleted in δ15N from the beginning to the end of the experiment (AQUA1, d0 samples 12.85 ± 0.11 vs. d22 samples 10.33 ± 0.32) (p < 0.05; Table 5). For δ13C, Ulva spp. exhibited depleted values from d0 to d22, in AQUA 1 (p < 0.05; Table 5), for both estuarine and coastal freshly collected algae. Nevertheless, in AQUA2, enriched carbon isotope ratios were observed from d0 to d26 period (p < 0.05; Table 5).
Overall, the δ15N in Ulva spp. cultivated in the lab-scale cultivation (LU1) after 24 days was, on average, 3‰ enriched comparing to d8 at LU2, and 7‰ enriched comparing to the pilot-IMTA systems, AQUA1 and AQUA2, after 22 days. The δ15N of the fresh algae collected at the Mondego Estuary (d0) in late spring was, on average, 2‰ enriched comparing to d0 of macroalgae collected in late autumn and from Buarcos Bay. The highest δ15N enrichment occurred in the lab-scale cultivation LU1 (5‰). Enriched carbon isotope signatures in Ulva spp. were observed in specimens collected in late spring at the estuary (on average 2.5‰). Macroalgae δ13C from the lab-scale cultivation LU1 in d24 was depleted in 13C as much as 10‰ relative to d0.
3.4. Levels of Proteins and Pigments in the Cultivated Ulva spp.
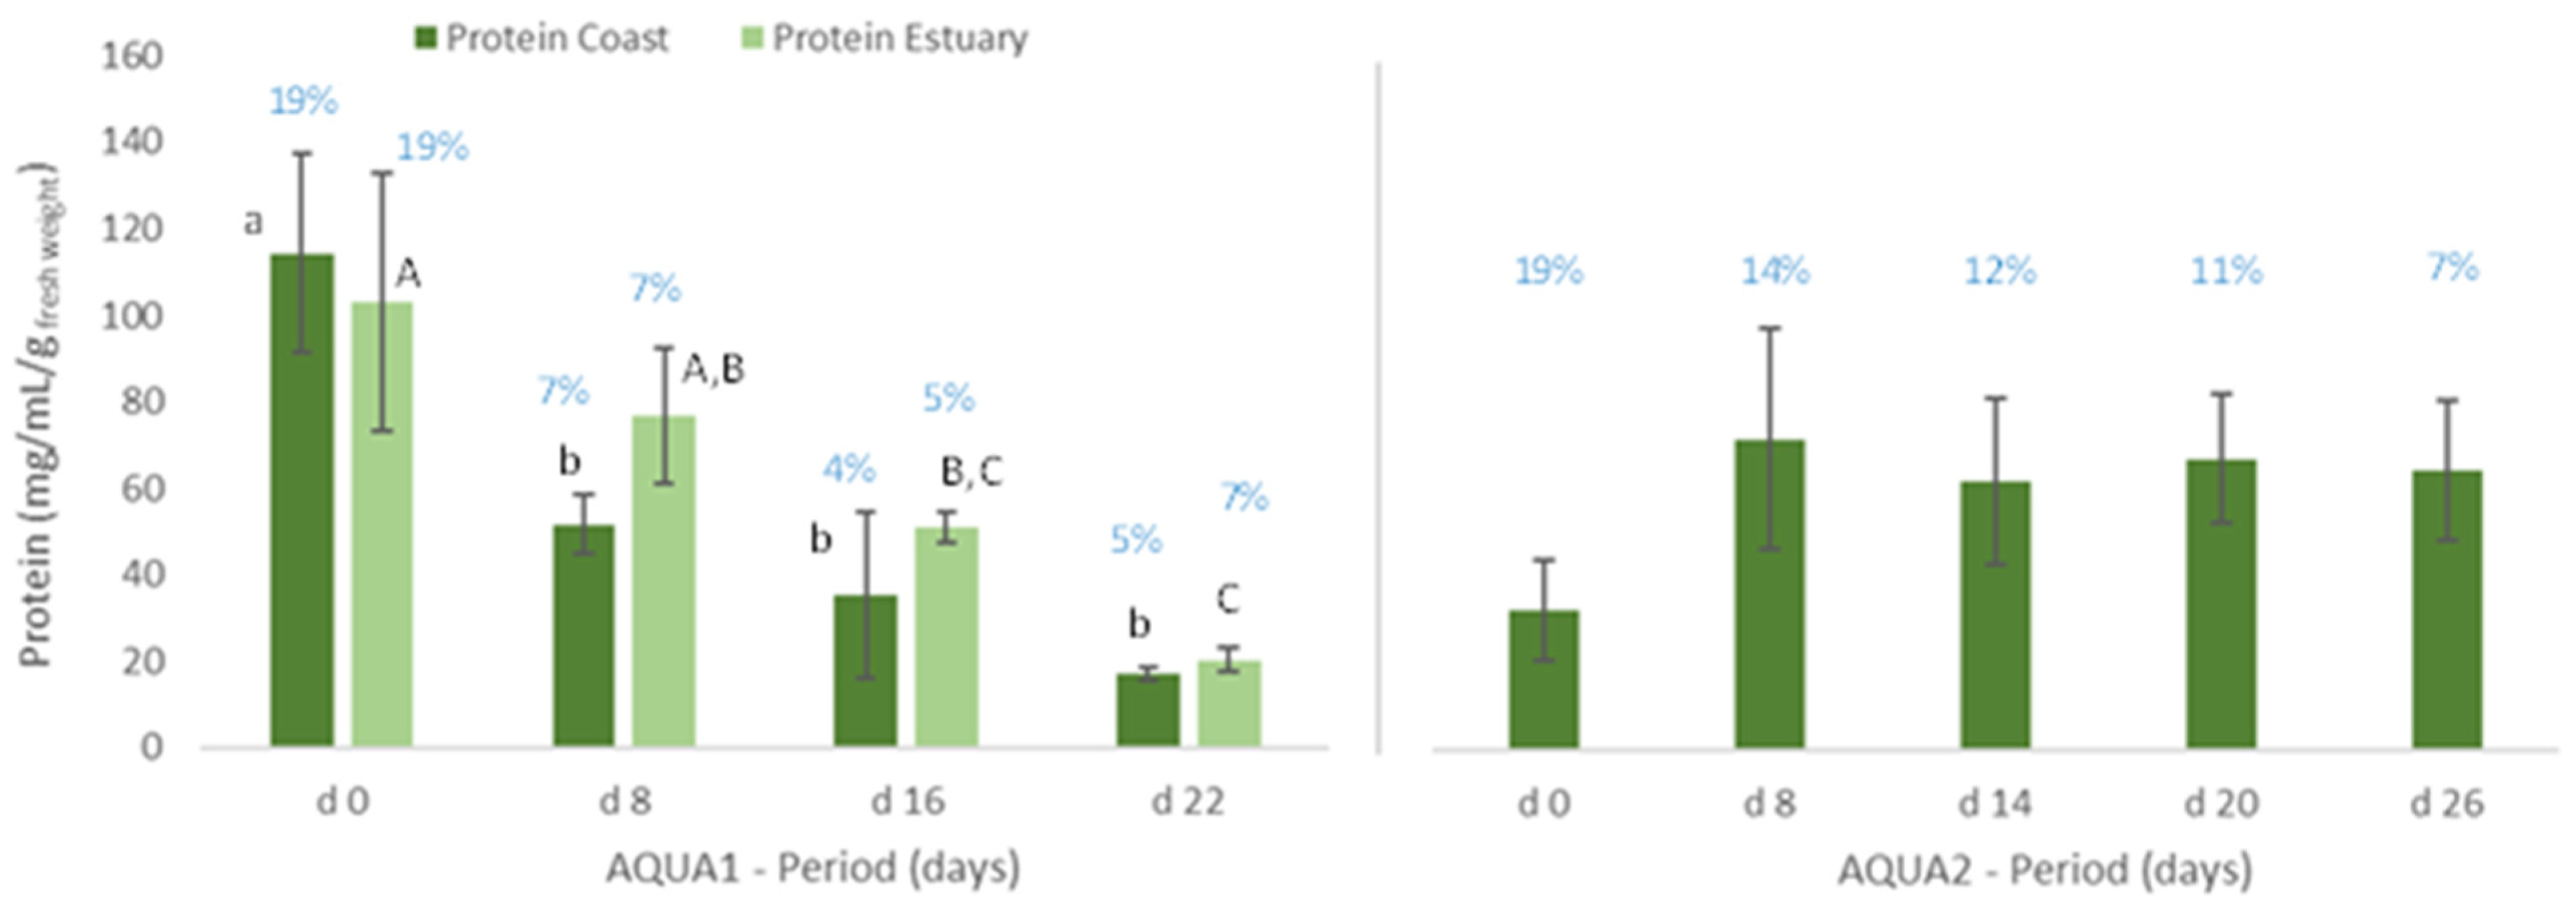
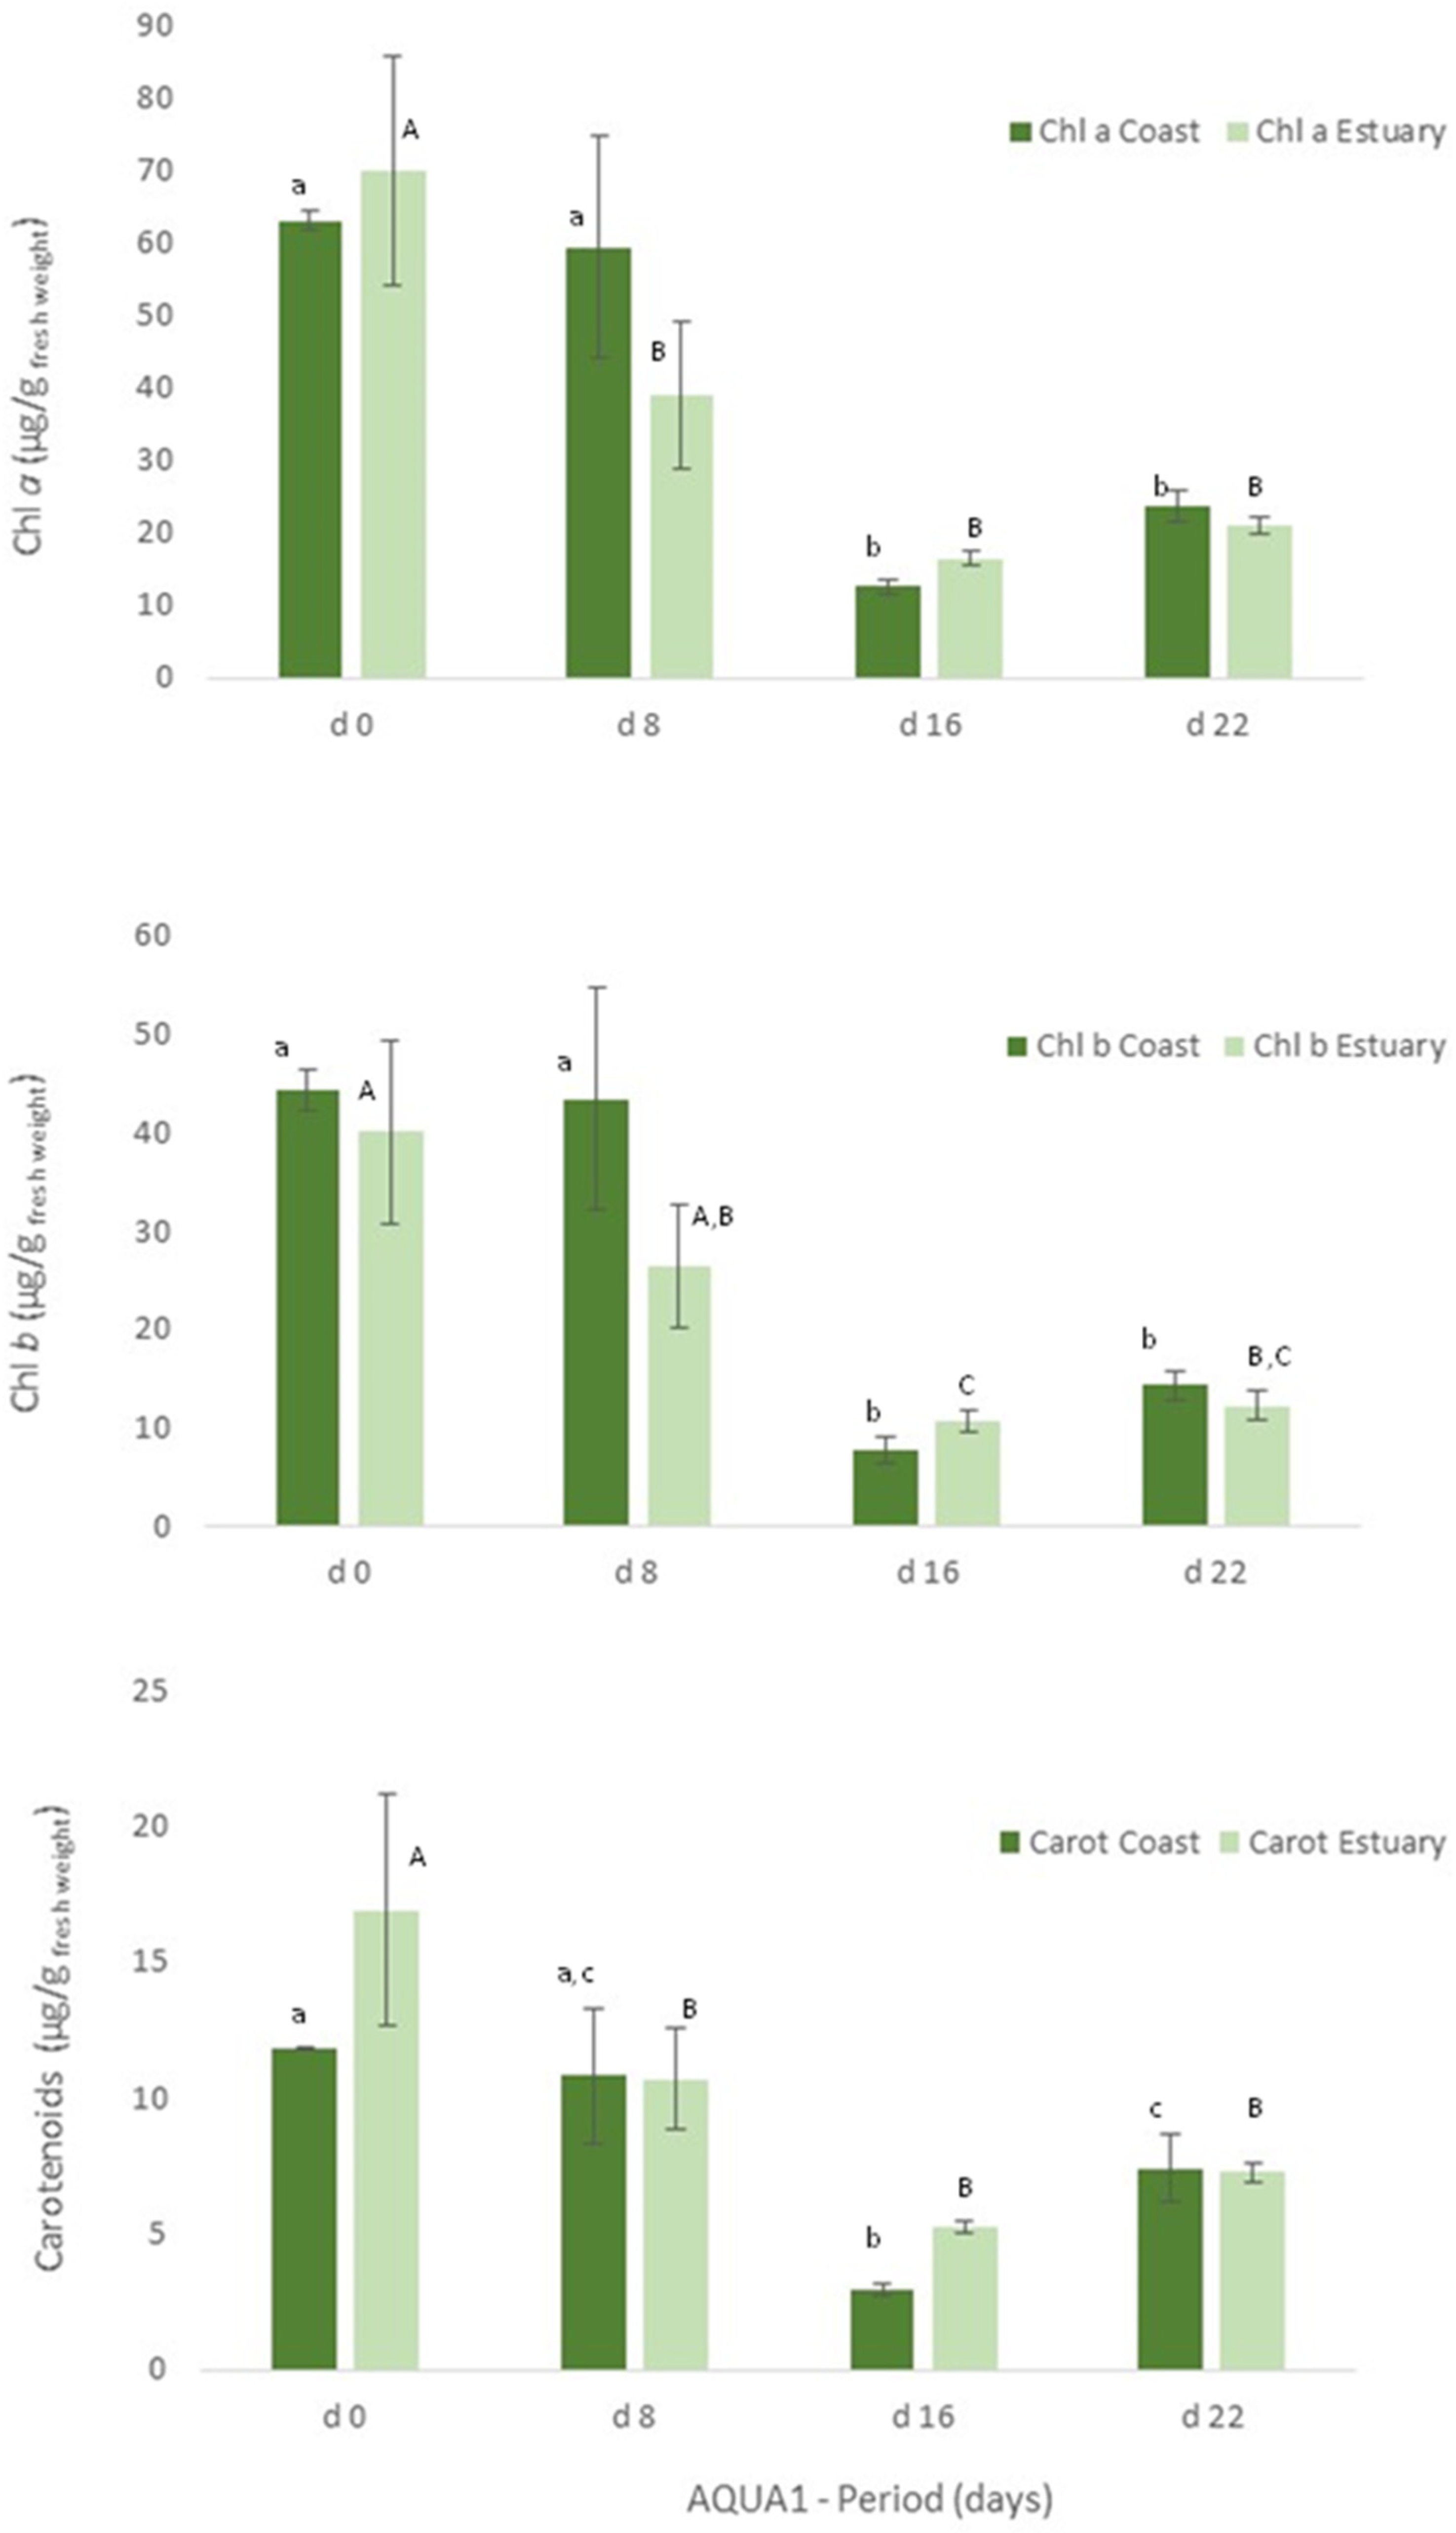
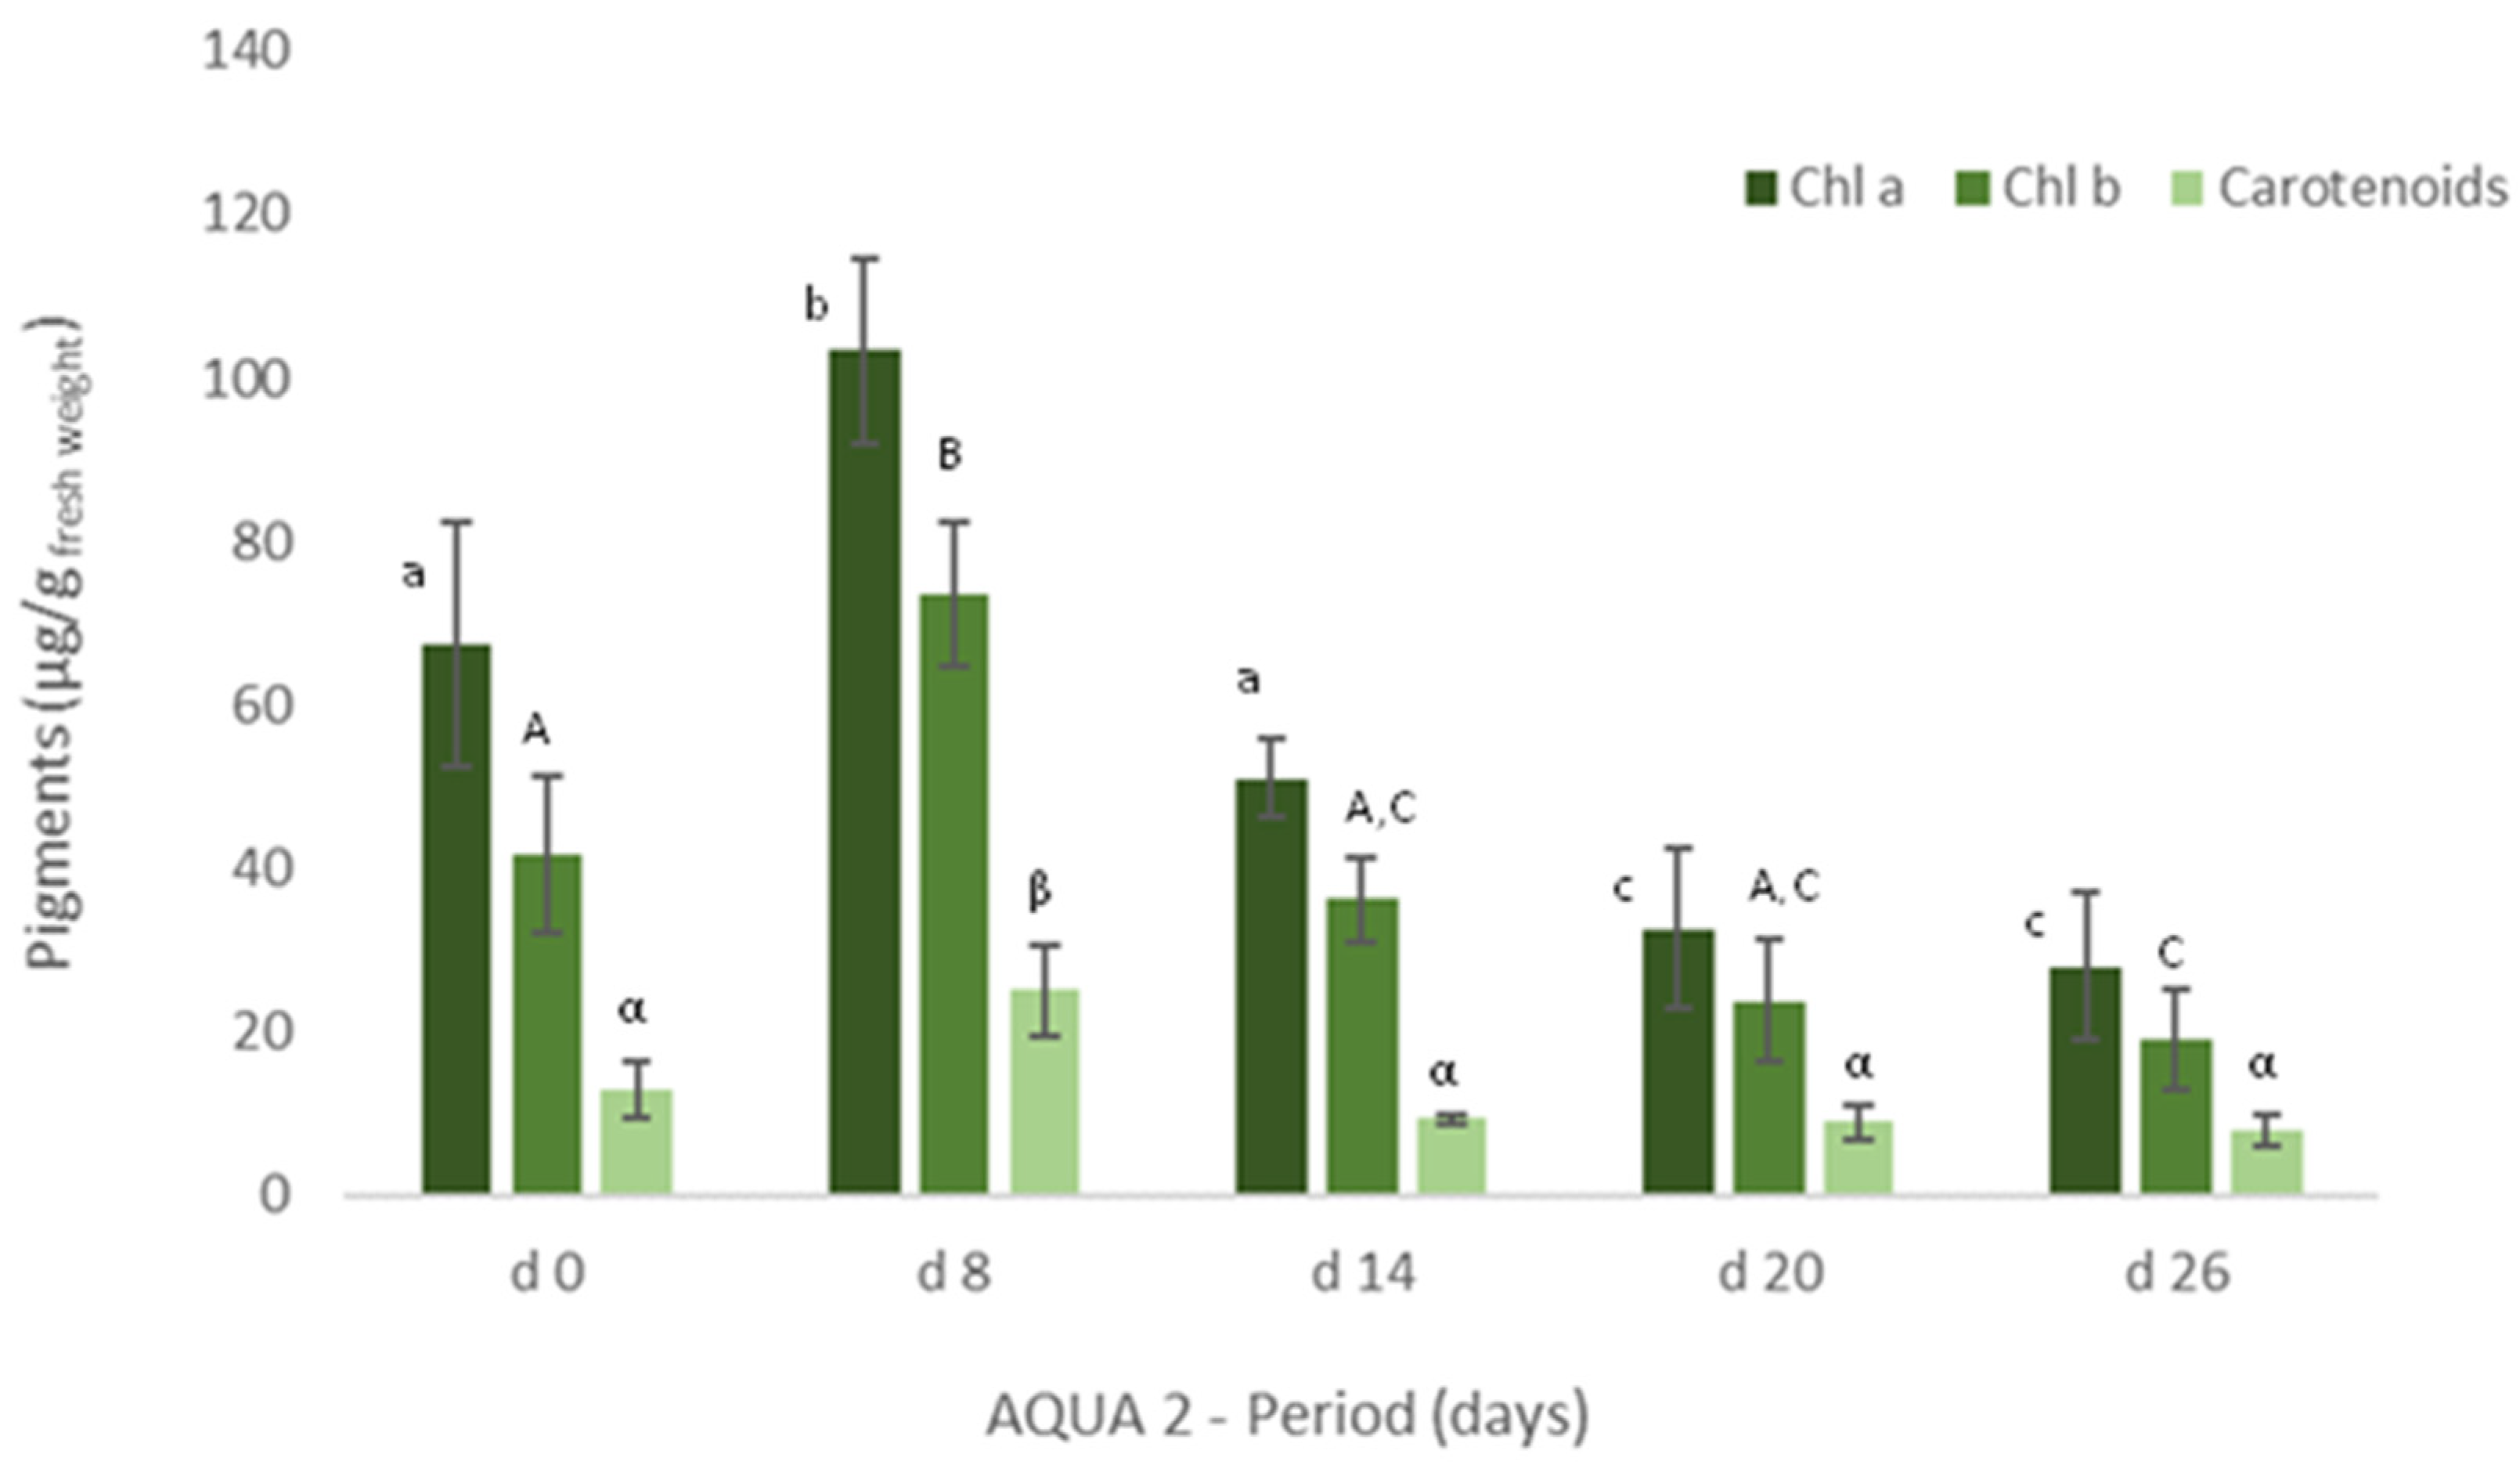
In IMTA cultivation assays (AQUA 1 and AQUA2), levels of protein and pigments were also measured in the cultivated Ulva spp. to assess their growth and development in the IMTA-pilot system. Freshly collected Ulva spp. (Mondego estuary, Figure 3, d0) showed significant statistical differences (p < 0.05), in terms of protein content, between specimens collected in late spring and late autumn. On the other hand, levels of chlorophyll a and b and of carotenoids were similar between seasons (Figure 4 (Estuary, d0) and Figure 5, d0).
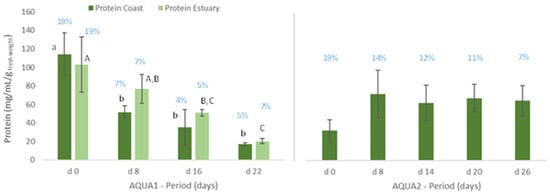
Figure 3.
Protein content (mg/mL/g wet weight) of Ulva spp. cultivated in fish effluent, for 22 (AQUA1) and 26 days (AQUA2), in an IMTA-pilot system. In AQUA1, Ulva spp. was collected in Mondego estuary and Figueira da Foz coast in late spring. In AQUA2, Ulva spp. from Mondego estuary (late autumn) was used. Values are presented as mean ± standard deviation, n = 3. Different letters correspond to significant differences among data (p < 0.05), in which small letters compare data regarding Ulva spp. collected in coast and capital letters compare data from Ulva spp. collected in the estuary. Percentage of estimated crude protein is represented above each graph bar.
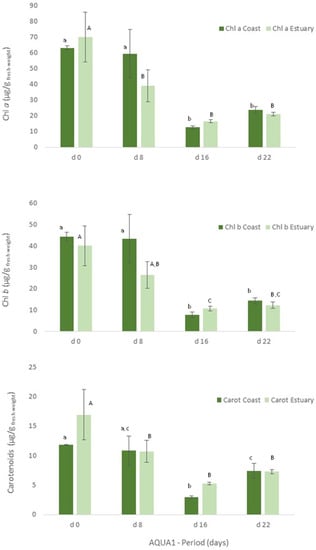
Figure 4.
Levels of chlorophyll a (Chl a) and b (Chl b) and of carotenoids (Carot) (μg/g wet weight) obtained for Ulva spp. collected in Mondego estuary and Figueira da Foz coast (late spring) and cultivated in fish effluent for 22 days. Values are presented as mean ± standard deviation, n = 3. Different letters correspond to significant differences among data (p < 0.05), in which small letters compare data regarding Ulva spp. collected in coast and capital letters compare data from Ulva spp. collected in the estuary.
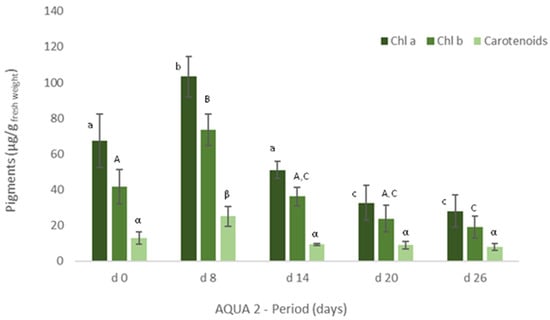
Figure 5.
Levels of chlorophyll a and b and of carotenoids (μg/g wet weight) obtained for Ulva spp. collected in Mondego estuary (late autumn) and cultivated in fish effluent for 26 days. Values are presented as mean ± standard deviation, n = 3. Different letters correspond to significant differences among data (p < 0.05). Small letters were used for chlorophyll a, capital letters for chlorophyll b and Greek letters for carotenoids.
With regard to the cultivated algae, in AQUA1, levels of total protein and crude protein and pigments of Ulva spp. from coast and from estuary were not statistically different during the cultivation period (Figure 3, 22 days). The total protein and crude protein content of Ulva spp. from coast and from estuary decreased during the cultivation period, data registered in d8, d16 and d22 being statistically different from d0.
Similarly, in terms of pigments, a statistically significant decrease was also registered, though the levels of chlorophyll a and b and of carotenoids tended to increase on d22 (Figure 4). In late autumn (AQUA2), total protein content also augmented on the cultivated Ulva spp., although no statistical differences were found (Figure 3). Crude protein however tended to decrease during the experimental period. On the other hand, levels of pigments significantly increased on d6 (p < 0.05), but generally decreased over the cultivation period (Figure 5).
3.5. Oxygen Production and Consumption
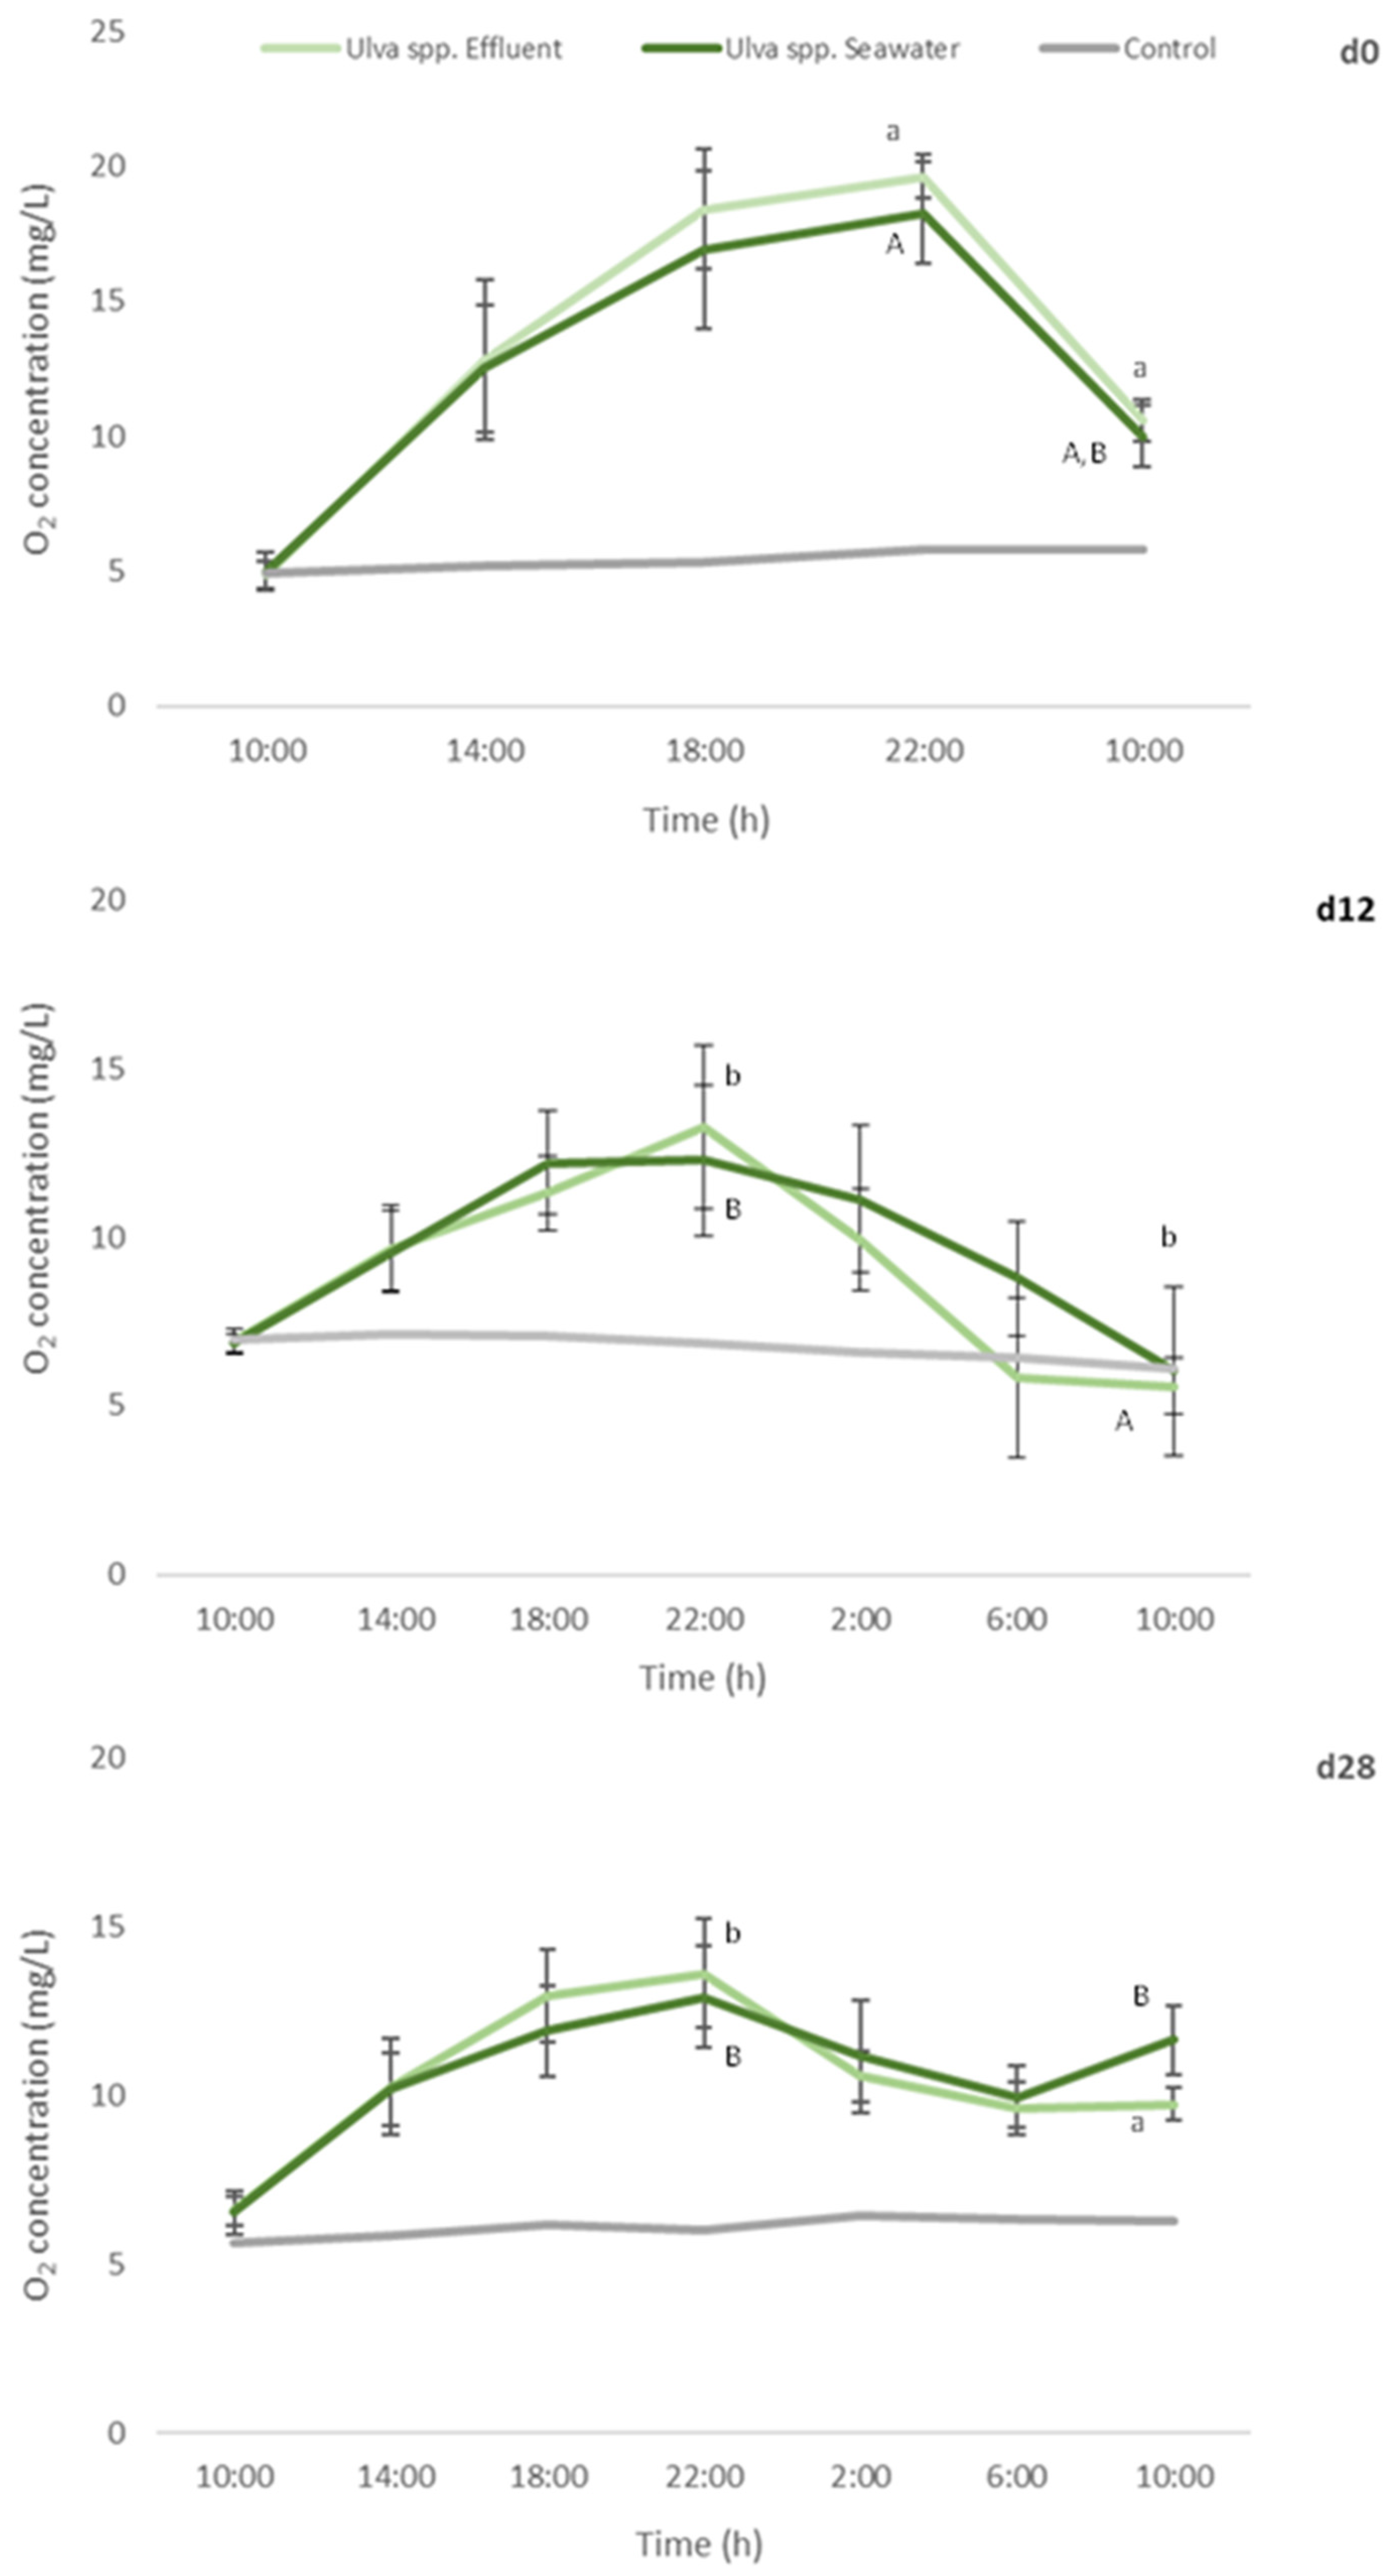
Oxygen levels in control remained constant during the assay performed in d0, d12 and d28 of the cultivation period, corroborating the absence of other sources, apart from the added macroalgae, influencing oxygen production or consumption.
No statistical differences were found between oxygen levels registered for Ulva spp. cultivated in seawater or fish effluent, during the 24 h-experiment, either for d0 or d12 and d28. Nevertheless, a significant decrease in the production of oxygen in d12 and d28 in comparison to d0 (freshly collected macroalgae) was registered (Figure 6) for both Ulva spp. under study (a reduction of 32% and 30%, respectively).
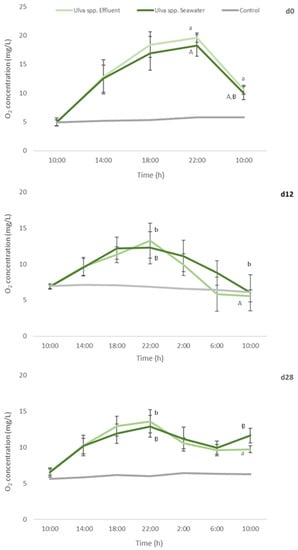
Figure 6.
Oxygen concentration determined every 4 h, during a 24 h-experiment, in autoclaved seawater with no algae addition (control), and addition of Ulva spp. cultivated in seawater or in fish effluent for 28 days. Primary production assay was performed at d0, d12 and d28 of the cultivation period. Values are presented as mean ± standard deviation, n = 5. Different letters indicate statistical difference among results. Capital letters compare data from Ulva spp. Seawater and small letters compare data from Ulva spp. Effluent.
Such results can be related with the decrease in pigments levels, especially in chlorophyll a, registered in AQUA1 and AQUA2 experiments. In addition, at the end of the assay, significantly lower [O2] were registered in d12 in comparison to d0 and d28 (final measurement, 10:00). Nevertheless, oxygen consumption was similar for d0 and d12 (a 45% and 50–55% reduction, respectively, in relation to [O2] at 22:00 (the end of the light period)) but considerably lower for d28 (<28%).
4. Discussion
In European countries with a long coastline, such as Portugal, aquaculture is generally an important economic sector, with a significant contribution to a country’s Gross Domestic Product (GDP). Coastal aquacultures are settled mainly in estuarine areas and coastal lagoons, and the majority of these productions ill-treat their effluents and do not support the costs of current waste treatment solutions [38]. IMTA can provide a possible solution and promising benefits, either economical or environmental, in the long term.
Moving aquaculture towards a more sustainable path aligned with Water Framework Directive, Marine Strategy Framework Directive and Sustainable Development Goals requires the involvement of both scientific community and aquaculture producers, as well as governmental entities. This conjoint work will allow developing more realistic and feasible solutions, that are efficient, low cost and low maintenance, for aquaculture productions and arise awareness and acceptance inside the sector.
In this view, an IMTA-pilot system, practical and of low maintenance, was designed. Its performance and suitability as a sustainable solution of effluent-treatment for coastal aquacultures was first validated with Ulva spp., as this macroalgae naturally grows in the aquaculture tanks. Our results showed that Ulva spp. can successfully grow and remediate in fish effluent, demonstrating the suitability of the IMTA pilot-system as an effluent treatment unit and of Ulva spp. for that purpose.
Previous works have demonstrated that Ulva spp. can be successfully cultivated in aquaculture effluent [32,39,40,41]. In this work, Ulva spp. thrived in effluent from Sparus aurata and Dicentrarchus labrax production tanks, either under controlled conditions in terms of temperature and light (LU1 and LU2) or under natural climactic conditions (AQUA1 and AQUA2). The growth was generally more pronounced in the first two/three periods of medium change (until ≈ 12–14 days of growth), SGRs and yields slightly decreasing until the end of the experiments. Similarly, other authors have observed that Ulva spp. can generally present fluctuations on its growth, showing periods of increased growth rates followed by periods of decreased growth or reaching a stationary phase [41,42,43].
The obtained SGRs and biomass yield are comparable with data from Brundu and Chindris [41], which cultivated Ulva spp. disks in effluent from Mugil cephalus, for 10 days, in a lab-scale static system as herein, but without medium change. In IMTA systems, Msuya et al. and Al-Hafedh et al. reported similar SGR values [40,44,45], although lower biomass yields were achieved in one’s study. On the other hand, higher SGR values (>18% day−1) have been reported in previous works [5,39,46] which used continuous effluent flow.
Several factors are known to influence the cultivation of Ulva spp., so comparison among works is somewhat difficult. For instance, the different nature and chemical composition of the effluents used, different usages of Ulva spp. (e. g., small thalli of collected algae or cut thalli in different shapes [41,47,48], cultivation of free algae specimens [32,44] or fixed to a net [42]), different experimental conditions used (e.g., dissimilar volume and shape of the tanks, aeration systems), natural environmental conditions of the geographic area [41] can induce fluctuations in Ulva spp. development.
The production of Ulva spp. biomass is also dependent upon seasonality [43,49], which was denoted in this work by the higher SGRs and yields in late spring in comparison to those of late autumn experiments. In fact, experiment LU2 highlights the importance of temperature and light exposure in Ulva spp. development. The optimal conditions allowed Ulva spp. to thrive, showing SGR and yield within the range of those of LU1 (late spring) and higher than those from AQUA2 (lower temperatures and sunlight exposure conditions).
For effluent, specifically, previous authors have reported that aquaculture effluents with different composition, in terms of salinity, nutrient content, presence of microorganisms and pathogens, can trigger different responses in Ulva specimens [32,50,51]. Moreover, continuous effluent flow improves biomass production of Ulva spp. [41], water flow velocity and aeration being key factors for inorganic nutrient acquisition and algae growth [46,52].
In AQUA1, negative SGRs and yields were observed on account of Ulva spp. entrapment in the aeration system, preventing the algae to properly recirculate in the tank. This led to loss of biomass and decolouration of Ulva spp. Such a phenomenon has been reported before [39,53] and can be an indication of stress triggered either by the lack of or improper aeration and consequent diminished exposure to sunlight or by other factors such as lack of nutrients, water flux or zoospore release [42,54]. The problem was solved by increasing the pore size of the aeration system to 2 mm, which allowed the proper upward and downward movement of the algae in the tank. No entrapment of algae was latter registered in AQUA2.
Throughout the experiments, Ulva spp. generally showed high biofiltering efficiencies. In accordance, previous studies have shown that macroalgae from genus Ulva can efficiently remediate aquaculture effluents [5,32,39,46,49,55,56]. Nutrient removal rates within the same order as those reported in literature were attained in this work and, generally, NRE showed a tendency to increase in autumn for nitrogen compounds (LU2 and AQU2) and in spring for phosphorous compounds (AQUA1). Experiment LU2 indicated that nutrient load was significantly reduced after four days. This was taken into consideration in IMTA experiments. Nevertheless, medium change in AQUA2 was performed every six days due to alterations in the fish feeding regime and normal functioning of the aquaculture on account of pandemic restrictions.
Several features can influence nutrient removal rates, such as, climatic conditions and light exposure. These are difficult to control but parameters, as tank design, fish stock density, algal strain, algae surface, nutrient load, aeration and hydraulic regime [32,39], can be improved to optimise the management and operation of the system to guarantee the efficiency of the effluent treatment. Moreover, effluent nutrient composition also depends on several factors, such as fish density, feed intake, excretion rates, the presence of microorganisms, etc., which can vary seasonally.
Initial nutrients levels (d0 and MC) varied within the same experiment and among experiments being in some cases, specifically NH4+, above the environmental minimum quality objectives establish in [57]. Higher removal rates were registered in effluent with elevated amounts of nutrients, especially NH4+, NO3− and NO2−. Ulva spp. shows a clear preference for NH4+, but continues to take up NO3− and/or NO2− even though at lower rates. This behaviour has been also reported by other authors [32,58] as the metabolisation of NH4+ requires less energy prior amino acid incorporation. On the other hand, the assimilation of NO3− and NO2− relies on a reduction reaction dependent on energy [55]. Therefore, NH4+ is generally assimilated faster and this uptake is more efficient [46,59].
Generally recognised as a second limiting factor of algae growth [60], phosphorous dynamics are rarely studied in IMTA biofiltering experiments. In fish effluent, phosphorus content is often an order of magnitude less than nitrogen content and low NRE have been reported in the past [49,61,62]. Phosphorous concentration (PO43−) was generally low in the effluent and quantifiable concentrations were only registered in AQUA1 and AQUA2.
In both IMTA assays, nutrient removal efficiencies above 40% were obtained for PO43− even at static regime. Martinéz-Arágon et al. also reported high removal efficiencies of PO43− (69–89%). The authors used a flow-through lab system to cultivate estuarine macroalgae Ulva rotundata (formerly, Ulva pseudorotundata) in fish effluent ([PO43−] within the range of the effluent used in this work) and inferred that effluent flow rate can have a major contribution to algal growth and nutrients removal [50]. Copertino et al. [49], on the other hand, reported low efficiencies rates for Ulva clathrata, cultivated in shrimp effluent, under continuous and static flow. The authors also observed a regeneration of phosphate in the medium, consenting with the conclusions of Martinéz-Arágon et al. that an improper algal growth [50] can lead to P organic decay. By contrast to nitrogen, the chemical phosphorous cycle in seawater remains complex and rather unknown and deserves further investigation.
STable 15N and 13C isotopes measured in cultivated Ulva spp. reflected the uptake of nutrients and their assimilation in the algal tissue. δ15N and δ13C are effective indicators of nitrogen and carbon pollution in aquatic ecosystems but can also be utilised as a measure of nutrient removal. Nutrients and organic material from fish waste are generally enriched in 15N and depleted in 13C [63].
δ13C acts as time-integrative measure of sewage exposure, reflecting the contributions of available nutrient sources over the period of tissue generation and turnover. δ15N, on the other hand, has been used to distinguish the two main N pollution sources, the main urban N-deposition form (NOx) and the main rural and agricultural N-deposition form (NHx). For example, NO3− from human and animal waste is enriched in δ15N, with isotopic compositions of 10‰ to 22‰, whereas nitrate in synthetic fertiliser, generally has much lower δ15N, with values ranging from −3‰ to 3‰ [64]. In one’s study, the initial δ15N values for Ulva spp. collected from the Mondego estuary (d0) show that high nitrogen loads are entering in the system.
Throughout the cultivation experiments, the δ15N values measured in the Ulva spp. reflect uptake of inputs of nitrogen from fish effluent. Ulva spp. is a fast-growing macroalgae that responds rapidly to changes in nutrient conditions, particularly to short-term N supply, as the rate of turnover of the internal N content of this macroalgae is quite short (<2 d) [65]. Therefore, it is not surprising that the changes in δ15N for Ulva spp. match with the changes in nitrogen concentrations in the pilot system, particularly for ammonium. Regarding carbon, Ulva spp. δ13C at the end of all the experiments (except for AQUA2) was depleted in 13C, and this observed pattern was probably due to the presence of effluent-derived carbon in the water.
Despite the enrichment of nitrogen, the content of crude protein of the cultivated Ulva spp. decreased over the experimental periods. Published data on the protein contents of Ulva spp. are very wide-ranging. For instance, higher contents of crude protein have been reported in autumn/winter in comparison to spring/summer [36,66]. Shuuluka et al. [37], on the other hand, registered no clear temporal pattern of crude protein content of wild and farmed Ulva species. In terms of total protein (Bradford method), the authors reported higher levels in wild Ulva uncialis (formerly, Ulva capensis) and Ulva rigida in spring and constant levels throughout the remaining seasons [37]. Herein, a similar trend was observed.
Considering the registered depletion of nutrients and enrichment of nitrogen in the cultivated Ulva spp., increased protein contents were expected. In spring (AQUA1), both coastal and estuarine Ulva spp. specimens showed a significant loss of total and crude protein. In autumn (AQUA2), total protein content augmented and remained constant until the end of the experiment, although crude protein tended to decrease. Exposure to light saturating conditions can reduce nitrogen uptake in macroalgae tissue and the lower exposure to sunlight and temperatures during autumn can promote nitrogen uptake [36] which can justify the different trends registered in this work. Such environmental features, as well as others such as salinity and nutrient availability, can influence the synthesis and inhibition of protein [67]. Apart from this, in AQUA1, the entrapment of algae in the aeration system affected the growth of the cultivated Ulva spp., which also contributed to the decrease on protein content. Previous works reported an increment in protein content (20–35%) in cultivated Ulva spp. [36,46,66,68]. Alternatively, Shuuluka et al. registered protein contents (5.23–9.89% dry weight) similarly to those obtained in this study and observed no significant seasonal variation on protein contents [37].
A similar trend was registered for pigments contents. Photosynthetic parameters in algae have been shown to respond to environmental changes faster than the content of C and N [69]. The levels of chlorophyll a and b and carotenoids tended to decrease throughout the cultivation periods in AQUA1 and AQUA2, results that are in accordance with the reduction of oxygen production capability of Ulva spp. cultivated, for 28 days, in fish effluent.
Macroalgae productivity is known to change depending on the metabolic expression and adaptations to the environmental variability to which they are exposed [70]. In fact, ecotoxicological studies show that stress factors can inhibit respiration rates [71,72,73], and Ulva species have been used as a quick response environmental bioindicator [74].
Stress factors, such as algae poor circulation in cultivation system (AQUA1) and consequent lower exposure to light, may contribute to the reduction on pigments levels. The content of chlorophyll can determine the potential photosynthesis [75] and therefore the production of oxygen [76]. Biotic and abiotic factors, such as temperature, salinity, irradiance, high nutrient supply, zoospore formation, growth, can influence photosynthetic response [51,69,77,78,79] and stimulate or inhibit the production of pigments.
As for algae growth, flow rate and stocking density are two important parameters that can influence the protein content of cultivated macroalgae and photosynthesis response [36]. The combination of high flow rates and stocking density favours the nitrogen-uptake since macroalgae have access to higher loads of nutrients and are less exposed to light [36]. Therefore, the operation on continuous flow is a pivotal improvement to the IMTA-pilot system.
A comparison between Ulva spp. grown in an estuarine area and Ulva spp. grown in a coastal area (more exposed to tidal currents, higher salinity and with less nutrient availability) was also conducted. In terms of growth, Ulva spp. from coast required a longer period (7 days) to adapt to the cultivation medium (lower in salinity and higher in nutrient load comparing to seawater) than Ulva spp. from estuary. After 7 days, SGRs and yields were within the same range. Enriched δ15N signatures were found in estuarine Ulva spp., as expected. Protein and pigments content throughout the cultivation assays did not differ statistically. NRE was also similar, although at the end of the cultivation period it was observed a higher reduction of [PO43−] in tanks with estuarine Ulva spp. and of [NH4+] in tanks with coastal Ulva spp. A previous work reported differences regarding the growth performance of Ulva species from seawater or brackish water habitats, denoting a better performance for Ulva naturally occurring in brackish water [80]. Similar to this work, no significant differences for nutrient uptake were reported. In one’s case, the origin of the algae (from the coast or the estuary) seems not to be a determining factor to ensure the successful production of algae in IMTA systems.
For the trials performed, the pilot system implemented required low energy and low maintenance to properly work. Maintenance procedures included the cleaning of the system, namely, the filtration system (weekly), the tank units (monthly) and the aeration system (in case of hose blockage, which was only observed once in a period of biofilm proliferation). The operation on continuous flow will be an improvement but it will also increase energy expenses. Therefore, measures and adaptations are under study in order to successfully upscale the designed system.
As seen, the composition of the macroalgae will depend upon cultivation conditions, but also, upon growth location, seasonality and specific species [36]. With low maintenance and low control of the cultivation procedure, the proliferation of epyphites in the cultivated macroalgae is likely to occur. For that reason, the application of the biomass produced can be targeted for agriculture as fertiliser. Ulva species are composed by valuable polysaccharides, including ulvans and oligosaccharides, protein and essential amino acids, macro and trace elements, e.g., iron and manganese and in lower content, lipids (e.g., n-3 polyunsaturated fatty acids (PUFAs), such as α-linolenic acid, eicosapentaenoic acid and docosahexaenoic acid [81,82,83]. With such chemical composition, Ulva spp. is a valuable resource with economical interest and that can be applied for food, feed and fertiliser.
The application of Ulva spp. as soil amendments, either in bulk or as an extract, has proven to be beneficial for crops with increased germination, growth rates and root proliferation [84,85,86] and improved plant development [87,88]. However, also, for soil, improving its structure [89]. Macroalgae-based fertilisers or biostimulants are biodegradable, non-toxic, non-polluting, and non-hazardous to humans, terrestrial and aquatic organisms. Considering that agriculture is an important economic sector of Vale do Mondego area, the application of the farmed Ulva as fertiliser will contribute for a more sustainable agriculture and improve regional economy.
5. Conclusions
The IMTA-pilot system designed and presented herein seems a promising effluent treatment for coastal aquacultures given the successful cultivation of Ulva spp. and high biofiltering efficiencies achieved, even in static flow. Still, the operation on continuous flow is an improvement to be implemented in the future.
Finding eco-friendly solutions for aquaculture effluent treatment and of simple and efficient operation is pivotal to promote sustainability in the aquaculture sector. Macroalgae-based IMTA are dependent on seasonality and macroalgae’s life cycle. The cultivation of different algae species throughout the year can be the key to overcome this limitation and ensure the success of these systems as permanent effluent treatment units, benefiting the adjoining ecosystems with cleaner discharges.
Moreover, in Vale do Mondego area, the cultivated macroalgae biomass can be applied locally as fertiliser and soil addictive, increasing the profit of aquaculture producers and promoting local economy.
Author Contributions
Conceptualisation, A.C.S.R. and A.C.G.; methodology, A.C.S.R., L.R. and J.F.; investigation, A.C.S.R., L.R., J.F., C.M., D.P. and A.B.; data curation, A.C.S.R., L.R., J.F. and A.B.; writing—original draft preparation, A.C.S.R. and L.R.; writing—review and editing, A.C.S.R., L.R., J.F., C.M., D.P., A.C.G. and A.B.; supervision A.C.S.R.; project administration, A.C.S.R.; funding acquisition, A.C.S.R. and A.C.G. All authors have read and agreed to the published version of the manuscript.
Funding
This research was supported by MAR2020, PORTUGAL2020 Partnership Agreement, through IFAP and ERDF (reference MAR-04.03.01-FEAMP-0007).
Acknowledgments
This article is a result of the project ALGADEPUR—Aquacultura Multitrófica Integrada como veículo para a sustentabilidade (reference MAR-04.03.01-FEAMP-0007), supported by MAR2020, PORTUGAL2020 Partnership Agreement, through FEAMPA. The authors would like to acknowledge Nasharyba—Produção e Comérico de Peixe, Lda. for all the support given during this work and the space provided for the IMTA-pilot system. The authors would also like to acknowledge Ana Margarida Bóia and José Almeida for assisting in part of the work performed.
Conflicts of Interest
The authors declare no conflict of interest.
References
- FAO. Food and agriculture organization of the united nations Aquaculture development, Ecosystem approach to aquaculture. In FAO Technical Guidelines for Reponsible Fisheries; Suppl. 4; Food and Agriculture Organization of the United Nations: Rome, Italy, 2010; Volume 5, p. 53. ISBN 9789251066508. [Google Scholar]
- Turcios, A.E.; Papenbrock, J. Sustainable treatment of aquaculture effluents-What can we learn from the past for the future? Sustainability 2014, 6, 836–856. [Google Scholar] [CrossRef]
- Gutierrez-Wing, M.T.; Malone, R.F. Biological filters in aquaculture: Trends and research directions for freshwater and marine applications. Aquac. Eng. 2006, 34, 163–171. [Google Scholar] [CrossRef]
- Van Rijn, J. The potential for integrated biological treatment systems in recirculating fish culture—A review. Aquaculture 1996, 139, 181–201. [Google Scholar] [CrossRef]
- Neori, A.; Msuya, F.E.; Shauli, L.; Schuenhoff, A.; Kopel, F.; Shpigel, M. A novel three-stage seaweed (Ulva lactuca) biofilter design for integrated mariculture. J. Appl. Phycol. 2003, 15, 543–553. [Google Scholar] [CrossRef]
- Wu, H.; Huo, Y.; Hu, M.; Wei, Z.; He, P. Eutrophication assessment and bioremediation strategy using seaweeds co-cultured with aquatic animals in an enclosed bay in China. Mar. Pollut. Bull. 2015, 95, 342–349. [Google Scholar] [CrossRef]
- Dauda, A.B.; Ajadi, A.; Tola-Fabunmi, A.S.; Akinwole, A.O. Waste production in aquaculture: Sources, components and managements in different culture systems. Aquac. Fish. 2019, 4, 81–88. [Google Scholar] [CrossRef]
- European Union. Revised European Union Maritime Security Strategy (EUMSS); Council of the European Union: Brussels, Belgium, 2018; ISBN 9781119130536. [Google Scholar]
- European Union. European Union Directive 2000/60/EC of the European Parliament of the Council of 23 October 2000 establishing a framework for community action in the field of water policy (Water Framework Directive). Off. J. Eur. Communities 2000, 327, 1–93. [Google Scholar]
- Chopin, T. Aquaculture, Integrated Multi-trophic (IMTA). In Sustainable Food Production; Meyers, R.A., Ed.; Springer: New York, NY, USA, 2013; pp. 184–205. [Google Scholar]
- Neori, A.; Chopin, T.; Troell, M.; Buschmann, A.H.; Kraemer, G.P.; Halling, C.; Shpigel, M.; Yarish, C. Integrated aquaculture: Rationale, evolution and state of the art emphasizing seaweed biofiltration in modern mariculture. Aquaculture 2004, 231, 361–391. [Google Scholar] [CrossRef]
- Fleurence, J.; Morançais, M.; Dumay, J.; Decottignies, P.; Turpin, V.; Munier, M.; Garcia-Bueno, N.; Jaouen, P. What are the prospects for using seaweed in human nutrition and for marine animals raised through aquaculture? Trends Food Sci. Technol. 2012, 27, 57–61. [Google Scholar] [CrossRef]
- Kleitou, P.; Kletou, D.; David, J. Is Europe ready for integrated multi-trophic aquaculture? A survey on the perspectives of European farmers and scientists with IMTA experience. Aquaculture 2018, 490, 136–148. [Google Scholar] [CrossRef]
- Knowler, D.; Chopin, T.; Martínez-Espiñeira, R.; Neori, A.; Nobre, A.; Noce, A.; Reid, G. The economics of Integrated Multi-Trophic Aquaculture: Where are we now and where do we need to go? Rev. Aquac. 2020, 12, raq.12399. [Google Scholar] [CrossRef]
- Leitão, R.; Martinho, F.; Cabral, H.N.; Neto, J.M.; Jorge, I.; Pardal, M.A. The fish assemblage of the Mondego estuary: Composition, structure and trends over the past two decades. Hydrobiologia 2007, 587, 269–279. [Google Scholar] [CrossRef]
- Suthar, P.; Gajaria, T.K.; Reddy, C.R.K.K. Production of quality seaweed biomass through nutrient optimization for the sustainable land-based cultivation. Algal Res. 2019, 42, 101583. [Google Scholar] [CrossRef]
- Lamprianidou, F.; Telfer, T.; Ross, L.G. A model for optimization of the productivity and bioremediation efficiency of marine integrated multitrophic aquaculture. Estuar. Coast. Shelf Sci. 2015, 164, 253–264. [Google Scholar] [CrossRef]
- Ktari, L. Pharmacological Potential of Ulva Species: A Valuable Resource. J. Anal. Pharm. Res. 2017, 6, 00165. [Google Scholar] [CrossRef][Green Version]
- Sudhakar, M.P.; Kumar, B.R.; Mathimani, T.; Arunkumar, K. A review on bioenergy and bioactive compounds from microalgae and macroalgae-sustainable energy perspective. J. Clean. Prod. 2019, 228, 1320–1333. [Google Scholar] [CrossRef]
- Vidyashankar, S.; Ravishankar, G.A. Algae-Based Bioremediation. In Bioremediation and Bioeconomy; Elsevier: Amsterdam, The Netherlands, 2016; pp. 457–493. ISBN 9780128028728. [Google Scholar]
- Veríssimo, H.; Verdelhos, T.; Baeta, A.; van der Linden, P.; Garcia, A.C.; Marques, J.C. Comparison of thermodynamic-oriented indicators and trait-based indices ability to track environmental changes: Response of benthic macroinvertebrates to management in a temperate estuary. Ecol. Indic. 2017, 73, 809–824. [Google Scholar] [CrossRef]
- Duarte, A.S.; Pinho, J.; Pardal, M.Â.; Neto, J.M.; Vieira, J.; Santos, F.S. Hydrodynamic modelling for Mondego estuary water quality management. In Aquatic Ecology of the Mondego River Basin Global Importance of Local Experience; Imprensa da Universidade de Coimbra: Coimbra, Portugal, 2002; pp. 29–42. ISBN 978-989-26-0336-0. [Google Scholar]
- Oliveira, F.S.B.F.; Freire, P.M.S.; Larangeiro, S.H.C.D. Characterisation of the dynamics of Figueira da foz beach, Portugal. J. Coast. Res. 2002, 36, 552–563. [Google Scholar] [CrossRef]
- Gaspar, R.; Pereira, L.; Sousa-Pinto, I. The seaweed resources of Portugal. Bot. Mar. 2019, 62, 499–525. [Google Scholar] [CrossRef]
- Evans, G. The Quantitative Analysis of Plant Growth; Blackwell Scientific Publications: Oxford, UK, 1972; ISBN 0632061308/9780632061303. [Google Scholar]
- Duke, C.; Lapointe, B.E.; Ramus, J. Effects of irradiance on growth, RuBPCase activity and chemical composition of Ulva species (Chlorophyta). J. Phycol. 1986, 22, 362–370. [Google Scholar] [CrossRef]
- Houba, V.J.; Novozamsky, I.; Uittenbogaard, J.; Van Der Lee, J.J. Automatic determination of “total soluble nitrogen” in soil extracts. Landwirtsch. Forsch. 1987, 40, 295–302. [Google Scholar]
- Kroon, H. Determination of nitrogen in water: Comparison of a continuous-flow method with on-line UV digestion with the original Kjeldahl method. Anal. Chim. Acta 1993, 276, 287–293. [Google Scholar] [CrossRef]
- Krom, M.D. Spectrophotometric determination of ammonia: A study of a modified berthelot reaction using salicylate and dichloroisocyanurate. Analyst 1980, 105, 305–316. [Google Scholar] [CrossRef]
- (ISO 15681-1:2003) International Organization for Standardization; Water Quality—Determination of Orthophosphate and Total Phosphorus Contents by Flow Analysis (FIA and CFA)—Part 1: Method by Flow Injection Analysis (FIA). International Organization for Standardization: Geneva, Switzerland, 2003; Volume 3, p. 16.
- (ISO 16264:2002) International Organization for Standardization; Water Quality—Determination of Soluble Silicates by Flow Analysis (FIA and CFA) and Photometric Detection. International Organization for Standardization: Geneva, Switzerland, 2002; Volume 1, p. 11.
- Aníbal, J.; Madeira, H.T.; Carvalho, L.F.; Esteves, E.; Veiga-Pires, C.; Rocha, C. Macroalgae mitigation potential for fish aquaculture effluents: An approach coupling nitrogen uptake and metabolic pathways using Ulva rigida and Enteromorpha clathrata. Environ. Sci. Pollut. Res. 2014, 21, 13324–13334. [Google Scholar] [CrossRef] [PubMed]
- Baeta, A.; Valiela, I.; Rossi, F.; Pinto, R.; Richard, P.; Niquil, N.; Marques, J.C. Eutrophication and trophic structure in response to the presence of the eelgrass Zostera noltii. Mar. Biol. 2009, 156, 2107–2120. [Google Scholar] [CrossRef]
- Kumar, M.; Kumari, P.; Gupta, V.; Anisha, P.A.; Reddy, C.R.K.; Jha, B. Differential responses to cadmium induced oxidative stress in marine macroalga Ulva lactuca (Ulvales, Chlorophyta). BioMetals 2010, 23, 315–325. [Google Scholar] [CrossRef] [PubMed]
- Bradford, M.M. A rapid and sensitive method for the quantitation of microgram quantities of protein utilizing the principle of protein-dye binding. Anal. Biochem. 1976, 72, 248–254. [Google Scholar] [CrossRef]
- Queirós, A.S.; Circuncisão, A.R.; Pereira, E.; Válega, M.; Abreu, M.H.; Silva, A.M.S.; Cardoso, S.M. Valuable nutrients from ulva rigida: Modulation by seasonal and cultivation factors. Appl. Sci. 2021, 11, 6137. [Google Scholar] [CrossRef]
- Shuuluka, D.; Bolton, J.J.; Anderson, R.J. Protein content, amino acid composition and nitrogen-to-protein conversion factors of Ulva rigida and Ulva capensis from natural populations and Ulva lactuca from an aquaculture system, in South Africa. J. Appl. Phycol. 2013, 25, 677–685. [Google Scholar] [CrossRef]
- Brugère, C.; Aguilar-Manjarrez, J.; Beveridge, M.C.M.; Soto, D. The ecosystem approach to aquaculture 10 years on—A critical review and consideration of its future role in blue growth. Rev. Aquac. 2019, 11, 493–514. [Google Scholar] [CrossRef]
- Ben-Ari, T.; Neori, A.; Ben-Ezra, D.; Shauli, L.; Odintsov, V.; Shpigel, M. Management of Ulva lactuca as a biofilter of mariculture effluents in IMTA system. Aquaculture 2014, 434, 493–498. [Google Scholar] [CrossRef]
- Al-Hafedh, Y.S.; Alam, A.; Buschmann, A.H. Bioremediation potential, growth and biomass yield of the green seaweed, Ulva lactuca in an integrated marine aquaculture system at the Red Sea coast of Saudi Arabia at different stocking densities and effluent flow rates. Rev. Aquac. 2015, 7, 161–171. [Google Scholar] [CrossRef]
- Brundu, G.; Chindris, A. Nutrients uptake and growth of Ulva lactuca (Linnaeus, 1753) in grey mullet (Mugil cephalus) wastewater versus natural estuarine water. Chem. Ecol. 2018, 34, 495–505. [Google Scholar] [CrossRef]
- Favot, G.; Cunha, E.; Ferreira, H.Q. Production of Ulva Sp. in Multitrophic Aquaculture in Earth Ponds. Aquac. Fish. Stud. 2019, 1, 1–8. [Google Scholar] [CrossRef]
- Bruhn, A.; Dahl, J.; Nielsen, H.B.; Nikolaisen, L.; Rasmussen, M.B.; Markager, S.; Olesen, B.; Arias, C.; Jensen, P.D. Bioenergy potential of Ulva lactuca: Biomass yield, methane production and combustion. Bioresour. Technol. 2011, 102, 2595–2604. [Google Scholar] [CrossRef] [PubMed]
- Al-Hafedh, Y.S.; Alam, A.; Buschmann, A.H.; Fitzsimmons, K.M. Experiments on an integrated aquaculture system (seaweeds and marine fish) on the Red Sea coast of Saudi Arabia: Efficiency comparison of two local seaweed species for nutrient biofiltration and production. Rev. Aquac. 2012, 4, 21–31. [Google Scholar] [CrossRef]
- Msuya, F.E.; Kyewalyanga, M.S.; Salum, D. The performance of the seaweed Ulva reticulata as a biofilter in a low-tech, low-cost, gravity generated water flow regime in Zanzibar, Tanzania. Aquaculture 2006, 254, 284–292. [Google Scholar] [CrossRef]
- Diamahesa, W.A.; Masumoto, T.; Jusadi, D.; Setiawati, M. Growth and protein content of ulva prolifera maintained at different flow rates in integrated aquaculture system. J. Ilmu dan Teknol. Kelaut. Trop. 2017, 9, 429–441. [Google Scholar] [CrossRef]
- Figueroa, F.L.; Nygård, C.; Ekelund, N.; Gómez, I. Photobiological characteristics and photosynthetic UV responses in two Ulva species (Chlorophyta) from southern Spain. J. Photochem. Photobiol. B Biol. 2003, 72, 35–44. [Google Scholar] [CrossRef]
- Kaladharan, P.; Gireesh, R. Laboratory culture of Gracilaria spp. and Ulva lactuca in seawater enriched media. Seaweed Res. Util. 2003, 25, 139–142. [Google Scholar]
- Copertino, M.D.S.; Tormena, T.; Seeliger, U. Biofiltering efficiency, uptake and assimilation rates of Ulva clathrata (Roth) J. Agardh (Clorophyceae) cultivated in shrimp aquaculture waste water. J. Appl. Phycol. 2009, 21, 31–45. [Google Scholar] [CrossRef]
- Hernández, I.; Martínez-Aragón, J.F.; Tovar, A.; Pérez-Lloréns, J.L.; Vergara, J.J. Biofiltering efficiency in removal of dissolved nutrients by three species of estuarine macroalgae cultivated with sea bass (Dicentrarchus labrax) waste waters 2. Ammonium. J. Appl. Phycol. 2002, 14, 375–384. [Google Scholar] [CrossRef]
- Mantri, V.A.; Singh, R.P.; Bijo, A.J.; Kumari, P.; Reddy, C.R.K.; Jha, B. Differential response of varying salinity and temperature on zoospore induction, regeneration and daily growth rate in Ulva fasciata (Chlorophyta, Ulvales). J. Appl. Phycol. 2011, 23, 243–250. [Google Scholar] [CrossRef]
- Msuya, F.E.; Neori, A. Effect of water aeration and nutrient load level on biomass yield, N uptake and protein content of the seaweed Ulva lactuca cultured in seawater tanks. J. Appl. Phycol. 2008, 20, 1021–1031. [Google Scholar] [CrossRef]
- Neori, A.; Cohen, I.; Gordin, H. Ulva lactuca Biofilters for Marine Fishpond Effluents II. Growth Rate, Yield and C:N Ratio. Bot. Mar. 1991, 34, 483–490. [Google Scholar] [CrossRef]
- Nielsen, M.M.; Bruhn, A.; Rasmussen, M.B.; Olesen, B.; Larsen, M.M.; Møller, H.B. Cultivation of Ulva lactuca with manure for simultaneous bioremediation and biomass production. J. Appl. Phycol. 2012, 24, 449–458. [Google Scholar] [CrossRef]
- Luo, M.B.; Liu, F.; Xu, Z.L. Growth and nutrient uptake capacity of two co-occurring species, Ulva prolifera and Ulva linza. Aquat. Bot. 2012, 100, 18–24. [Google Scholar] [CrossRef]
- Liu, J.; Wang, Z.; Lin, W. De-eutrophication of effluent wastewater from fish aquaculture by using marine green alga Ulva pertusa. Chin. J. Oceanol. Limnol. 2010, 28, 201–208. [Google Scholar] [CrossRef]
- Ministério do Ambiente. Decreto-Lei n.∘ 236/98; Diário da República n.∘ 176/1998, Série I-A 1998-08-01; Ministério do Ambiente: Lisbon, Portugal, 1998; N∘ 176; pp. 3676–3722.
- Kang, Y.H.; Park, S.R.; Chung, I.K. Biofiltration efficiency and biochemical composition of three seaweed species cultivated in a fish-seaweed integrated culture. Algae 2011, 26, 97–108. [Google Scholar] [CrossRef]
- Mandal, S.; Shurin, J.B.; Efroymson, R.A.; Mathews, T.J. Functional divergence in nitrogen uptake rates explains diversity—Productivity relationship in microalgal communities. Ecosphere 2018, 9, e02228. [Google Scholar] [CrossRef]
- Troell, M.; Halling, C.; Neori, A.; Chopin, T.; Buschmann, A.H.; Kautsky, N.; Yarish, C. Integrated mariculture: Asking the right questions. Aquaculture 2003, 226, 69–90. [Google Scholar] [CrossRef]
- Neori, A.; Krom, M.D.; Ellner, S.P.; Boyd, C.E.; Popper, D.; Rabinovitch, R.; Davison, P.J.; Dvir, O.; Zuber, D.; Ucko, M.; et al. Seaweed biofilters as regulators of water quality in integrated fish-seaweed culture units. Aquaculture 1996, 141, 183–199. [Google Scholar] [CrossRef]
- Neori, A.; Ragg, N.; Shpigel, M. The integrated culture of seaweed, abalone, fish and clams in modular intensive land-based systems: II. Performance and nitrogen partitioning within an abalone (Haliotis tuberculata) and macroalgae culture system. Aquac. Eng. 1998, 17, 215–239. [Google Scholar] [CrossRef]
- Callier, M.D.; Lefebvre, S.; Dunagan, M.K.; Bataillé, M.-P.; Coughlan, J.; Crowe, T.P. Shift in benthic assemblages and organisms’ diet under salmon farms: Community structure and stable isotope analyses. Mar. Ecol. Prog. Ser. 2013, 483, 153–167. [Google Scholar] [CrossRef]
- Baeta, A. Stable Isotope Ecology. In Encyclopedia of Ecology, 2nd ed.; Fath, B., Ed.; Elsevier: Oxford, UK, 2019; Volume 3, pp. 606–615. [Google Scholar] [CrossRef]
- Teichberg, M.; Heffner, L.R.; Fox, S.; Valiela, I. Nitrate reductase and glutamine synthetase activity, internal N pools, and growth of Ulva lactuca: Responses to long and short-term N supply. Mar. Biol. 2007, 151, 1249–1259. [Google Scholar] [CrossRef]
- Gadberry, B.A.; Colt, J.; Maynard, D.; Boratyn, D.C.; Webb, K.; Johnson, R.B.; Saunders, G.W.; Boyer, R.H.; Gadberry, B.A.; Colt, J.; et al. Intensive land-based production of red and green macroalgae for human consumption in the pacific northwest: An evaluation of seasonal growth, yield, nutritional composition, and contaminant levels. Algae 2018, 33, 109–125. [Google Scholar] [CrossRef]
- Marinho-Soriano, E.; Fonseca, P.C.; Carneiro, M.A.A.; Moreira, W.S.C. Seasonal variation in the chemical composition of two tropical seaweeds. Bioresour. Technol. 2006, 97, 2402–2406. [Google Scholar] [CrossRef] [PubMed]
- Robertson-Andersson, D.V.; Potgieter, M.; Hansen, J.; Bolton, J.J.; Troell, M.; Anderson, R.J.; Halling, C.; Probyn, T. Integrated seaweed cultivation on an abalone farm in South Africa. J. Appl. Phycol. 2008, 20, 579–595. [Google Scholar] [CrossRef]
- Figueroa, F.L.; Israel, A.; Neori, A.; Martínez, B.; Malta, E.J.; Ang, P., Jr.; Inken, S.; Marquardt, R.; Korbee, N. Effects of nutrient supply on photosynthesis and pigmentation in Ulva lactuca (Chlorophyta): Responses to short-term stress. Aquat. Biol. 2009, 7, 173–183. [Google Scholar] [CrossRef]
- Gómez, N.; Donato, C.; Giorgi, A.; Guash, H.; Mateo, P.; Sabater, S. La biota de los ríos: Los microorganismos autótrofos. In Conceptos y Técnicas en Ecología Fluvial; Sabater, S., Elosegi, A., Eds.; Fundación BBVA: Bilbao, Spain, 2009; pp. 219–242. ISBN 978-84-96515-87-1. [Google Scholar]
- Webster, E.A.; Gadd, G.M. Stimulation of respiration in Ulva lactuca by high concentrations of cadmium and zinc: Evidence for an alternative respiratory pathway. Environ. Toxicol. Water Qual. 1996, 11, 7–12. [Google Scholar] [CrossRef]
- Zambrano, J.; Carballeira, A. Effects of hydrocarbons on the physiology and growth of Ulva sp. (Chlorophyta). Bol.-Inst. Esp. Oceanogr. 1999, 15, 373–381. [Google Scholar]
- Zou, D.; Gao, K.; Xia, J. Dark respiration in the light and in darkness of three marine macroalgal species grown under ambient and elevated CO2 concentrations. Acta Oceanol. Sin. 2011, 30, 106–112. [Google Scholar] [CrossRef]
- Omar, W.M.W. Perspectives on the use of algae as biological indicators for monitoring and protecting aquatic environments, with special reference to Malaysian freshwater ecosystems. Trop. Life Sci. Res. 2010, 21, 51–67. [Google Scholar] [PubMed]
- Lambers, H.; Chapin, F.S.; Pons, T.L. Plant Physiological Ecology, 2nd ed.; Springer: New York, NY, USA, 2008; pp. 1–604. [Google Scholar] [CrossRef]
- Wang, Y.; Qu, T.; Zhao, X.; Tang, X.; Xiao, H.; Tang, X. A comparative study of the photosynthetic capacity in two green tide macroalgae using chlorophyll fluorescence. Springerplus 2016, 5, 775. [Google Scholar] [CrossRef]
- Jie, X.; Xiaohong, Z.; Chunlei, G.; Meijie, J.; Ruixiang, L.; Zongling, W.; Yan, L.; Shiliang, F.; Xuelei, Z. Effect of temperature, salinity and irradiance on growth and photosynthesis of Ulva prolifera. Acta Oceanol. Sin. 2016, 35, 114–121. [Google Scholar] [CrossRef]
- Chen, B.; Zou, D. Altered seawater salinity levels affected growth and photosynthesis of Ulva fasciata (Ulvales, Chlorophyta) germlings. Acta Oceanol. Sin. 2015, 34, 108–113. [Google Scholar] [CrossRef]
- Shi, X.; Qi, M.; Tang, H.; Han, X. Spatial and temporal nutrient variations in the Yellow Sea and their effects on Ulva prolifera blooms. Estuar. Coast. Shelf Sci. 2015, 163, 36–43. [Google Scholar] [CrossRef]
- Martins, M.A.; da SILVA, V.F.; Tarapuez, P.R.; Hayashi, L.; Vieira, F.D.N. Cultivation of the seaweed ulva spp. With effluent from a shrimp biofloc rearing system: Different species and stocking density. Bol. Do Inst. De Pesca 2020, 46, 1–6. [Google Scholar] [CrossRef]
- Paiva, L.; Lima, E.; Patarra, R.F.; Neto, A.I.; Baptista, J. Edible Azorean macroalgae as source of rich nutrients with impact on human health. Food Chem. 2014, 164, 128–135. [Google Scholar] [CrossRef]
- Circuncisão, A.R.; Catarino, M.D.; Cardoso, S.M.; Silva, A.M.S. Minerals from Macroalgae Origin: Health Benefits and Risks for Consumers. Mar. Drugs 2018, 16, 400. [Google Scholar] [CrossRef]
- Pereira, L. Seaweed: Ecology, nutrient composition and medicinal uses. In Ecology, Nutrient Composition and Medicinal Uses; Pomin, V.H., Ed.; Nova Science Publishers: Coimbra, Portugal, 2011; pp. 15–49. ISBN 9781614708780. [Google Scholar]
- Duarte, I.; Hernández, S.; Ibañez, A.; Canto, A. Macroalgae as Soil Conditioners or Growth Promoters of Pisum sativum (L). Annu. Res. Rev. Biol. 2018, 27, 1–8. [Google Scholar] [CrossRef]
- Sunarpi, H.; Ansyarif, F.; Putri, F.E.; Azmiati, S.; Nufus, N.H.; Suparman; Widyastuti, S.; Prasedya, E.S. Effect of Indonesian macroalgae based solid and liquid fertilizers on the growth and yield of rice (Oryza sativa). Asian J. Plant Sci. 2019, 18, 15–20. [Google Scholar] [CrossRef]
- Türkmen, M.; Su, A. The Effect of Sea Lettuce (Ulva lactuca) Liquid Fertilizer and Zeolite Combinations on the Development of Cucumber (Cucumis sativus). Turk. J. Agric.-Food Sci. Technol. 2019, 7, 1021. [Google Scholar] [CrossRef]
- Hernández-Herrera, R.M.; Santacruz-Ruvalcaba, F.; Ruiz-López, M.A.; Norrie, J.; Hernández-Carmona, G. Effect of liquid seaweed extracts on growth of tomato seedlings (Solanum lycopersicum L.). J. Appl. Phycol. 2014, 26, 619–628. [Google Scholar] [CrossRef]
- Khan, W.; Rayirath, U.P.; Subramanian, S.; Jithesh, M.N.; Rayorath, P.; Hodges, D.M.; Critchley, A.T.; Craigie, J.S.; Norrie, J.; Prithiviraj, B. Seaweed extracts as biostimulants of plant growth and development. J. Plant Growth Regul. 2009, 28, 386–399. [Google Scholar] [CrossRef]
- Arioli, T.; Mattner, S.W.; Winberg, P.C. Applications of seaweed extracts in Australian agriculture: Past, present and future. J. Appl. Phycol. 2015, 27, 2007–2015. [Google Scholar] [CrossRef]
Publisher’s Note: MDPI stays neutral with regard to jurisdictional claims in published maps and institutional affiliations. |
© 2021 by the authors. Licensee MDPI, Basel, Switzerland. This article is an open access article distributed under the terms and conditions of the Creative Commons Attribution (CC BY) license (https://creativecommons.org/licenses/by/4.0/).

