Article

Microwave Synthesis, Characterization and Perspectives of Wood Pencil-Derived Carbon

by
Nikolaos Chalmpes
1,*,
Georgios Asimakopoulos
1,
Maria Baikousi
1,
Constantinos E. Salmas
1,*,
Dimitrios Moschovas
1,
Apostolos Avgeropoulos
1,
Athanasios B. Bourlinos
2,*,
Iosif Tantis
3,
Aristides Bakandritsos
3,4,
Dimitrios Gournis
1 and
Michael A. Karakassides
1,*
1
Department of Materials Science & Engineering, University of Ioannina, 45110 Ioannina, Greece
2
Physics Department, University of Ioannina, 45110 Ioannina, Greece
3
Regional Centre of Advanced Technologies and Materials, Czech Advanced Technology and Research Institute, Palacký University, Křížkovského 511/8, 77900 Olomouc, Czech Republic
4
Nanotechnology Centre, Centre of Energy and Environmental Technologies, VŠB-Technical University of Ostrava, 70800 Ostrava, Czech Republic
*
Authors to whom correspondence should be addressed.
Appl. Sci. 2022, 12(1), 410; https://doi.org/10.3390/app12010410
Submission received: 2 December 2021 / Revised: 27 December 2021 / Accepted: 28 December 2021 / Published: 1 January 2022
(This article belongs to the Special Issue Characterization and Application of Nanoporous Materials)

Abstract

:
More than 14 billion pencils are manufactured and used globally every year. On average, a pencil is discarded after 60% of its original length has been depleted. In the present work we propose a simple and affordable way of converting this non-neglectable amount of waste into added value carbon product. In particular, we demonstrate the microwave synthesis of carbon from the wood pencil with and without chemical activation. This could be a process stage before the final recycling of the expensive graphite core. In the latter case, irradiation of the wood pencil in a domestic microwave oven heats up the pencil’s graphite core, thus inducing carbonization of its wood casing. The carbonized product consists of amorphous carbon nanosheets having relatively low surface area. However, if the wood pencil is soaked in 50% KOH aqueous solution prior to microwave irradiation, a significantly higher surface area of carbon is obtained, consisting of irregular-shaped porous particles. Consequently, the obtained carbon can easily decolorize a methylene blue aqueous solution, can be used to make pocket warmers or gunpowder, and lastly, serves as an excellent adsorbent towards Cr(VI) removal from water, showing a maximum adsorption capacity of 70–75 mg/g within 24 h at 23 °C, pH = 3.

1. Introduction

Pencils have been fundamental in mankind history for writing, drawing or recording information. It is even more surprising, though, that pencils bring an air of creativity when used by children for educational purposes, scientists for writing down new ideas, novelists and poets for creating new essays, astronauts for taking notes on space, architects for designing new patterns and artists for sketching new drawings on canvas or for making impressive pencil tip sculptures. It is for all these reasons and more that pencils are widely used in our everyday life in large quantities. Characteristically, it is estimated that more than 14 billion pencils are globally produced every year to cover our needs or other intellectual quests.
These small yet socio-influential carbon-containing wonders are simply made of a molded graphite core and a wood casing. For making the core, graphite is mixed with clay filler in the presence of water to obtain a thick paste. The paste is forced through a mold to create a spaghetti-like string, which is cut to precise length sticks that are dried in ovens. Firing the dry sticks creates the graphite cores, which are then placed in wood casings to assemble the pencil.
Besides writing and drawing, pencils have also attracted significant scientific attention. In the notorious case of a breakthrough discovery, they were originally served as the source of graphene in an unusual way to win a Nobel Prize in physics [1]. Moreover, due to the conductive nature of graphite, they are often used for creative science activities, such as electrodes for the electrolysis of water, to draw flexible graphite circuits on a paper or even to design on-skin electronics using pencil and paper. Worth mentioning towards this direction is also the popular web-based experiment of burning a pencil inside a domestic microwave oven. This experiment is one of the many performed in the course of putting various everyday objects into the microwave test by curiosity (e.g., aluminum foil, CDs, mirror, grapes, ivory soap, marshmallows, etc.). Graphite, being a good conductor of electricity, strongly interacts with microwaves to produce hot plasma [2,3,4,5] that sets the pencil’s wood casing alight. As a result, a wood-derived carbon residue is obtained after microwave ignition. It is staggering though that no report in the literature deals or even discusses on the structural characterization, morphological features and potential applications of this wood-derived carbon. By also considering that over 14 billion pencils are used globally every year as well as the fact that most of them are discarded until they become 60% shorter after use, one realizes that pencils do produce enough waste worth converting into useful material. This fact acquires even greater interest when set in the context of biomass-derived carbons using microwave heating [5], although viability and sustainability in the case of pencils might be considered weaker compared to a plentiful agriculture source. Moreover, the production cost and the negative environmental fingerprint of the graphite production process led many startup companies to search for a way to recycle pencils as well as how to organize networks for graphite recycling. The first stage for this valorization process will be the separation of the wood from the graphite core of the pencils. In this perspective, the method studied herein could be applied as the first stage and become economically viable.
Based on these grounds, herein we present the microwave synthesis, characterization and potential application aspects of wood pencil-derived carbon, hence offering a fast and cost-effective way of converting pencil waste into applicable carbon material. First, we demonstrate that direct irradiation of wood pencil inside a domestic microwave oven for a couple of minutes generates hot graphite plasma, which ignites and carbonizes the pencil’s wood casing. This results in carbon nanosheets, an important class of carbon nanomaterials with useful properties as catalyst supports or reinforcing fillers in polymer nanocomposites [6,7]. Second, by exploiting the excellent adsorption capability of wood, we show that similar microwave treatment of the KOH-activated [8,9] wood pencil results in porous carbon particles of a relatively high surface area. The obtained carbon decolorizes dye aqueous solutions, generates heat in pocket warmers when combined with metallic iron, sodium chloride and a small amount of water, forms the basis of gunpowder when properly mixed with KNO3 and S and efficiently removes the toxic hexavalent chromium Cr(VI) from water at an acidic pH (e.g., the pH of industrial wastewaters). The microwave synthesis, characterization and perspectives of wood pencil-derived carbon with and without activation are thereafter presented.

2. Materials and Methods

2.1. Microwave Synthesis

A wood pencil (type: 2H; weight: 4 g) on a ceramic plate (Figure 1a) was placed inside a domestic microwave oven (Figure 1b) and irradiated for 2 min under rotation at 700 W until ignition was stopped (Figure 1c). The plasma produced from the pencil’s graphite core eventually ignited the pencil, leading to carbonization of the wood casing. After microwave treatment, the graphite core had spontaneously come off the carbonized casing (Figure 1d), thus making the collection of the carbonized specimens easy (Figure 1e). A total of 10 pencils were microwaved separately this way. All the carbonized wood specimens combined were crushed into a fine powder and treated with 2 M HCl aqueous solution for 24 h in order to remove wood ashes. The solid was repeatedly washed with de-ionized water until it had a neutral pH. Acetone was added prior to drying at 100 °C. Following, the dried sample was additionally treated with concentrated HF aqueous solution (48%) for another 24 h in order to etch the clay fillers originally present in the pencil. Once again, the solid was repeatedly washed with de-ionized water until it had a neutral pH, and acetone was added prior to drying at 100 °C. A non–conductive black powder was obtained at a yield of 3% per pencil item (henceforth denoted as PC). Conductivity was tested in powdered form by the 2-point method using a multimeter. The lack of conductivity actually reflects its amorphous character. On the other hand, the low yield results from the ignition of the pencil in air inside the microwave oven chamber, which in turns leads to carbon etching through combustion. Further technical upgrades over the microwave oven are required in order to be able to introduce an inert gas (e.g., N2) in the ignition chamber that will considerably limit carbon combustion. In this case we would expect a much higher carbon yield.

2.2. Activation Process

For the activation process, ten wood pencils were first scrubbed with a sand paper in order to remove the paint coating around each pencil and then soaked in 50% KOH aqueous solution for 24 h at ambient conditions (no exothermic phenomena were observed). The impregnated pencils were removed from the alkaline bath, wiped off with a paper towel and dried in a box oven at 100 °C for 24 h. Each pencil was microwaved as above to form a voluminous carbon mass around the pencil’s graphite core (Figure 2). The voluminous carbon mass was scratched off the graphite lead and worked up similarly to PC by successively washing with HCl and HF as above. A non–conductive black powder was obtained at yield of 4% per pencil item (henceforth denoted as APC).

2.3. Characterization Techniques

X-ray diffraction (XRD) was conducted on background-free Si wafers using Cu Kα radiation from a Bruker Advance D8 diffractometer (Bruker, Billerica, MA, USA). Raman spectra were recorded with a micro-Raman system RM 1000 Renishaw using a laser excitation line at 532 nm. The N2 adsorption–desorption isotherms were carried out at 77 K on an AutosorbiQ (automated gas sorption analyzer), Quantachrome INSTRUMENTS, porosimeter. Both PC and APC samples were outgassed under a vacuum (i.e., 10−6 mbar) at 150 °C for 10 h before the experiments. Pore structure parameters were estimated using different models, such as the CPSM model [10,11,12,13,14,15], the Brunauer–Emmet–Teller [16], the Horvath–Kawazoe model [17], and the Dubinnin–Raduskevitch model [18]. The overall pore volume was calculated via the total adsorbed nitrogen amount at P/P0 = 0.998. Atomic force microscopy (AFM) images were collected on silicon wafers in tapping mode with a Bruker Multimode 3D Nanoscope (Ted Pella Inc., Redding, CA, USA). Scanning electron microscopy (SEM) images were obtained using a JEOL JSM-6510 LV SEM Microscope (JEOL Ltd., Tokyo, Japan) equipped with an X–Act EDS–detector by Oxford Instruments (Abingdon, Oxfordshire, UK, an acceleration voltage of 20 kV was applied). Ultraviolet-visible (UV–vis) spectra of chromium solutions were measured in quartz cuvettes with a UV–2401(PC)–Shimadzu two-beam spectrophotometer. The scanning range was 400–700 nm and the increasing step was 0.5 nm. X-ray photoelectron spectroscopy (XPS) was performed with a PHI VersaProbeII (Physical Electronics, Chanhassen, MN, USA) spectrometer using an Al Ka source (15 kV, 50 W). The obtained data were evaluated and deconvoluted with the MultiPak (Ulvac-PHI, Inc., Osaka, Japan) software package. The spectral analysis included Shirley background subtraction and peak deconvolution employing mixed Gaussian–Lorentzian functions.

2.4. Batch Experiments

Kinetic experiments at pH = 3 and T = 23 °C were carried out to figure out the APC’s adsorption capacity on the Cr(VI) removal. Initial Cr(VI) concentration, contact time and pH value were the parametric properties of the solution used for such kinetic experiments. More specifically, liquid solutions with an initial concentration of 5.8 ppm, temperature T = 23 °C and pH value from 1.5 to 8.0 were used to test the effect of the pH to the maximum adsorption capacity of APC. Liquid solutions with pH = 3, T = 23 °C, and initial Cr(VI) concentration 5.5 ppm, 10.65 ppm, 20.7 ppm, 40 ppm and 53 ppm were used to test the effect of the initial concentration and the contact time upon the Cr(VI) removal capacity of APC and to study the kinetic behavior of such processes. The different concentrations of the liquid Cr(VI) solution were prepared using a stock Cr(VI) solution (1 mg/mL), which was prepared by dissolving an appropriate quantity of K2Cr2O7 (Sigma-Aldrich (St. Louis, MO, USA), 99.98%) in deionized water. At different time periods (0, 0.5, 1, 2, 3, 6, 9, 24 and 48 h) during the sorption process, 3 mL of the suspension were withdrawn and centrifuged. The supernatant solution was measured using UV photometry, while the solid and the rest of the unused centrifuged solution were returned to the suspension. The Cr(VI) concentration of the solutions was determined by using the 1,5-diphenylcarbazide (Sigma-Aldrich, ≥97%) method [19]. In all cases of batch experiments, the sorbent dosage was 180 mg/L and pH was adjusted by HCl for acidic values and NaOH for alkaline ones.
In order to determine the concentration of the chromium species in the solution after the sorption procedure, an oxidation process using potassium permanganate KMnO4 (Alfa Aesar (Haverhill, MA, USA), 98%) was used [20,21]. Specifically, 180 mg/L of APC reacted with 5.8 ppm Cr(VI) solution at pH 3 under 24 h stirring. Subsequently, the suspension was centrifuged and the residual Cr(III) species in the supernatant solution were oxidized by adding KMnO4. A small equivalent excess (1.2×) of MnO4, compared with the maximum chromium species concentration (5.8 ppm), was mixed with the solution in order to ensure the oxidation of all chromium species to Cr(VI). The Cr(VI) concentration was determined using the 1,5-diphenylcarbazide method.

2.5. Adsorption Kinetic Models

Two models originated from the mass balance equations for a continuous stirred batch reactor assuming complete mixing (ideal) conditions, and two semi-empirical models were used to interpret the kinetic data. An extensive analysis for the development of such models is reported in literature [20,21]. These four model equations are as follows:
Pseudo   First   Order   ( PFO )   model   q t = q e × ( 1 e k 1 ×   t )
Pseudo   Second   Order   ( PSO )   model     q t = q e 2 ×   k 2 ×   t q e ×   k 2 ×   t   + 1
Intra   Particle   Diffusion   ( IPD )   model   q t = K ID × t 1 2 + c
Diffusion   Chemisorption   ( DC )   model   q t = 1 1 q e + 1 K DC   ×   t 0.5
where qt (mgCr(VI)/gAC) is the uptake of the Cr(VI) on the APC particles at time t (h), qe (mgCr(VI)/gAC) is the uptake at the equilibrium stage, k1 is the adsorption rate constant for PFO mechanism, k2 is the adsorption rate constant for PSO mechanism, KID [mg/(g × h0.5)] is the adsorption rate constant for IPD mechanism, C (mg/g) is an index of the boundary layer thickness at the surface of the carbon particles for the IPD mechanism and KDC [mg/(g × h0.5)] is the rate constant of the Cr(VI) ions transfer from the liquid into the solid particles for DC mechanism.

2.6. Gibbs Free Energy Calculation

According to literature [21,22] for the calculation of Gibbs free energy (ΔG0), Equations (5) and (6) could be used:
KD = qe/Ce
ΔG0 = −RTlnKD
where KD (mLliq./gAC) is the distribution coefficient, qe (mgCr(VI)/gAC) is the amount of Cr(VI) adsorbed in the activated carbon at equilibrium stage, Ce (mgCr(VI)/mLliq.) is the concentration of Cr(VI) in the liquid phase at the equilibrium stage, R (8.134 J/mol K) is the gas constant, and T (K) is the process temperature in Kelvin.

3. Results and Discussion

3.1. Structural Characterization and Morphology

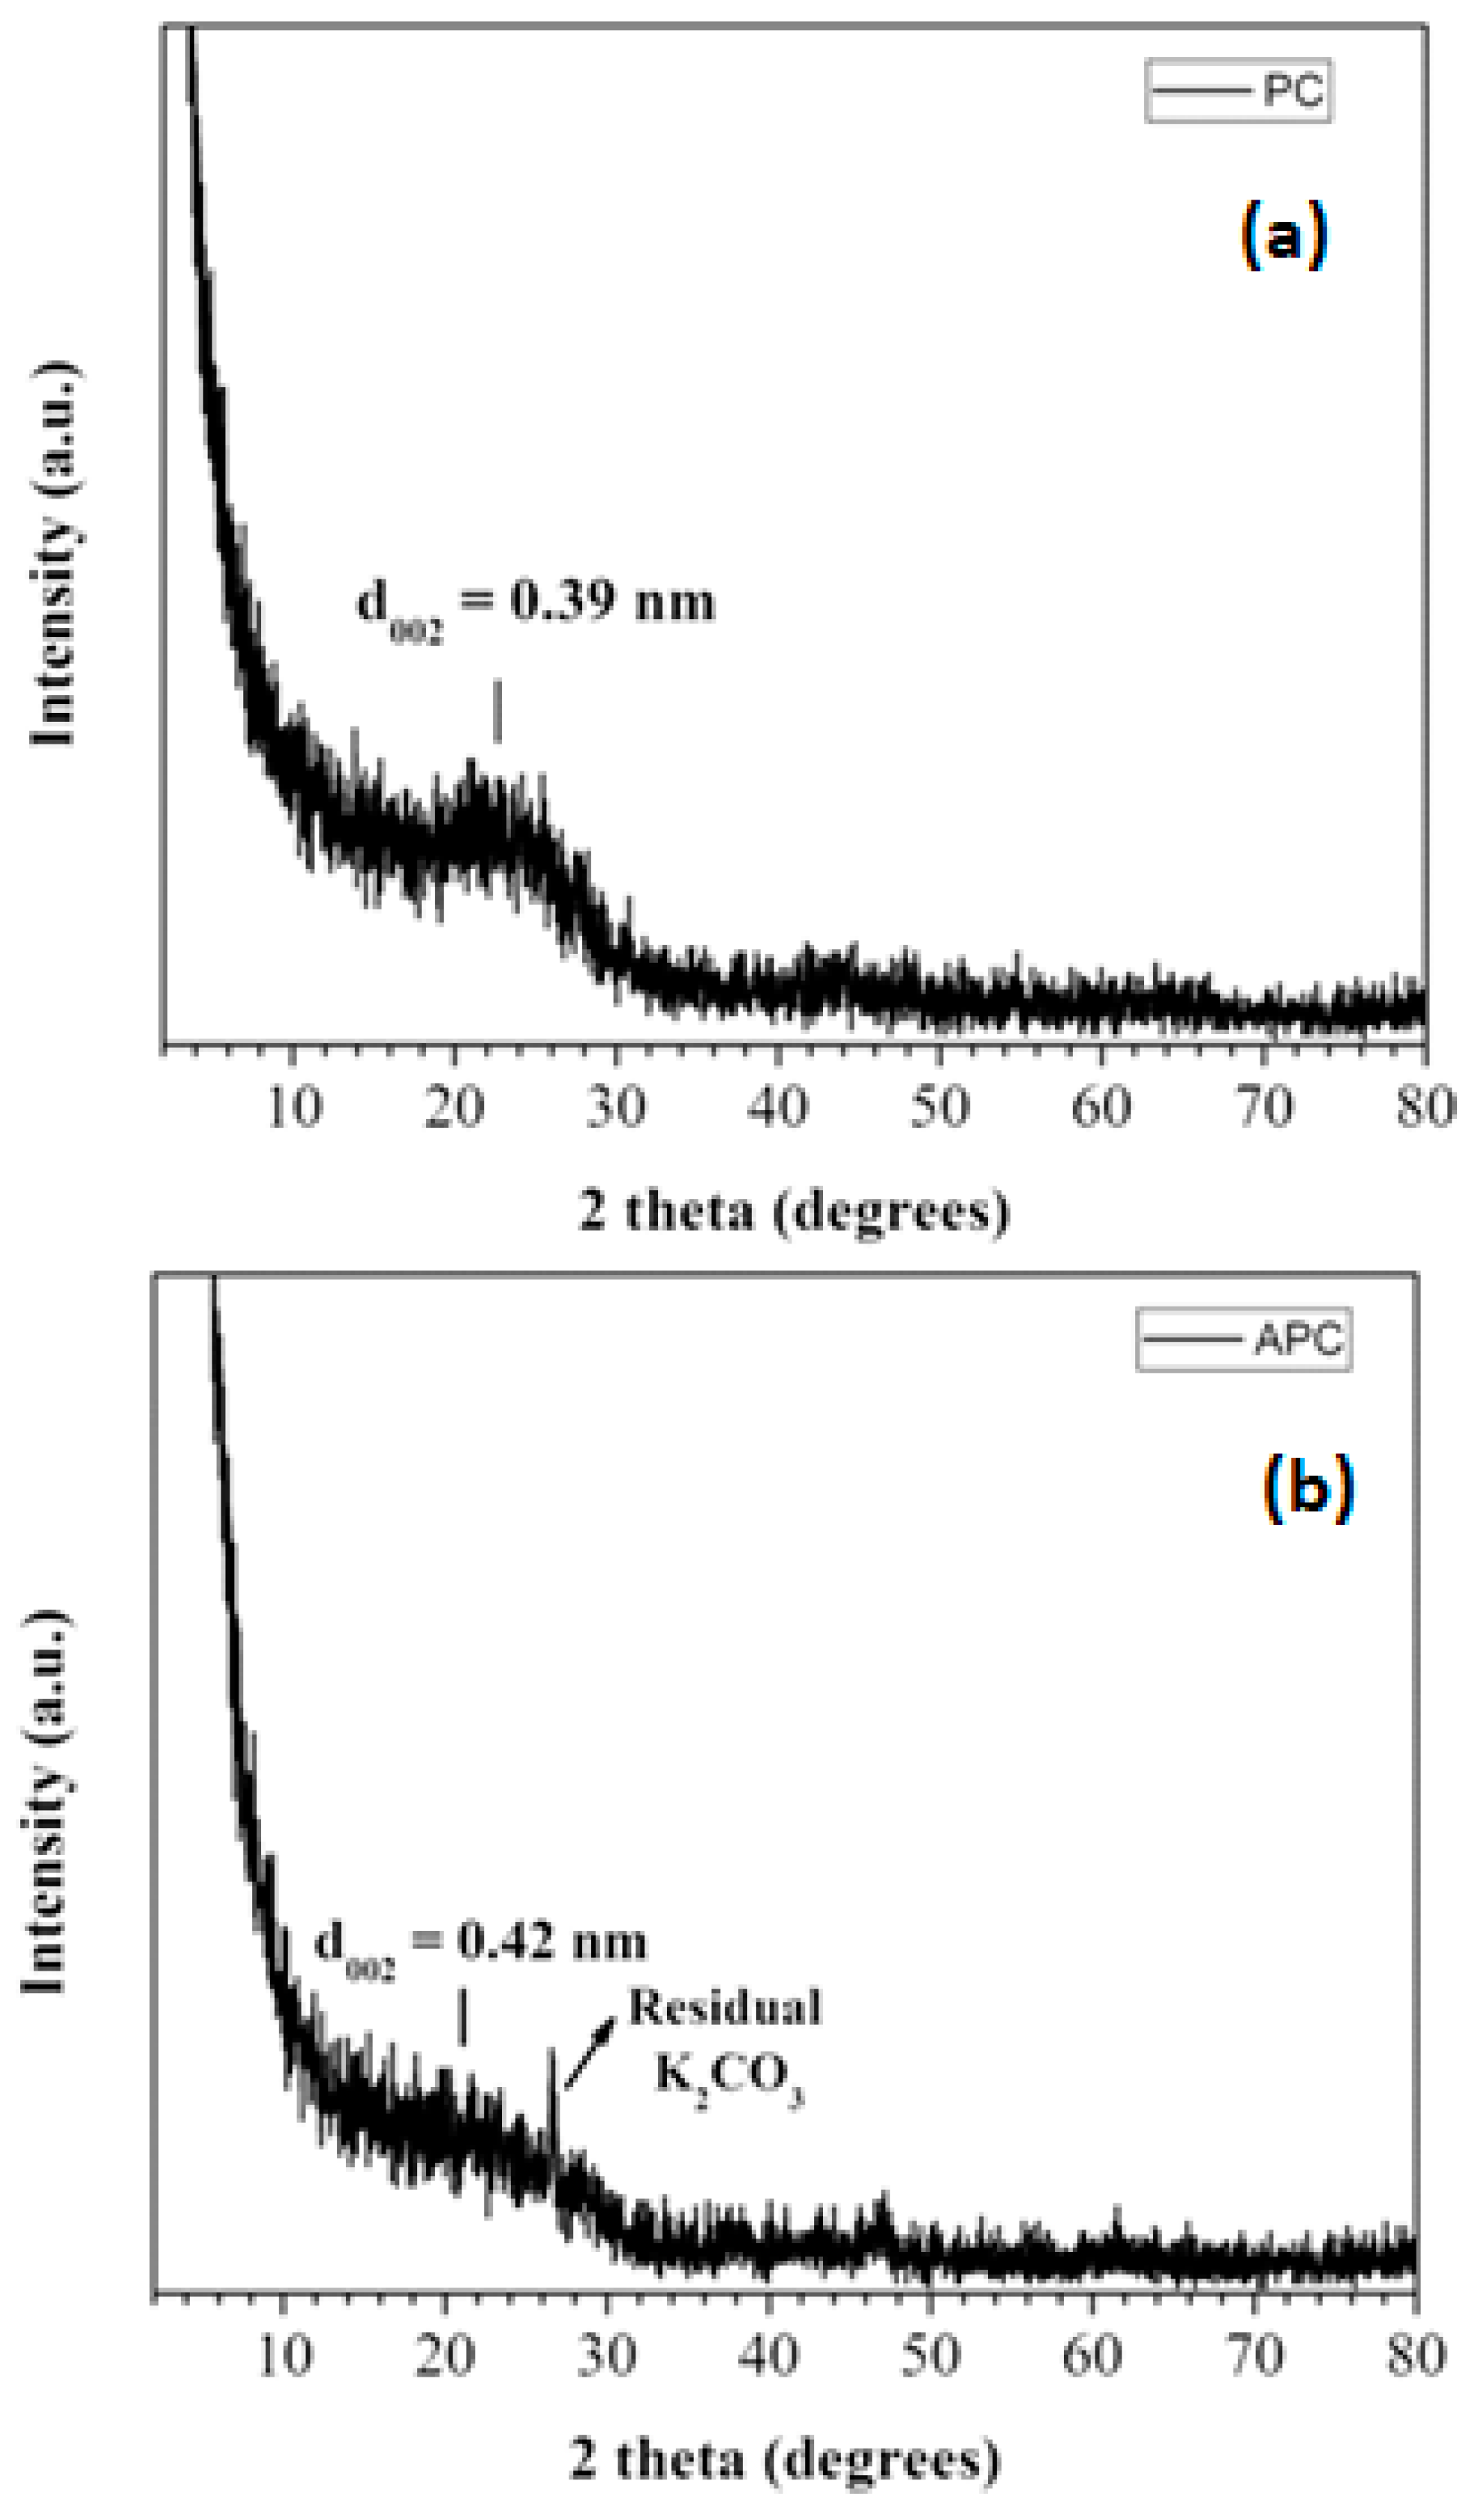
The XRD patterns of PC and APC are shown in Figure 3. PC displays a broad (002) reflection with an interlayer spacing (d002 = 0.39 nm) indicative of amorphous carbon [22,23]. APC also appears amorphous-exhibiting; however, it has an even broader (002) reflection at higher d002 = 0.42 nm [22]. This, as expected, signals a higher degree of amorphousness and defect concentration for the chemically activated carbon. APC additionally contains X-ray detectable traces of residual K2CO3 as a result of carbon reaction with KOH [8,9]. Carbonates were also evident by infrared spectroscopy (not shown). Its persistent presence even after acid treatment of the solid with HCl and HF implies, rather, that some K2CO3 crystallites might be entrapped inside the carbon matrix. Note also that the shape of the (002) peak is asymmetric in both samples. This asymmetry is related to the existence of closely spaced peaks of different intensities, generated by different carbon turbostrates [24]. Overall, the obtained carbons resemble the amorphous character of low-temperature wood-derived carbons [25].
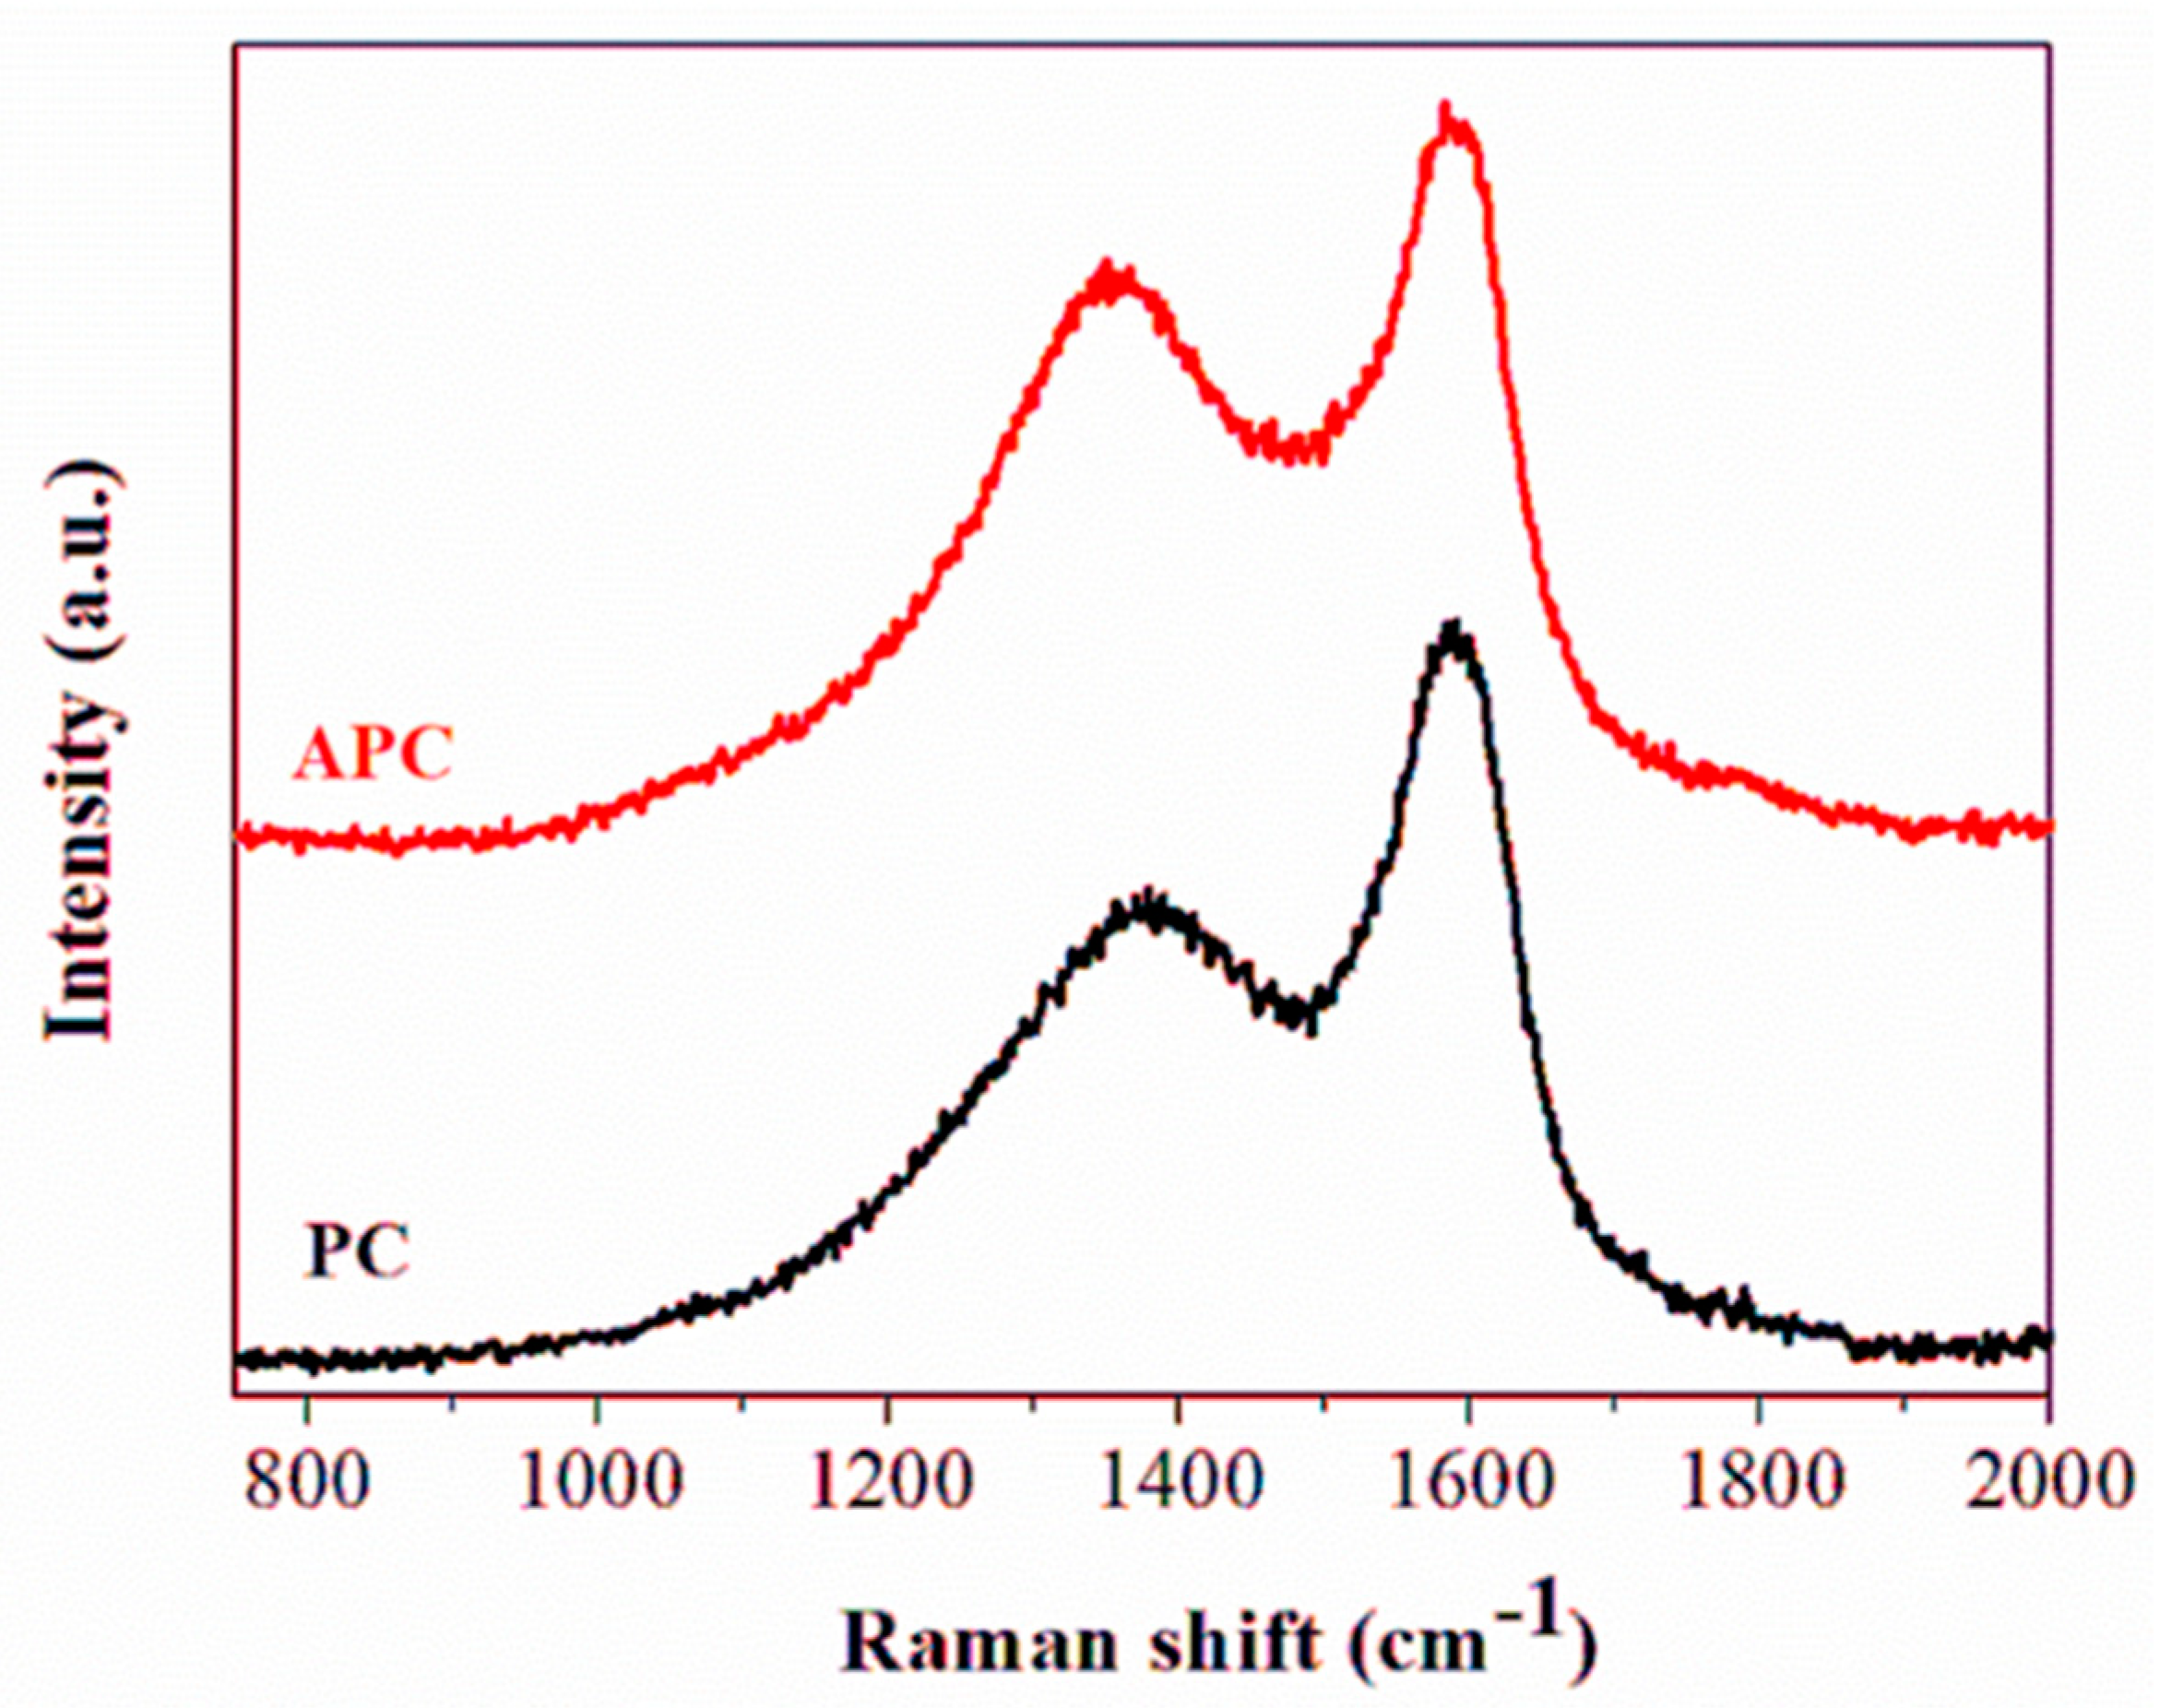
The amorphous character of PC and APC is additionally confirmed by Raman spectroscopy [26] (Figure 4). PC shows the typical G and D carbon bands at 1590 cm−1 and 1375 cm−1, respectively, whereas the same bands appear downshifted at 1587 cm−1 and 1353 cm−1 for APC [27,28,29]. In both cases, the Raman bands are broader than those of crystalline graphite. The full-width at half maximum FWHM of the D band in either PC or APC is nearly 100 cm−1 vs. 60 cm−1 for crystalline graphite, while the corresponding FWHM of the G band in either PC or APC is nearly 70 cm−1 vs. 15–35 cm−1 for crystalline graphite. In respect to the relative intensity ratio of the two bands ID/IG, this equals to 0.68 for PC and 0.77 for APC; i.e., the graphitization degree is higher in PC than APC, in accordance with the XRD results. These ratios are considerably higher than those of crystalline graphite with ID/IG = 0.2 [30]. The broadness of the bands together with the relatively high ID/IG intensity ratio is typical of amorphous carbon [26].
According to the SEM study, PC consists of perfectly aligned stacks of large plates with flat and compact surface morphology (Figure 5). According to AFM, the flat plates are actually made of carbon nanosheets with an average thickness of 3 nm (Figure 6). The formation of carbon nanosheets could be rationalized as the following: (i) nanosheets are the closest existing analogue to thermodynamically stable graphite with platy morphology, and (ii) the wood casing in pencils is engineered wood with a unique compressible lamellar structure. With respect to the structure of the amorphous nanosheets, these are expected to be composed of stacks of incompletely crystallized carbon layers in turbostratic ordering, consisting of both aliphatic and aromatic regions and containing either structural O heteroatoms within the carbon matrix or/and –OH/C=O functional groups on the outer surface.
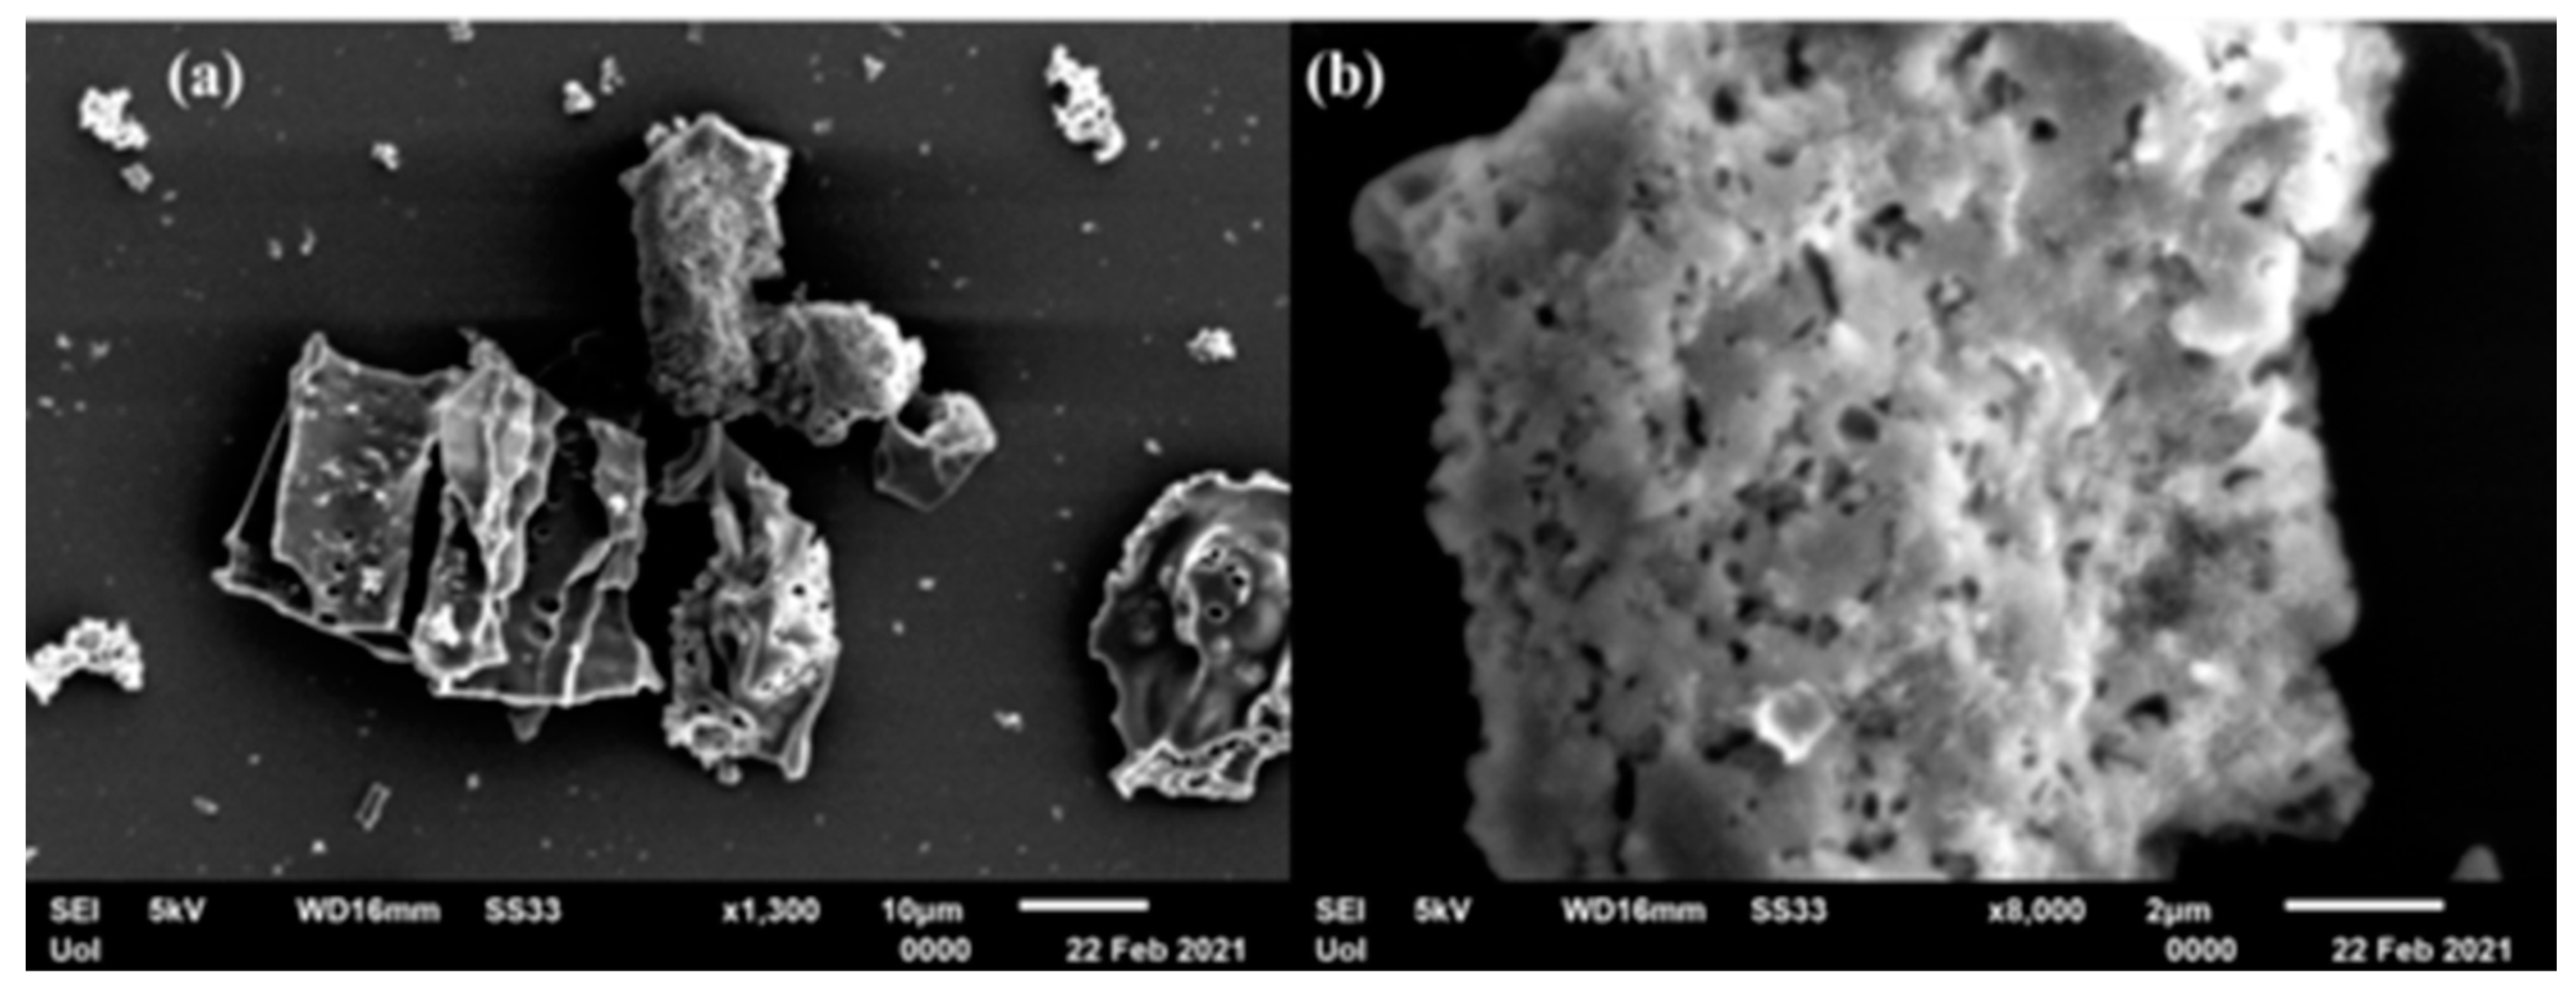
On the other hand, SEM study of APC shows instead the presence of irregular-shaped porous particles due to chemical etching of the carbon matrix by KOH [8,9] (Figure 7).
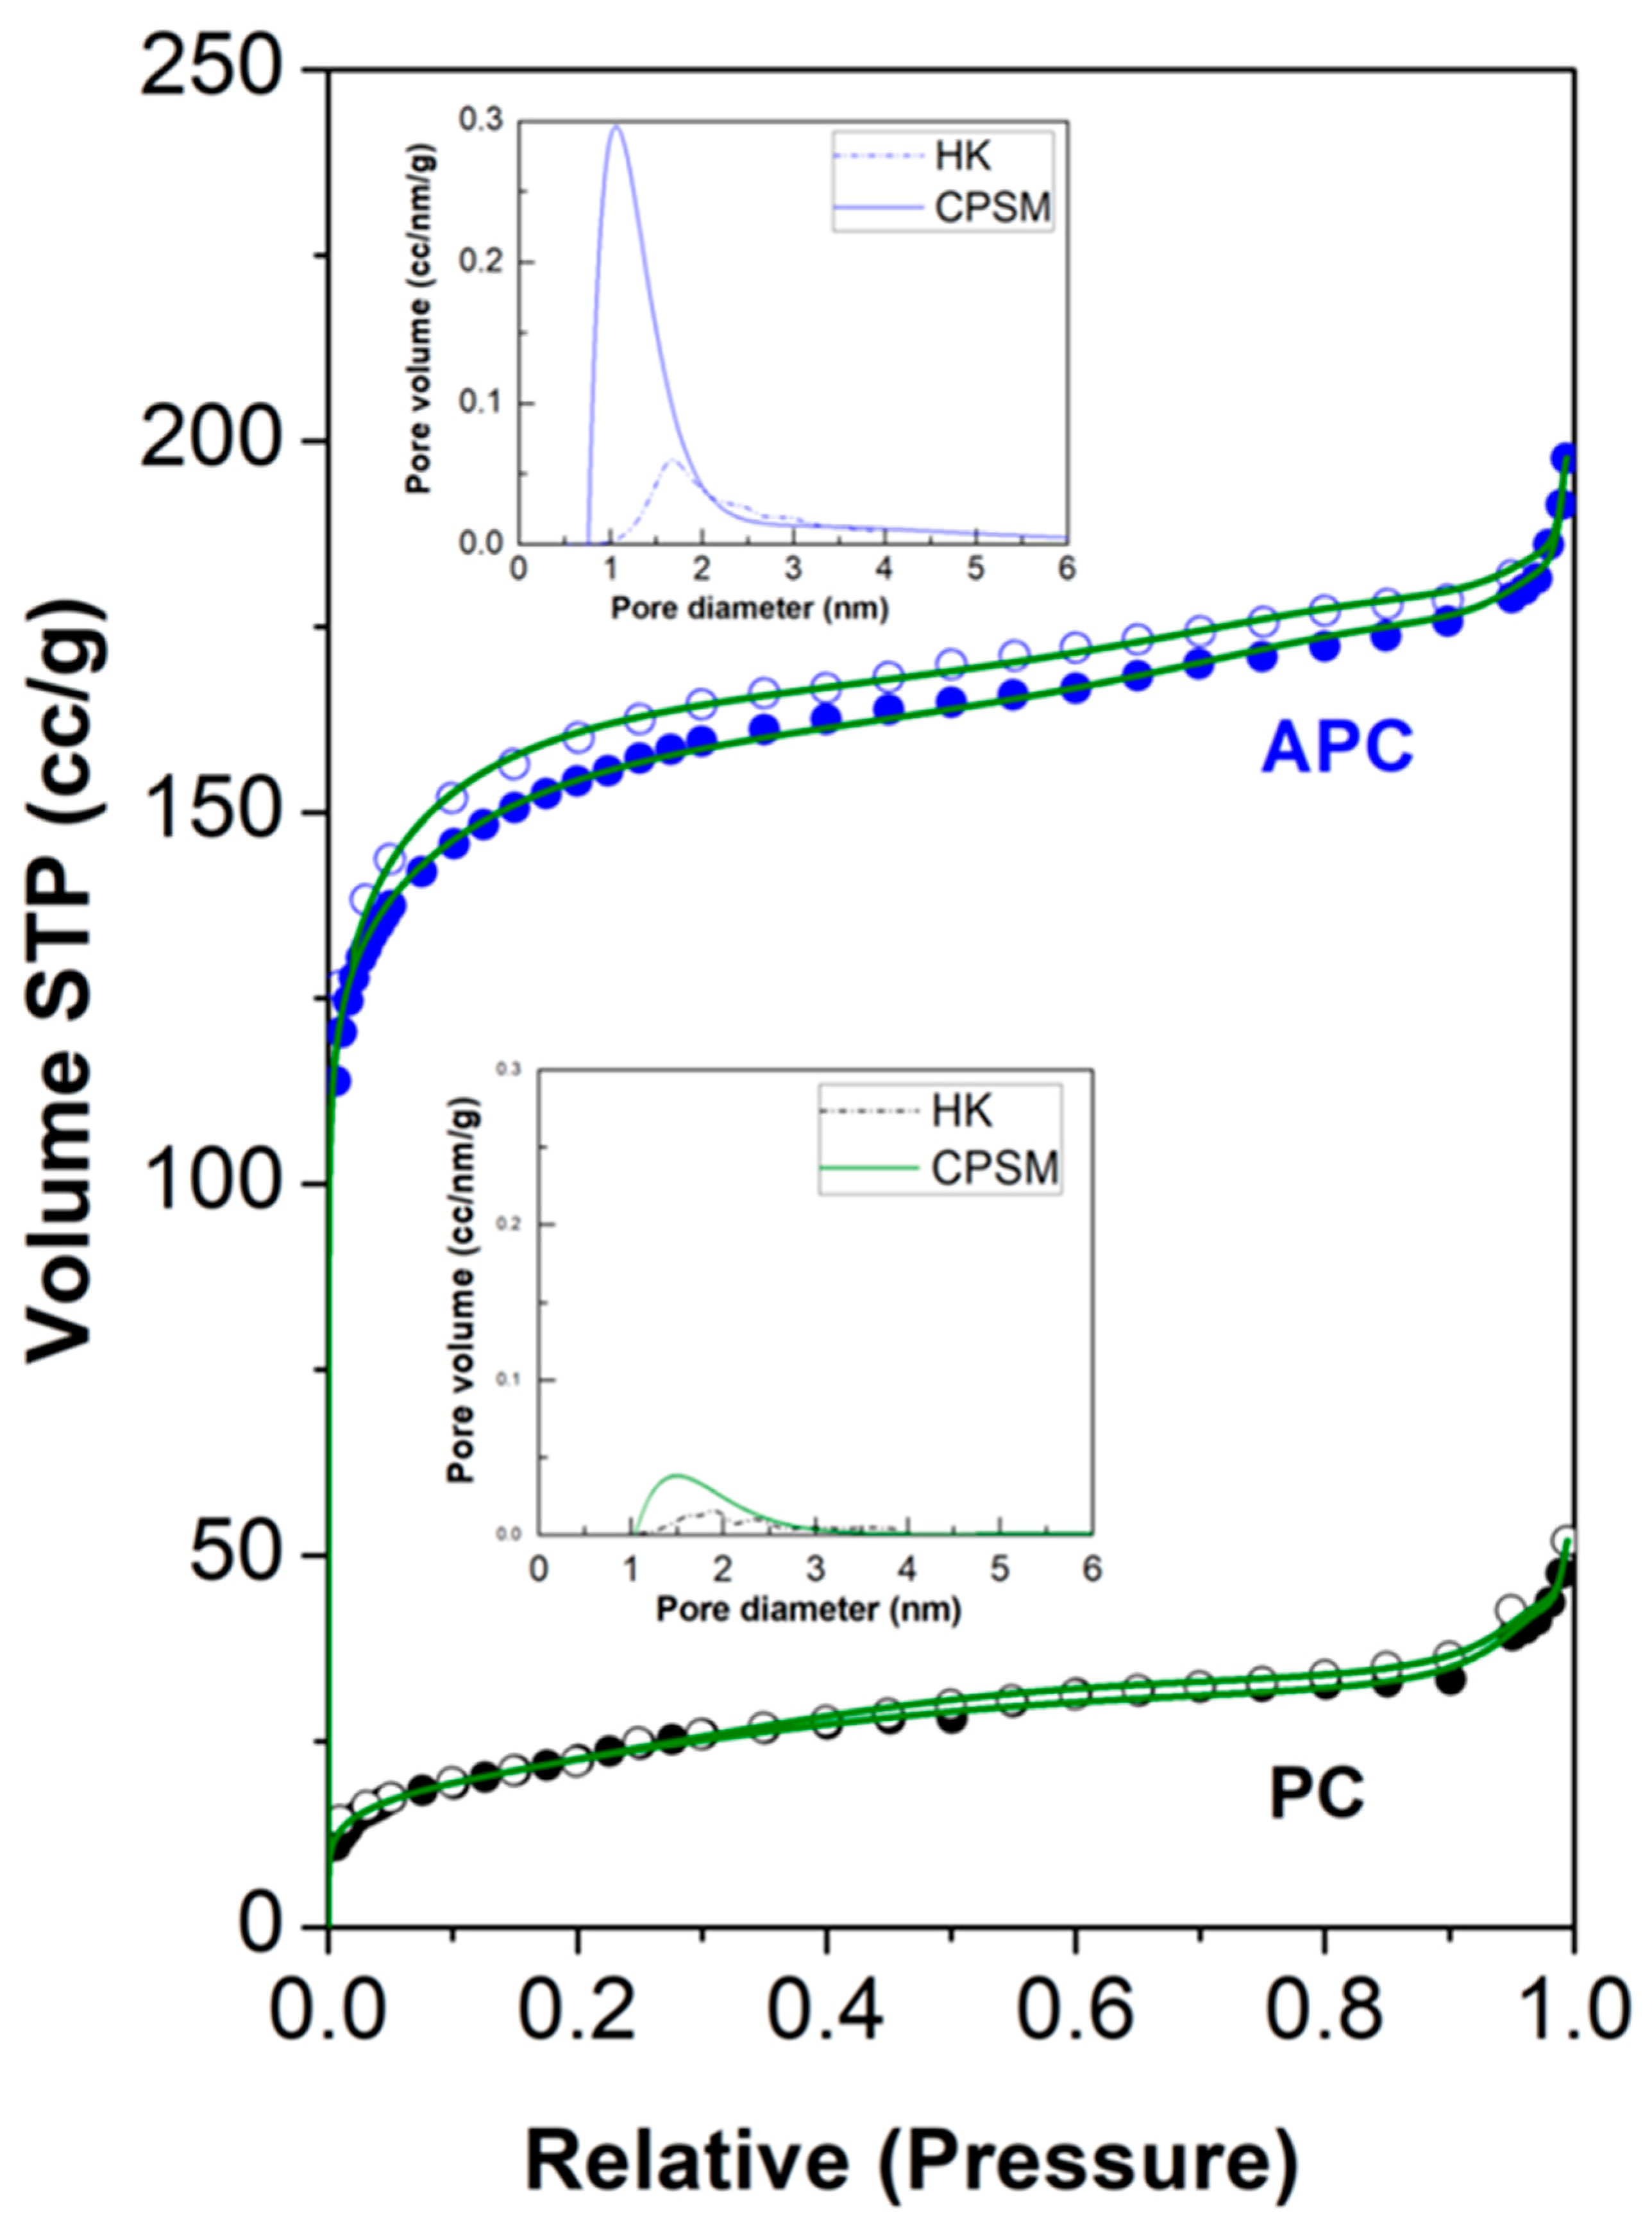
Based on the total nitrogen adsorbed amount during porosimetry measurements, which are depicted in Figure 8, it is obvious that APC exhibits around a four times higher pore volume compared to PC. The sharp knee in the low–pressure range (i.e., P/Po < 0.01) indicates the presence of microporosity (Dmicropore ≤ 2 nm) in both cases.
More specifically, as it is reported in Table 1, according to the CPSM [10,11] and to the Dubinnin–Raduskevitch (D–R) [19] method, the micropore volume fraction is 39% for PC and 73% for APC. The pore volume distribution, provided by the application of the CPSM or the Horvath–Kawazoe [20,31] model, indicates pores around D = 1.5 nm or 1.9 nm and D = 1.06 nm or 1.67 nm for PC and APC, respectively. One the other hand, the pore population distribution provided by the CPSM model indicates the major number of pores at around D = 1.38 nm for PC and at around D = 0.97 nm for APC.
Moreover, according to Table 2, the perfect simulation of the nitrogen porosimetry process by the CPSM model provides specific surface area values at SCPSM = 105 m2/g for PC and SCPSM = 776 m2/g for APC. For the estimation of such values, this model takes into account the microporosity and the pore curvature effect on specific surface area calculations [12]. This effect is more intense in the case of APC, where the microporosity fraction is higher.
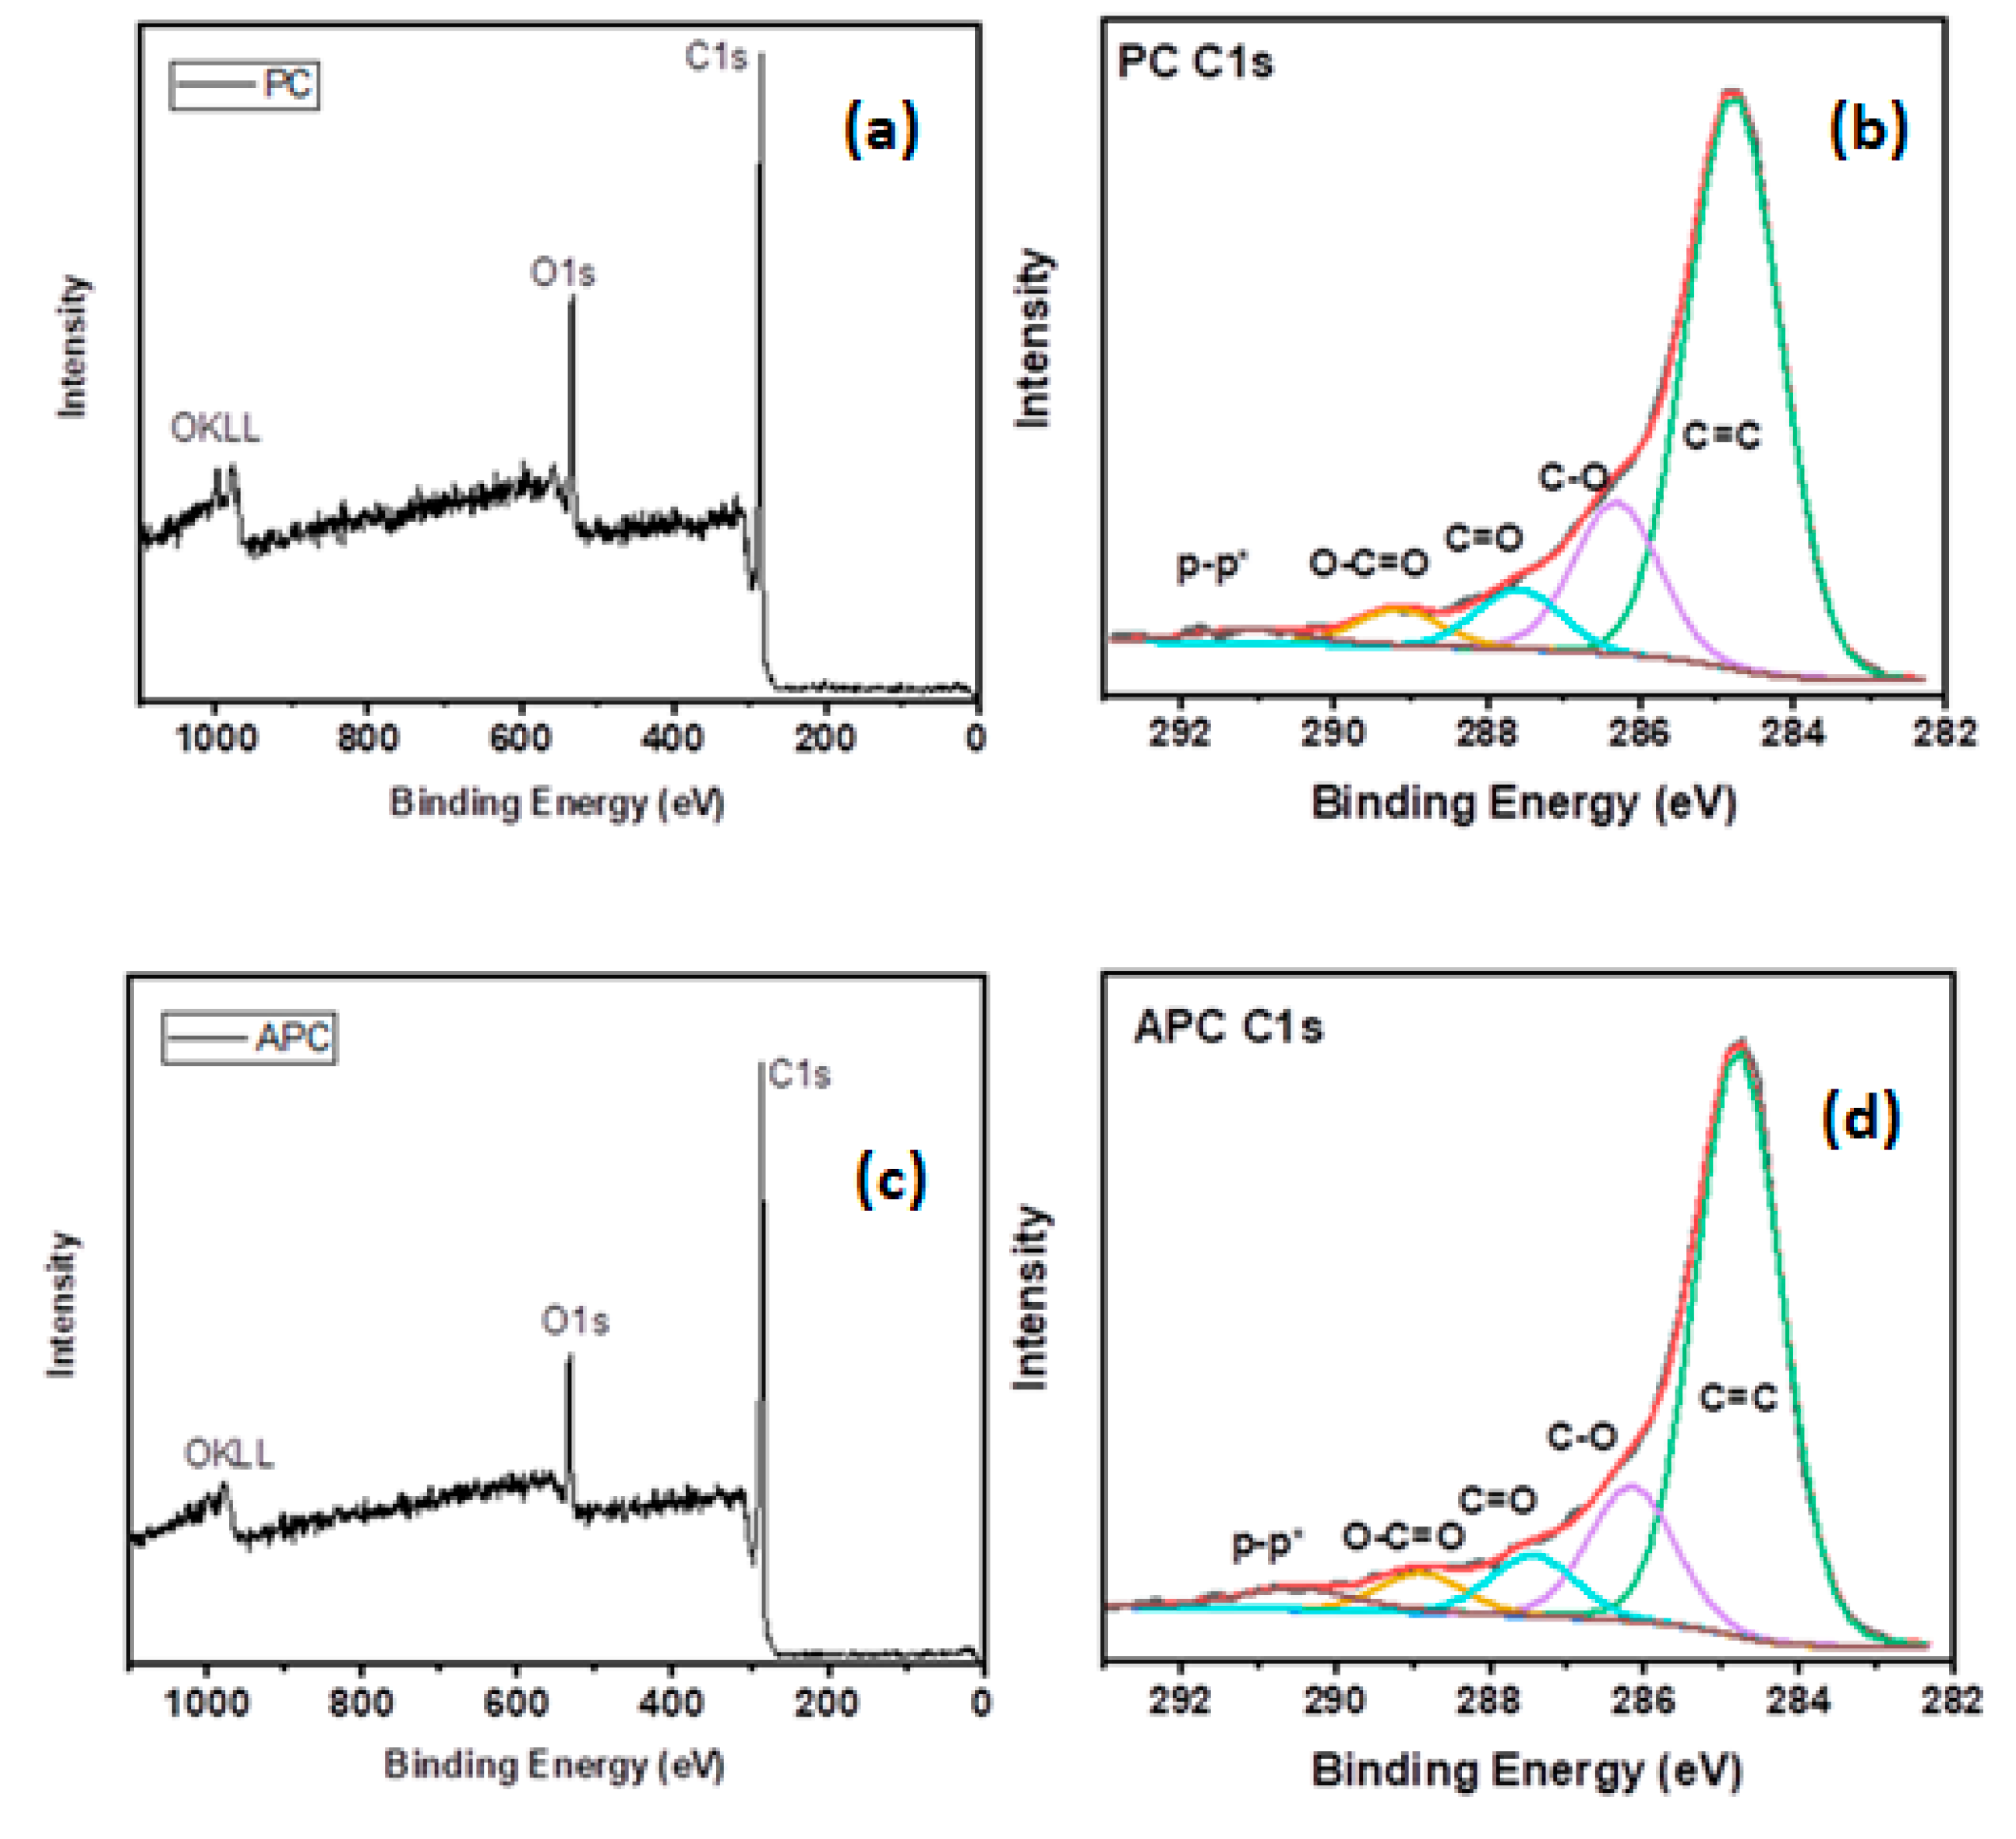
The composition of PC and APC was analyzed via XPS, showing the dominant presence of carbon and oxygen (Figure 9). The oxidized state of carbon was further evidenced in the high-resolution C1s profiles, in which the characteristic peaks for oxidized carbon [29,32,33,34] were present in both samples (Figure 9). The position of the analysis peaks and the area percentiles of the deconvoluted carbon components were practically the same for both samples. More specifically, the C1s components were attributed to sp2/sp3 carbons (284.8 eV, ~70%), C–O (286.2 eV, ~17%), C=O (287.5 eV, ~7%) and O–C=O (289.1 eV, ~4%). The component at 290.8 eV (~2%) is the characteristic satellite feature ascribed to π-π* transitions within sp2 conjugated carbons [35,36,37]. The presence of oxygen-containing groups on the surface of the solids provides active sites for further post-functionalization [38] or strong molecular interactions pertaining to adsorption/removal processes.

3.2. Practical Applications

On account of the relatively high surface area and oxidized surface of APC, which favors strong binding of various substances to the surface, this section mainly focuses on some practical aspects of this sample. In a quite common demonstration, APC was added to an aqueous solution of methylene blue, shaken for few seconds and passed through a filter to give a colorless filtrate due to complete retention of the dye by the activated carbon [39,40]. The high surface area of APC together with the strong electrostatic interactions between the positively charged methylene blue and the negatively charged sites of the porous solid (e.g., ionizable oxygen-containing surface groups, such as phenolic and carboxylic) leads to strong and quantitative binding of the dye onto the carbon matrix. This simple process can minimize water pollution from dye industry, where the breakdown of the released dye by UV light or bacteria may form potentially cancer-causing compounds in water, such as amino–naphthol and anisidine [41].
Another interesting application refers to pocket warmers (or hand warmers) and the generation of useful heat by mechanically mixing APC (1 g) with iron powder (5.3 g) and NaCl (1 g) in the presence of a small amount of water (3 g). For this application it is essential to use high surface area carbon. Since APC entraps O2 from air into its pores, the obtained mixture resembles a galvanic cell composed of an iron anode (−) (Fe3+ + 3 e → Fe, Eo = −0.04 v), an oxygen cathode (+) (O2 + 2 H2O + 4 e → 4 OH, Eo = +0.40 v) and a salt electrolyte (NaCl-H2O). As the electrons move from the anode to the cathode, the following exothermic redox reactions occurs: 4 Fe + 3 O2 + 6 H2O → 4 Fe(OH)3, thus producing enough heat to raise the temperature of the mixture up to 80 °C within 5–10 min of mechanical stirring. Notably, the temperature of the mixture slowly drops from 80 to 40 °C within an hour, thus retaining its warmness long enough for practical applications. This effect can be accredited to the thermal insulating properties of the porous carbon matrix used in the mixture. At this stage, the further addition of water (2 mL) and stirring again raises the temperature of the mixture, this time up to 65–70 °C. Alternative to pocket warmers, APC can be easily mixed with KNO3 and S to make energetic gunpowder as well (75% KNO3–15% APC–10% S).
Another practical application of APC pertains to hexavalent chromium Cr(VI) removal from water. Hexavalent chromium Cr(VI) is used in several important industrial processes that produce wastewaters with high levels of this toxic and carcinogenic species [42] (at least one to two orders of magnitude higher than the recommended levels). Hence, the removal of Cr(VI) from industrial wastewaters before releasing them into the environment becomes a great necessity. Among several existing materials and methods used for Cr(VI) removal [43,44], carbon absorbents appear quite appealing due to their good removal efficiency, inexpensiveness and low toxicity [20,21,45,46,47]. Characteristically, APC can effectively remove Cr(VI) in the form of Cr2O7−2 at pH = 3. This acidic pH is common for industrial wastewaters and also helps to inverse the surface charge of the carbon support by protonation of the –OH groups into –OH2+, thus favoring the electrostatic binding of the dichromate ions. Interestingly, no removal was observed at neutral pH, possibly due to electrostatic repulsions between the dichromate anions and the negatively charged phenolate and carboxylate groups on the carbon surface.
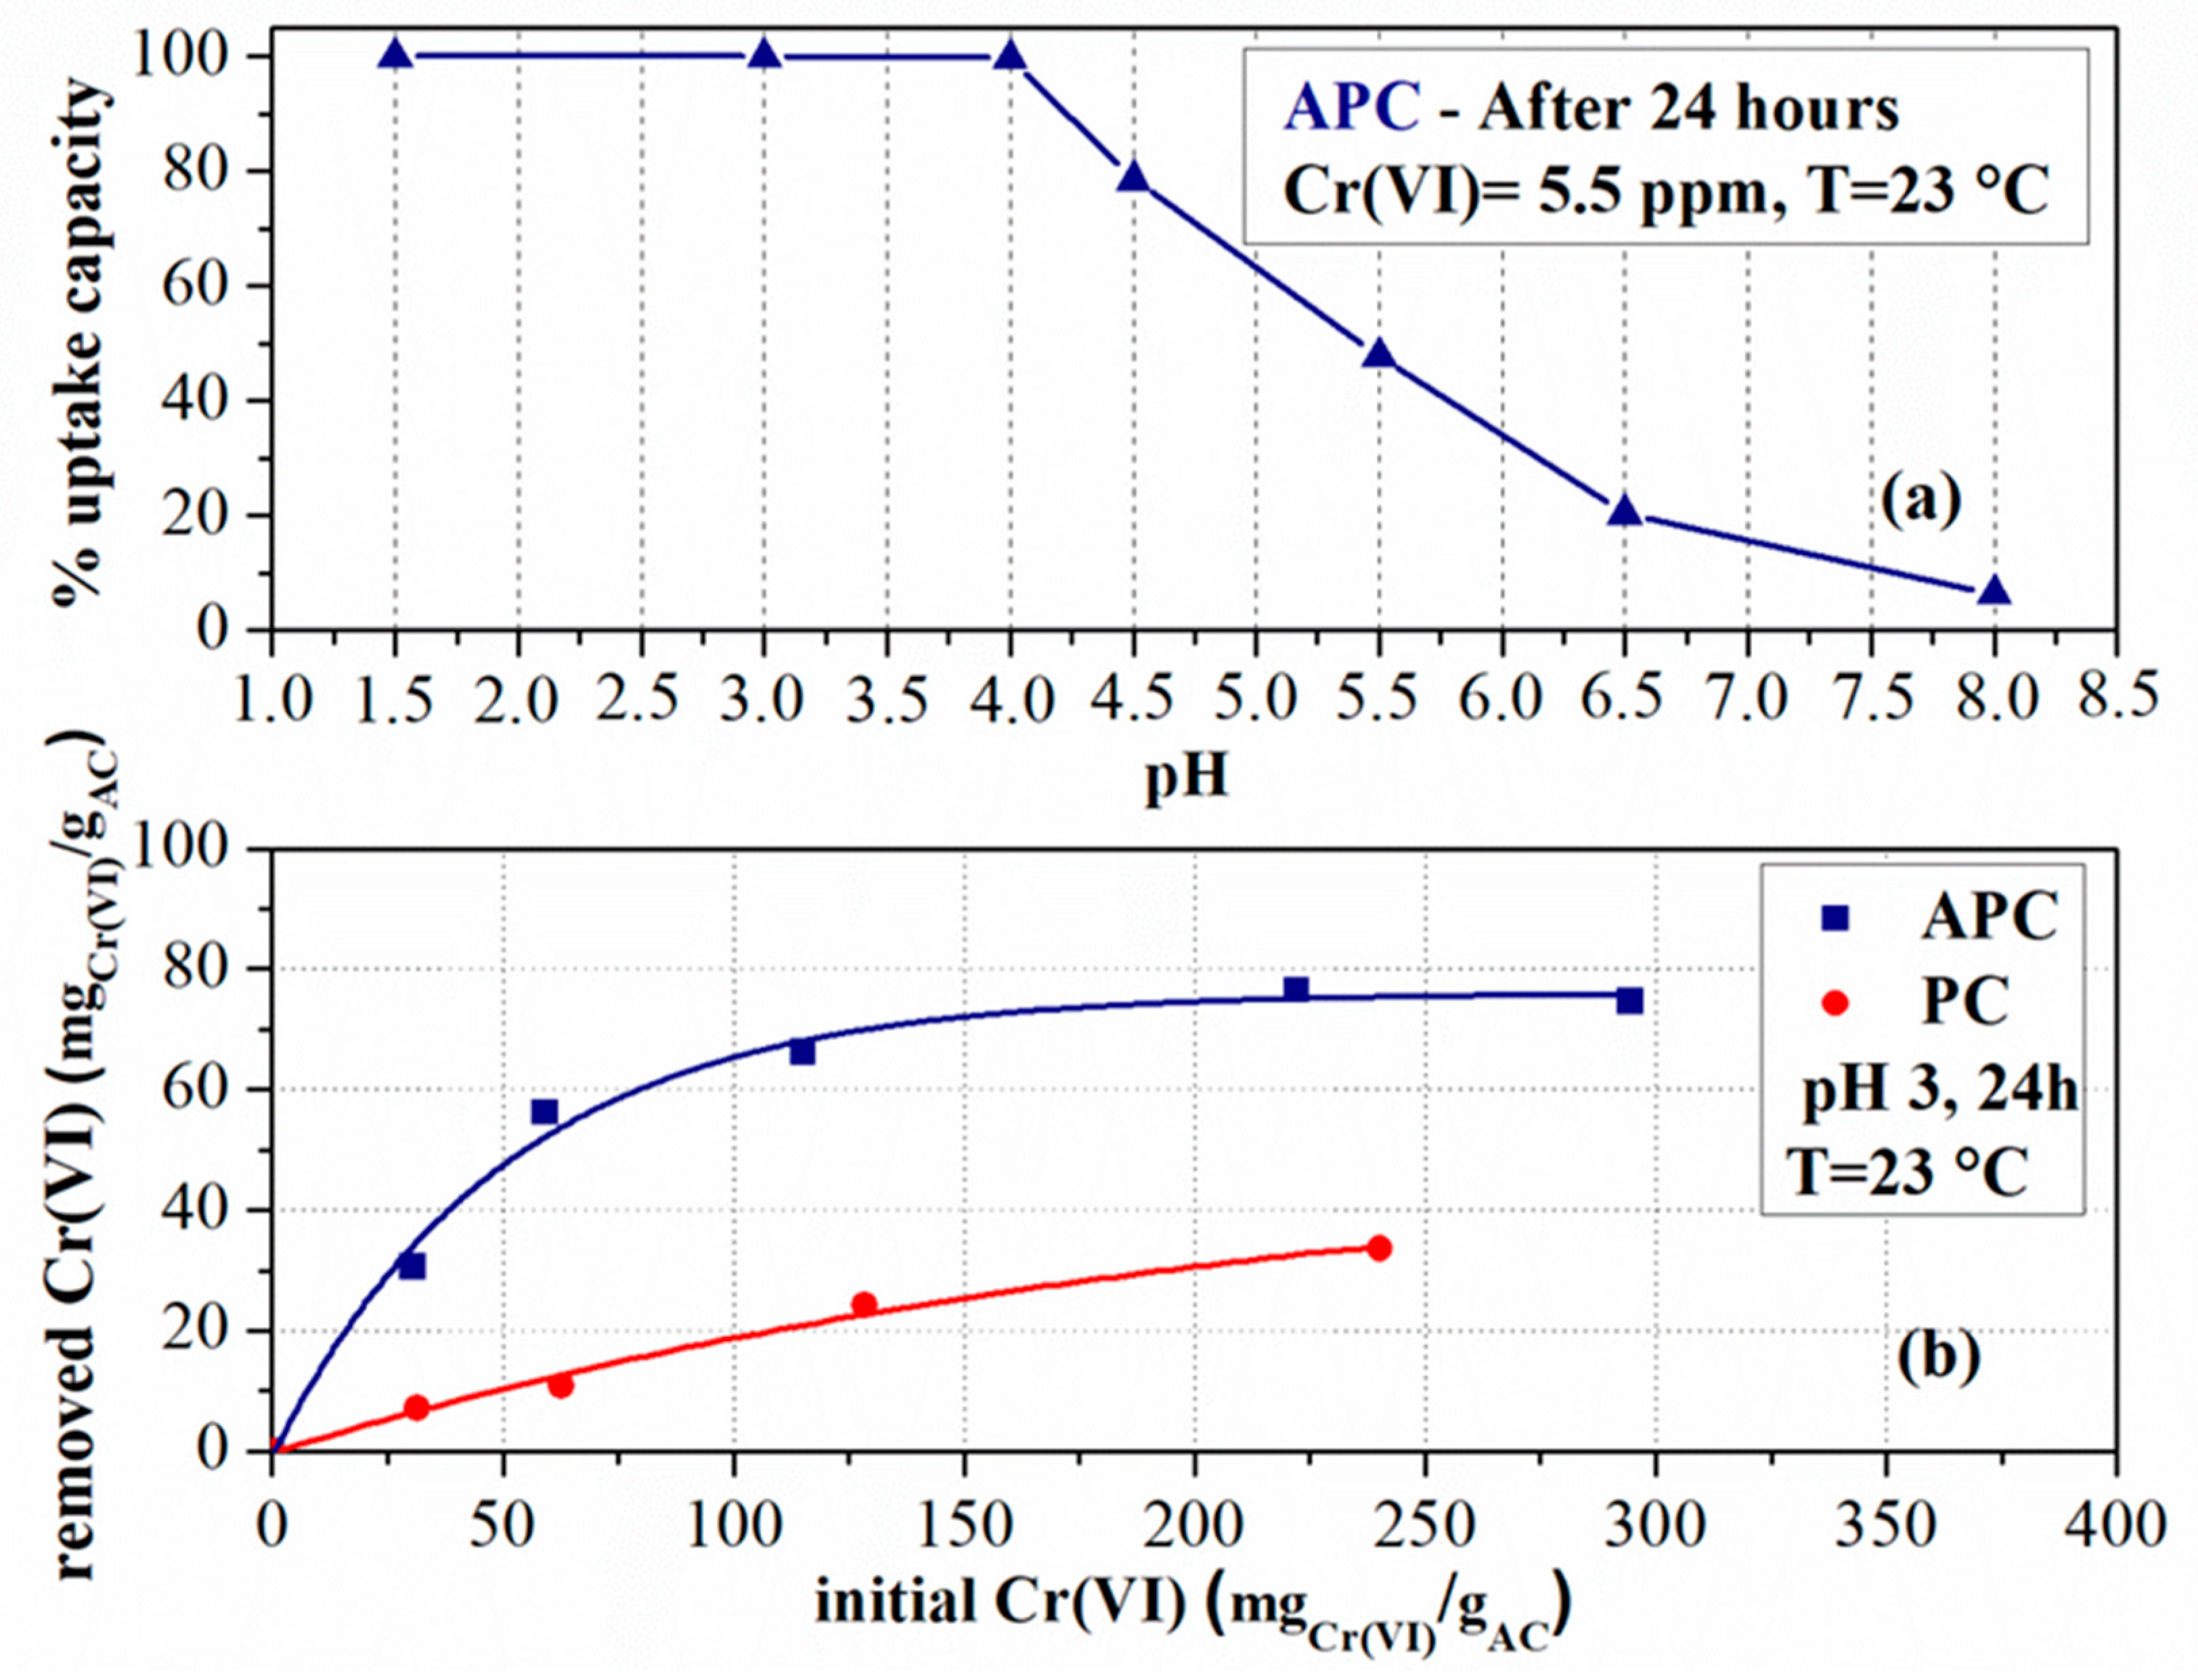
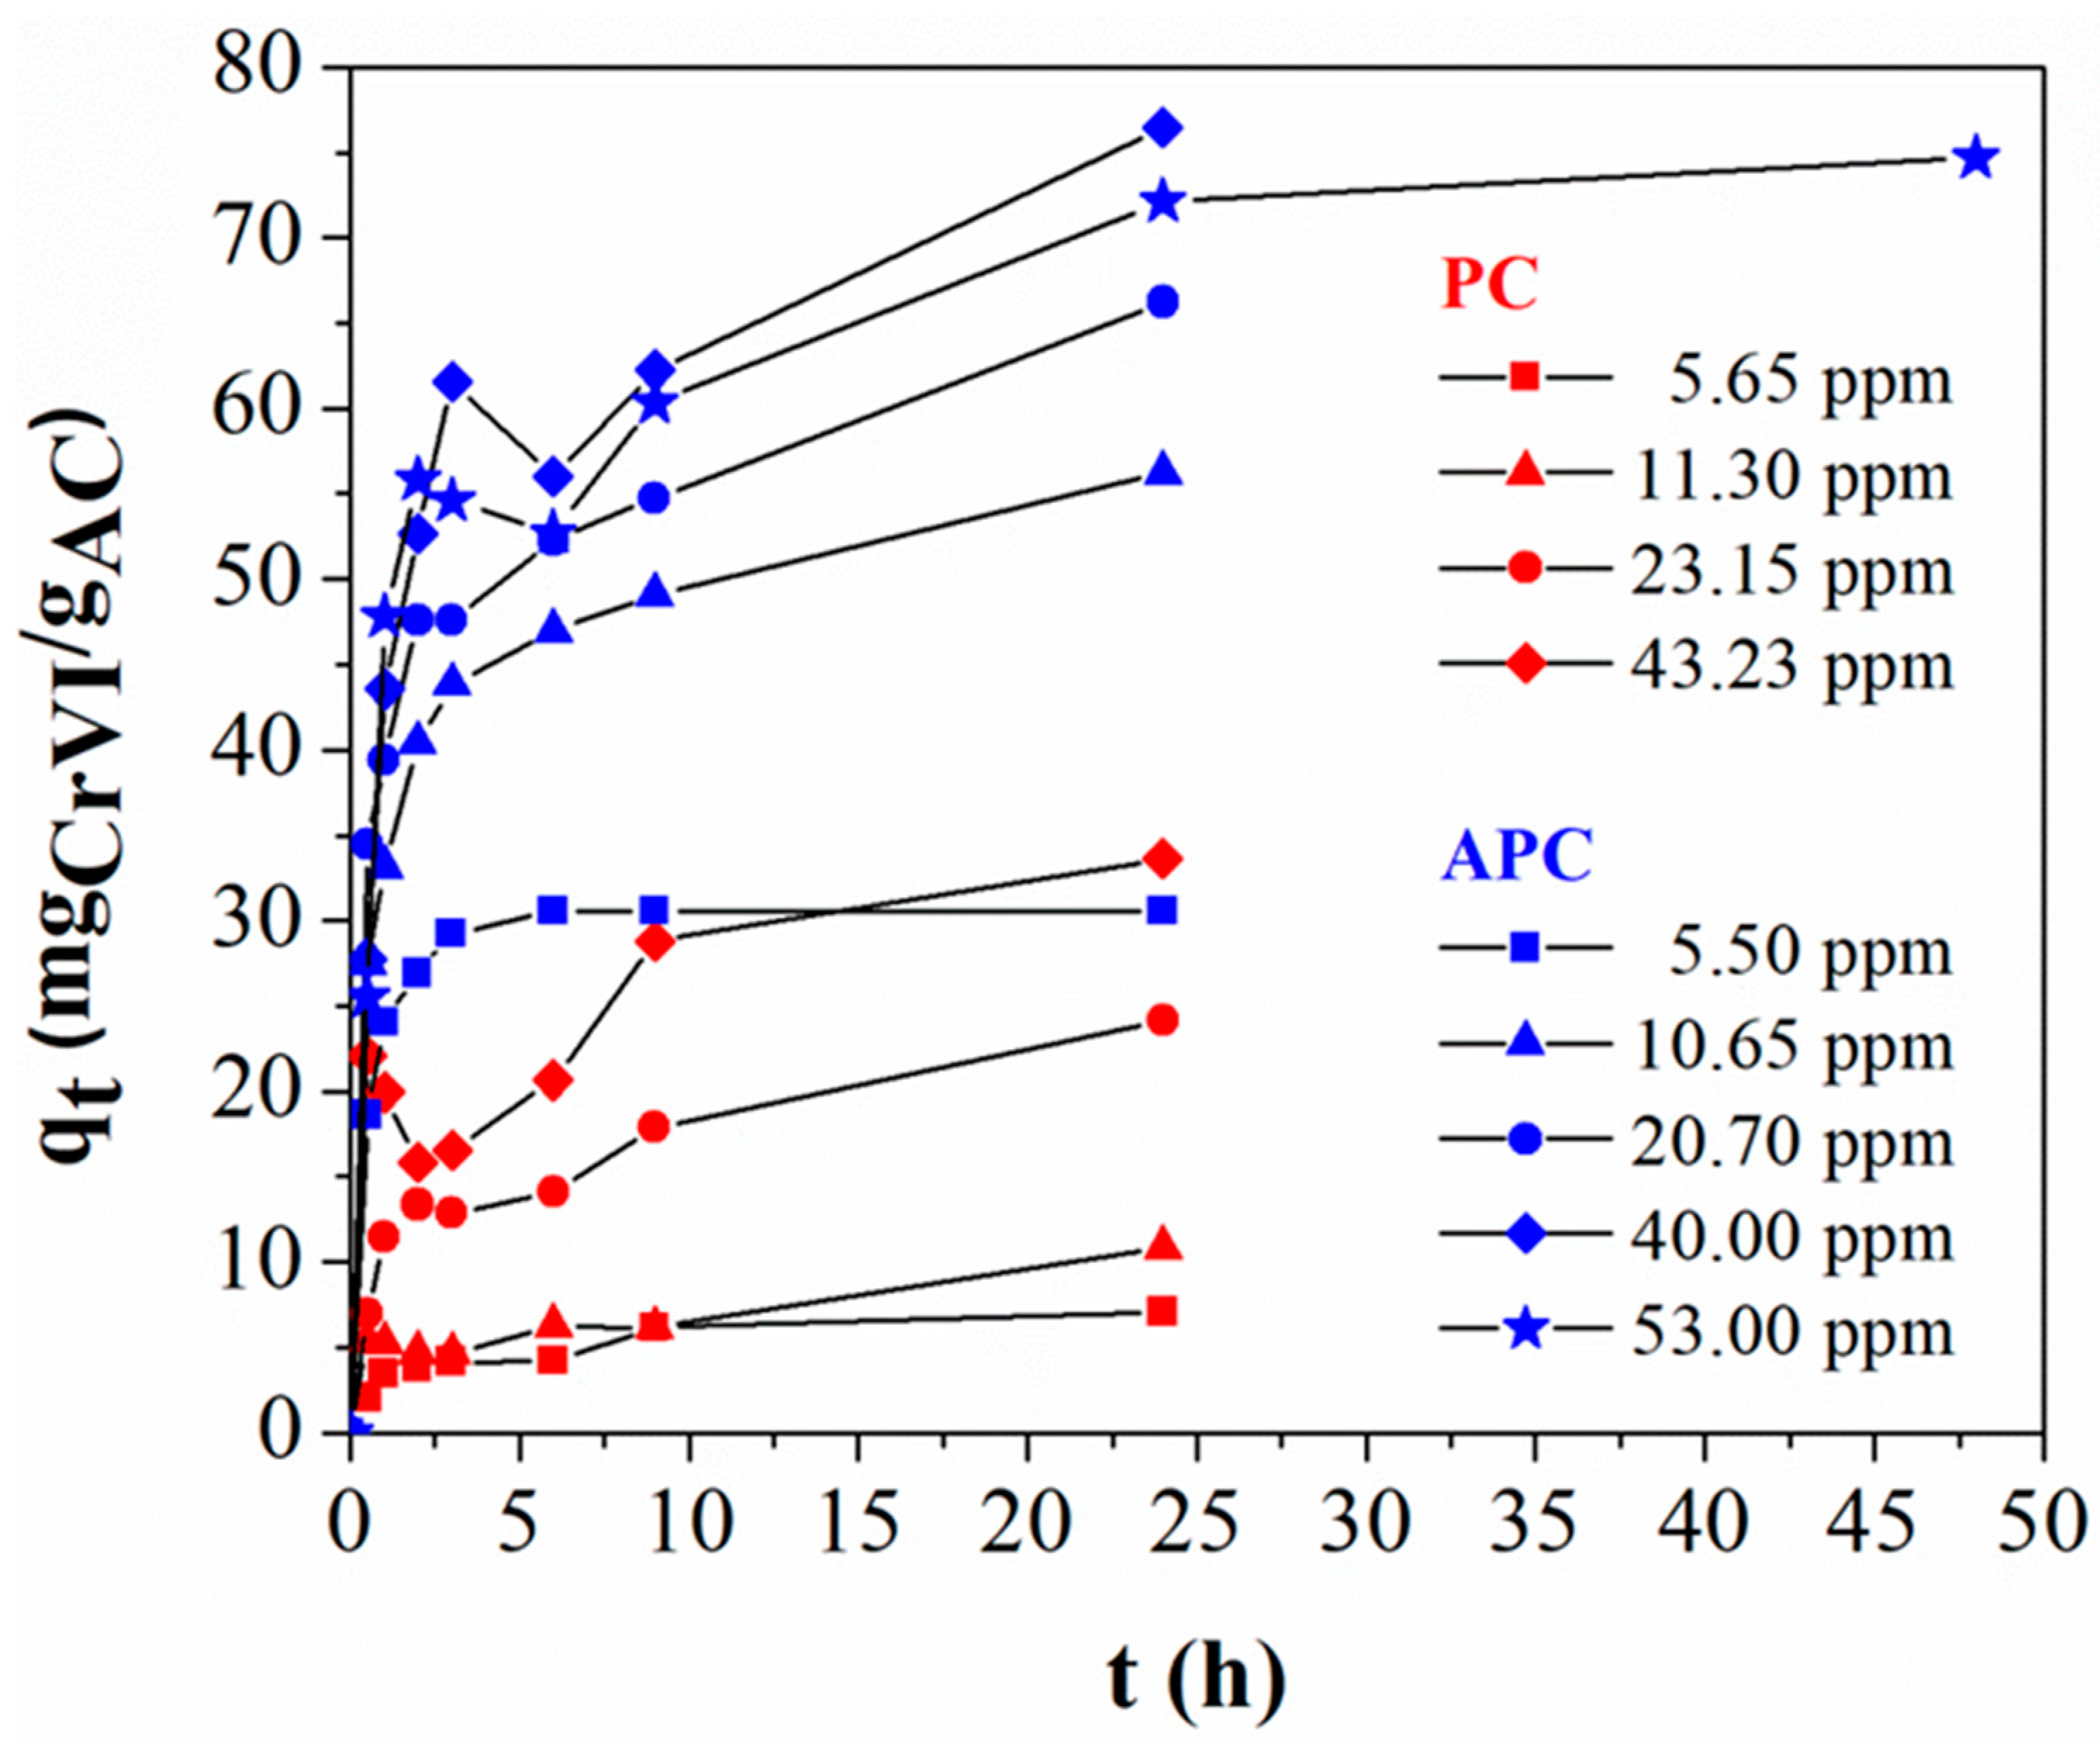
It is evident from Figure 10a that for temperature T = 23 °C, after 24 h, and for the initial concentration at 5.5 ppm (i.e., 55 times higher than the recommended value in water), APC adsorbs 100% the Cr(VI) amount for pH values in the range 1–4 (acidic environment). After this value of pH the % adsorbed amount decreases and almost reaches 0% at pH = 8.0. For this reason, all kinetic experiments were carried out at pH = 3. As it is shown in Figure 10b for Cinit = 40 ppm, the experimental maximum adsorbed amount after 24 h of adsorption process is qmax(24 h) = 76 mgCr(VI)/gAC, while for Cinit = 53 ppm the experimental maximum adsorbed amount after 48 h of adsorption process is qmax(48 h) = 75 mgCr(VI)/gAC. This means that the maximum adsorbed amount is around 75 mgCr(VI)/gAC, if the initial Cr(VI) concentration is higher than 40 ppm, the temperature is 23 °C and the pH = 3. Moreover, the maximum adsorption capacity of APC as compared to the maximum adsorption capacity of PC is clearly higher for all cases of the Cr(VI) initial concentration.
It is also apparent from Figure 11 that APC exhibits superior adsorption rate and capacity properties compared to PC. For this reason, only the APC’s kinetic data were interpreted in this work. Furthermore, for Cinit = 53 ppm, APC exhibits an experimental maximum adsorbed amount that is practically constant after 24 h of the adsorption process [i.e., qmax(24 h) = 72 mgCr(VI)/gAC and qmax(48 h) = 75 mgCr(VI)/gAC]. This essentially means that APC gets fully saturated after 24 h.
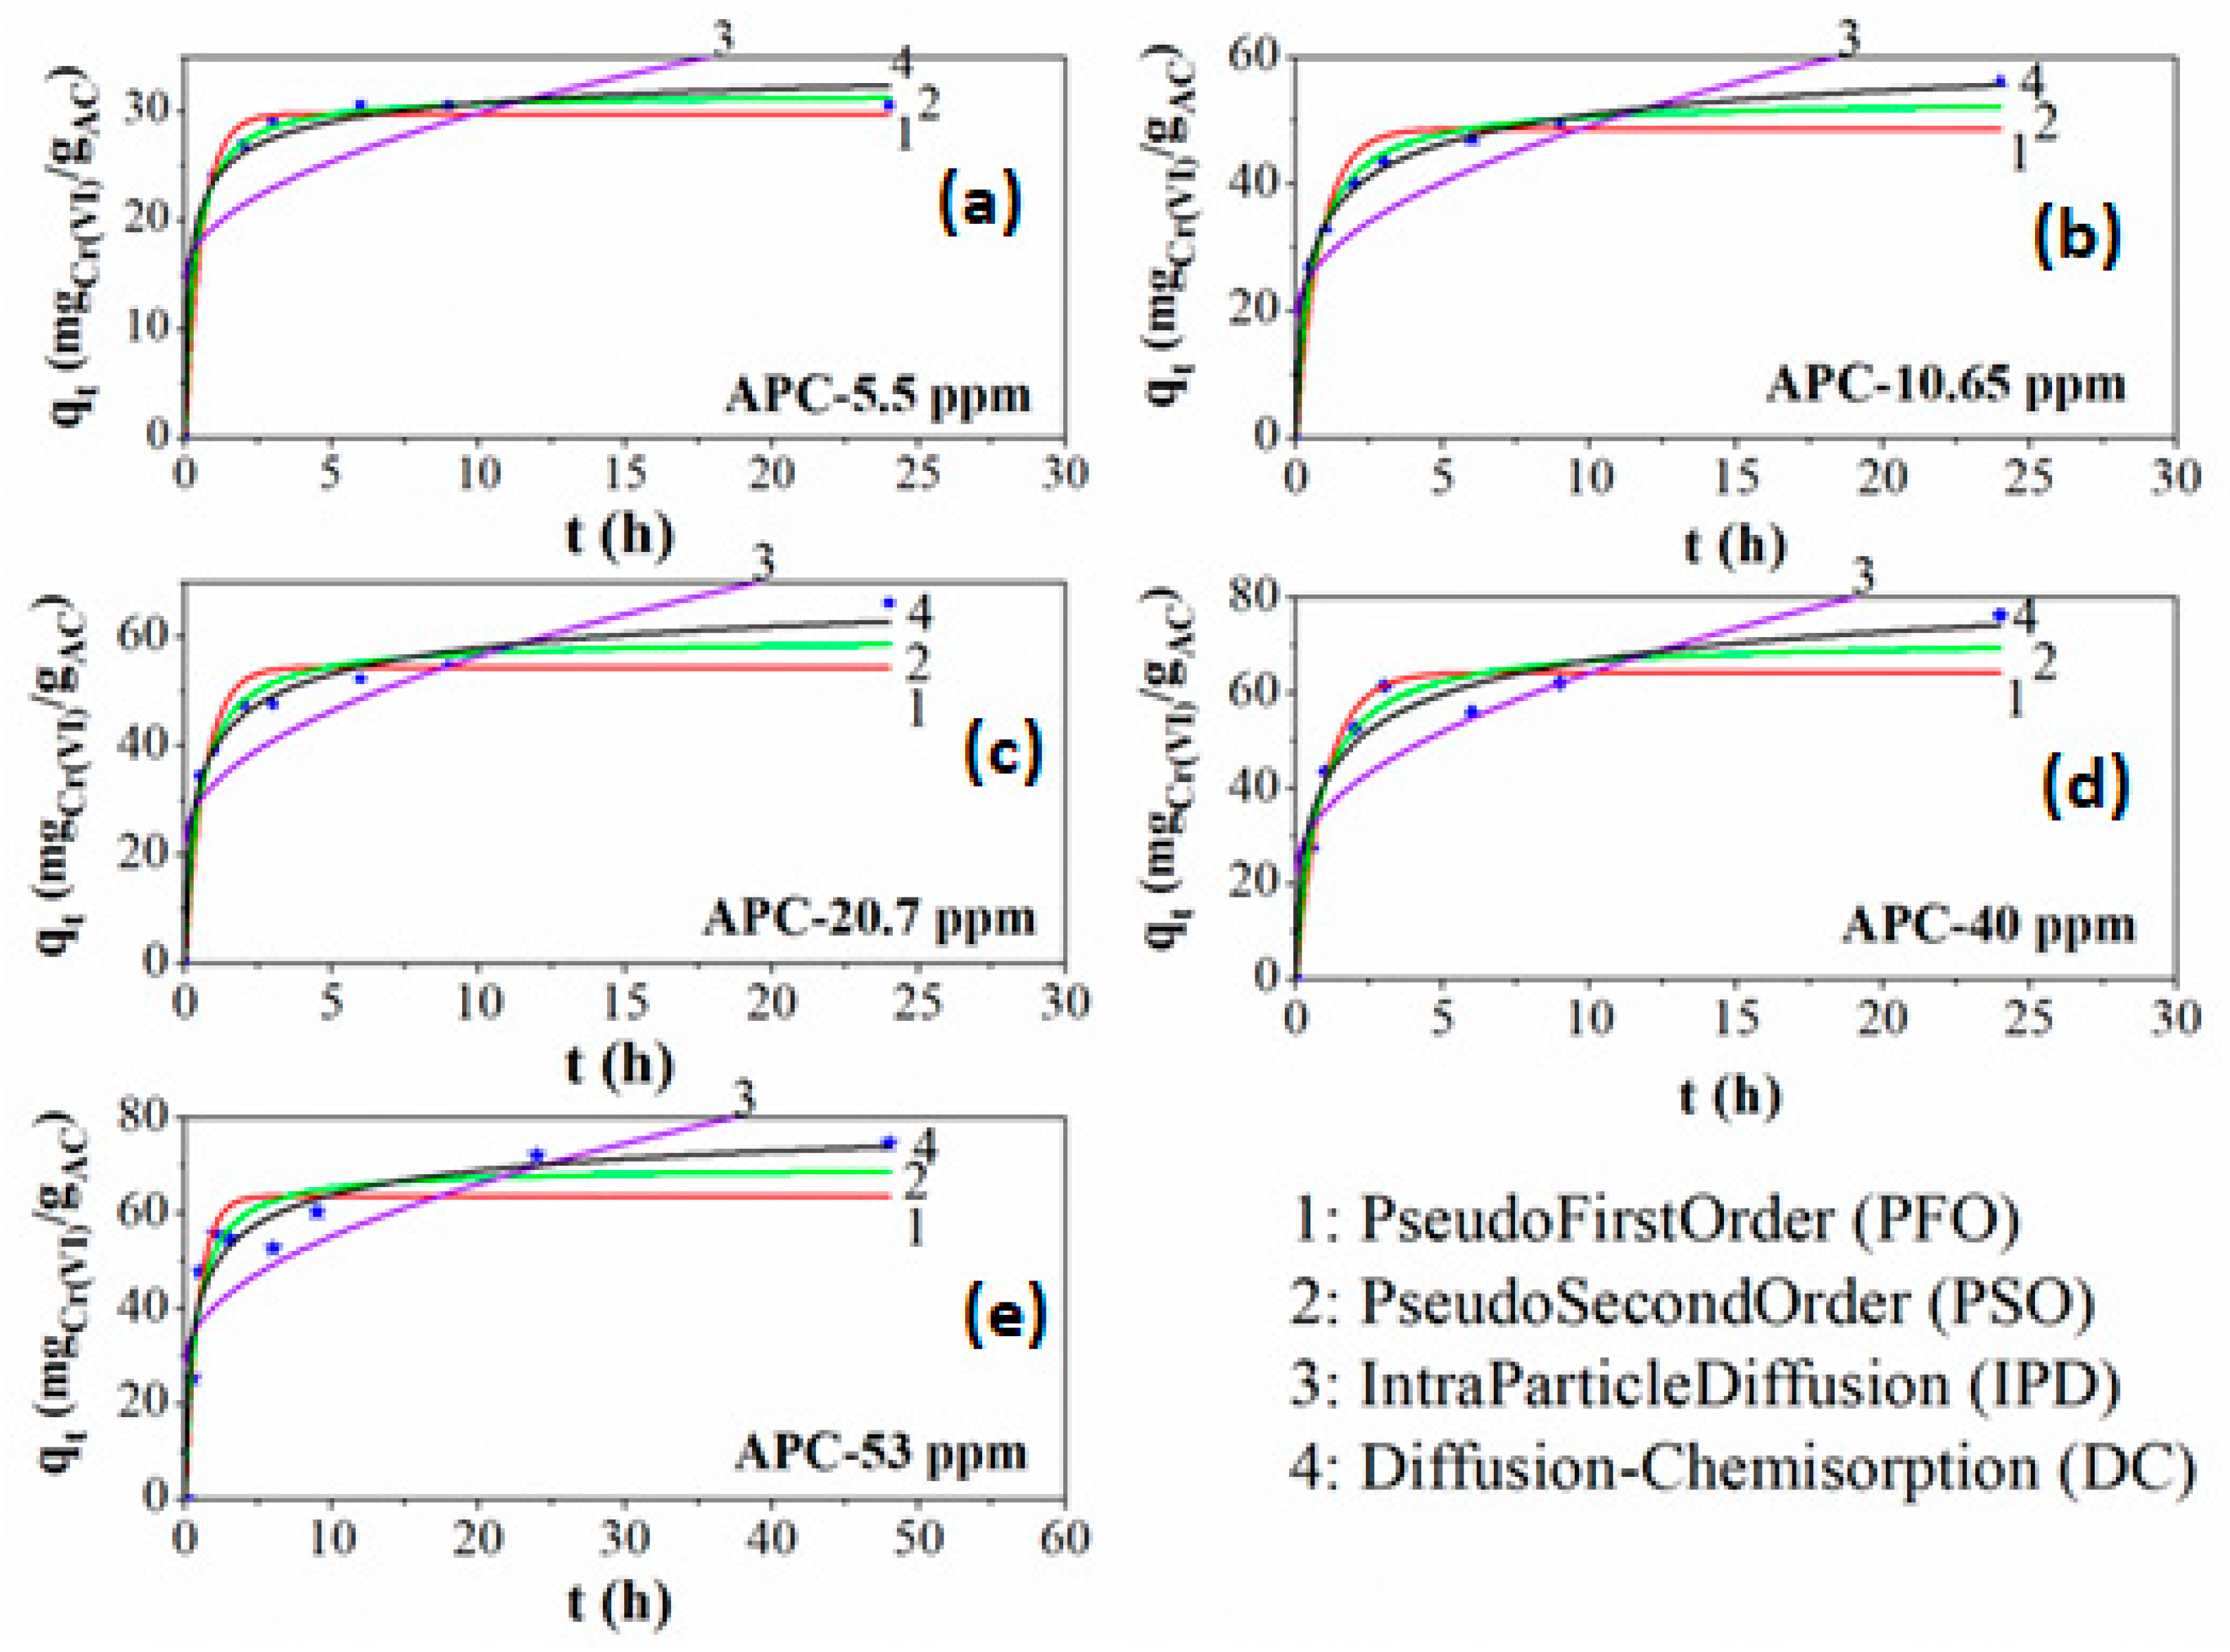
As it is shown in Figure 12, four different kinetic models were used to quantify the adsorption kinetics in our work. The R2 parameter of the Levenberg–Marquardt least-square fitting algorithm (Table 3) was the first tool for the evaluation of such models, in our case. The R2 of the Pseudo First Order (PSO) model falls off as the initial concentration increases. This is reasonable because for Cinit = 5.5 ppm (the lower initial concentration), the occupation by Cr(VI) or other elements of the unoccupied sites in the pores is the controlling stage (PFO mechanism) [48] and the Cr(VI) was consumed totally before any saturation or transient phenomenon starts. But for higher initial concentrations, after the first steps, the occupation of the unoccupied sites stops to be the controlling stage. The R2 trend of the pseudo second order (PSO) model is more stable as the initial concentration increases. This is an expected result because, for an increased initial concentration, a high percentage of the active sites of the pore surface were occupied quickly during initial time moments, but when this initial time pass, phenomena, such as transient adsorption, chemisorption, Van der Waals bonding, ion exchange and reactions, etc., start to exist in the pores. The PSO model was developed on the premise that chemisorption phenomena are the controlling mechanism [48].
This is the reason that the PSO model provides better fitting for increased initial Cr(VI) concentrations. The internal particle diffusion (IPD) R2 values exhibited an increasing trend as the initial concentration increases. This is logical because the larger amounts of Cr(VI) in pores the lower the in-pore mobility of such species. This means that the intra particle diffusion (IPD) mechanism tends to be the controlling stage, but it is not accomplished. Nevertheless, the R2 values for the IPD model are poor compared to the respective values of the other three models. For this reason, this mechanism could not be the controlling mechanism of the process. To observe whether the PSO and chemisorption is the only biosorption active rate limiting mechanism we fitted the experimental data using the diffusion–chemisorption model [48]. According to the R2 values (Table 3) this model exhibits a fitting efficiency similar to and in many cases better to the fitting efficiency of the PSO model.
According to all the above mentioned, neither the collision of the adsorbed species with the unoccupied pore surface sites nor the diffusion through pores are the only controlling mechanism [49]. For this reason, the pseudo second order model (PSO) and the diffusion–chemisorption (DC) model seems to be the most appropriate for the kinetic study of this work. Such models indicate a more complex mechanism, involving both the above-mentioned controlling stages plus a chemisorption process, which occurs on the pore surface sites by bonding the adsorbate with surface groups and may be a reaction on the surface of pores. Furthermore, the state of the adsorbate, i.e., liquid or gas, and the pore size distribution of the activated carbon are strongly interactive [50]. In the case of liquid media as an adsorbate, the existence of micropores in combination with the existence of meso and macro pores is more effective for such adsorption processes [49]. In our case, according to the CPSM model [10,11], APC exhibits approximately 31% macro–meso porosity, which contributes to the relatively quick intraparticle diffusion, and approximately 69% microporosity, which contributes to the relatively slow diffusion and transient adsorption, the surface bonding, the chemisorption and the surface reactions [49].
Table 4 presents the predicted equilibrium concentration for APC based on both the pseudo second order (PSO) model and the diffusion–chemisorption (DC) model. It is obvious that after a long time (theoretically infinite) of the adsorption process, the theoretical overall adsorbed amount will be around 71 mgCr(VI)/gAC, according to the PSO model, and around 90 mgCr(VI)/gAC, according to the DC model. Furthermore, it is obvious from the same table that for initial concentration equal or greater to 40 ppm, APC achieves its maximum saturation capacity.
In the case of PSO mechanism and for the 5.5 ppm as the initial concentration, the predicted adsorbed amount at the equilibrium stage qe was higher than the initial concentration. This means that the total amount of the Cr(VI) was adsorbed and no equilibrium stage occurs at this experiment. Thus, no Gibbs free energy for the adsorption process could be calculated for this experiment. For an initial concentration of 10.65 ppm, 20.70 ppm, 40.00 ppm and 53.00 ppm of the calculated Gibbs free energy values are −26.2 kJ/mol, −21.0 kJ/mol, −19.0 kJ/mol and −18.0 kJ/mol, respectively. The negative sign is attributed to the spontaneous nature of the adsorption process during these experiments [20,21,51]. Moreover, values −20 kJ/mol > ΔG0 > −80 kJ/mol indicate the transition from the physisorption process to the chemisorption. As for the DC mechanism, the predicted equilibrium stage concentrations, qe, were higher than the initial concentration in both cases of 5.5 ppm and 10.65 ppm. Thus, the Gibbs free energies were calculated only for 20.70 ppm, 40.00 ppm, and 53.00 ppm, as the initial concentration and were found to be −22.2 kJ/mol, −20.00 kJ/mol and −18.6 kJ/mol, respectively.
According to both the PSO and DC mechanism and the calculated ΔG0 values, more than one adsorption mechanism was the main mechanism during our experiments, i.e., physisorption, chemisorption, ion exchange, surface complexion and redox reaction [20,21,51].
To investigate if a redox reaction occurs simultaneously with the physical adsorption, diffusion and chemisorption process, a titration procedure of the liquid solution was carried out with KMnO4 at the end of the adsorption process, as described in the experimental section [21]. APC eliminates 100% of the Cr(VI) from the liquid solution (5.8 ppm) after a 24 h reaction at pH = 3. Moreover, Cr(III) was raised in the liquid solution exhibiting a concentration of 23%. This fact evidences that apart from the physisorption, bonding, transient adsorption and chemisorption processes, a redox reaction is also taking place simultaneously in the pore surface.
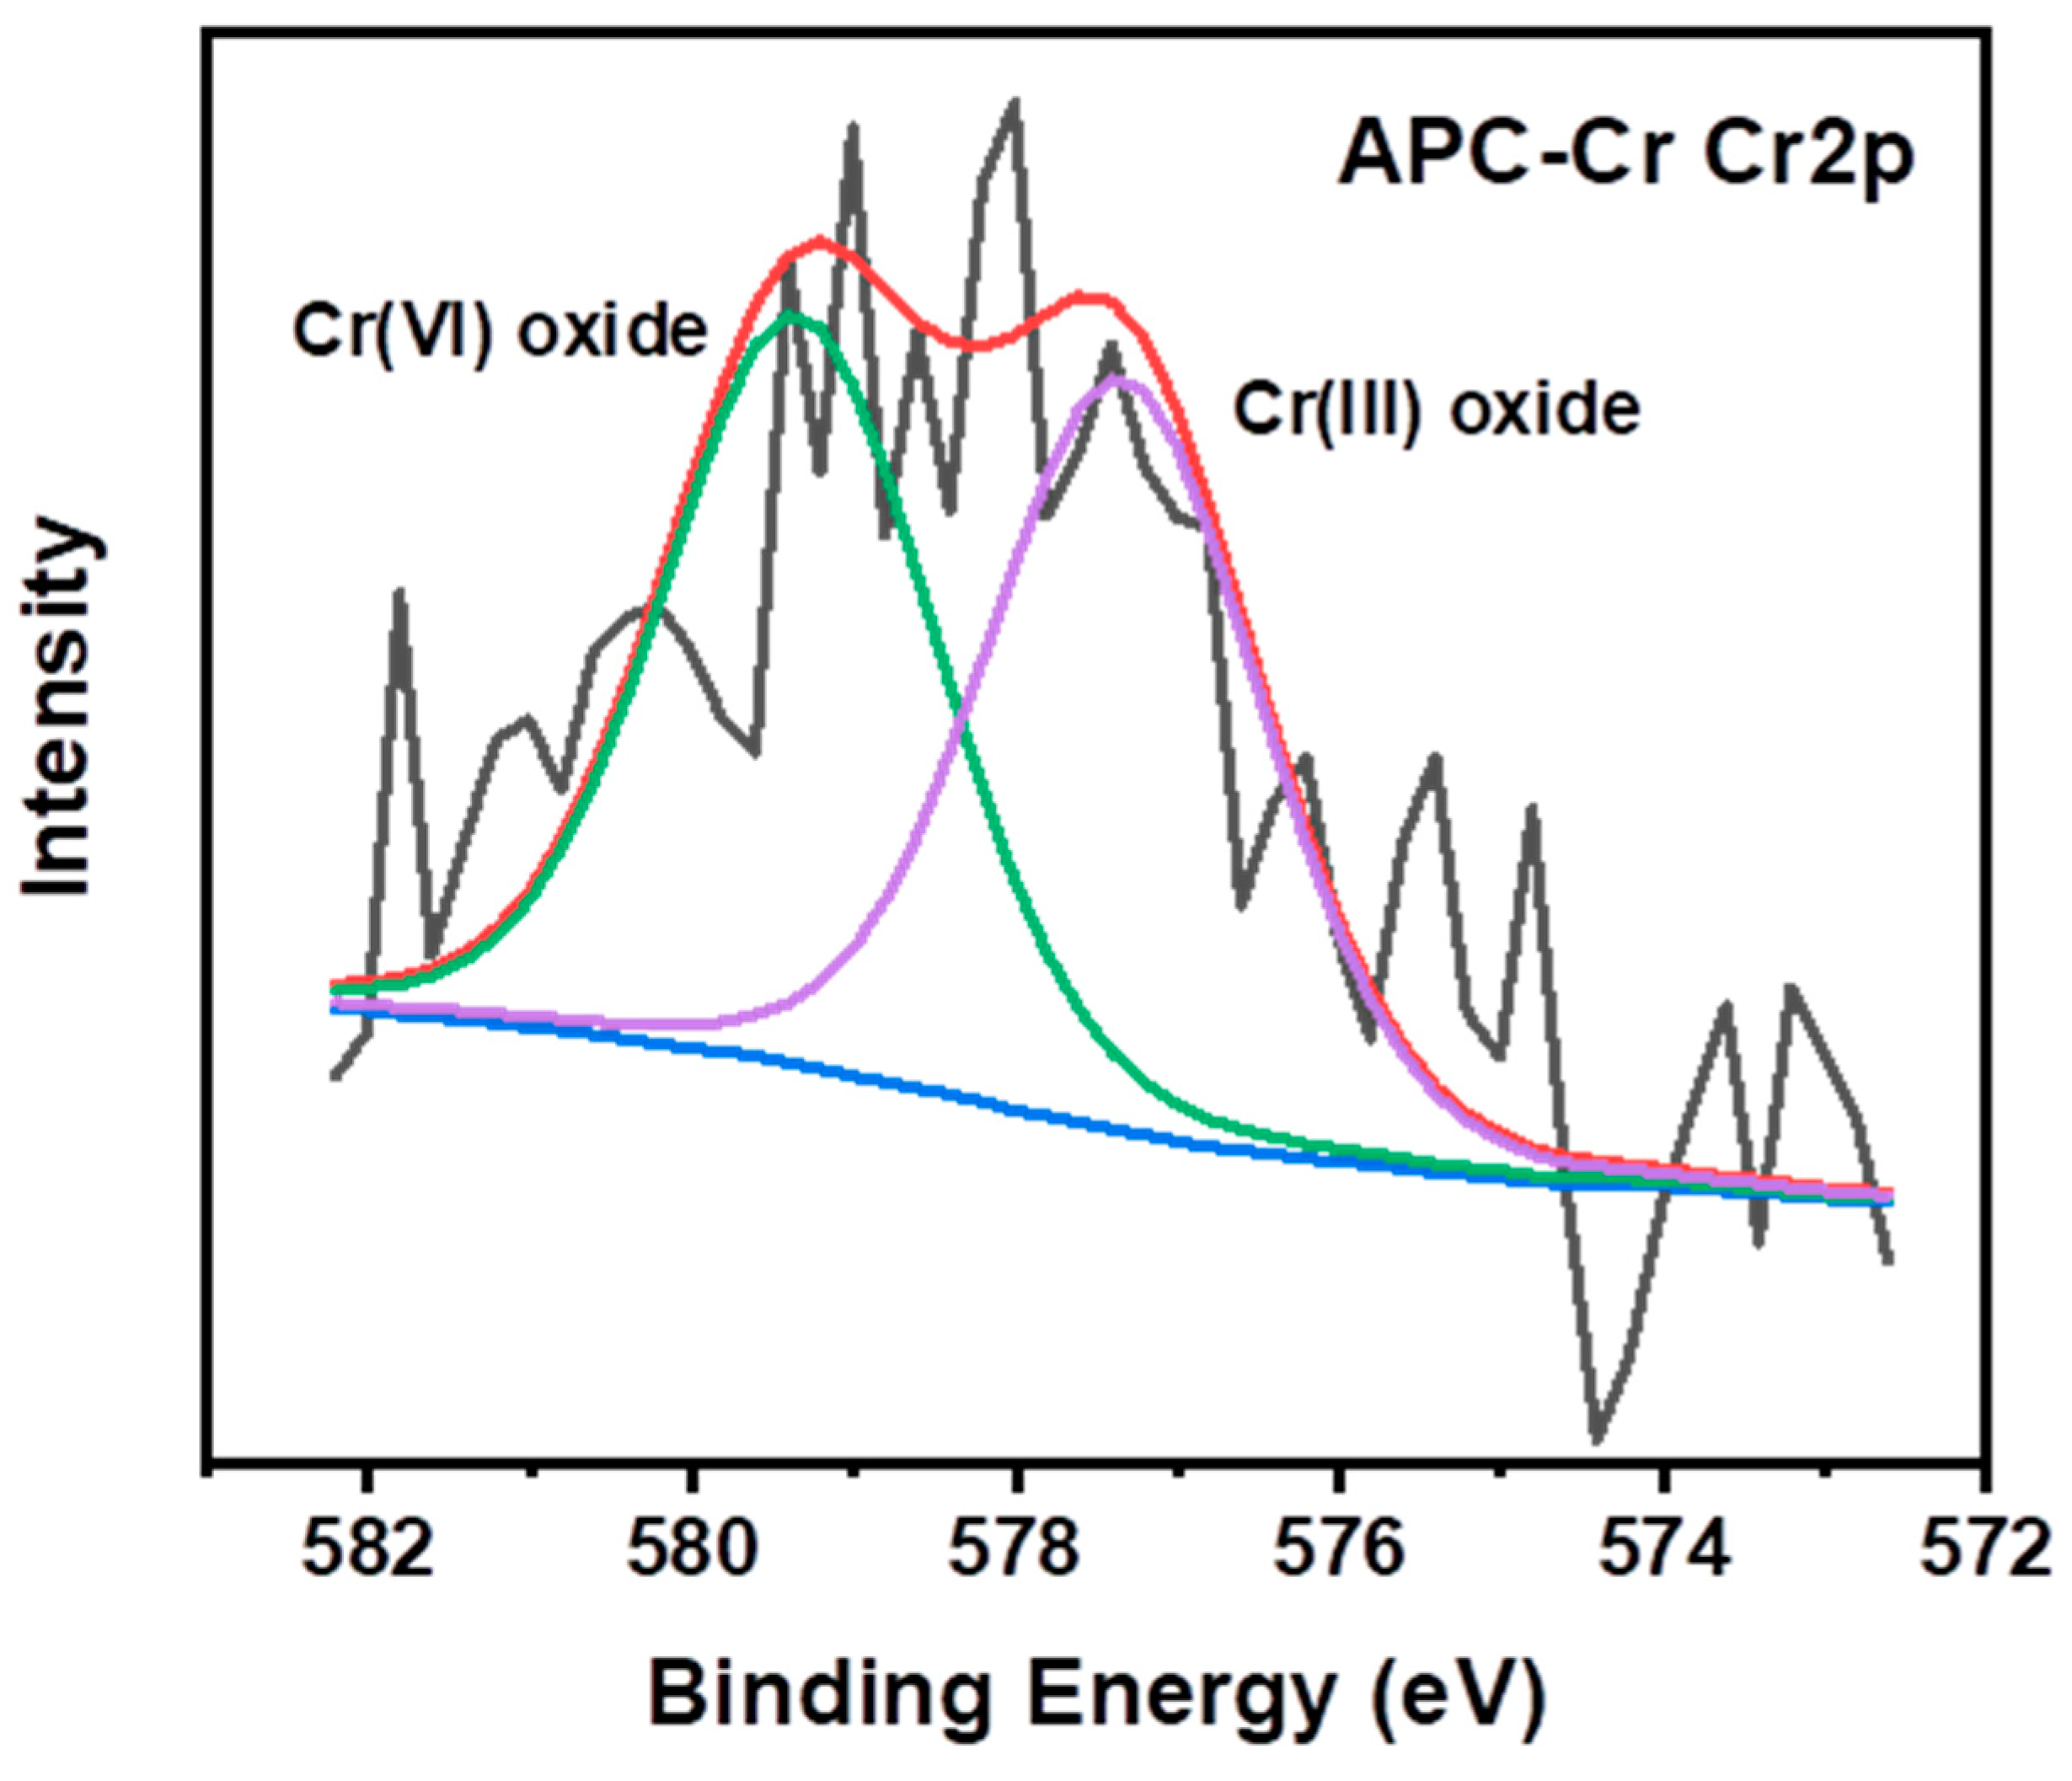
Interestingly, the sample after the adsorption process contained a low intensity Cr2p peak in the region of chromium oxides, which was deconvoluted in two components with same area percentage (Figure 13). The peak at 577.3 eV was attributed to Cr(III) oxide and the one at 579.3 eV to Cr(VI) oxide [52,53]. This implies that chromium interacts with the carbon surface through both the ion exchange and redox reaction mechanisms. The latter was simultaneously accompanied by a roughly 10% increase of the C=O and O–C=O groups in the chromium-containing solid as a result of the carbon oxidation by the Cr(VI) species.

4. Conclusions

We have presented a practical way of converting pencil waste into functional carbon materials with the aid of microwaves. The strong interaction of graphite lead with microwaves produces hot plasma, causing the carbonization of the pencil’s wood casing. Without chemical activation, an important class of carbon nanomaterials is obtained, namely carbon nanosheets. However, chemical activation with KOH leads to porous carbon particles that can decolorize dye solutions, produce heat in pocket warmers based on iron and carbon, fuel gunpowder and efficiently remove hexavalent chromium from water under acidic conditions. In both cases (with or without activation), the derived carbons are amorphous and oxidized; i.e., they bear oxygen-containing functionalities at the surface, which may facilitate further post-functionalization of the solids towards reconstructed derivatives. The method is simple, fast (e.g., completes within 1–2 min of irradiation) and cost-effective due to the microwave technology involved, whereas the excellent absorptivity of wood and its ability to take up a variety of fluids/solutions is soaked in, and it provides additional options in the chemical activation or surface modification of the wood pencil-derived carbons. By considering the number of pencils used per year (14 billion), their average mass when discarded (i.e., 40% of the average mass of a pencil, the latter being about 4 g) and the carbon yield (3–4%), it is roughly estimated that nearly 500–1000 metric tons of carbon could be annually produced this way, finding numerous useful applications in water purification filters, pocket warmers or gunpowder manufacture. Besides writing and drawing, pencils could be, after all, the subject of fundamental carbon science and technology without sophisticated requirements.

Author Contributions

Conceptualization, A.B.B.; methodology, N.C., A.B.B., M.A.K. and C.E.S.; validation, A.B.B., N.C., G.A., M.B., M.A.K. and D.G.; investigation, M.B., A.B.B., C.E.S., M.A.K. and D.G.; data curation, N.C., A.B.B., D.M., G.A., M.B., A.A., I.T., A.B., C.E.S., M.A.K. and D.G.; writing—original draft preparation, A.B.B., C.E.S., N.C. and M.A.K.; writing—review and editing, A.B.B., C.E.S. and M.A.K.; supervision, A.B.B., M.A.K. and D.G. All authors have read and agreed to the published version of the manuscript.

Funding

This study was funded by the project “National Infrastructure in Nanotechnology, Advanced Materials and Micro-/Nanoelectronics” (MIS-5002772), which was implemented under the action, “Reinforcement of the Research and Innovation Infrastructure”, funded by the Operational Programme “Competitiveness, Entrepreneurship and Innovation” (NSRF 2014–2020), and co-financed by Greece and the European Union (European Regional Development Fund). N.C. gratefully acknowledges the IKY foundation for their financial support. This research was also co-financed by Greece and the European Union (European Social Fund-ESF) through the Operational Programme “Human Resources Development, Education and Lifelong Learning” in the context of the project “Strengthening Human Resources Research Potential via Doctorate Research” (MIS-5000432), implemented by the State Scholarships Foundation (IKY). I. T. acknowledges the support by the Operational Programme Research, Development and Education-Project No. CZ.02.1.01/0.0/0.0/15_003/0000416 of the Ministry of Education, Youth and Sports of the Czech Republic. A. B. acknowledges the funding from the Czech Science Foundation, project GA CR-EXPRO, 19-27454X.

Institutional Review Board Statement

Not applicable.

Informed Consent Statement

Not applicable.

Data Availability Statement

The data presented in this study are available on request from the corresponding authors.

Acknowledgments

The authors greatly acknowledge Ch. Papachristodoulou for the XRD and V. Šedajová for the XPS measurements.

Conflicts of Interest

The authors declare no conflict of interest.

References

  1. Novoselov, K.S.; Geim, A.K.; Morozov, S.V.; Jiang, D.; Zhang, Y.; Dubonos, S.V.; Grigorieva, I.V.; Firsov, A.A. Electric field effect in atomically thin carbon films. Science 2004, 306, 666–669. [Google Scholar] [CrossRef] [Green Version]
  2. Menéndez, J.A.; Arenillas, A.; Fidalgo, B.; Fernández, Y.; Zubizarreta, L.; Calvo, E.G.; Bermúdez, J.M. Microwave heating processes involving carbon materials. Fuel Process. Technol. 2010, 91, 1–8. [Google Scholar] [CrossRef] [Green Version]
  3. Chandrasekaran, S.; Basak, T.; Srinivasan, R. Microwave heating characteristics of graphite based powder mixtures. Int. Commun. Heat Mass Transf. 2013, 48, 22–27. [Google Scholar] [CrossRef]
  4. Kim, T.; Lee, J.; Lee, K.-H. Microwave heating carbon-based solid materials. Carbon Lett. 2014, 15, 15–24. [Google Scholar] [CrossRef] [Green Version]
  5. Abioye, A.; Ani, F. Advancement in the production of activated carbon from biomass using microwave heating. J. Teknol. 2017, 79. [Google Scholar] [CrossRef] [Green Version]
  6. Fan, H.; Shen, W. Carbon nanosheets: Synthesis and application. ChemSusChem 2015, 8, 2004–2027. [Google Scholar] [CrossRef] [PubMed]
  7. He, Y.; Zhuang, X.; Lei, C.; Lei, L.; Hou, Y.; Mai, Y.; Feng, X. Porous carbon nanosheets: Synthetic strategies and electrochemical energy related applications. Nano Today 2019, 24, 103–119. [Google Scholar] [CrossRef]
  8. Wang, J.; Kaskel, S. KOH activation of carbon-based materials for energy storage. J. Mater. Chem. 2012, 22, 23710–23725. [Google Scholar] [CrossRef]
  9. Yang, H.M.; Zhang, D.H.; Chen, Y.; Ran, M.J.; Gu, J.C. Study on the application of KOH to produce activated carbon to realize the utilization of distiller’s grains. IOP Conf. Ser. Earth Environ. Sci. 2017, 69, 012051. [Google Scholar] [CrossRef] [Green Version]
  10. Androutsopoulos, G.P.; Salmas, C.E. A new model for capillary condensation−evaporation hysteresis based on a random corrugated pore structure concept:  prediction of intrinsic pore size distributions. 1. Model formulation. Ind. Eng. Chem. Res. 2000, 39, 3747–3763. [Google Scholar] [CrossRef]
  11. Androutsopoulos, G.P.; Salmas, C.E. A new model for capillary condensation−evaporation hysteresis based on a random corrugated pore structure concept:  prediction of intrinsic pore size distribution. 2. Model application. Ind. Eng. Chem. Res. 2000, 39, 3764–3777. [Google Scholar] [CrossRef]
  12. Salmas, C.E.; Androutsopoulos, G.P. Rigid sphere molecular model enables an assessment of the pore curvature effect upon realistic evaluations of surface areas of mesoporous and microporous materials. Langmuir 2005, 21, 11146–11160. [Google Scholar] [CrossRef]
  13. Salmas, C.E.; Ladavos, A.K.; Skaribas, S.P.; Pomonis, P.J.; Androutsopoulos, G.P. Evaluation of microporosity, pore tortuosity, and connectivity of montmorillonite solids pillared with LaNiOx binary oxide. A combined application of the CPSM model, the αs-plot method and a pore percolation–connectivity model. Langmuir 2003, 19, 8777–8786. [Google Scholar] [CrossRef]
  14. Salmas, C.E.; Androutsopoulos, G.P. A novel pore structure tortuosity concept based on nitrogen sorption hysteresis data. Ind. Eng. Chem. Res. 2001, 40, 721–730. [Google Scholar] [CrossRef]
  15. DOWNLOADS, CPSM_Nitrogen. Available online: http://users.uoi.gr/ksalmas/ (accessed on 28 June 2021).
  16. Brunauer, S.; Emmett, P.H.; Teller, E. Adsorption of gases in multimolecular layers. J. Am. Chem. Soc. 1938, 60, 309–319. [Google Scholar] [CrossRef]
  17. Horvath, G.; Kawazoe, K. Method for the calculation of effective pore size distribution in molecular sieve carbon. J. Chem. Eng. Jpn. 1983, 16, 470–475. [Google Scholar] [CrossRef] [Green Version]
  18. Chen, S.G.; Yang, R.T. Theoretical basis for the potential theory adsorption isotherms. The Dubinin-Radushkevich and Dubinin-Astakhov equations. Langmuir 1994, 10, 4244–4249. [Google Scholar] [CrossRef]
  19. Clesceri, L.S.; Greenberg, A.E.; Eaton, A.D. Standard Methods for the Examination of Water and Wastewater, 20th ed.; American Public Health Association: Washington, DC, USA, 1998; pp. 3–71. [Google Scholar]
  20. Asimakopoulos, G.; Baikousi, M.; Kostas, V.; Papantoniou, M.; Bourlinos, A.B.; Zbořil, R.; Karakassides, M.A.; Salmas, C.E. Nanoporous activated carbon derived via pyrolysis process of spent coffee: Structural characterization. Investigation of its use for hexavalent chromium removal. Appl. Sci. 2020, 10, 8812. [Google Scholar] [CrossRef]
  21. Asimakopoulos, G.; Baikousi, M.; Salmas, C.; Bourlinos, A.B.; Zboril, R.; Karakassides, M.A. Advanced Cr(VI) sorption properties of activated carbon produced via pyrolysis of the “Posidonia oceanica” seagrass. J. Hazard. Mater. 2021, 405, 124274. [Google Scholar] [CrossRef] [PubMed]
  22. Roh, J.-S. Structural study of the activated carbon fiber using laser raman spectroscopy. Carbon Lett. 2008, 9, 127–130. [Google Scholar] [CrossRef]
  23. Deraman, M.; Sazali, N.E.S.; Hanappi, M.F.Y.M.; Tajuddin, N.S.M.; Hamdan, E.; Suleman, M.; Othman, M.A.R.; Omar, R.; Hashim, M.A.; Basri, N.H.; et al. Graphene/semicrystalline-carbon derived from amylose films for supercapacitor application. J. Phys. Conf. Ser. 2016, 739, 012085. [Google Scholar] [CrossRef] [Green Version]
  24. Molodets, A.M.; Golyshev, A.A. Structural transformations of amorphous carbon (glassy carbon) at high shock pressures. J. Exp. Theor. Phys. 2018, 126, 772–778. [Google Scholar] [CrossRef]
  25. Ren, S.; Deng, L.; Zhang, B.; Lei, Y.; Ren, H.; Lv, J.; Zhao, R.; Chen, X. Effect of air oxidation on texture, surface properties and dye adsorption of wood-derived porous carbon materials. Materials 2019, 12, 1675. [Google Scholar] [CrossRef] [PubMed] [Green Version]
  26. Kim, S.-H.; Kelly, P.B.; Clifford, A.J. Biological/biomedical accelerator mass spectrometry targets. 2. Physical, morphological, and structural characteristics. Anal. Chem. 2008, 80, 7661–7669. [Google Scholar] [CrossRef] [PubMed] [Green Version]
  27. Tsirka, K.; Katsiki, A.; Chalmpes, N.; Gournis, D.; Paipetis, A.S. Mapping of graphene oxide and single layer graphene flakes—defects annealing and healing. Front. Mater. 2018, 5, 37. [Google Scholar] [CrossRef] [Green Version]
  28. Chalmpes, N.; Asimakopoulos, G.; Spyrou, K.; Vasilopoulos, K.C.; Bourlinos, A.B.; Moschovas, D.; Avgeropoulos, A.; Karakassides, M.A.; Gournis, D. Functional carbon materials derived through hypergolic reactions at ambient conditions. Nanomaterials 2020, 10, 566. [Google Scholar] [CrossRef] [Green Version]
  29. Baikousi, M.; Chalmpes, N.; Spyrou, K.; Bourlinos, A.B.; Avgeropoulos, A.; Gournis, D.; Karakassides, M.A. Direct production of carbon nanosheets by self-ignition of pyrophoric lithium dialkylamides in air. Mater. Lett. 2019, 254, 58–61. [Google Scholar] [CrossRef]
  30. Chalmpes, N.; Spyrou, K.; Bourlinos, A.B.; Moschovas, D.; Avgeropoulos, A.; Karakassides, M.A.; Gournis, D. Synthesis of highly crystalline graphite from spontaneous ignition of in situ derived acetylene and chlorine at ambient conditions. Molecules 2020, 25, 297. [Google Scholar] [CrossRef] [PubMed] [Green Version]
  31. Dombrowski, R.J.; Lastoskie, C.M.; Hyduke, D.R. The Horvath–Kawazoe method revisited. Colloids Surf. A Physicochem. Eng. Asp. 2001, 187, 23–39. [Google Scholar] [CrossRef]
  32. Chalmpes, N.; Tantis, I.; Bakandritsos, A.; Bourlinos, A.B.; Karakassides, M.A.; Gournis, D. Rapid carbon formation from spontaneous reaction of ferrocene and liquid bromine at ambient conditions. Nanomaterials 2020, 10, 1564. [Google Scholar] [CrossRef]
  33. Chalmpes, N.; Moschovas, D.; Bourlinos, A.B.; Spyrou, K.; Vasilopoulos, K.C.; Avgeropoulos, A.; Karakassides, M.A.; Gournis, D. Hypergolic ignition of 1,3-cyclodienes by fuming nitric acid toward the fast and spontaneous formation of carbon nanosheets at ambient conditions. Micro 2021, 1, 15–27. [Google Scholar] [CrossRef]
  34. Chalmpes, N.; Bourlinos, A.B.; Talande, S.; Bakandritsos, A.; Moschovas, D.; Avgeropoulos, A.; Karakassides, M.A.; Gournis, D. Nanocarbon from rocket fuel waste: The case of furfuryl alcohol-fuming nitric acid hypergolic pair. Nanomaterials 2021, 11, 1. [Google Scholar] [CrossRef] [PubMed]
  35. Xie, W.; Ng, K.M.; Weng, L.-T.; Chan, C.-M. Characterization of hydrogenated graphite powder by X-ray photoelectron spectroscopy and time-of-flight secondary ion mass spectrometry. RSC Adv. 2016, 6, 80649–80654. [Google Scholar] [CrossRef]
  36. Chalmpes, N.; Moschovas, D.; Tantis, I.; Bourlinos, A.B.; Bakandritsos, A.; Fotiadou, R.; Patila, M.; Stamatis, H.; Avgeropoulos, A.; Karakassides, M.A.; et al. Carbon nanostructures derived through hypergolic reaction of conductive polymers with fuming nitric acid at ambient conditions. Molecules 2021, 26, 1595. [Google Scholar] [CrossRef] [PubMed]
  37. Chalmpes, N.; Bourlinos, A.B.; Šedajová, V.; Kupka, V.; Moschovas, D.; Avgeropoulos, A.; Karakassides, M.A.; Gournis, D. Hypergolic materials synthesis through reaction of fuming nitric acid with certain cyclopentadienyl compounds. C 2020, 6, 61. [Google Scholar] [CrossRef]
  38. Baikousi, M.; Dimos, K.; Bourlinos, A.B.; Zbořil, R.; Papadas, I.; Deligiannakis, Y.; Karakassides, M.A. Surface decoration of carbon nanosheets with amino-functionalized organosilica nanoparticles. Appl. Surf. Sci. 2012, 258, 3703–3709. [Google Scholar] [CrossRef]
  39. Kumar, A.; Jena, H.M. Removal of methylene blue and phenol onto prepared activated carbon from Fox nutshell by chemical activation in batch and fixed-bed column. J. Clean. Prod. 2016, 137, 1246–1259. [Google Scholar] [CrossRef]
  40. Üner, O.; Geçgel, Ü.; Bayrak, Y. Adsorption of methylene blue by an efficient activated carbon prepared from citrullus lanatus rind: Kinetic, isotherm, thermodynamic, and mechanism analysis. Water Air Soil Pollut. 2016, 227, 247. [Google Scholar] [CrossRef]
  41. Naiman, K.; Dračínský, M.; Hodek, P.; Martínková, M.; Schmeiser, H.H.; Frei, E.; Stiborová, M. Formation, persistence, and identification of DNA adducts formed by the carcinogenic environmental pollutant o-anisidine in rats. Toxicol. Sci. 2012, 127, 348–359. [Google Scholar] [CrossRef] [Green Version]
  42. Casadevall, M.; da Cruz Fresco, P.; Kortenkamp, A. Chromium(VI)-mediated DNA damage: Oxidative pathways resulting in the formation of DNA breaks and abasic sites. Chem.-Biol. Interact. 1999, 123, 117–132. [Google Scholar] [CrossRef]
  43. Mitra, S.; Sarkar, A.; Sen, S. Removal of chromium from industrial effluents using nanotechnology: A review. Nanotechnol. Environ. Eng. 2017, 2, 11. [Google Scholar] [CrossRef]
  44. Pakade, V.E.; Tavengwa, N.T.; Madikizela, L.M. Recent advances in hexavalent chromium removal from aqueous solutions by adsorptive methods. RSC Adv. 2019, 9, 26142–26164. [Google Scholar] [CrossRef] [Green Version]
  45. Pérez-Candela, M.; Martín-Martínez, J.; Torregrosa-Maciá, R. Chromium(VI) removal with activated carbons. Water Res. 1995, 29, 2174–2180. [Google Scholar] [CrossRef]
  46. Mohan, D.; Pittman, C.U. Activated carbons and low cost adsorbents for remediation of tri- and hexavalent chromium from water. J. Hazard. Mater. 2006, 137, 762–811. [Google Scholar] [CrossRef] [PubMed]
  47. Sajjad, M.; Khan, S.; Ali Baig, S.; Munir, S.; Naz, A.; Ahmad, S.S.; Khan, A. Removal of potentially toxic elements from aqueous solutions and industrial wastewater using activated carbon. Water Sci. Technol. 2017, 75, 2571–2579. [Google Scholar] [CrossRef] [PubMed] [Green Version]
  48. Sutherland, C.; Venkobachar, C. A diffusion-chemisorption kinetic model for simulating biosorption using forest macro-fungus, fomes fasciatus. Int. Res. J. Plant Sci. 2010, 1, 107–117. [Google Scholar]
  49. Hubbe, M.; Azizian, S.; Douven, S. Implications of apparent pseudo-second-prder adsorption kinetics onto cellulosic materials: A review. Bioresources 2019, 14, 7582–7626. [Google Scholar] [CrossRef]
  50. Perlach, J.R. Activated Carbon Adsorption for Wastewater Treatment; CRC Press: Boca Raton, FL, USA, 1981; p. 260. [Google Scholar]
  51. Pholosi, A.; Naidoo, E.B.; Ofomaja, A.E. Intraparticle diffusion of Cr(VI) through biomass and magnetite coated biomass: A comparative kinetic and diffusion study. S. Afr. J. Chem. Eng. 2020, 32, 39–55. [Google Scholar] [CrossRef]
  52. Bandara, P.C.; Peña-Bahamonde, J.; Rodrigues, D.F. Redox mechanisms of conversion of Cr(VI) to Cr(III) by graphene oxide-polymer composite. Sci. Rep. 2020, 10, 9237. [Google Scholar] [CrossRef]
  53. Zhu, K.; Gao, Y.; Tan, X.; Chen, C. Polyaniline-modified Mg/Al layered double hydroxide composites and their application in efficient removal of Cr(VI). ACS Sustain. Chem. Eng. 2016, 4, 4361–4369. [Google Scholar] [CrossRef]
Figure 1. A wood pencil on a ceramic plate was placed in the microwave oven (a) and irradiated for a couple of minutes at 700 W under rotation (b). The graphite core produced hot plasma, igniting the pencil (c). After that, the graphite lead and the carbonized wood casing were spontaneously split from each other (d). The carbonized wood specimens were collected and acid-treated to finally afford a fine carbon powder, codenamed PC (inset glass vial) (e).
Applsci 12 00410 g001
Figure 2. A wood pencil impregnated with KOH (a) was microwave irradiated as above (b). The graphite core produced hot plasma, igniting the pencil (c) and afforded a voluminous carbon mass around the graphite lead (d). The voluminous carbon was mechanically separated from the lead and worked up similarly as above to afford a fine carbon powder, codenamed APC (inset glass vial) (e).
Applsci 12 00410 g002
Figure 3. XRD patterns of the PC (a) and APC (b) powders. APC additionally contained traces of residual K2CO3.
Applsci 12 00410 g003
Figure 4. Raman spectra of PC (black line) and APC (red line), showing the characteristic D and G carbon bands from left to right.
Applsci 12 00410 g004
Figure 5. SEM images of the PC sample. (a) Magnification ×4000, scale 5 μm, (b) magnification ×1500, scale 10 μm, (c) magnification ×3000, scale 5 μm.
Applsci 12 00410 g005
Figure 6. (a) AFM image of cross-sectional analysis of selected carbon nanosheet in PC sample, (b) AFM statistical analysis of thickness for 30 randomly selected nanosheets.
Applsci 12 00410 g006
Figure 7. SEM images of the APC sample. (a) Magnification ×1300, scale 10 μm, (b) magnification ×8000, scale 2 μm.
Applsci 12 00410 g007
Figure 8. N2 adsorption (filled circles)—desorption (empty circles) experimental data for PC and APC. The continuous lines show the CPSM model fitting comparison. The inset figures show the pore size distribution (PSD) according to the Horvath–Kawazoe (dash dots) and to the CPSM (line) model.
Applsci 12 00410 g008
Figure 9. (a) XPS survey of PC material; (b) high resolution C1s spectra of PC material; (c) XPS survey of APC material; and (d) high resolution C1s spectra of APC material.
Applsci 12 00410 g009
Figure 10. (a) Effect of pH on maximum uptake capacity for APC. (b) Effect of initial Cr(VI) concentration on Cr(VI) removed amount for pH = 3 and T = 23 °C after 24 h by PC and APC.
Applsci 12 00410 g010
Figure 11. Kinetics and capacity comparison for various initial concentrations of PC and APC.
Applsci 12 00410 g011
Figure 12. Fitted curves of four different kinetic models (i.e., (1) pseudo first order (PFO), (2) pseudo second order (PSO), (3) intra particle diffusion (IPD), (4) diffusion–chemisorption (DC)), upon experimental kinetic datasets of five different Cr(VI) initial concentrations (i.e., (a) 5.5 ppm, (b) 10.65 ppm, (c) 20.7 ppm, (d) 40 ppm, (e) 53 ppm) for the APC material.
Applsci 12 00410 g012
Figure 13. Deconvoluted high-resolution Cr2p spectrum of the APC sample after chromium adsorption.
Applsci 12 00410 g013
Table 1. Pore structure parameters derived from the CPSM model simulation of the overall N2 adsorption–desorption hysteresis loop, the Dubinnin–Raduskevitch (D–R) method and the Horvath–Kawazoe (H–K) model.
Sample CodeVpore
(cm3/g)
VD–Rmicro
(cm3/g)
VCPSMmicro
(% cm3/g)
DCPSMNmean
(nm)
DCPSMVmean
(nm)
DHKVmean
(nm)
PC0.0800.0340.0301.381.501.90
APC0.3060.240.210.971.061.67
Table 2. Specific surface area (SSA) estimation derived from the classic BET model as well as from the CPSM model.
Sample CodeSBET (m2/g)SCPSM (m2/g)
PC82105
APC509776
Table 3. R2 correlation coefficient values provided by Levenberg–Marquardt least-square fitting algorithm upon the APC experimental dataset.
APC-Cinit (ppm)PFO R2PSO R2IPD R2DC R2
5.500.9990.9980.5030.984
10.650.9450.9860.7060.998
20.700.9120.9620.7100.989
40.000.9140.9630.7270.961
53.000.9090.9430.7360.948
Table 4. Predicted Cr(VI) APC adsorption capacity for Cr(VI) at the equilibrium stage for pH = 3 and T = 23 °C.
APC-Cinit (ppm)qe (mgCr(VI)/gAC) (PSO)qe (mgCr(VI)/gAC) (DC)
5.5031.835.8
10.6553.566.8
20.7059.874.1
40.0071.693.2
53.0069.885.3
Publisher’s Note: MDPI stays neutral with regard to jurisdictional claims in published maps and institutional affiliations.