1. Introduction
With the boom of social media platforms, there are tens of millions of user-generated information on social media platforms every day [
1]. Due to the development of online communities, the world is better connected than ever before. On social networks, users are connected to other users by an average separation of 3.57 (
https://research.fb.com/blog/2016/02/three-and-a-half-degrees-of-separation/) (accessed on 25 December 2021).The short communication distance and ease of access make online social media an increasingly popular venue for information sharing. The convenience and low cost of social networking are conducive to collective intelligence, but at the same time, it leads to a negative by-product: the propagation of misinformation such as fake news. Fake news is defined as a kind of news story relaying intentionally false information on social media [
2,
3]. In recent years, consumers have been getting used to accessing news from social media. For example, the Pew Research Center announced that approximately 79% of US adults get news from social media in 2020, compared to only 49% in 2012 (
www.journalism.org/2021/01/12/news-use-across-social-media-platforms-in-2020/) (accessed on 25 December 2021).
The explosive growth of fake news has influenced democracy, justice, and public trust. Both individuals and organizations can be easily overwhelmed by the sheer volume of online posts or misled by widespread fake news. For example, studies show that approximately 5800 people were admitted to the hospital as a result of false information on social media during the COVID-19 pandemic [
4]. Therefore, we aim to construct an estimator to predict the popularity of fake news in social media. The estimator will have the ability to predict which post of fake news has a high popularity potential, so it can help organizations identify and mitigate the propagation of false information in the early stage. Additionally, with the good generalization performance of our model, the methods and features proposed in this paper can also be applied to other situations, such as identifying events of viral marketing, recommendation systems, and online advertising.
In the past decade, a series of efforts have been devoted to the problem of popularity prediction and fake news detection. Generally speaking, popularity prediction aims to predict future popularity when observing early adopters during a specific observation period. Some studies proposed to use generative approaches, such as the Poisson process or Hawkes process, to model the propagation process of information and estimate the scale of cascade [
1,
5,
6,
7,
8]. Other approaches employed features from various aspects of social media, such as user characteristics [
9,
10,
11], temporal information [
12,
13], and the structure of propagation network [
14,
15,
16]. These methods have shown significant improvement in prediction. However, due to the limitation that input features rely heavily on hand-crafting and domain knowledge, the models provide less generalization. To address this problem, deep learning-based methods were proposed to automatically capture the dynamics of information dissemination [
1,
17,
18,
19]. By leveraging deep learning techniques, the methods achieved robust prediction performance without requiring strong prior knowledge and feature design. However, there is still room for improvement in some specific topics, e.g., predicting the influence of fake news. Predicting the influence of fake news is not exactly the same as popularity prediction. The reason is four-fold. Firstly, existing work for popularity prediction usually considers only posts to build the cascade network. However, we exploit retweet posts to build cascade networks, which is especially worth investigating for fake news. The reason is that user characteristics, i.e., node attributes, have more impacts on message dissemination than the post itself. Second, no existing work considers user timeline and self-description in the user’s profile. These two sources are significantly important features for fake news analysis. Thirdly, most traditional work, including feature-based and deep learning-based methods, cannot provide explainability, while our designed attention mechanism can. Fourth, our work is easy to be incorporated with state-of-art fake news detection, while popularity prediction work does not focus on fake news. Our experiment confirms the prediction power of MUFFLE outperforms general popularity prediction works.
As for fake news detection, multiple approaches are categorized according to their features for prediction: (1) content-based: using text information to spot and verify fake news [
20,
21,
22,
23]. (2) user-based: relying on involved users’ characteristics to detect fake news [
24,
25,
26,
27]. (3) network-based: encoding the propagation structure and feeding it into neural network as features [
21,
28,
29,
30,
31]. (4) hybrid-based: integrating some of the above-mentioned features to perform news classification [
32,
33,
34].
Unfortunately, most studies about fake news focus on detection rather than gauging the influence of fake news (i.e., fake news popularity) on social media, which is also crucial for mitigating its impact on our society. In addition, no comprehensive framework captures the dynamics of multi-modal attributes and preserves the model explainability. To achieve our goal, we have to overcome the following challenges: (1) Data collection and fusion: The features used for prediction consist of various types, including social relationships, fake news content, news metadata, and user characteristics, etc. These types of information are stored in different sources and require a distinct retrieving process. Additionally, most of the data is user-generated and irregular, so it takes a lot of effort to link data from various domains together to rebuild the whole picture. (2) Imbalanced distribution: Due to the power-law distribution in the data of social media platforms, only a few posts have massive shares, and most posts have little to no shares. The same phenomenon exists on other social-related data, such as the users’ followers, historical posts, etc. The characteristics make it difficult for the prediction model to capture the traits and perform an accurate prediction.
To achieve our goal and overcome the challenges mentioned above, in this study, we propose a comprehensive framework MUFFLE to model the dynamics from various domains: social network, user timeline, user profile, and textual content. In MUFFLE, we construct a combination of a Graph Convolution Network (GCN) and Recurrent Neural Network (RNN) to encode the propagation of fake news in social media. As for textual data such as fake news, tweets, and user self-descriptions, we use DistilBERT [
35] to encode the representation of text. Additionally, temporal and graph features that proved to be effective in related problems [
33,
36,
37,
38] are also used in MUFFLE. To further increase the explainability of our framework and raise the performance, we develop an attention mechanism that learns the importance of each aspect of feature representation.
To evaluate the proposed framework, we compare MUFFLE with other popularity prediction approaches, and the result shows that our model outperforms state-of-art models. Another experiment also indicates that the features fed into MUFFLE are effective and correlate to the propagation of fake news on social media. Finally, the feature importance recorded during the experiment shows that our proposed model has explainability in predicting the impact of fake news.
To summarize, our main contributions are:
We study a novel problem of predicting the influence of fake news on social media in an early stage, which is also crucial for mitigating the impact of false information on our society. Most studies on fake news focus on ascertaining the veracity of news only.
A comprehensive framework MUFFLE is proposed, which jointly models the multi-modal features including news content, social network, and user characteristics. By leveraging the strength of state-of-the-art deep learning models, MUFFLE is able to capture textual, temporal, and structural dynamics along the propagation of fake news.
Our proposed framework provides explainability by constructing an attention mechanism. Through analyzing learned attention weights, we further investigate the importance of features in our research problem.
We conduct experiments on real-world datasets to demonstrate the effectiveness of the proposed framework for predicting and explaining the influence of fake news on social media.
5. Experiments
In this section, we present the experiments that evaluate the effectiveness of the proposed framework MUFFLE. Specifically, we aim to answer the following questions:
EQ1: Can our proposed framework MUFFLE achieve robust performance on fake news popularity prediction by modeling multi-model contents including social networks, user characteristics, fake news, and tweets?
EQ2: How effective are the features in components of social networks, user timelines, user profiles, and source tweets in improving the prediction performance of MUFFLE?
EQ3: Can MUFFLE capture the features extracted from social media and fake news to explain why a tweet sharing fake news causes a large information cascade?
5.1. Dataset
We use one of the most comprehensive fake news data repositories: FakeNewsNet [
59]. The repository consists of news data related to various fact-checking websites and the corresponding information of news content and social context. News content includes the meta attributes of the news (e.g., body text and title), and social context includes the social engagements of news items (e.g., sharing posts on Twitter). News in FakeNewsNet data repository are collected from two reliable fact-checking websites:
GossipCop (
https://www.gossipcop.com/) accessed on 25 December 2021) and
PolitiFact (
https://www.politifact.com/) (accessed on 25 December 2021), which focus on political news and entertainment news, respectively. News pieces posted on the websites are reviewed by domain experts and professional journalists and annotated as true news or fake news. We choose news with fake labels from
PolitiFact due to the goal of our study: predicting the influence of fake news in social media.
The raw dataset only contains fake news posts and tweets that share them. In order to obtain richer social context as features for prediction, such as the network formed by users retweeting the same source tweet, we have collected user profiles, user timelines, and lists of followers via Twitter APIs. The detailed statistics of the dataset are shown in
Table 1. Among 376 fake news posts, we selected only 339 news articles that have been shared on Twitter. These news articles have generated up to 119,009 information cascades in total.
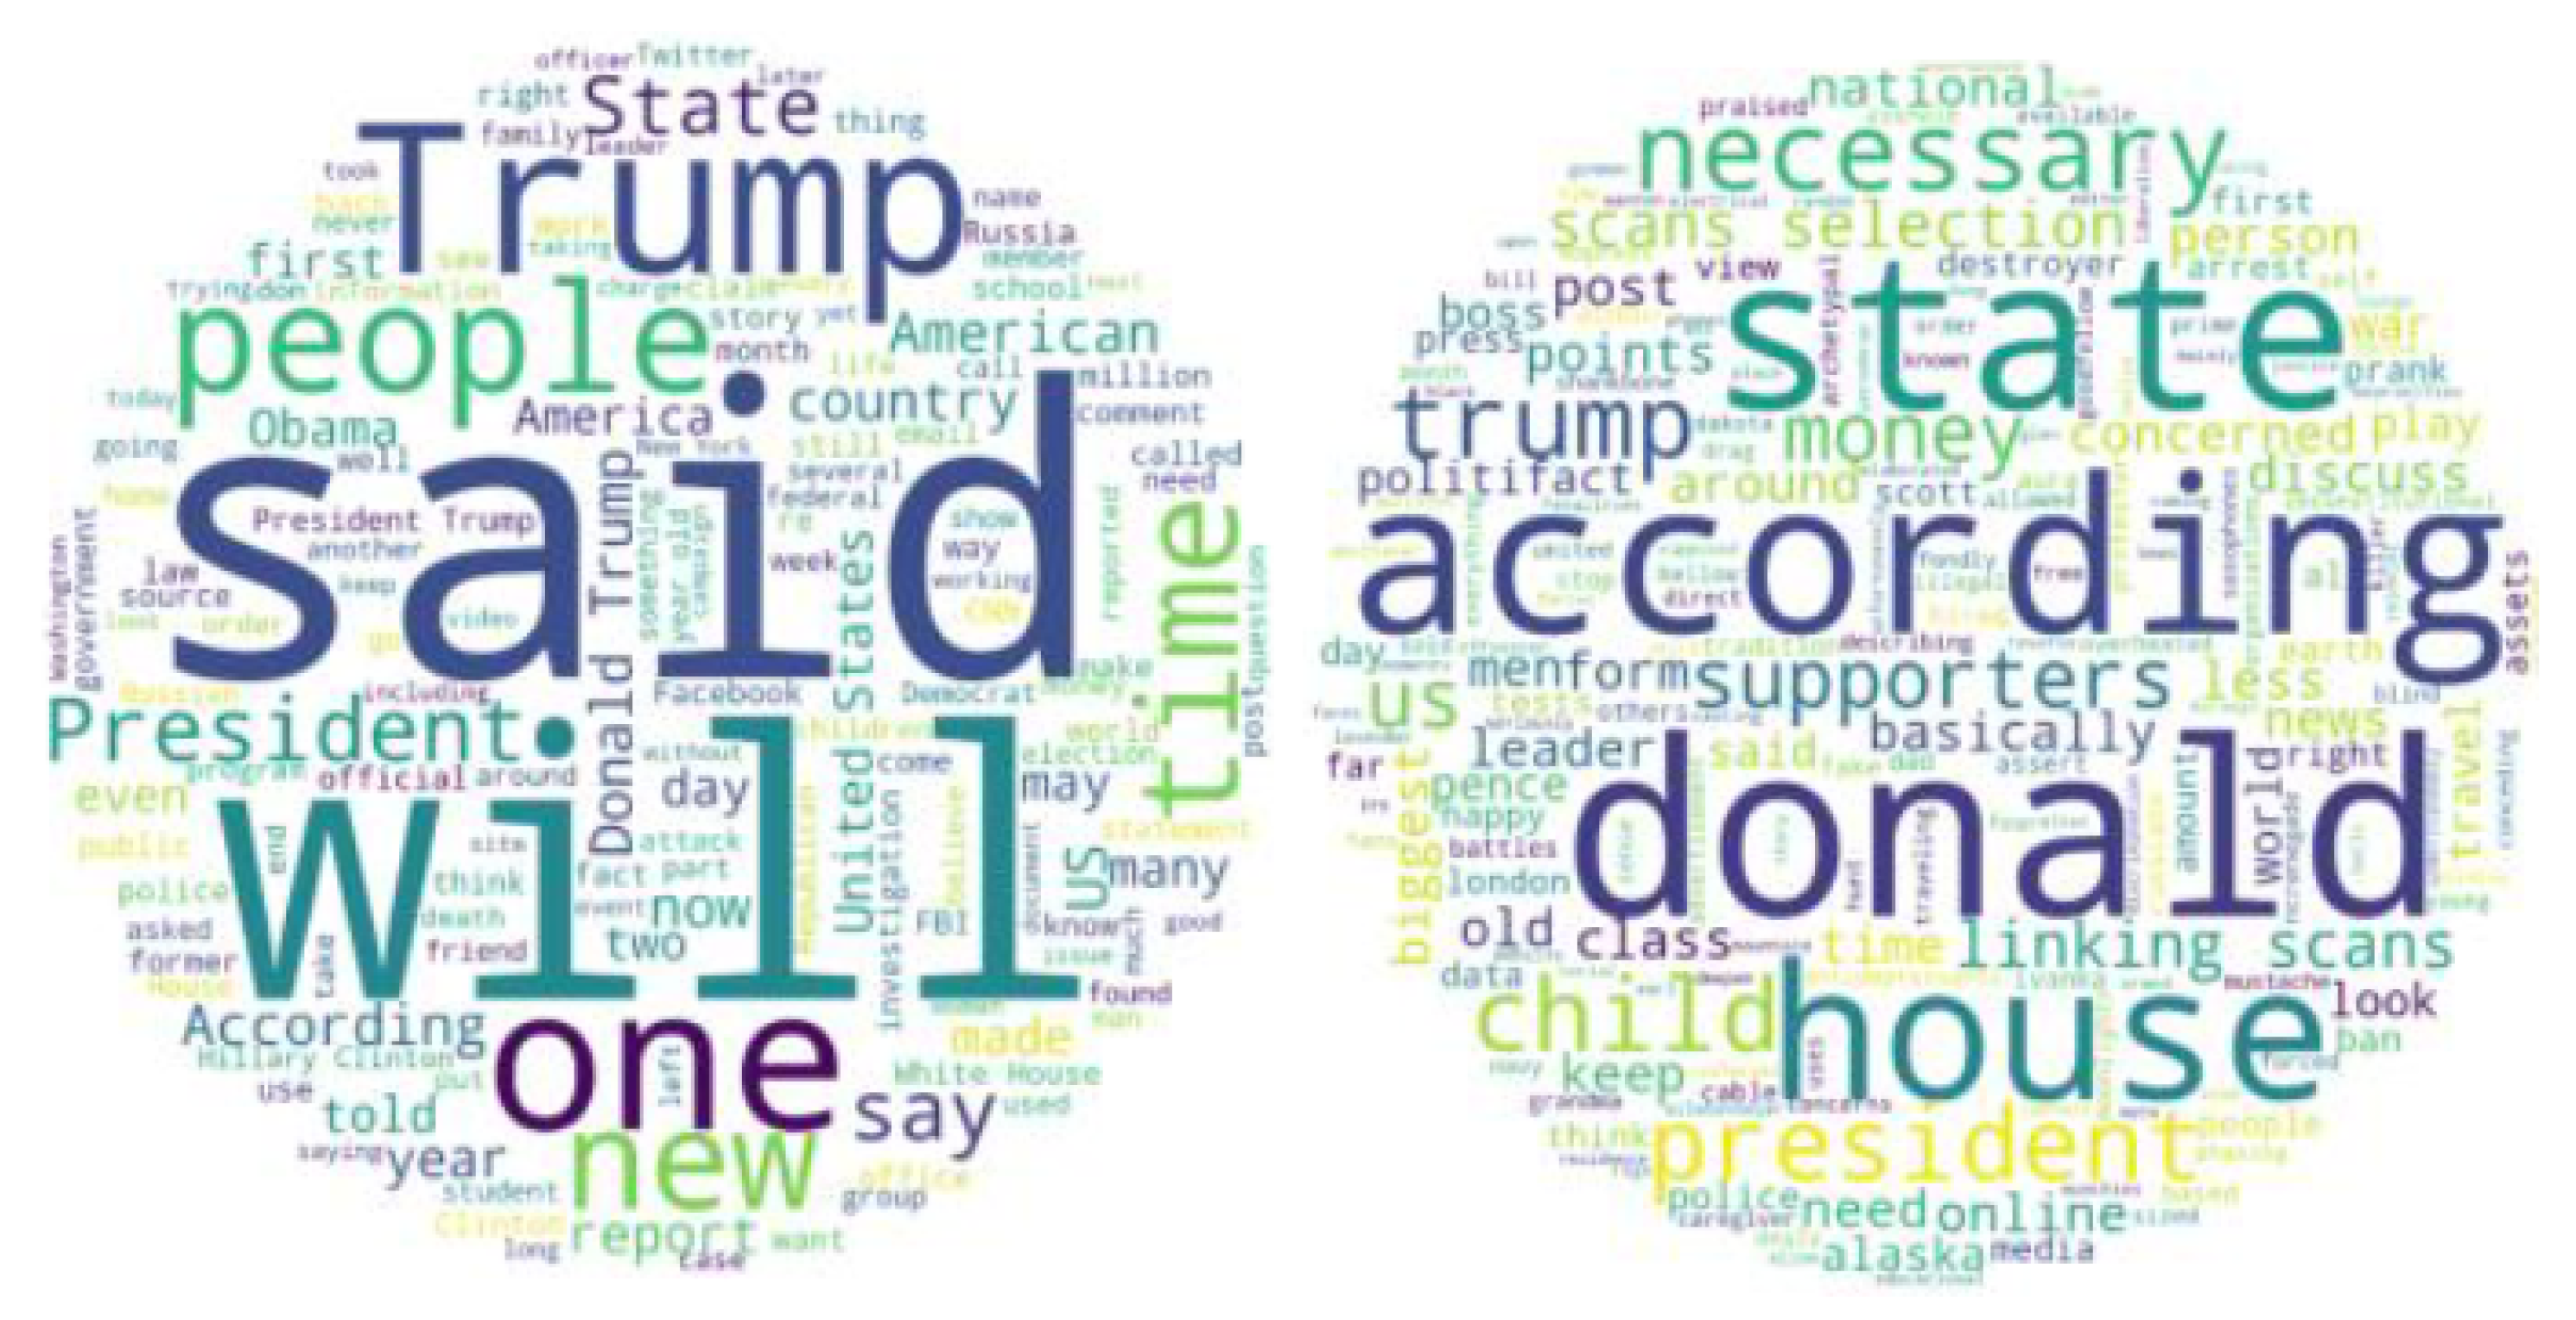
Table 2 is the statistics for text data, and
Figure 6 visualizes the word cloud of news content via term frequency and TF-IDF analysis respectively. From the figures, we can observe that many journalistic words and phrases are used, and many other terms depicted in the word cloud are related to politics.
As for social network aspect,
Table 3 lists the structural properties of social networks constructed from the tweet cascade in the dataset. The minimum and median values of node number and degree centrality indicate that the following relationship among users adheres to a power law, which is a common phenomenon in social media.
In the next subsection, we will introduce the metrics to evaluate the performance of predicting cascade sizes of source tweets.
5.2. Evaluation Settings
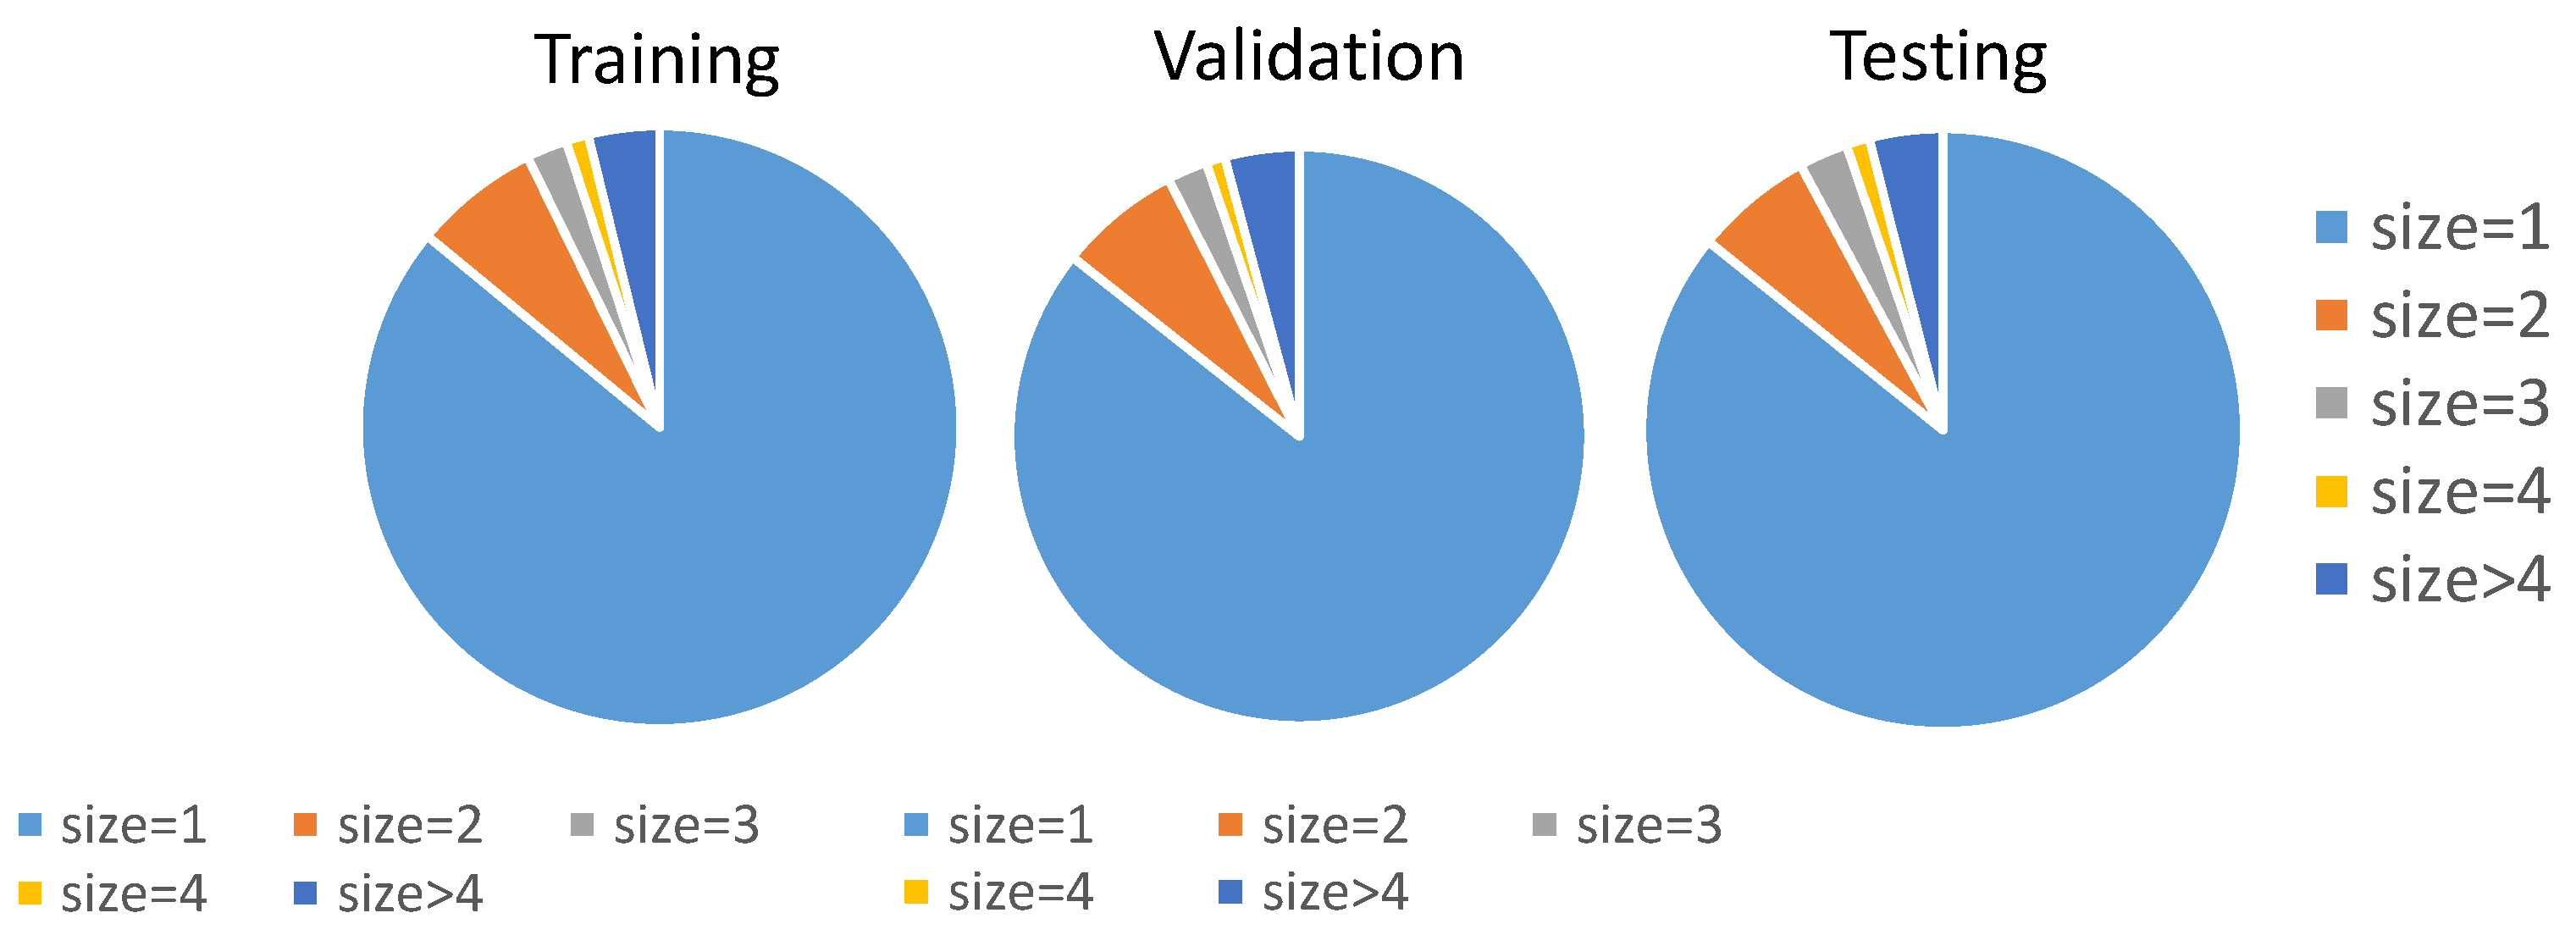
We split the whole dataset into a training set, cross-validation set, and testing set. Each example in these sets represents a cascade caused by a source tweet.
Figure 7 illustrates that the distribution of labels (i.e., cascade size) of the split dataset are similar. One thing worth mentioning is that over 90 percent of cascades have a cascade size under 3. The skewed distribution of labels makes it challenging to capture the characteristics of cascades having large sizes, which are more important to our research.
Some works of information cascade prediction employ regression metrics to evaluate the performance of their proposed models [
1,
47]. However, in real-life situations, knowing which tweet will have a relatively larger cascade size than other tweets is more crucial than knowing every tweet’s actual cascade size, especially for the use of fake news influence prediction. Therefore, to evaluate the performance of predicting the cascade size of those popular source tweets, we adopt evaluation metrics that are commonly used for ranking problems: Normalized Discounted Cumulative Gain (NDCG) and hit rate. Both metrics are applied to top-K largest cascades since we only pay attention to those fake news tweets which are most retweeted in real-life scenarios. Here we set values of the top-K to be top-1%, top-5%, top-10% and top-15% due to the cascade size distribution shown in
Figure 7.
5.3. Prediction Performance
To answer EQ1, in this section, we will compare MUFFLE with several approaches on predicting cascade sizes of source tweets sharing fake news on social media.
5.3.1. Baselines
We select methods from the following categories as competing methods: (1) statistical approaches, (2) feature-based approaches, and (3) deep learning-based approaches. For the deep learning category, we select the state-of-the-art method CasCN [
47] as a strong baseline. For a feature-based model, we choose XGBoost [
60] as another competing method. Furthermore, we use the historical mean and historical median as the statistical approach to be compared with our methods. The split training set, cross-validation set, and testing set are fixed for all competing methods. The above-mentioned baselines and their implementation details are as follows:
Statistics: For the historical mean and historical median, we calculate the mean value and median value of cascade sizes of training sets, respectively, and use their values as the prediction results in testing set.
Feature-based: We choose XGBoost as the feature-based baseline. XGBoost is an end-to-end tree boosting system that is used widely by data scientists to achieve state-of-the-art results on many machine learning challenges [
60]. The features we feed into XGBoost are those statistical features that are also used in each component of our proposed framework MUFFLE. For example, we retrieve the number of followers of the source tweet user from the user profile, the average retweet numbers from user timelines, and node numbers from the social network structure. The detailed list of features can be found in the paragraphs on data preprocessing from each sub-section in
Section 4. However, due to the limitation of model architecture, features not in numerical or Boolean form, such as news text or social network graph series, are not able to feed into XGBoost.
Deep Learning-based: This type of approach is inspired by the recent successes of deep learning in many fields, and cascade prediction using deep neural networks has achieved significant improvement in performance. We choose a state-of-art method CasCN [
47] to be our strong competitor. CasCN is a semi-supervised method that explicitly models and predicts cascades through learning the latent representation of both structural and temporal information, without involving any other features. Specifically, CasCN samples a cascade graph sequence from an information cascade and learns the local structures of each cascade by graph convolutional operations. The convoluted spatial structures are then fed into a recurrent neural network for training and capturing the evolving process of a cascade structure.
5.3.2. Comparison Result
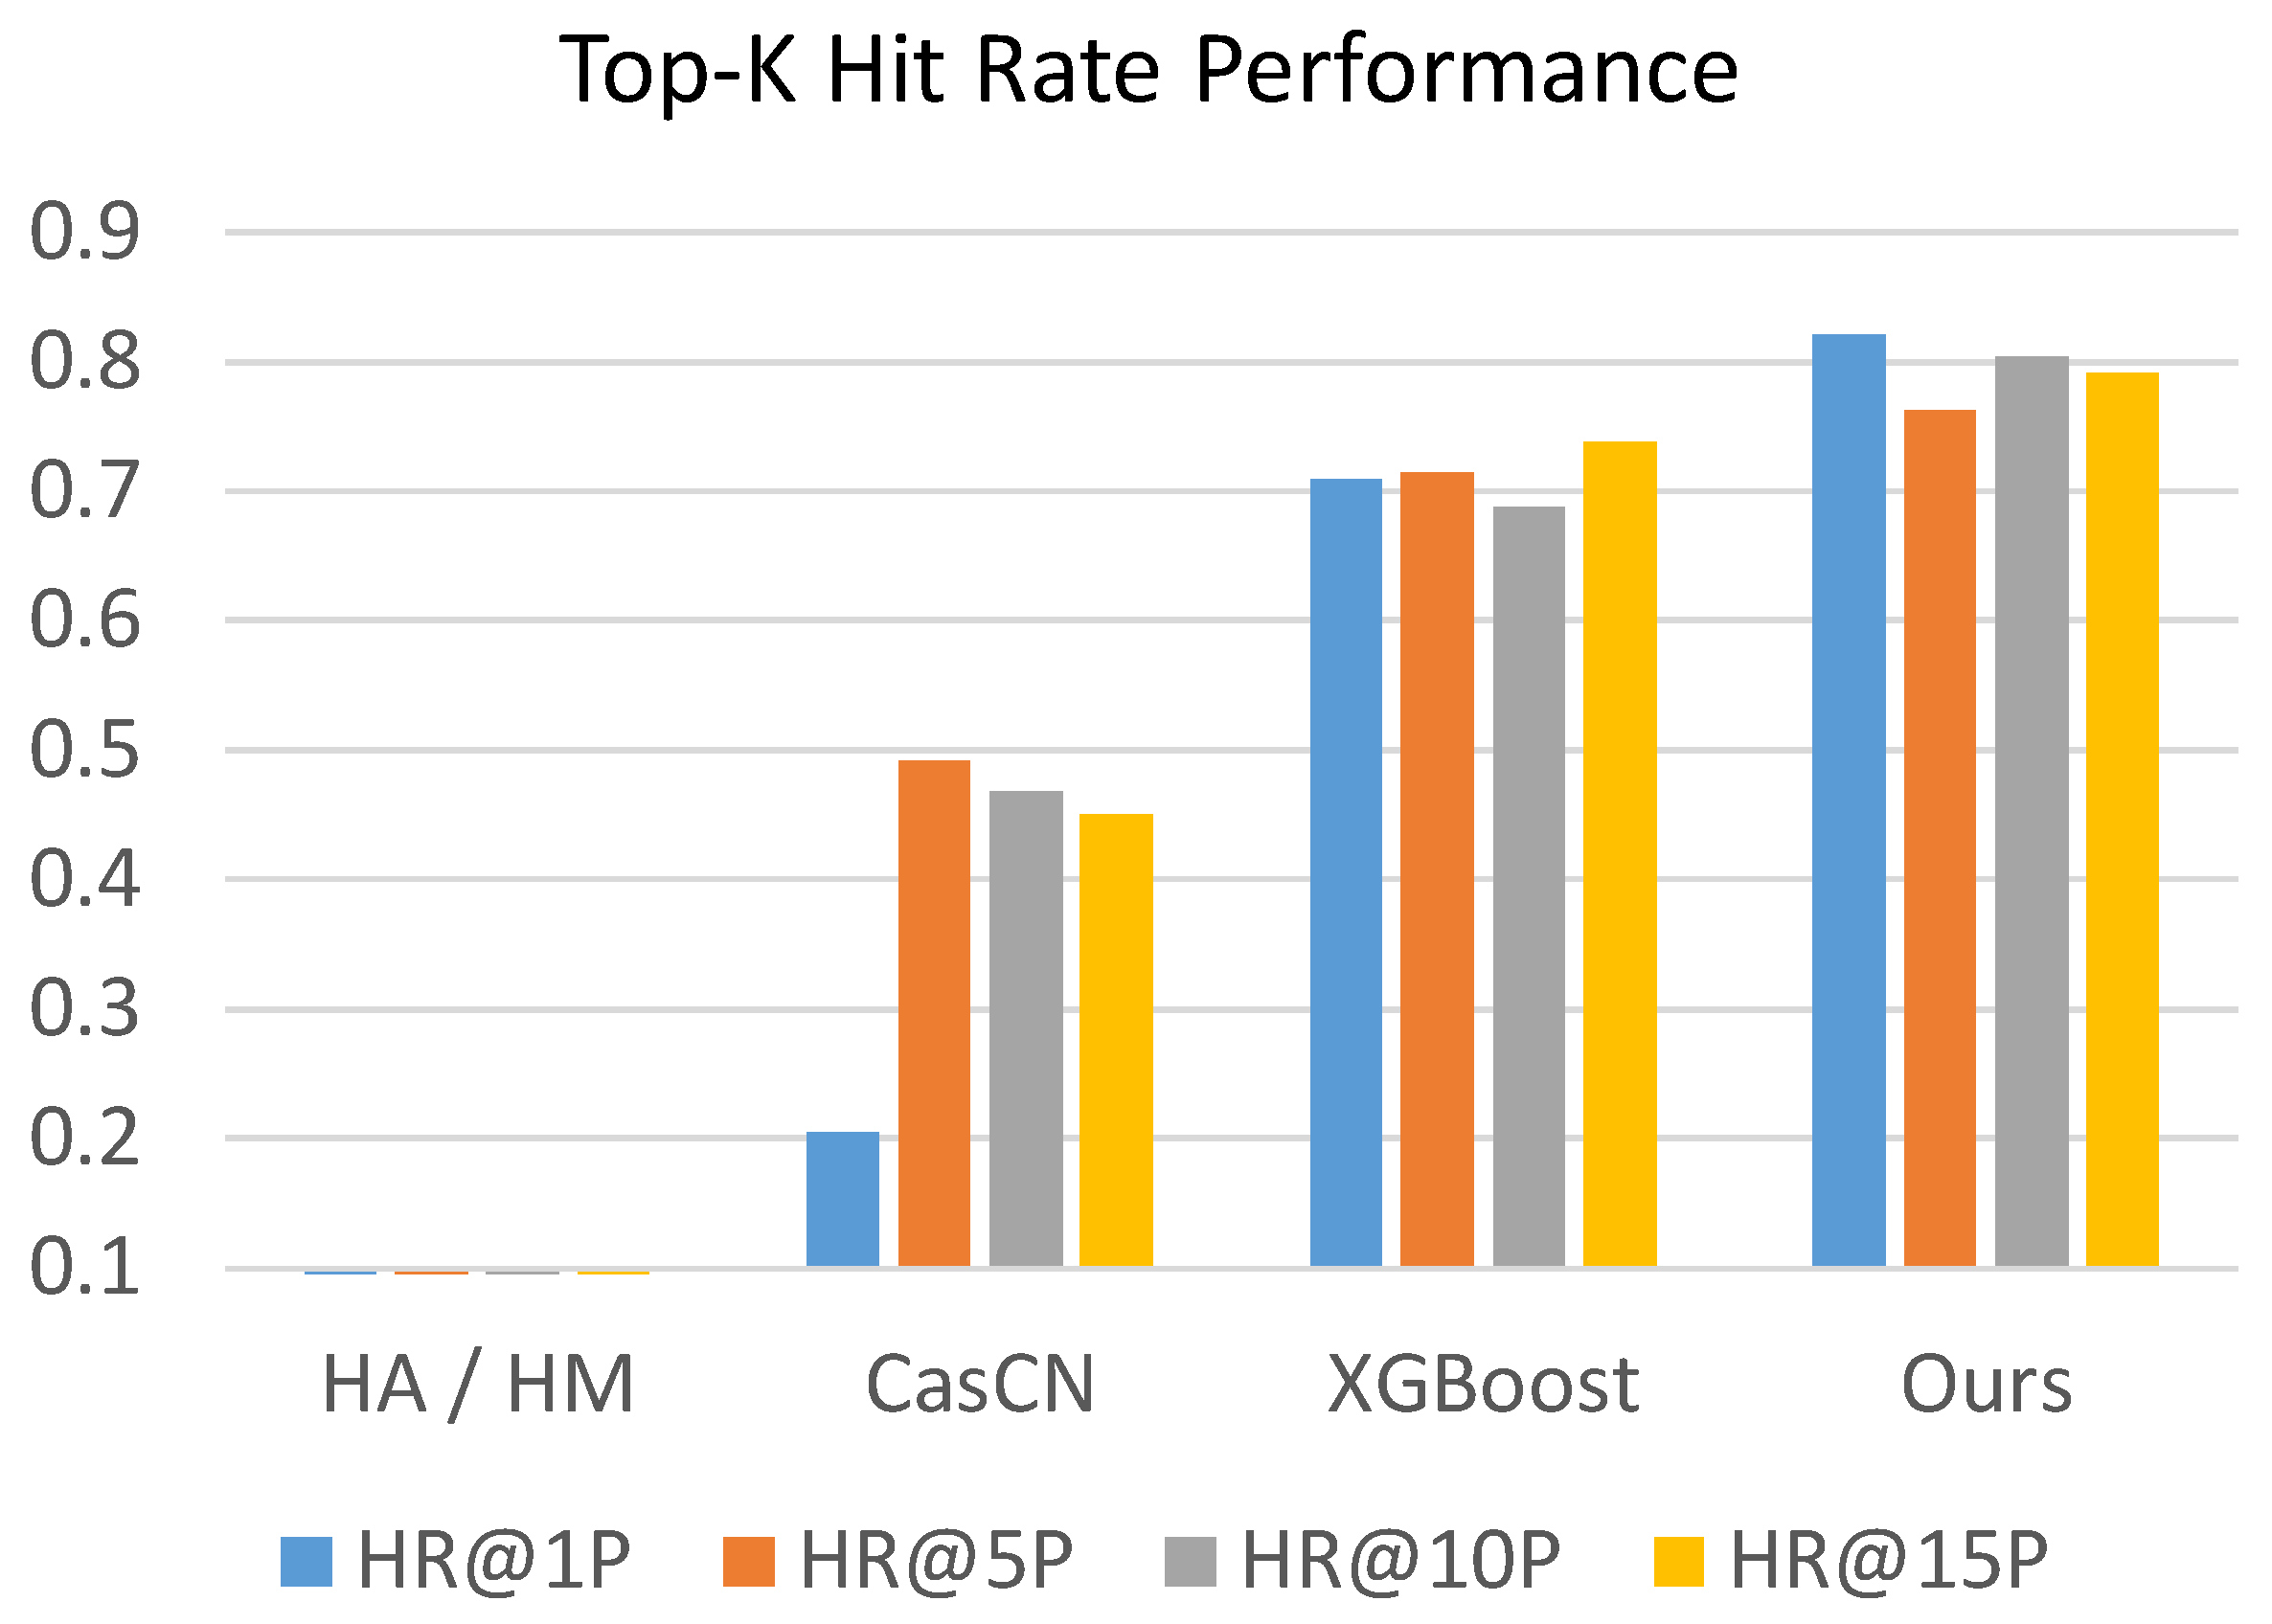
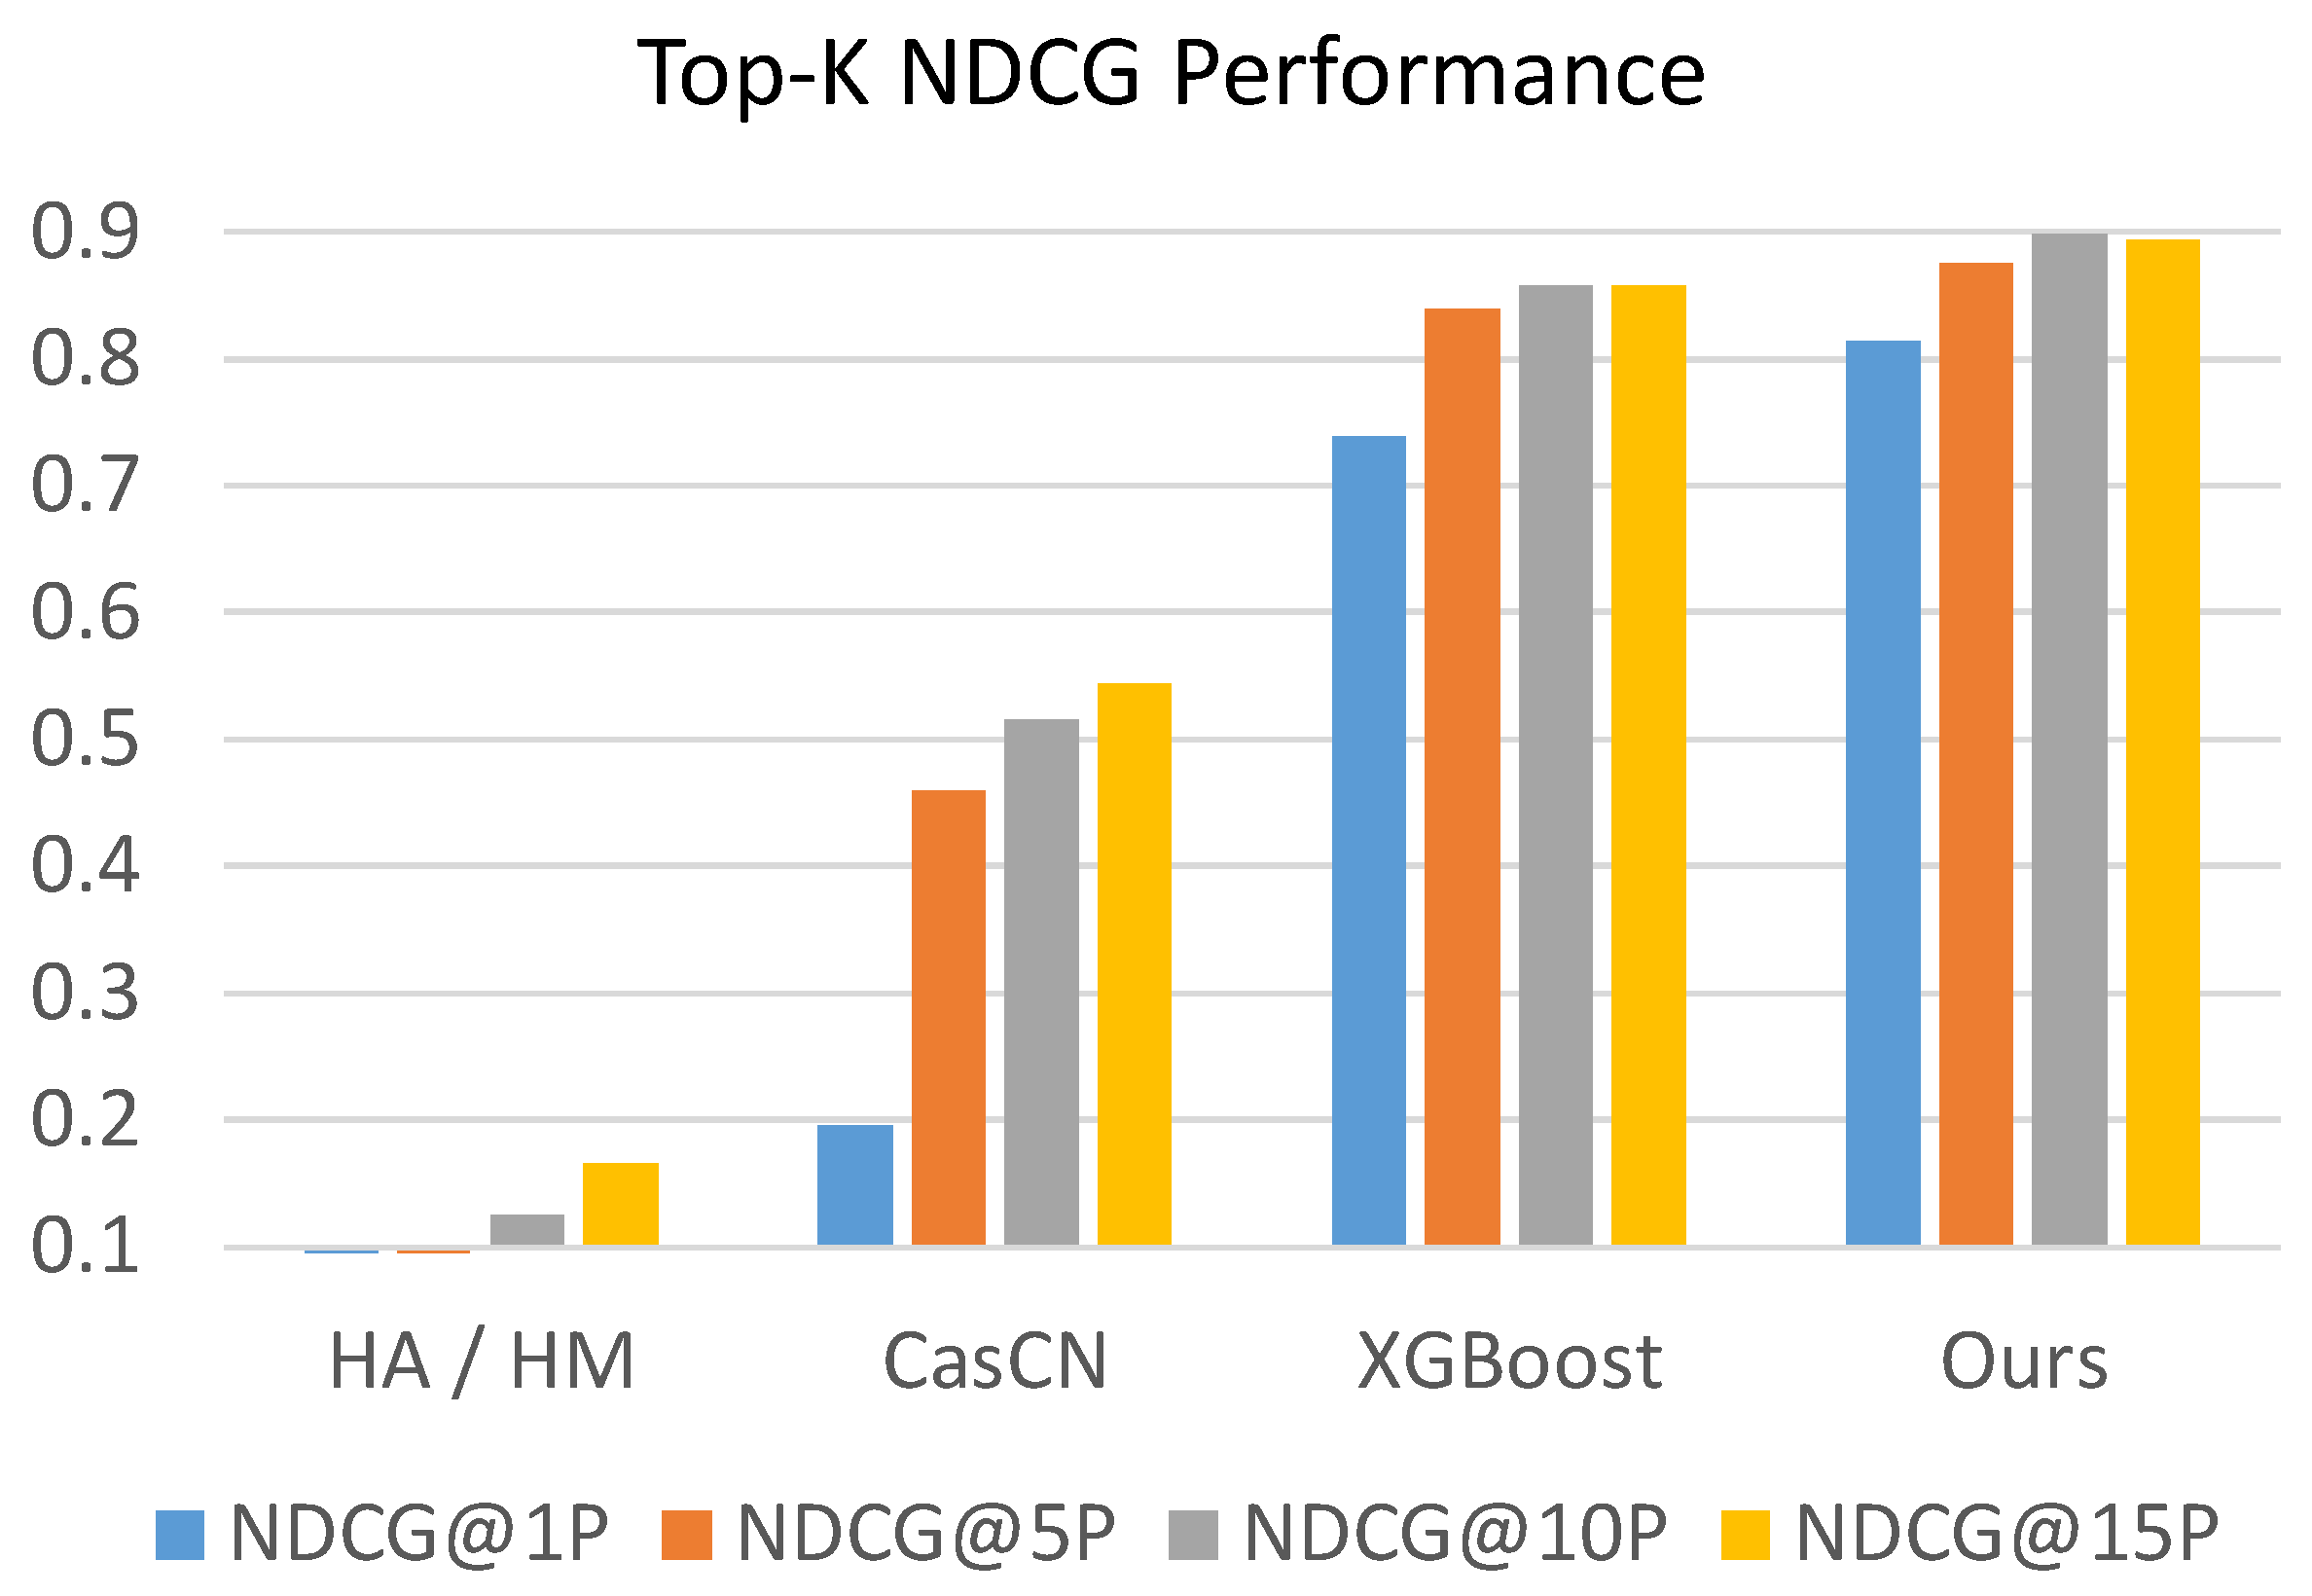
The values of evaluation metrics of competing methods and our proposed MUFFLE are shown in
Table 4 and
Figure 8 and
Figure 9. The result shows that MUFFLE is able to achieve a relatively robust performance at metrics of hit rate and NDCG. It also indicates that our methods is accomplished in both ranking the popularity of posts and detecting the source tweets that will be retweeted massively in the future.
Generally, the evaluation result shows that MUFFLE outperforms other comparative methods (MUFFLE > XGBoost > CasCN > Statistical approaches) in terms of hit rate and NDCG. Feature-based approach XGBoost models the multi-modal properties which are extracted from statistical perspectives; however, it ignores the dynamic information which is implicitly stored in social networks with the structural and temporal characteristics.
On the other hand, CasCN captures the dynamic trend by modeling cascade graphs sequence within an observation time window, but it does not consider social contexts such as user profile and user’s historical tweets, which provide rich clues in inferring an account’s influence on a social media platform. While methods of historical mean and historical median perform extremely poorly at metrics for ranking, they perform well on MSE and MAE respectively because of the power-law distribution of cascade sizes in the dataset. For example, approximately 86% of source tweets have a cascade size equal to 1 in both the training set and testing set; i.e., the median of cascade sizes in the training set is 1 as well. Therefore, using the historical median to predict cascade sizes of source tweets tends to have a low absolute error.
5.4. Ablation Study
In our proposed framework MUFFLE, we capture information from various domains such as social context and text content, and we construct multiple components to model their representation. In order to answer EQ2, in this section, we investigate the effects of these components by evaluating the performance of several component combinations. The following abbreviations of individual components are defined for the sake of convenience:
SN: SN is short for the component of social network encoding. It models the social graphs converted from cascade network sequences, which are extracted in the source tweet’s observation time window. In addition to graph-structured data, the descriptive graph properties are fed into this component and concatenated with encoded graphs, and then the combined features are fed into attention layers and fully-connected layers for regression.
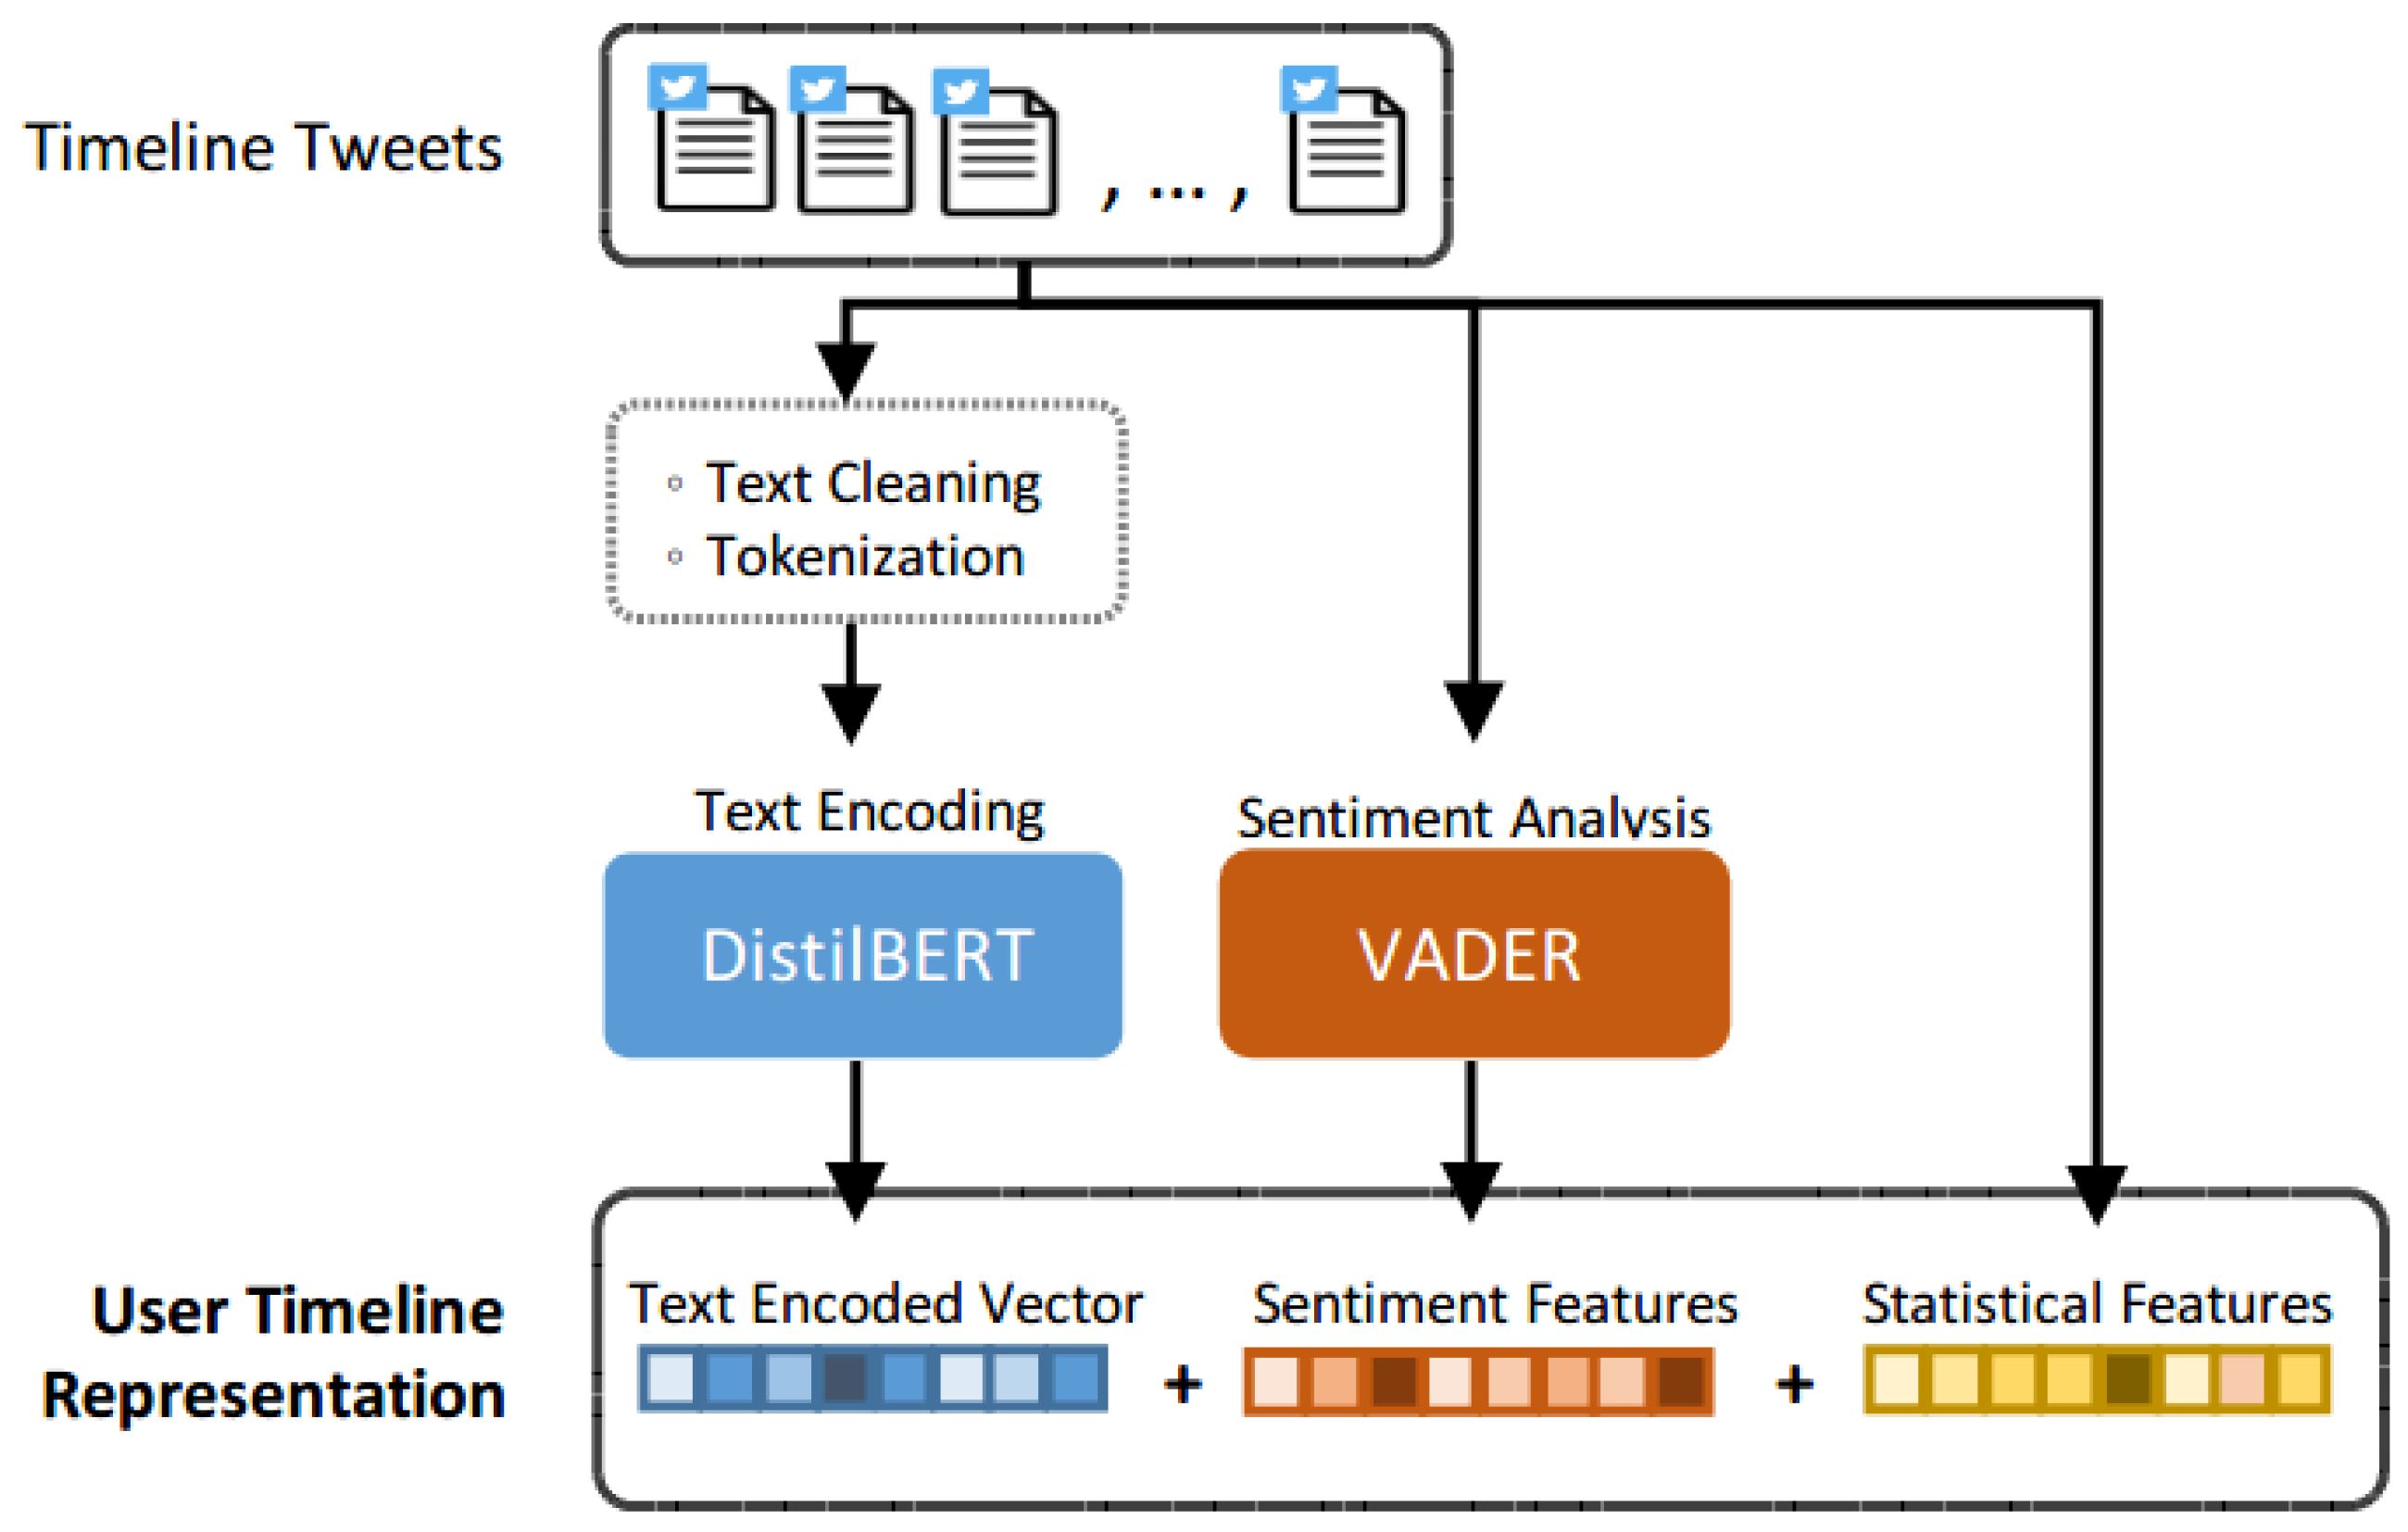
UT: UT is short for the component of user timeline representation. The input features contain aggregated user historical tweets, sentiment features, and statistical features. We use DistilBERT for text encoding and then concatenate encoded text and other numerical features to perform the regression task.
UP: UP is the abbreviation of user profile representation. In this component, we adopt numerical attributes from Twitter user profiles as well as textual self-descriptions. Similar to the process of UT, text data is encoded into numerical tensors by DistilBERT, and then we concatenate all features and feed them into attentive MLP to predict the cascade size.
ST: ST stands for source tweet encoding. We use DistilBERT to encode tweet content, news titles, as well as news content. Several types of features including sentiment features and temporal features are extracted from source tweet objects. The architecture of the model resembles UT and UP: using attention mechanism and FC layers to convert concatenated features into prediction.
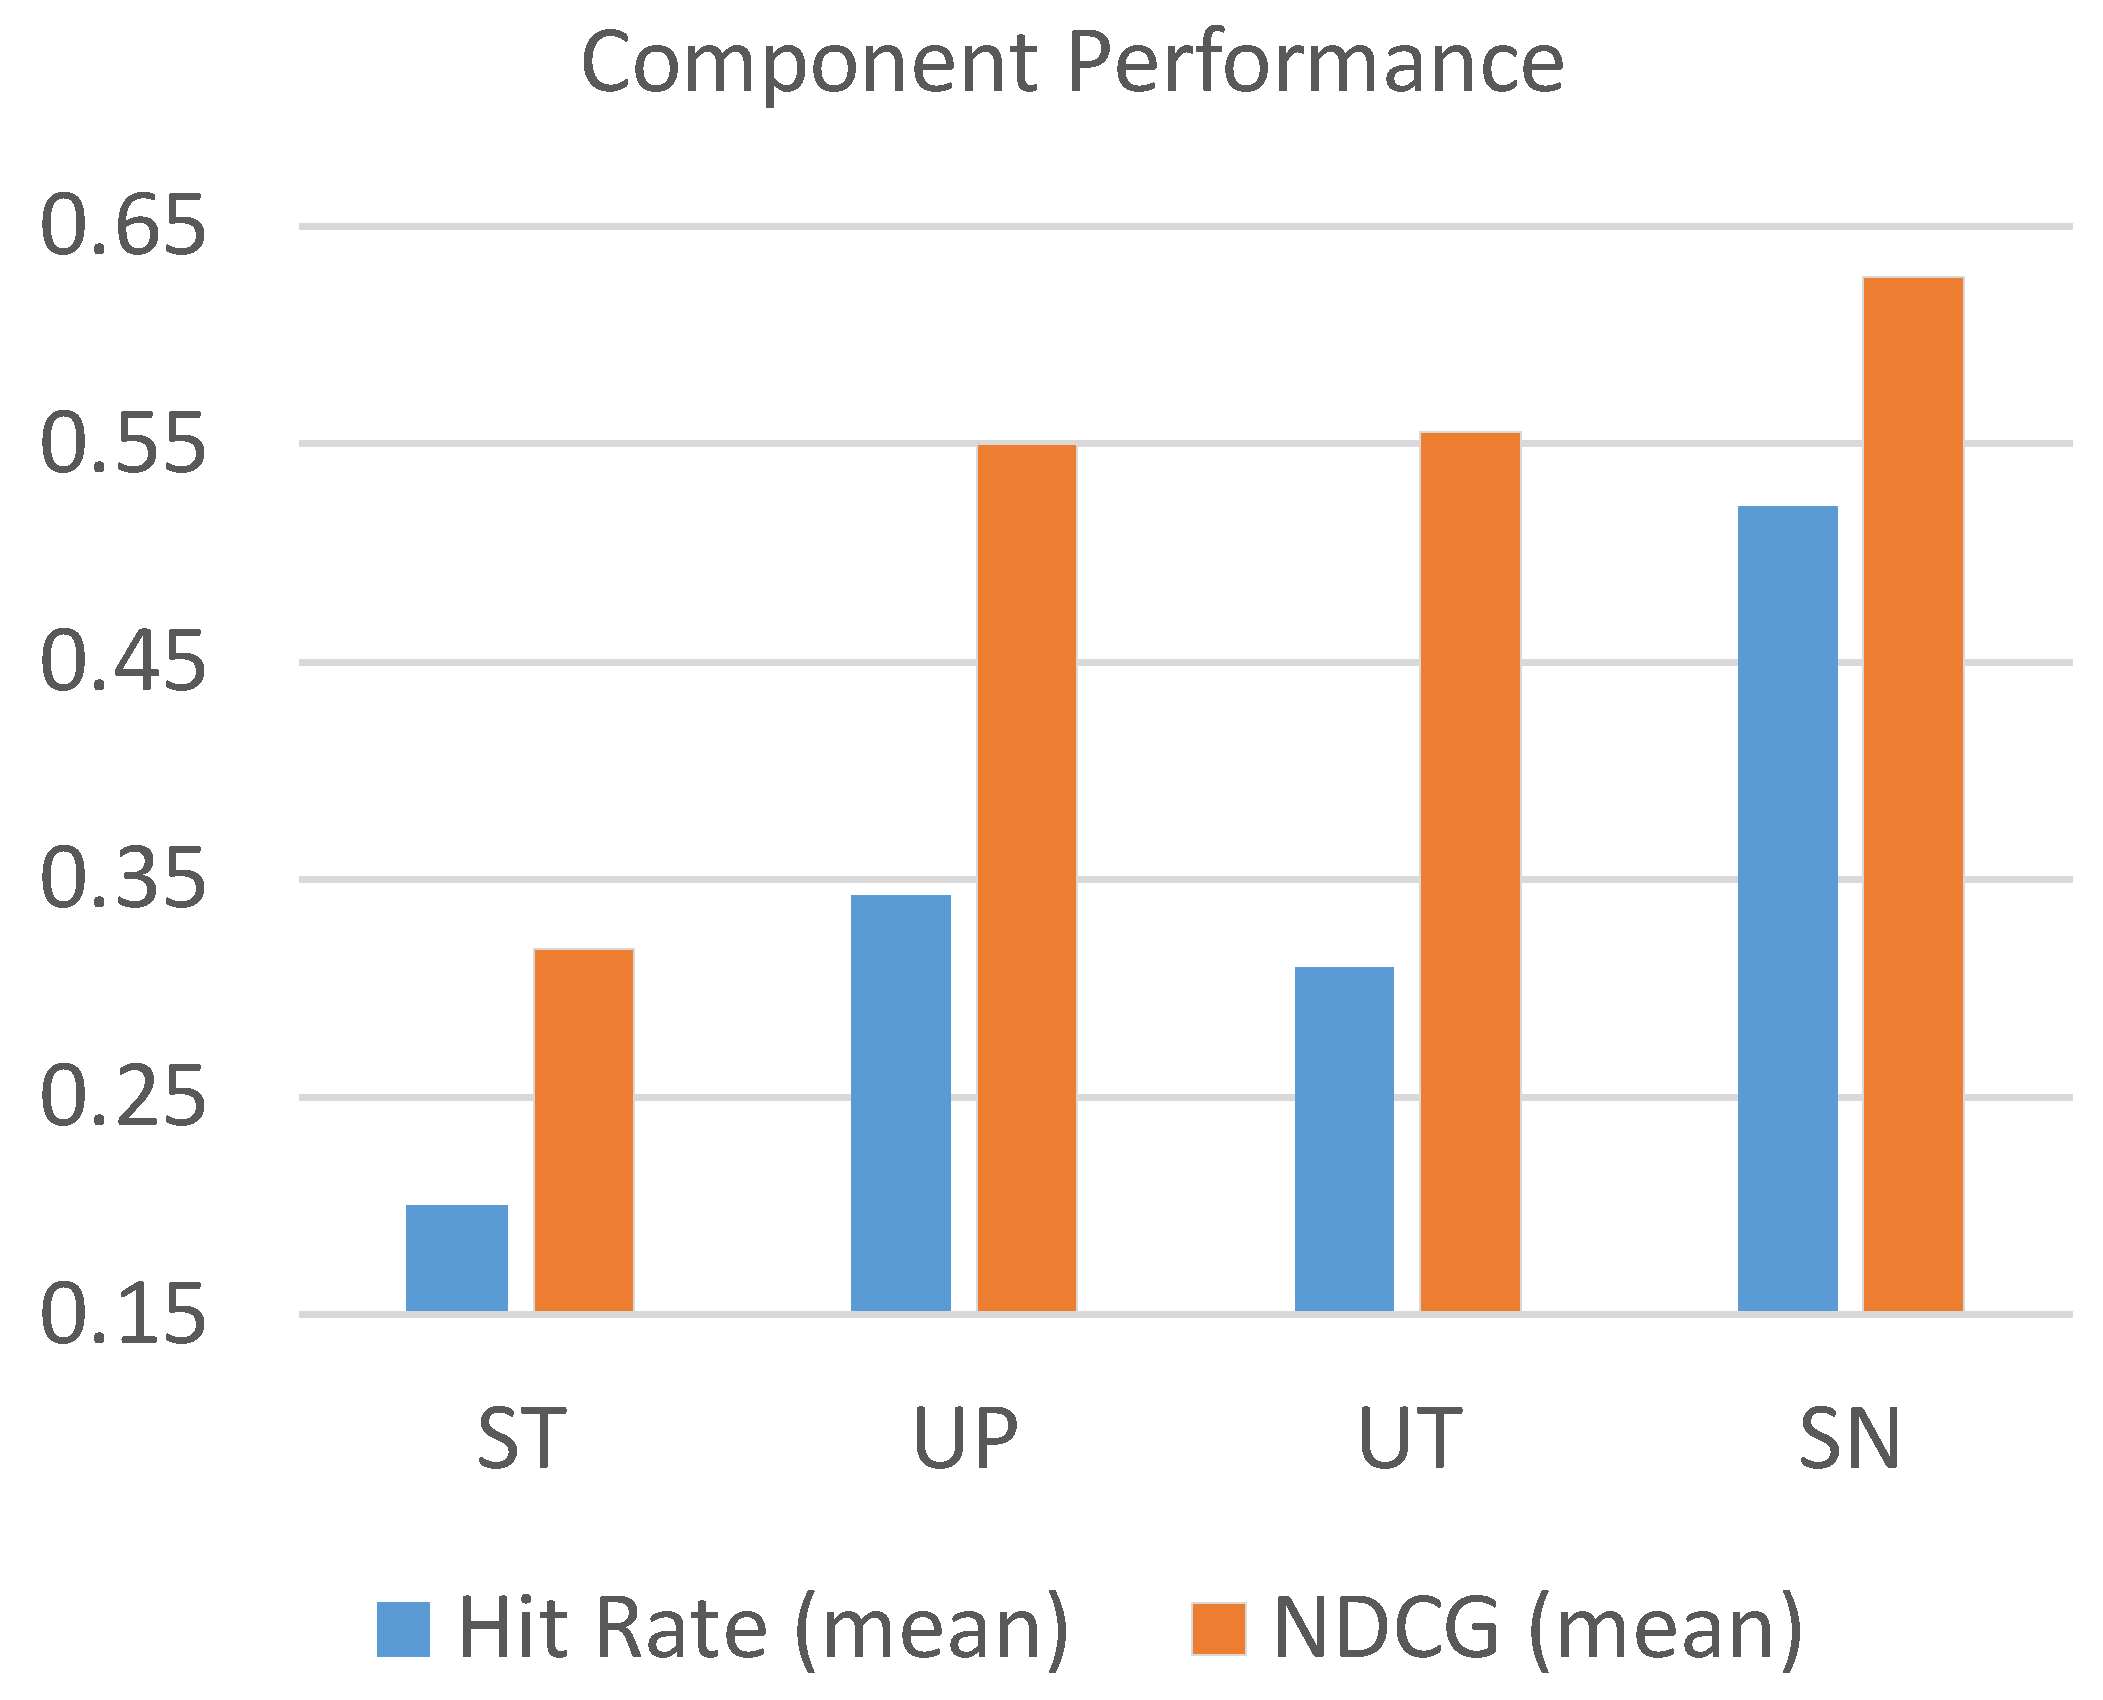
For each component, the parameters are determined with cross-validation and the best performance is reported in
Figure 10. The shown values of hit rate and NDCG are averaged from the performance of all “K”s for top-k largest cascades (i.e., top-1%, top-5%, top-10%, and top-15%).
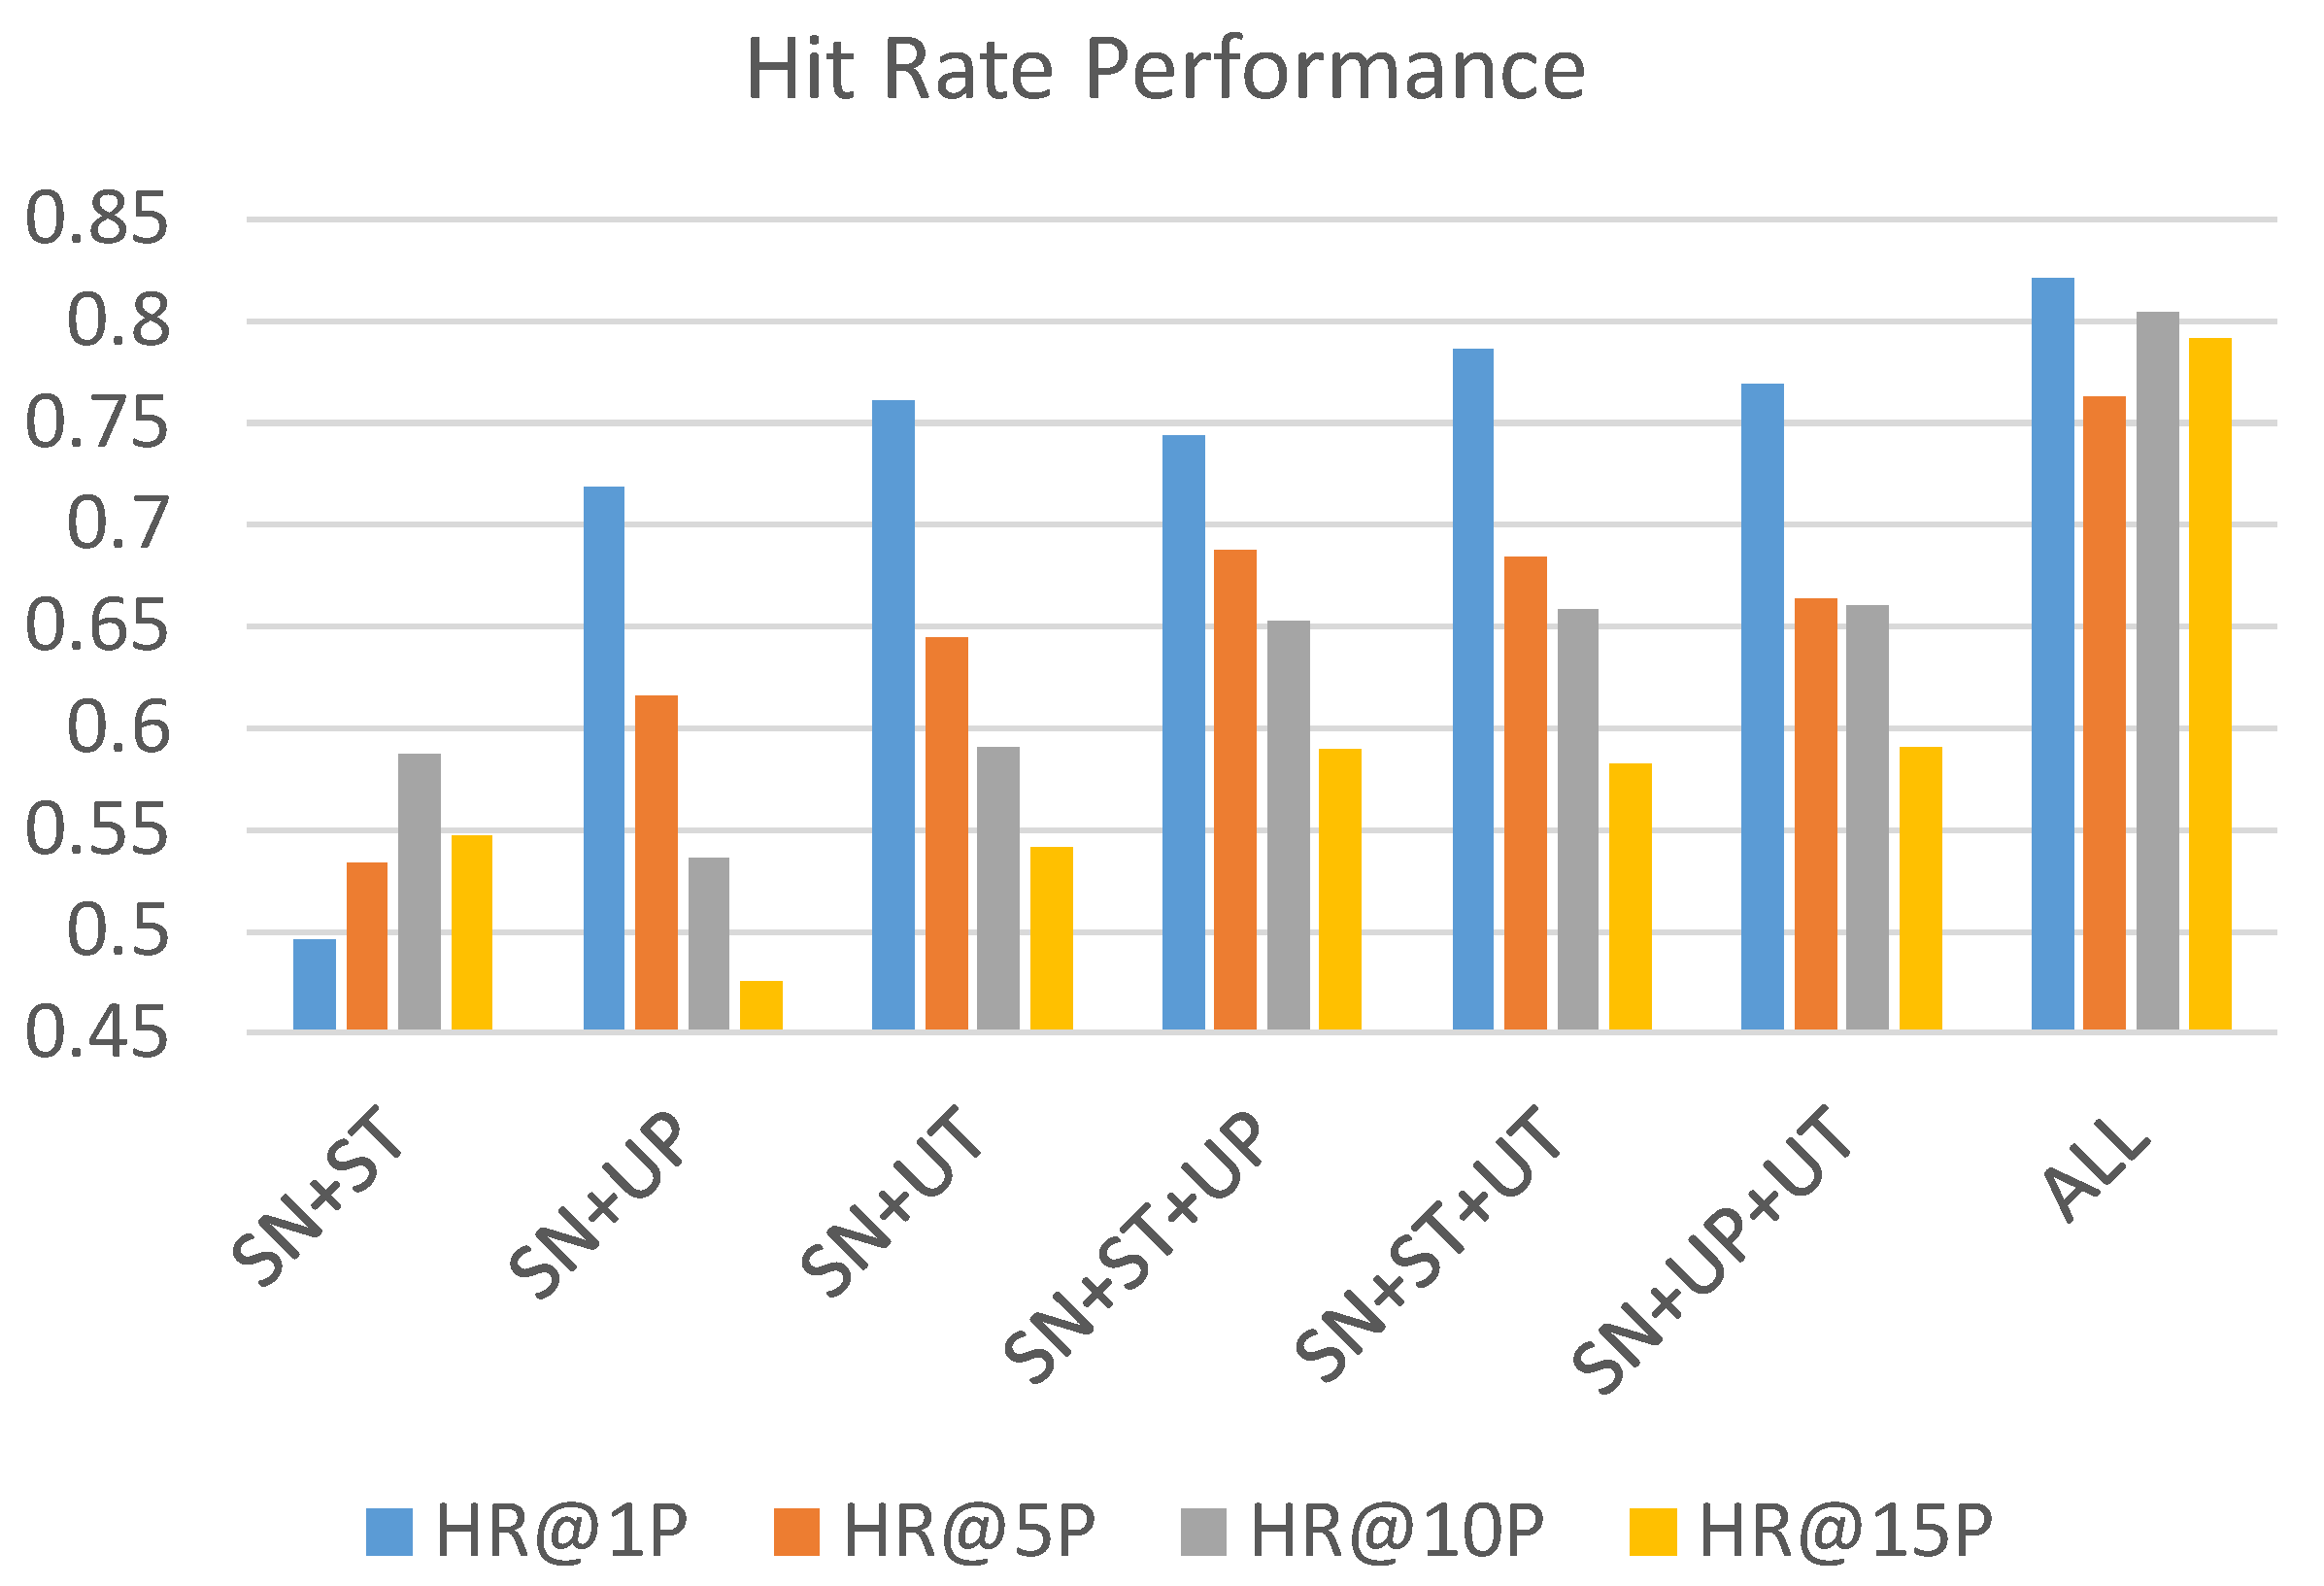
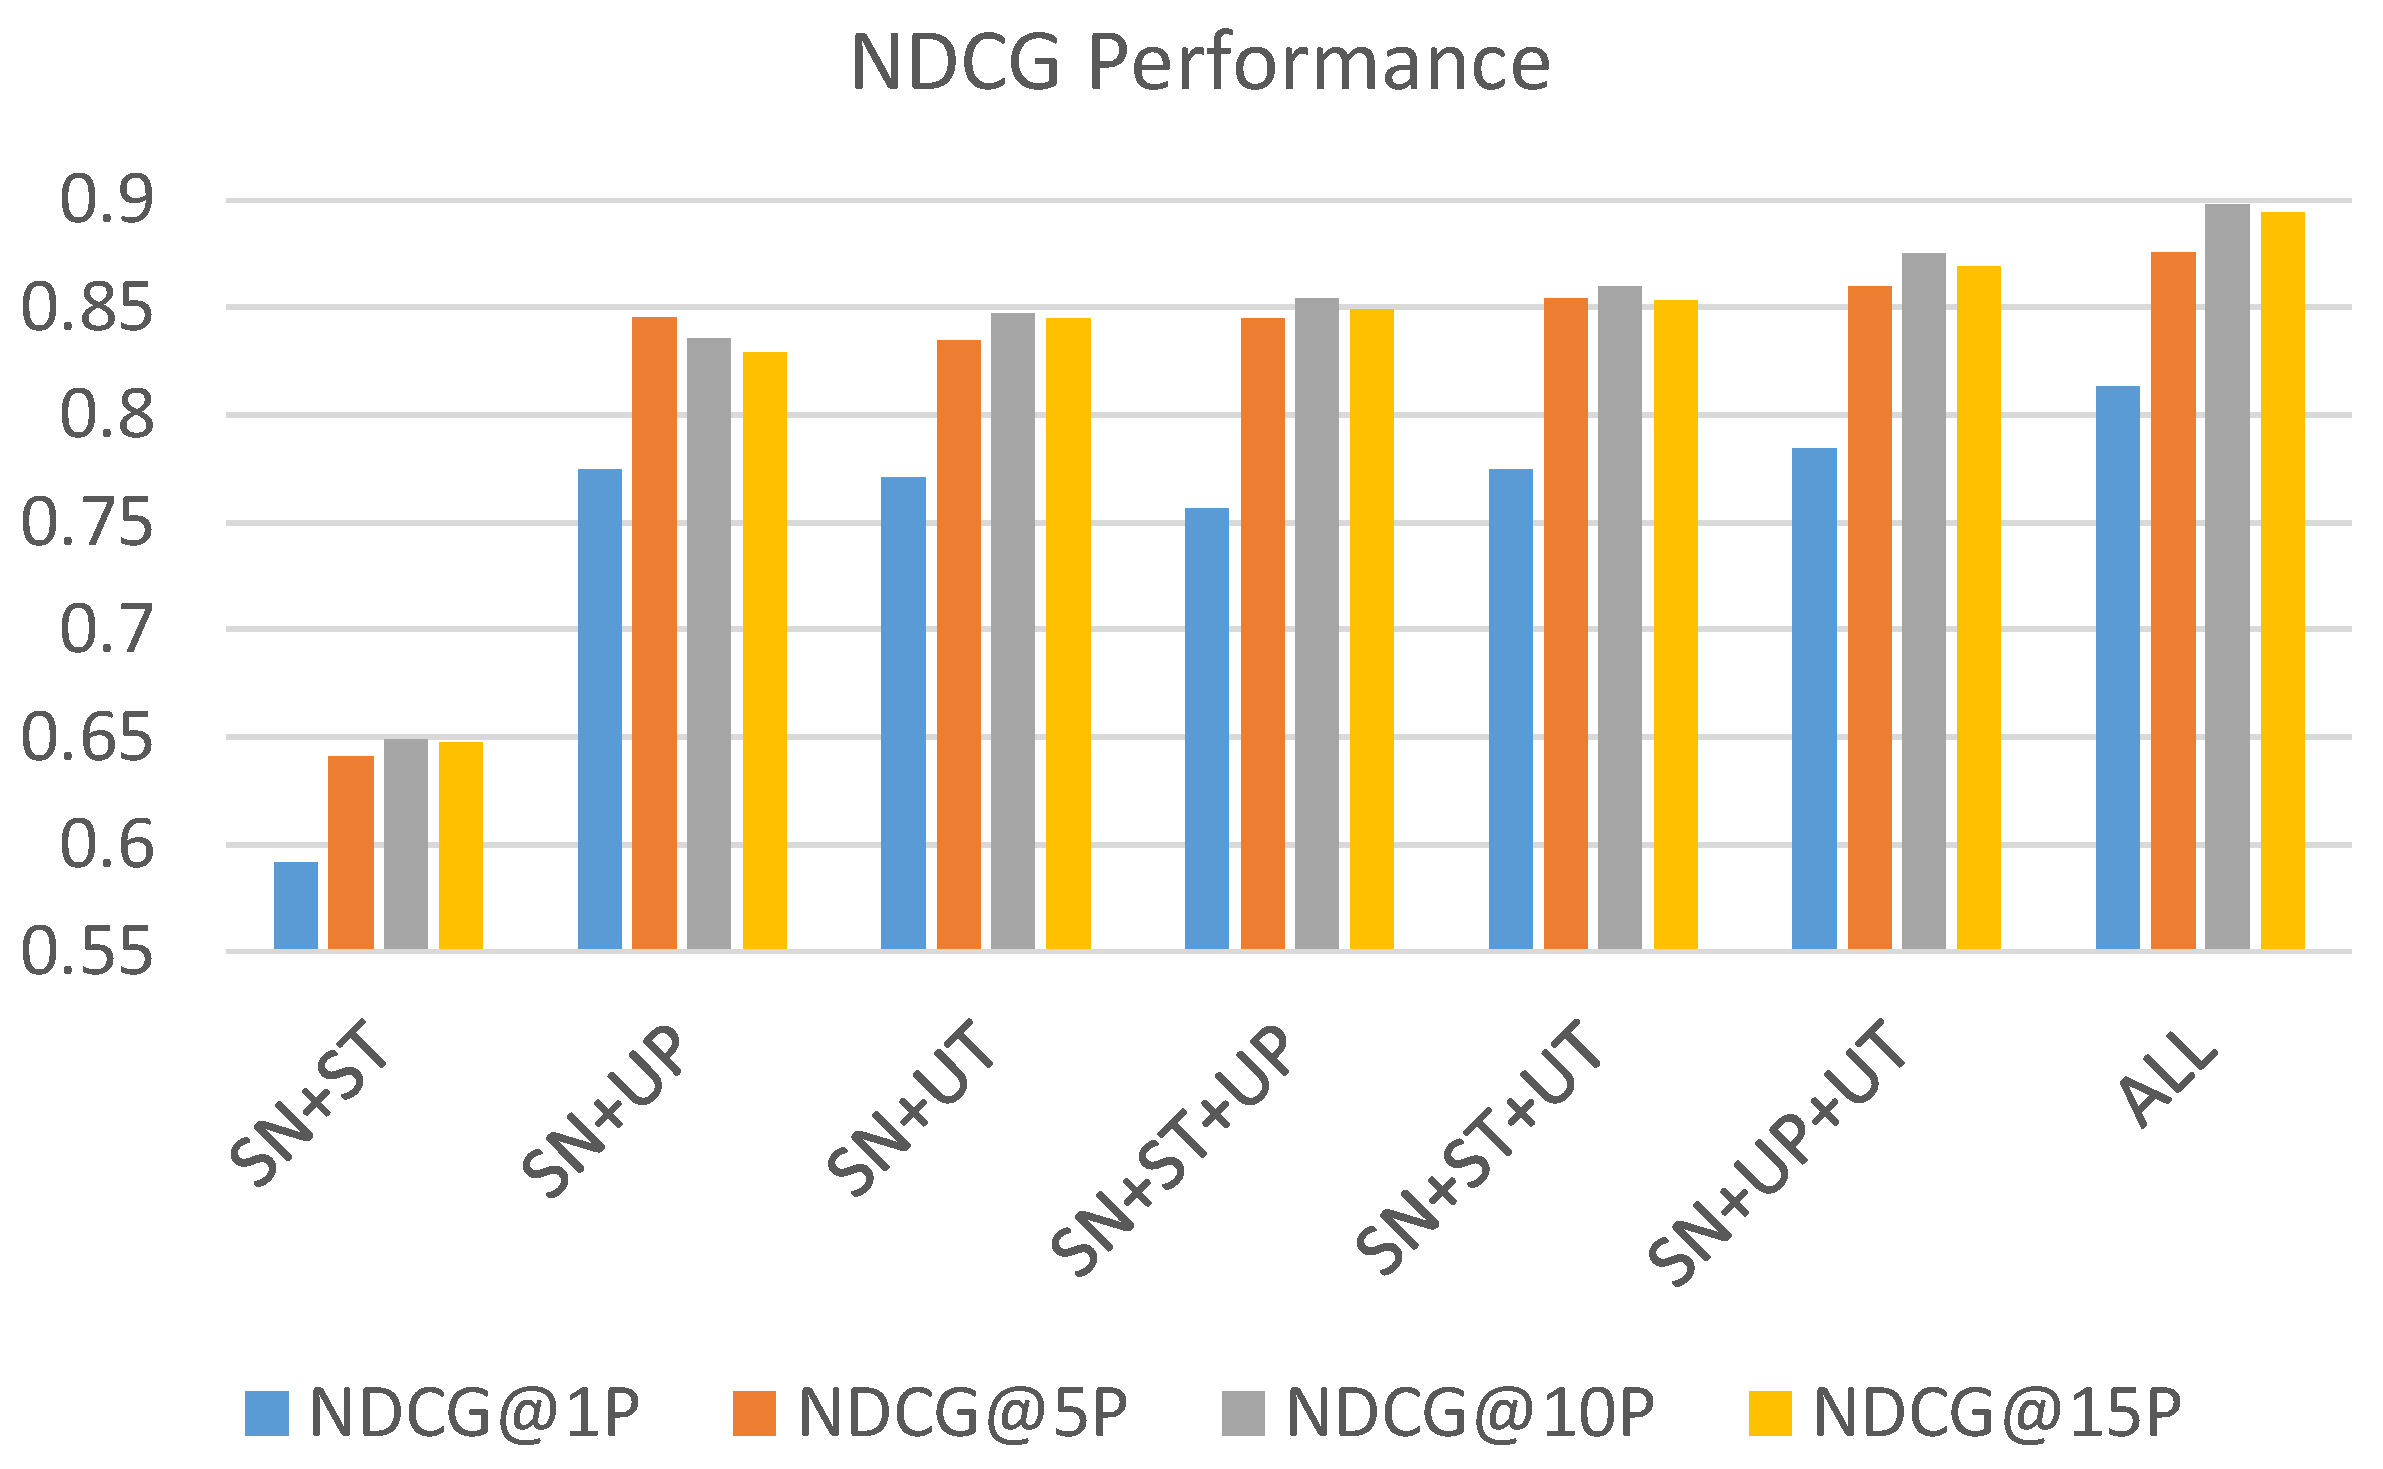
From the results, we observe that the social network component achieves the best accuracy, followed by the user profile component and user timeline component. The source tweet component contributes the least effort in prediction performance compared to the other three components. To examine the effect of each feature set, we further test the performance of each different component combination. Each combination uses SN as the base component and integrates with other components. The results are shown in
Table 5 and visualized in
Figure 11 and
Figure 12. We make the following observations:
While the source tweet component is the least effective in the individual performance comparison, the hit rate performance in
Figure 11 shows that the source tweet component still contributes to the improvement of accuracy from the comparison between SN + UP and SN + UP + ST, as well as the comparison between SN + UT and SN + UT + ST. Both pairs reveal that the integration with ST component increases the hit rate the most in the top 10% and top 15%.
From the opposite point of view, the component of UP and UT contribute to the hit rate mostly in the top 1% and top 5% when we look into the hit rate comparison between SN + ST and SN + ST + UT and comparison between SN + ST + UP.
From the performance comparison of both hit rate and NDCG, the combination of all components results in the best performance.
Through the component analysis of MUFFLE, we conclude that (1) all components of social context and textual data from fake news and tweets can contribute to improving the fake news influence prediction of MUFFLE; (2) it is necessary to model features from multiple domains because they contain complementary information.
5.5. Explainability and Case Study
In this subsection, to answer
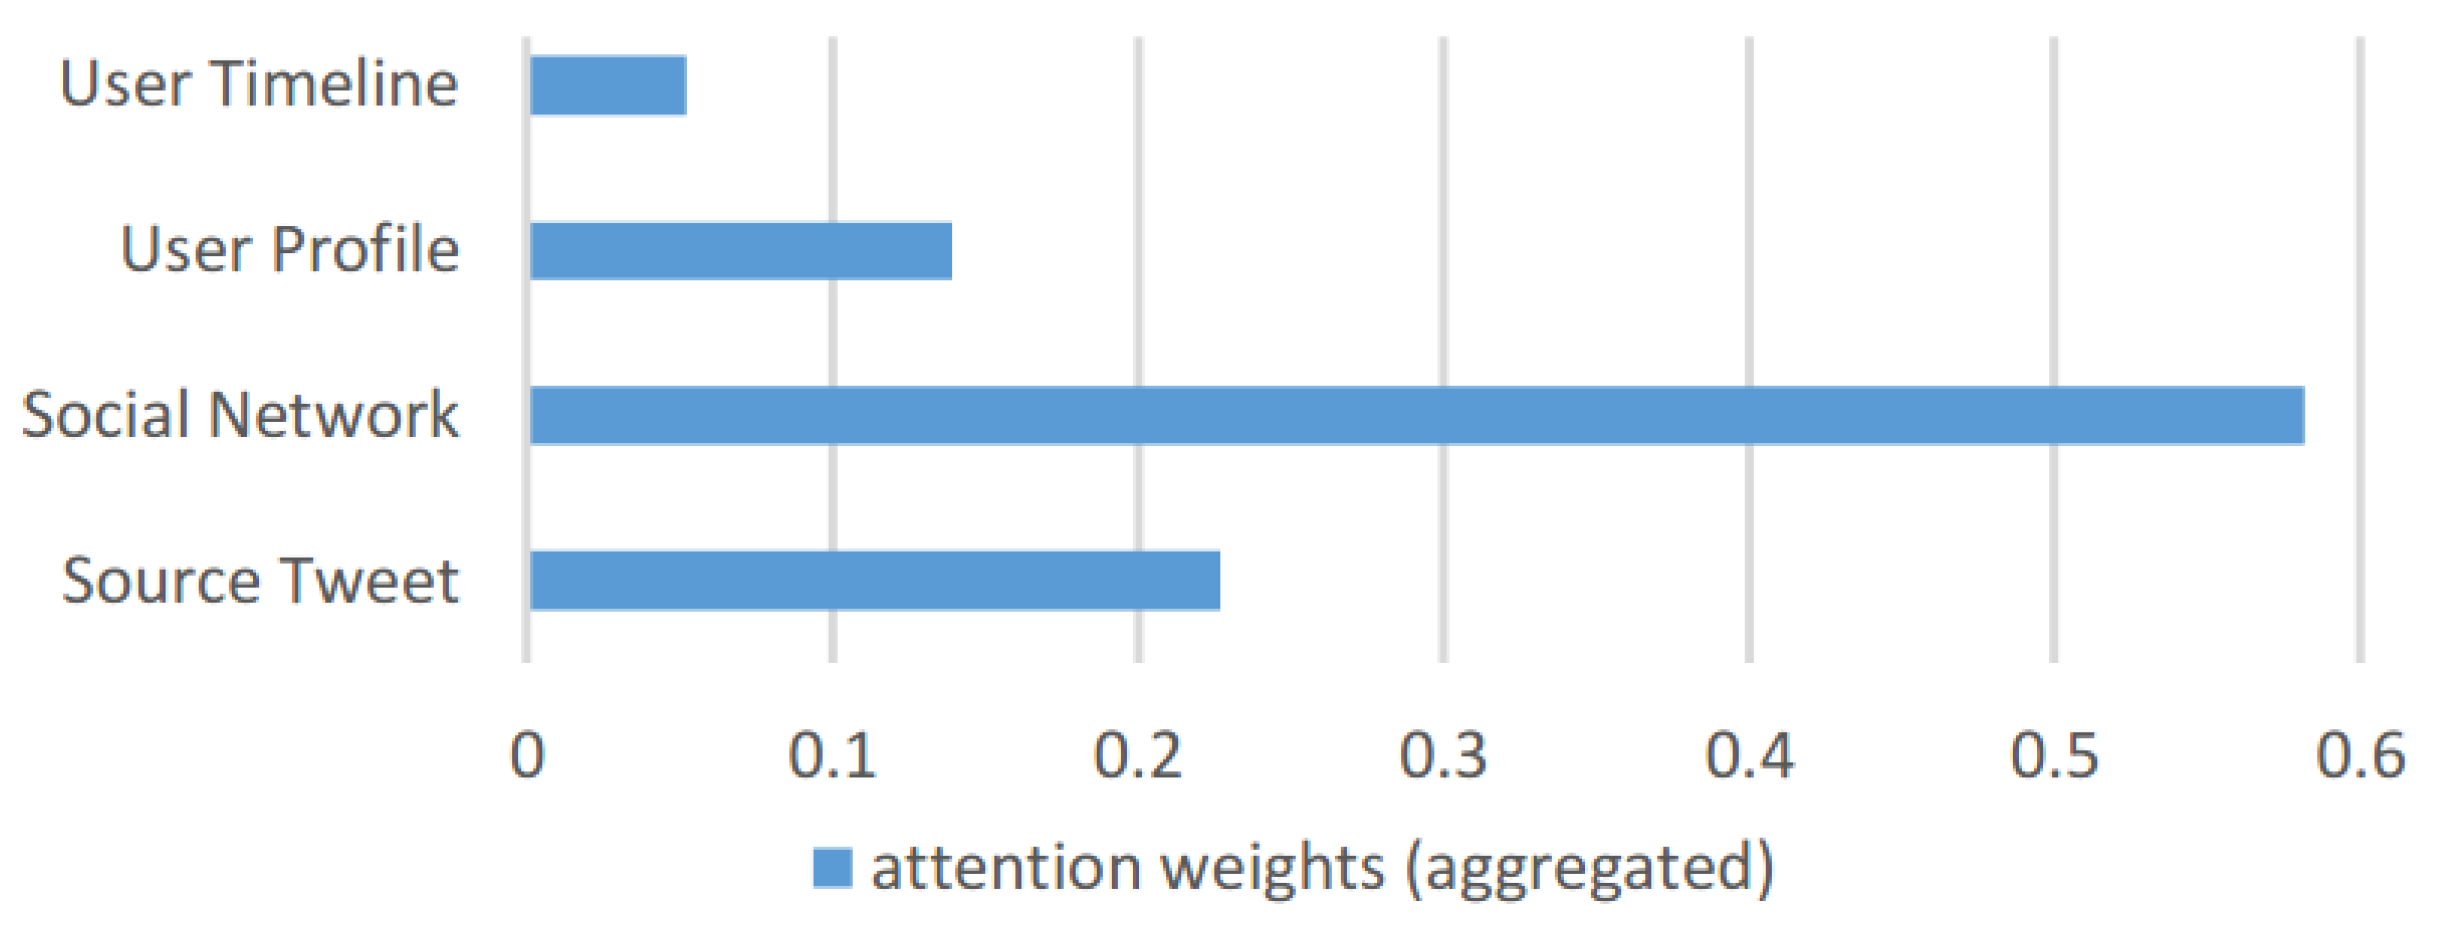
EQ3, we look into our proposed framework MUFFLE during the phase of evaluation for assessing the ability of model explainability. Specifically, we record the learned attention weights for all features while using MUFFLE to perform prediction on source tweet examples in the testing set. Each set of attention weights is stored during evaluation, then we calculate the mean value.
Figure 13 demonstrates the total attention weights MUFFLE learned for each component. Features related to social networks have the highest attention weights, which match the results of individual component performance evaluation depicted in
Figure 10 in the previous sub-section. Besides, we observe that the weight of the source tweet component is approximately equal to the sum of the components of both the user timeline and user profile. The result indicates that user characteristics have the same importance as textual data, such as fake news content and tweet content.
To prove these two kinds of features are crucial to predicting fake news influence on social media platforms, we conduct two case studies on both user characteristics and textual features. In the first case study, we set the features of the user profile and timeline as independent variables, the news articles as controlled variables, and the cascade size of the source tweets as dependent variables, which symbolize the dissemination scale of the news. As for the second case study, we set different news pieces as independent variables, the users as controlled variables, and the cascade size of the source tweets as dependent variables. By exhibiting these two case studies, the importance of both domains’ features on predicting fake news influence is revealed.
5.5.1. Case Study One: User Characteristics
To demonstrate the momentousness of user characteristics, we select two source tweets sharing the same news but tweeted by two different users. One source tweet has no retweets at all, while the other source tweet has 101 retweets in total. We separate user characteristics into two parts: user profile and user timeline, as exhibited in
Table 6. In the user profile, the user, whose tweet causes a larger information cascade, has many more followers, friends, listed, and favorite counts. In the user timeline, the average of retweets, favorites, and sentence counts are also higher in users who have a bigger cascade size. Due to the results, we conclude that dissimilar users may bring different effects on identical news articles.
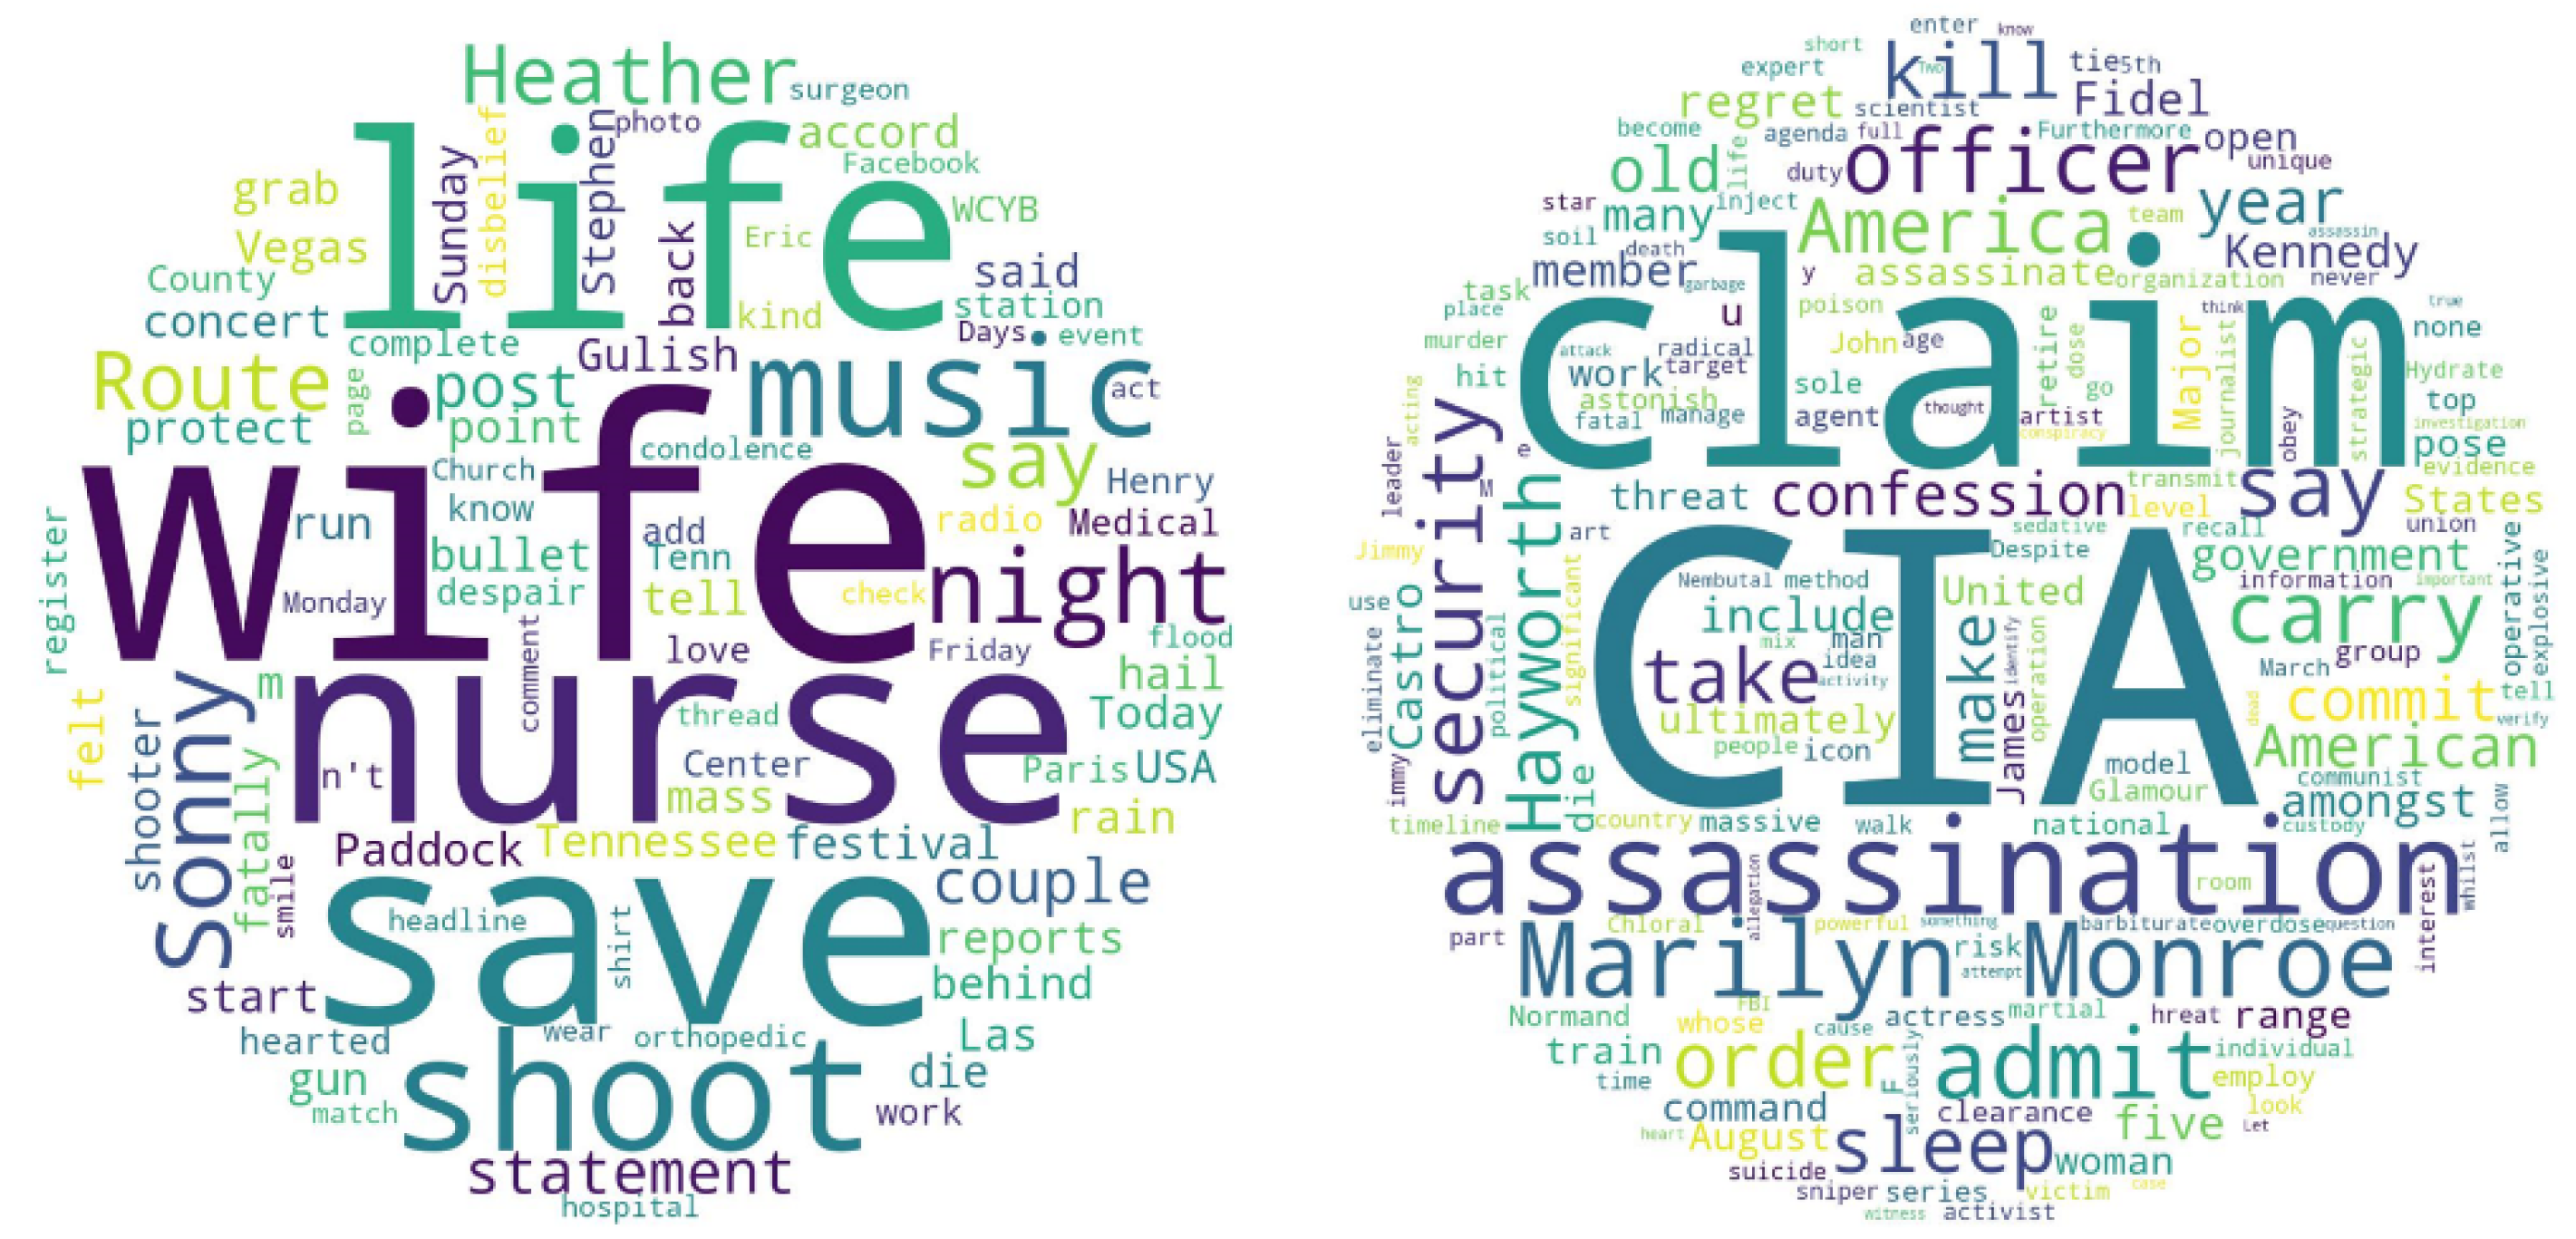
5.5.2. Case Study Two: Textual Features
We aim to prove that textual features play a crucial role in feature extraction. This time we select two source tweets from the same user but are involved in different fake news. One of the source tweets has 33 retweets and the other has no retweets. We highlight the important words from those two news articles using word cloud, shown in
Figure 14. The topics of the news are different: social news and political news, which may be one of the main reasons that people are attracted to and retweeted the post. Moreover, from
Table 7, we observe that the two articles have opposite sentiment scores, and the usage of sentiment words in the text is higher in the source tweet that has a larger cascade size. Such results show that the topic of the news and the sentiment contained may significantly determine the influence of the news.
5.5.3. Discussion of Execution Time
According to our experiments, the inference speed of the deep learning framework is not so crucial in this work. The reason is that the prediction can deal with 10,000 cases in 5 min on a GeForce RTX 3090 graphics card, and the time spent on data processing is less than one second, which can be ignored. The main time cost of our framework is the rate limit of the Twitter API service: 900 records in 15 min. Nevertheless, for a suspicious tweet, we can still predict its final size of cascade immediately (within 1 s).


 ,
, 


