Communication

Microbial Depolymerization of Epoxy Resins: A Novel Approach to a Complex Challenge

1
Laboratory for Mechanical Systems Engineering, Swiss Federal Laboratories for Materials Science and Technology (Empa), 8600 Dübendorf, Switzerland
2
Institute of Microbiology, University of Applied Sciences and Arts of Southern Switzerland (SUPSI), 6850 Mendrisio, Switzerland
3
Cellulose & Wood Materials Laboratory, Swiss Federal Laboratories for Materials Science and Technology (Empa), 9014 St. Gallen, Switzerland
4
Forest Soils and Biogeochemistry, Swiss Federal Institute for Forest, Snow and Landscape Research (WSL), 8903 Birmensdorf, Switzerland
*
Author to whom correspondence should be addressed.
Appl. Sci. 2022, 12(1), 466; https://doi.org/10.3390/app12010466
Submission received: 23 October 2021 / Revised: 23 December 2021 / Accepted: 29 December 2021 / Published: 4 January 2022
(This article belongs to the Special Issue Research on Atmospheric Sciences)

Abstract

:
The objective of this project is evaluating the potential of microbes (fungi and bacteria) for the depolymerization of epoxy, aiming at the development of a circular management of natural resources for epoxy in a long-term prospective. For depolymerization, epoxy samples were incubated for 1, 3, 6 and 9 months in soil microcosms inoculated with Ganoderma adspersum. Contact angle data revealed a reduction in the hydrophobicity induced by the fungus. Environmental scanning electron microscopy on epoxy samples incubated for more than 3 years in microbiological water revealed abundant microbiota. This comprised microbes of different sizes and shapes. The fungi Trichoderma harzianum and Aspergillus calidoustus, as well as the bacteria Variovorax sp. and Methyloversatilis discipulorum, were isolated from this environment. Altogether, these results suggest that microbes are able to colonize epoxy surfaces and, most probably, also partially depolymerize them. This could open promising opportunities for the study of new metabolisms potentially able depolymerize epoxy materials.

1. Introduction

Inefficient management of natural resources, with continuous increase in CO2 accumulation, is a recognized global threat, affecting not only the stability of ecosystems and biodiversity, but also economic stability and human health. Scientists estimate that only 9% of the cumulative worldwide plastic production from 1950 to 2015 was recycled and only 10% of this proportion was recycled more than once. A proportion of 91% was discarded into landfill, dispersed in the environment, or incinerated [1]. Research predicts that with the current economy and waste management, by 2030, industries will demand the amount of natural resources present in two Earths, and those in three by 2050 [2]. This is not sustainable and could lead to a collapse of our ecological and economic systems. To avoid this scenario, efforts to move towards a circular and green economy are necessary. This requires new technologies for transformation of waste into valuable products through recycling and upcycling. This also holds for carbon fiber-reinforced polymer (CFRP) composites with epoxy matrix. This is a light-weight material with highly specific strength and stiffness. Due to these properties, CFRP–epoxy is increasingly used in many structural and engineering applications, e.g., aircrafts (Boeing 787, Airbus A350), sports equipment and civil engineering, for the strengthening of existing structures, cars (BMW i3), freight vehicles and wind power rotor blades [3,4]. Current estimations predict an increasing demand for carbon fibers in the future [5,6]. This might result in a possible supply gap in the short–mid-term future [7]. Strategies considered for recycling continuous carbon fibers from CFRP epoxy composites are thermal (pyrolysis) and chemical (solvolysis) methods. However, the high temperature and the aggressive chemicals employed in these approaches cause significant degradation of the carbon fibers as well. Some of these treatments yield discontinuous rather than continuous fibers [8,9], limiting their potential to be recycled [10,11]. Another drawback is the large amount of energy required for pyrolysis and the large amount of chemicals required for solvolysis, which will lead to undesirable emissions or residual waste that has to be safely disposed of [12]. Hence, an efficient recycling method for the recovery of carbon fibers currently does not exist. Increasing future use, finite service lifetimes of CFRP components and structures and more stringent regulations will demand safe and environmentally friendly recycling technologies. Therefore, such efficient methods at affordable costs are essential for sustainable use of CFRP epoxy composites. The study of microbial metabolisms has great potential for developing more sustainable processes, allowing a decrease in the human ecological footprint and preservation of precious natural resources.
Recent research on thermoplastic material presents an encouraging and successful example for moving towards a more circular and green economy. An enzymatic degradation of polyethylene terephthalate (PET), followed by exploitation of the depolymerization products by bacteria to obtain two new biodegradable biopolymers (polyhydroxyalkanoate (PHA) and poly(amide urethane)) was proposed [13]. However, microbial degradation of epoxy resins and CFRP epoxy composites is still largely unexplored. There is scant literature on the subject, and that which is available is mostly focused on the potentially detrimental effect of microbes on CFRP composites [14,15,16]. Electrochemical impedance spectroscopy (EIS) was used to assess the microbial degradation of a protective epoxy coating on a carbon steel material [17]. Samples incubated in sea water with the bacterium Pseudomonas putida revealed decreasing protective performance of this coating upon microbial colonization. Comparisons with abiotic controls suggested that microbial degradation of the epoxy occurred [17], possibly by oxidation of hydroxyl to the intermediate carbonyl (aldehyde). Another study investigated the effect of a fungal consortium composed of Aspergillus versicolor, Cladosporium cladosporioides and Chaetomium sp. on the quality of CFRP composites [18]. The tested fungal consortium was able to grow on and penetrate this material [18]. The fungal and bacterial microflora responsible for the deterioration of an epoxy statue was also investigated [19]. Culture-dependent and -independent techniques revealed a microbial community composed of typical rock-inhabiting microbes, algal photobionts, such as Trebouxia spp., Chloroidium ellipsoideum and Chlorella angustoellipsoidea, and Cyanobacteria, such as Leptolyngbya sp., Phormidium sp., Cylindrospermum stagnale, Hassallia byssoidea and Geitlerinema sp. Black yeasts related to the species Friedmanniomyces endolithicus, Pseudotaeniolina globosa, Phaeococcomyces catenatus and Catenulostroma germanicum were also detected.
As previously stated, few studies focus on the microbial biodegradation potential for epoxy, and only one set out with the purpose of recycling this recalcitrant synthetic polymer. Experimental evidence demonstrated that the bacteria Rhodococcus rhodochrous and Ochrobactrum anthropi were able to degrade Araldite® epoxy resin when incubated in co-culture [20]. These bacteria were able to use the resin as a carbon source with possible degradation pathways by oxidation of the methyls in Bisphenol A, followed by decarboxylation. Regarding the biodegradation of epoxy resins, it can be summarized that, even though the literature provides some evidence, the general microbial behavior on this substrate and the different reactions involved in the microbial degradation of epoxy are still incompletely understood.
Therefore, the objective of the present research project is the evaluation of the potential of microbes (fungi and bacteria) for developing a circular management of natural resources for epoxy composites. The first approach was to investigate Ganoderma adspersum, a fungus able to degrade wood, and its depolymerization abilities for epoxy samples incubated for 1, 3, 6 and 9 months in soil microcosms. In biotechnology, microbial metabolisms involved in wood degradation are often exploited. Indeed, fungi able to degrade lignin, and cellulose possesses really efficient oxidative enzymes able to degrade recalcitrant and xenobiotic compounds, such as pesticides, synthetic polymers and chlorinated aromatic compounds [21]. Lignin is a recalcitrant and complex polymer with a heterogeneous structure, composed of three different monomeric precursors (p-coumaryl alcohol, coniferyl alcohol and synapyl alcohol). Two classes of fungal enzymes are described to be mainly responsible for lignin degradation: peroxidases (lignin peroxidase and manganese peroxidase) and laccases [22]. These enzymes, generally called phenol oxidases, enable lignin degradation by different reactions causing the cleavage of the phenolic unit of this polymer. Epoxy resins are also composed of several phenolic units. This similarity makes these enzymes and microorganisms that are able to produce it—such as G. adspersum—good candidates for the degradation of epoxy. The second aim of this study was to evaluate the depolymerization potential of microbes naturally present on epoxy surfaces. Hence, additional analysis of microbial colonization and potential surface modifications was performed on epoxy samples incubated for 3 months and 3 years in microbiological water. Finally, isolation and identification of microbes from these environments were also carried out. Results obtained in this study provide new information in a relatively unexplored field. In a long-term prospective, microbes that are able to degrade epoxy might help scientists to develop a more sustainable and circular management of epoxy material, decreasing soil, water and atmospheric pollution.

2. Materials and Methods

2.1. Epoxy Samples

Epoxy samples were produced mixing the epoxy resin L and the hardener GL2 (both from Suter Kunststoffe, Fraubrunnen, Switzerland) in the proportion of 30 g of hardener for 100 g of resin in a high-speed shear mixer (Labotop 1 LA, PC Laborsystem GmbH, CH 4312 Magden). The mixture was cast into a steel mould (approx. 200 for 200 for 2 mm) previously treated with a release agent Loctite Frekote 770NC (Suter Kunststoffe, Fraubrunnen, Switzerland). Curing at room temperature for 18 h was followed by post curing at 70 °C for 15 h. The cast plates were cut to specimens of 2 for 10 for 60 mm with a saw blade (Hamba Type B-4SE/A, *H. Amacher Allschwil-Basel). Small cubes for the microbiological water experiment were obtained by first cutting long strips of 2 mm width and then cut into cubes of approximatively 2 for 2 for 2 mm by a knife, tapped with a hammer. Powder of epoxy, used to prepare the microbiological media for the isolation and sub-cultures, was produced with the same starting epoxy material. The cast epoxy was pre-crushed with a press, then ground in a laboratory blender and finally in a mill with addition of liquid nitrogen (final particle size between 100 and 500 µm).

2.2. Experimental Set-Up

2.2.1. Standard Soil (Microcosms)

To study the influence of microbes on epoxy in a more representative environment than the normal microbial cultures, soil microcosms were prepared. The selected microbe for this experiment was the fungus Ganoderma adspersum (Empa 645), obtained from the collection of the Cellulose and Wood Materials Laboratory, Empa, Switzerland. This fungus was isolated from forest soil. In addition, during this experiment, the natural microbiome of the selected soil was also tested, since one set of microcosms was not autoclaved. The preculture of G. adsperum was cultivated in MA media (malt 12 g/L and agar 20 g/L). For the preparation of a fungal suspension, the mycelium was removed from the surface of a 2-week-old pre-culture with tweezers and a scalpel and placed in 10 mL of sterile physiological water.
The humidity rate of the selected soil (Frux ED 73, Einheits Erde, Germany) was measured in triplicates by a simple drying procedure. The obtained value was used to prepare 2 sets of microcosms of 500 g of soil with 2 different water-holding capacities (whc)—60% (addition of 45.8 mL of tap water) and 90% (addition of 134.5 mL of tap water). Scheme 1 illustrates the conditions tested during this experiment. Microcosms were prepared by filling 1 L glass jars with 500 g of soil and the above-mentioned amount of water to test the influence of different whc on the interaction between microbes present in the microcosms and epoxy. In each set, the same parameters were tested; sterilization of soil by autoclaving (sterile soil) and soil not autoclaved (unsterile soil). For both conditions (sterile and unsterile soil), 10 mL of sterile water (soil) and of 10 mL of G. adspersum suspension (fungus) were added. Plates were removed for analysis after 1, 3 and 6 months. After the analysis, a piece of each plate, previously incubated for 3 and 6 months, was placed again in the microcosms and the analysis was repeated after 3 additional months on the same plates (6 months* and 9 months*). Three jars were prepared for each condition for a total of 48 microcosms. In order to have 4 replicates for each condition, 4 epoxy samples (2 for 10 for 60 mm) were placed in each microcosm. Sterilization of the epoxy samples was performed with the UV source of the microbiological sterile bench (standard procedure with a mixture of UVA and UVB rays). Two types of controls consisted of untreated samples (untreated) and UV-treated samples (untreated UV) to evaluate the influence of UV sterilization on the properties of the epoxy. Controls samples were stored in a desiccator during the incubation of the test samples in the microcosms.
To study the influence of the tested conditions on the properties of the material and to detect the potential depolymerization of the epoxy, the following analyses were performed: weight loss, hardness and colorimetric measurements, flexure tests, wettability and chemical changes, through contact angle and FTIR analysis.

2.2.2. Microbiological Water

In order to explore the influence of microbial community in a less porous environment that could enhance the access of microbes to the surface of the samples, the depolymerization potential of aquatic microbiomes was also studied. A previous experiment consisting of a water tank with epoxy samples of different sizes, covered by a metallic top, was selected. Unfortunately, some information on the exact procedure of the preparation of this test is lacking. Data available are the starting material used and the length of the exposure. This tank was prepared by mixing tap water and soil collected near an ant nest, since increasing experimental data report that ant colonies promote microbial biomass, activity and functional diversity near the nest [23,24]. The soil solution was filtered to avoid particles from soil but leaving microbial communities (pore size larger than 0.4 µm). Different epoxy samples were stored in this microbiological water for more than 3 years. Ion chromatography determined the ionic composition and the dissolved organic carbon amount in the water (Table S2). Samples from this tank were studied with environmental scanning electron microscopy (ESEM, for detail see Section 2.3.7) to determine the potential surface colonization of microbes and its impact on the surface morphology. In addition, new epoxy plates (2 for 10 for 60 mm) were placed in this microbiological water for 3 months. Changes in the material properties were investigated through colorimetric and contact angle measurements, as well as FTIR analysis. Controls samples were placed in a similar tank without water just in front of the other experiment (room temperature, exposed to natural light). Three replicates for each condition were used.
Microbial colonization dynamics were also studied by placing small cubes in the same water. A large portion of the sample surfaces was previously analyzed by ESEM and with a software that allows imaging of a large area by merging the ESEM images (for details see point 2.3.7). The same techniques, applied after the 3 months incubation, allowed us to study the microbial colonization state.

2.2.3. Isolation of Microbes from Microbiological Water

In order to identify the microbes present in this microbiological water and potential candidates for epoxy depolymerization, samples of water and epoxy plates were removed from the tank and incubated in solid growth medium containing epoxy powder. For the isolation procedure, a bilayered medium was used. The lower part of the medium was composed of NaNO3 2.0 g/L, KH2PO4 0.7 g/L, K2HPO4 0.3 g/L, KCl 0.5 g/L, MgSO4·7H2O 0.5 g/L, FeSO4 0.01 g/L and agar 20 g/L. The upper part was prepared with 3 g/L of epoxy powder and 20 g/L of agar. Both media were sterilized by autoclaving (120 °C, 20 min). Each Petri dish was filled with 15 mL of lower and 10 mL of upper layer solution. Aiming to obtain pure cultures, microbial colonies were sub-cultured eight times.

2.2.4. Genetic Identification of Isolated Microbes

Fungal and bacterial strains isolated from the microbiological water containing old epoxy samples were identified by DNA sequencing. Two colonies were analyzed separately for each isolate. Bacterial DNA extraction was carried out according to the instruction of the InstaGene method (6% w/v Chelex resin, BioRad, Italy). To perform the PCR, 1.5 μL of each extracted DNA sample was added to the PCR reaction mix. The reaction mix was composed of 2.5 μL QIAGEN Buffer, 1.5 μL QIAGEN MgCl2, 0.125 μL HotStar Taq Polymerase (HotStar Taq DNA Polymerase 1000 Units QIAGEN kit, QIAGEN, Netherlands), 0.5 μL oligonucleotides Primer UniL (5′ATTCTAGAGTTTGATCATGGCTCA 3′), 0.5 μL oligonucleotides Primer UniR (5′ATGGTACCGTGTGACGGGCGGTGTGTA 3′), 0.5 μL PCR Nucleotide Mix Plus (dUTP/dATP/dGTP/dCTP) and 17.875 μL H2O [25,26].
After the quantification of DNA with the Nanodrop spectrophotomer (ThermoFisher Scientific), 1.5 μL of purified DNA was added to the reaction mix containing 2 μL of primer (UniL for one mix, UniR for the other), 1 μL of BigDye® Terminator v3.1 Ready Reaction Mix (ThermoFisher Scientific) containing the marked dNTP, 5 μL of 5 for BigDye® Buffer 5 for (ThermoFisher Scientific) and 4 μL of H2O for a total of 10 μL of volume. The amplification was performed in the Veriti AB Prism thermocycler with the following routine: 96 °C for 1 min, 25 repetitions of 96 °C for 10 s, 50 °C for 5 s, 60 °C for 4 min and then cooling down and maintaining at 4 °C. Lately, the PCR products were filtrated by centrifugation using a column containing the Sephadex G-50 matrix (10 g of Sephadex G-50 matrix in 150 mL milliQ H2O) in order to retain the non-incorporated fluorescent nucleotide and recover the PCR products. Some columns (tips cut just below the filters level) were filled with 900 μL of a suspension of Sephadex G-50 and placed in QIAGEN collection tubes. The tubes containing the columns and the suspension were centrifuged for 3 min at 2700 rpm in order to solidify the matrix. The columns containing the solid matrix were recovered from the collection tubes and transferred in two 1.5 mL Eppendorf tubes. Measures of 10 μL of each of the BigDye reaction mixtures were transferred in the two columns and centrifuged for 3 min at 2700 rpm. The columns containing the matrix were removed, and 5 μL of HiDi Formamide (ThermoFisher Scientific) were added to each sample. Measures of 15 μL of the purified DNA and HiDi Formamide from each sample were transferred in two wells of a microtiter plate. The microtiter plate containing the amplified 16 s DNA was then loaded in the sequencer (Applied Biosystems 3500 Genetic Analyzer, Thermo Fisher Scientific) and the sequencing reaction was performed. The presence of incorporated fluorescent dNTP allows the identification of the nucleotide composition of the sequenced fragments.
Concerning fungi, fungal cultures were inoculated in the isolation medium and covered with a cellulose film in order to remove the mycelium from the solid medium. A measure of 508 µL of sterile TE buffer (1.211 g/l Trizma base, Sigma; 0.372 g Na2EDTA.2H2O, Fluka) was added in an Eppendorf tube together with 1 cm2 of fungal culture. Then, 50 µL lysozyme (10 mg/mL lysozyme, Sigma) was also added, and the sample was incubated 2 h at 37 °C. After that, 30 µL SDS 10% (Sigma) and 12 µL proteinase K (8.3 mg/mL, Sigma) were added to the sample that was incubated a second time for 24 h at 37 °C, in order to complete the breakdown of the cell walls. After the second incubation, 100 µL NaCl 5M (Sigma) and 80 µL sterile CTAB 10% (10 g CTAB, Merck; 100 mL NaCl 0.7M, Sigma) were added and the sample was heated at 65 °C for 10 min. In order to eliminate proteins and lipids from the sample, 700 µL phenol/chloroform/3-methyl-1-butanol (25 mL Phenol, Sigma; 24 mL chloroform, Merck; 1 mL 3-methyl-1-butanol, Merck) was added and the sample was centrifuged at 13000 rpm for 10 min at 4 °C [27]. A measure of 500 µL of supernatant was transferred in a new Eppendorf tube together with 500 µL phenol/chloroform/3-methyl-1-butanol. The sample was then centrifuged at 13,000 rpm for 10 min at room temperature. In order to precipitate the DNA, 200 µL of the supernatant was transferred in anew Eppendorf tube together with 120 µL isopropanol (Sigma) and centrifuged at 13,000 rpm for 13 min at 4 °C. After that, the supernatant was eliminated while the sediment was washed with 300 µL of cold ethanol 70% (Fluka) and centrifuged at 13,000 rpm for 5 min at 4 °C. Then, the supernatant was eliminated, while the sediments containing the DNA were dried for 1 h at room temperature. Finally, to resuspend the DNA, 50 µL of TE buffer were added to the sediment containing the DNA and incubated at 4 °C for 24 h. The PCR reaction mix for ITS rDNA amplification was prepared as follows: 2 µL of each of the extracted DNA samples was added to the PCR reaction mix containing, for each sample, 2.5 µL QIAGEN buffer, 1.5 μL QIAGEN MgCL2, 0.125 μL HotStar Taq Polymerase (HotStar Taq DNA Polymerase 1000 Units QIAGEN kit, QIAGEN, Netherlands), 0.5 μL Primer ITS1 (5′ TCCGTAGGTGAACCTCGCG 3′, Microsynth AG), 0.5 μL Primer ITS4 (5′ TCCTCCGCTTATTGATATGC 3′, Microsynth AG), 0.5 μL PCR Nucleotide Mix Plus (dUTP/dATP/dGTP/dCTP) and 17.375 μL H2O [28].
The PCR on ITS rDNA allows the amplification of the ITS fragment (internal transcribed spacer) using two different primers, ITS1 and ITS4, according to [28], with some modifications. These primers together amplify fragments of around 600–700 bp. The amplification was performed in the Veriti AB Prism Thermocycler (Applied Biosystems, ThermoFisher Scientific) through the following thermal routine: 95 °C for 15 min (denaturation), then 40 cycles of 95 °C for 30 s (denaturation), 55 °C for 1 min (annealing), 72 °C for 1 min (extension) and finally 72 °C for 10 min (final extension). The amplified products have been subsequently cooled down and maintained at 4 °C. The research for homologous sequences was carried out according to [29]. The screening for homologous sequences in the GenBank database was performed using the Basic Local Alignment Tool (BLAST). A minimum of three to a maximum of eight homologous sequences to each query obtained with BLAST have been aligned using the “Muscle” algorithm [30], implemented in the MEGA-X package.

2.3. Analytical Techniques

2.3.1. Weight Loss and Drying Procedure

The moisture absorption of epoxy samples was determined according to the ASTM D5229 Standard [31]. Before the drying procedure, samples were weighed to assess moisture content with a Mettler AT400 balance with an accuracy up to 0.0001 g. Afterwards, they were dried at 70 °C in a vacuum oven (Heraeus Vacutherm Typ VT6125) and weighed every 24 h in order to assess the mass change due to removal of humidity. The drying process was stopped when the weight change of each sample was less than 0.02% over two consecutive days. This procedure was applied to assess weight loss, to prepare samples before performing all the other analyses, and for the untreated and untreated UV samples.

2.3.2. Hardness

The Shore D hardness of the samples was measured by indentation with a durometer for hard rubbers, semi-rigid plastics and hard plastics according to [32]. Hardness was recorded after 3 s from the penetration of the indenter inside the tested epoxy sample. As the minimal sample thickness required to perform the analysis was 6 mm, 4 samples were stacked one on the top of the other. The measurements were performed on both sides of the sample close to the end to avoid interference with flexure tests. Three measurements per sample resulted in twelve measurements for each condition.

2.3.3. Flexure Test

Three-point bending tests were performed on a universal testing machine (Zwick Z010, Ulm, D) with a MultiXtens extensometer to investigate mechanical behavior of the treated samples. A total of 4 samples of 2 for 10 for 60 mm were tested at 10 mm/min with a span of 32 mm and their Young’s modulus, bending strength and strain at failure were analyzed in accordance to DIN EN ISO 14125 A [33]. As a standard, 1 measurement per replicate was performed for a total of 4 measurements per condition.

2.3.4. Colorimetry

For the estimation of the color changes during sample incubation with the different substrates (standard soil and microbiological water), the epoxy samples were analyzed with a spectrophotometer (type Minolta CM-508D). Quantitative changes in color and lightness using the L*a*b* color space were measured. L*coordinates describe brightness (bright to dark), a* coordinates describe the red-green component, while b* coordinates define the yellow-blue component of the analyzed color. The following setting was used during all the measurements: Specular Component Included mode (SCI), Illuminant D65 (daylight containing UV component, color T 6504K), d/8° geometry, 10° observer, measurement area diameter of 8 mm, illuminant with Xe flashlight source 100% UV, containing all UV components, or 0% UV component containing no UV components, and CIELab colors space. A white background was used for the analysis. There were 3 different areas analyzed for each side of the sample (up and down), and for each area the measure was recorded 3 times for a total of 18 measurements for each sample and 72 for each tested condition.

2.3.5. Wettability (Contact Angle)

Sessile drop measurement with distilled water was employed to assess the wettability of the surface of the epoxy samples by measuring the contact angle of a sitting drop, with a Drop Shape Analyzer (type DSA30, Krüss, Hamburg, Germany). The contact angle was analyzed through a Krüss Advance software package with the ellipse fitting model. The volume of the drops was set to 2 mL. For all the samples, 6 measurements were effectuated on each side and every measurement was recorded 3 times for 1 s each, for a total of 36 data for each sample and 144 data for each condition. Since this method is very sensitive, samples were prepared as follows to reduce interferences with the analysis: to remove particles from the surfaces, samples were cleaned with ethanol and lint-free wipes. An ionizer air blower (SIMCO Aerostat PC, Hatfield USA) was used to remove the residual electrostatic charge, which could influence the adherence of the drop to the surface, by keeping the sample close to the airflow for 10 s prior to the measurement.

2.3.6. Fourier Transformed Infrared Spectroscopy (FTIR)

Aiming to study the impact of our experiment on the surface chemical structure of epoxy, FTIR analyses were performed with a spectrometer (type Tensor 27, Bruker, Billerica, MA, USA). Spectra were obtained with a diamond attenuated total reflectance (ATR) crystal plate. For each measurement, 32 scans were measured in the range of 4000–650 cm−1. The scans were recorded with a spectral resolution of 4 cm−1, and the resulting spectra averaged. OPUS software (Winterthur, Switzerland) was used to collect and correct the data (baseline correction). As a standard, 6 measurements per replicate were performed—3 for each side. To evaluate the degrees of oxidation of the tested material, carbonyl and hydroxyl indexes (Equations (1) and (2)) were calculated. The indices were calculated with the OPUS software (Winterthur, Switzerland) using the intensity (I) of the peaks (K algorithm).
Carbonyl Index = Iabs at 1745/Iabs at 2861
Hydroxyl Index = Iabs at 3400/Iabs at 2861
For the carbonyl index of the samples from the experiment with the microbiological water, the difference from before and after the experiment was calculated and compared for each condition.

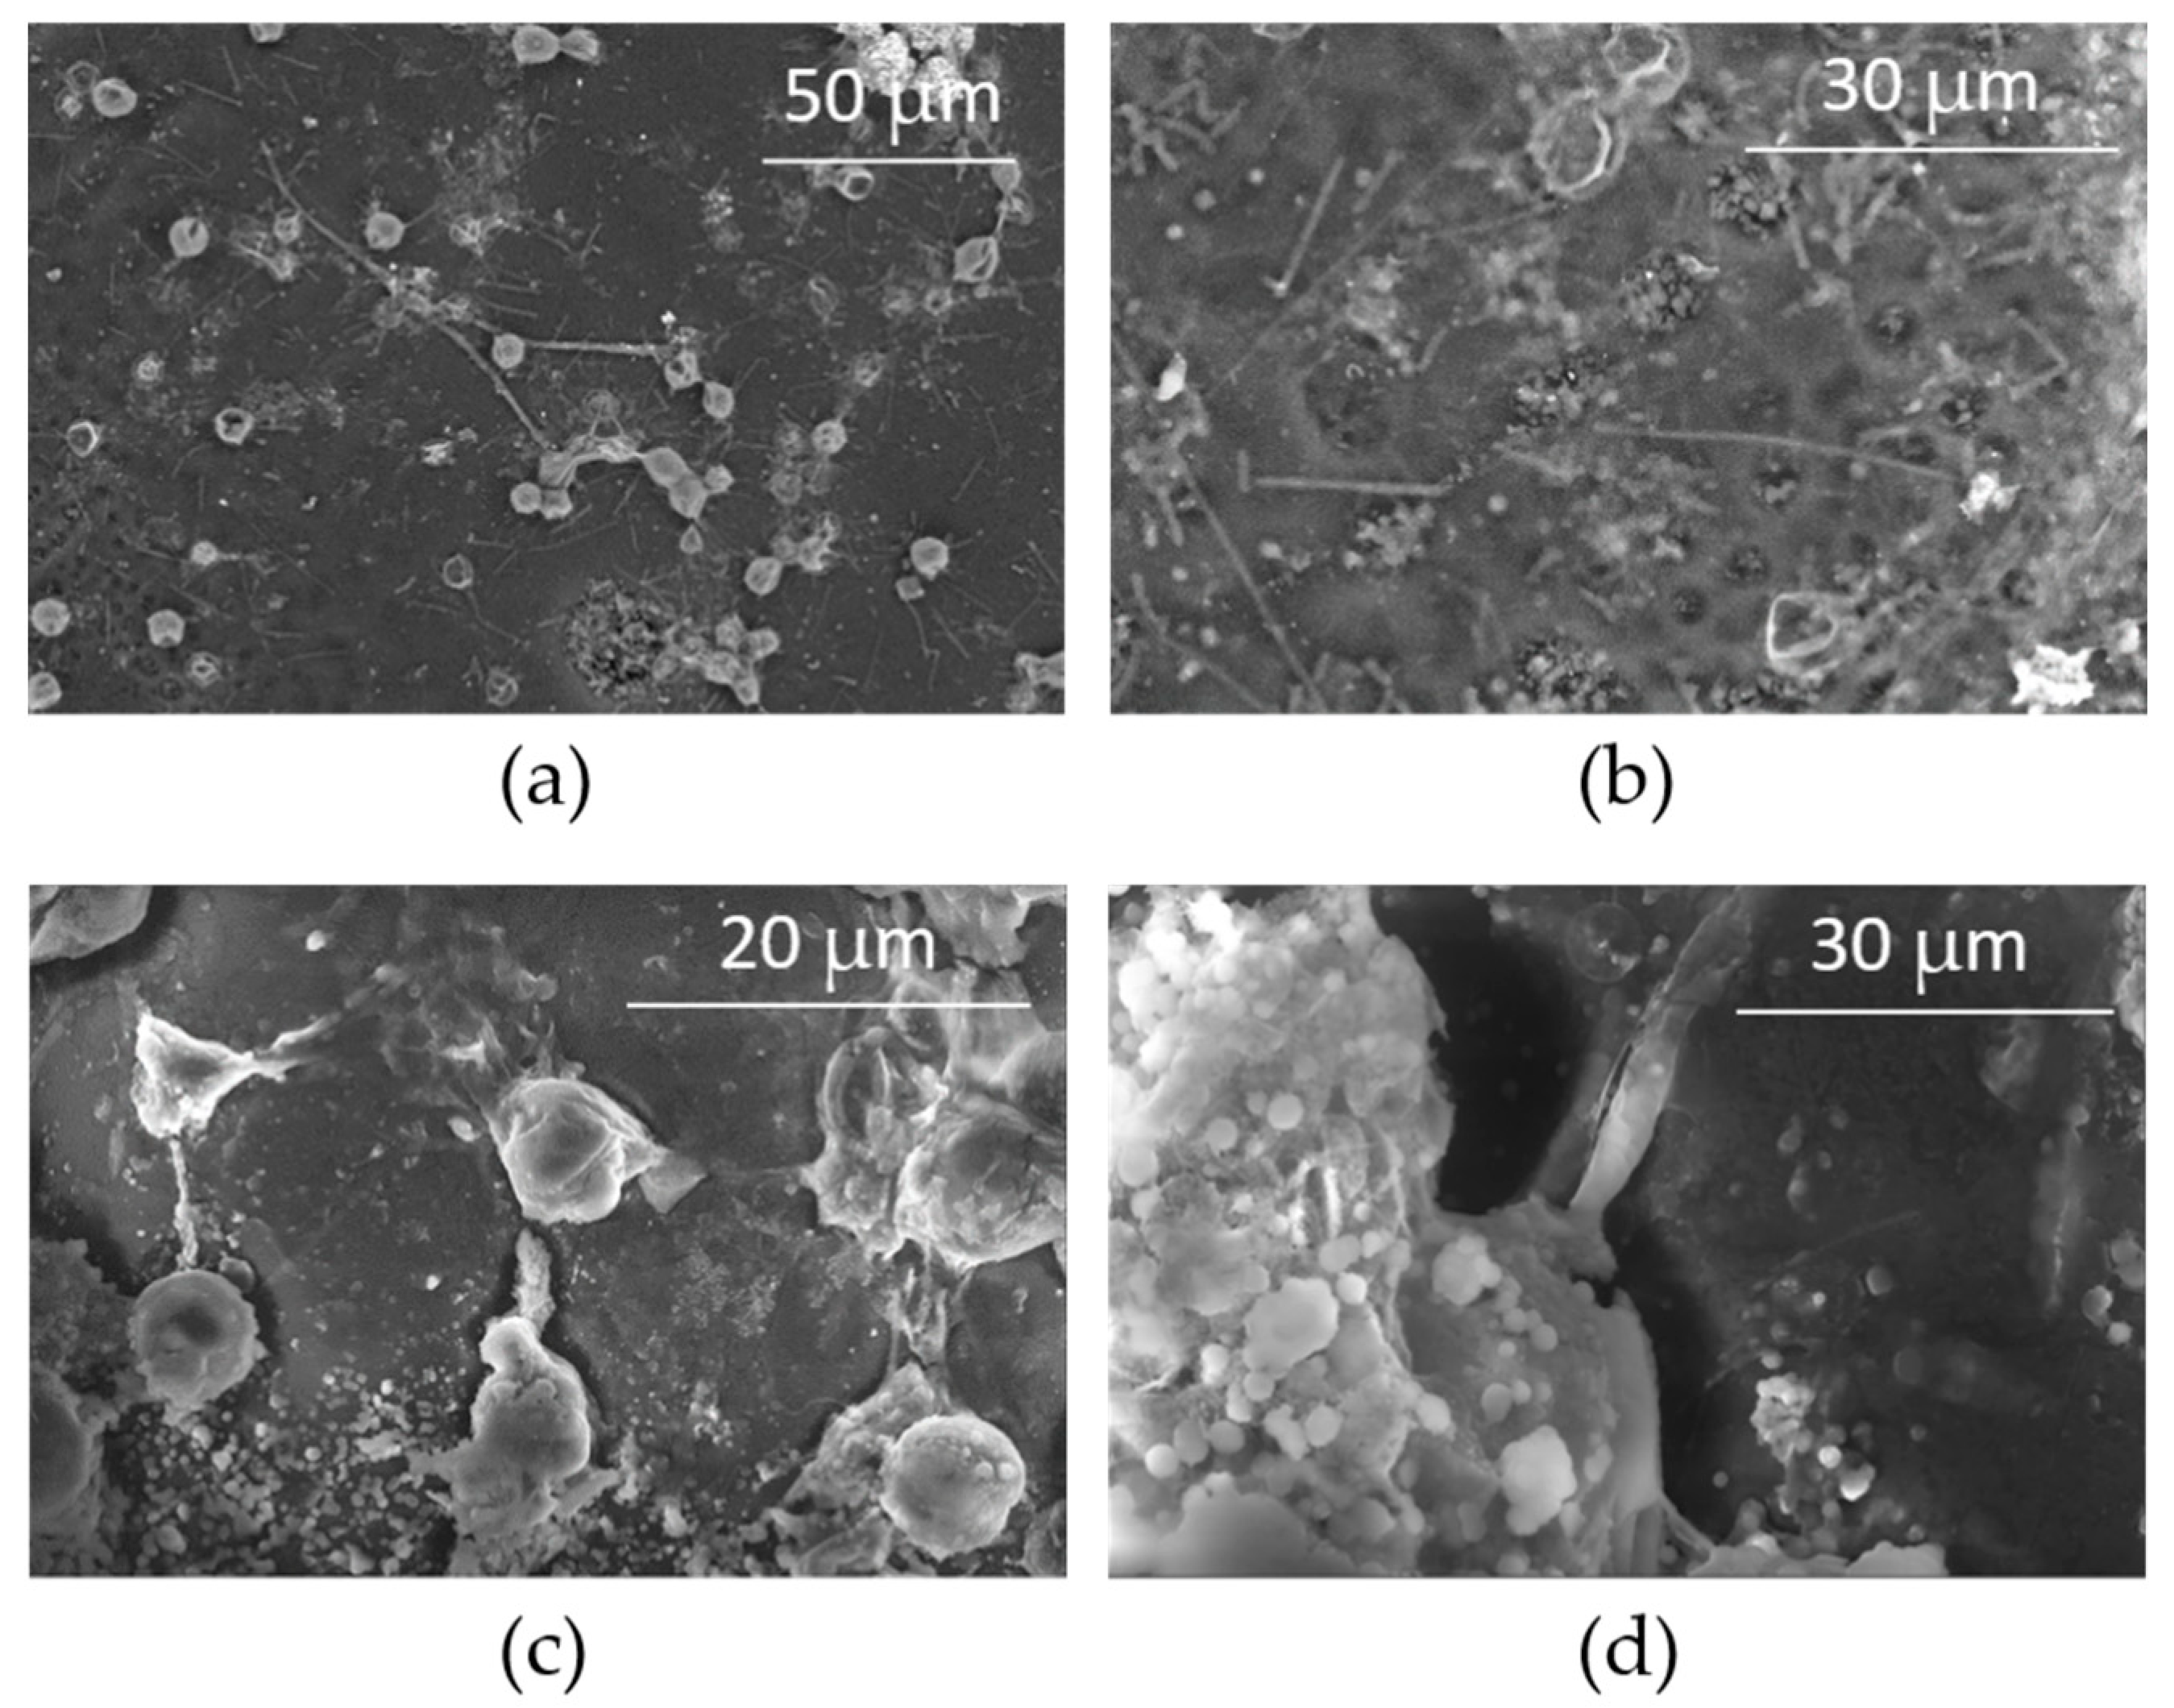
2.3.7. Environmental Scanning Electron Microscopy (ESEM)

In order to verify the presence of microbes and biofilms colonizing the surface, selected samples incubated for more than 3 years in the microbiological water have been analyzed with an environmental scanning electron microscope (ESEM Quanta FEG 650, Thermo Fisher Scientific). Imaging of the surfaces was carried out in low-vacuum mode at 4 °C using 2 different detectors. The GAD detector (gaseous analytical detector) was used to detect back-scattering electrons (material contrast information), while the GSED detector (gaseous secondary electron detector) allowed the detection of secondary electrons (topology information). Some spots on the surface rich in microbial communities and mineral salts crystals have been further analyzed with the EDX detector. This yielded an elemental mapping that was evaluated as semiquantitative atomic count percentage. EDX was performed with a magnification of 1000×, a working distance of 9 mm, and an acceleration voltage of 20.0 kV. The map resolution was 1024 by 682 with a pixels size of 0.21 μm, and for each element, the scanning line K was used.
To investigate the colonization potential of the microbiome present in the microbiological water, a software was employed to analyze a large area of epoxy cubes before and after incubation for 3 months. Single pictures were recorded and merged allowing the comparison of the same area before and after incubation.

2.3.8. Statistical Analysis

Four replicates were carried out for the experiment in microcosms, and for experiments with microbiological water, three replicates were prepared. Each measurement was repeated at least 3 times on each sample, for a minimum of 12 data points for each tested condition. For the exact number of analyses, see the section of each technique. The data were expressed as mean ± standard deviation. To verify significance of the data, one-way analysis of variance (ANOVA) was performed with Student’s t-test with the Bonferroni correction as post hoc test. When comparing the difference between two sets of data, a simple Student’s t-test was performed. Differences between means were considered significant if p < 0.05 or < of the p resulting from the Bonferroni correction.

3. Results

3.1. Standard Soil

Soil microcosms were prepared to test the impact of microbes on the epoxy samples in a more realistic environment; in fact, microbes possess a huge variety of metabolisms that can be activated in specific conditions. Aiming to stimulate a maximum of these metabolic abilities through the complexity of soil nutrients and structures, soil was selected as matrix for the experiment. Epoxy samples, incubated in these microcosms, were removed for analysis after 1, 3 and 6 months, additional incubation of half of each sample previously incubated for 3 and 6 months were re-incubated in the same microcosms for supplementary 3 months (6 months* and 9 months* incubation).
Overall, the analysis performed showed little evidence of microbial depolymerization on the epoxy samples. Weight loss measured was negligible and in the range of the standard deviation for all the samples (Table S1). Three-point flexure tests were also performed, and the results showed some scatter with little systematic trend over the treatment time from 1 to 6 months with the tested conditions (Figures S1–S3). In addition, variability among replicates makes the interpretation of the results complex. If present, microbial depolymerization will be in a first stage an irregular surface phenomenon, which will occur in concomitance to the microbial colonization. The flexure tests likely were not sensitive enough to detect changes due to depolymerization occurring on the surfaces.
Through colorimetric investigations of the epoxy, a clear trend was detected. In Figure 1, it is possible to easily differentiate samples from the first 3 incubations, while those from 6 months* and 9 months* were similar. With this analysis it was, however, not possible to draw a conclusion about the microbial impact on the tested material. Still, it is interesting to note that the samples show an increasing tendency towards yellow and green coloration up to the age of 6 months* (increase in b* and decrease in a*).
This trend was confirmed by hardness measurements (Figure 2). A reduction in hardness was noticed for all the tested samples after 6 months incubation. During the analysis, the indenter penetrates 0.5 mm in the epoxy; as for the 3-point bending tests, these hardness data are more representative of the overall state of the plate rather than the surface where potential microbial depolymerization should start.
A slight decrease in the FTIR carbonyl indexes was observed on the epoxy from the microcosms containing soil and the fungus. Nevertheless, it should be noticed that a decrease in the carbonyl index values was also observed for the sterile soil (Figure 3). This might be attributed to the effect of soil or to a contamination of the microcosms during the experiment.
On the other hand, wettability investigations by contact angle measurements on the samples incubated in the microcosms with a whc of 90% suggest a potential microbial depolymerization of the tested samples. Overall, as for the previous results, a general decrease was observed for all the contact angle data between the two sampling times (3 and 6 months* and 6 and 9 months*) (Figure 4). Since untreated and UV-treated samples were also displaying this behavior, part of this decrease could be attributed to a natural aging phenomenon. Data from samples incubated in sterilized and unsterilized soil for the first sets of sampling times (3 and 6 months*) showed an interesting trend. On these sets of data, samples incubated with the fungus G. adsperum had the lowest contact angle (70.6° for sterilized and 83.4° for the unsterilized) compared with untreated samples (90.1°), UV-treated samples (89.8°) and the soil samples (83.6° for sterilized and 89.2° for the unsterilized) (Figure 4a,c). This is confirmed by the data from seconds sets of sampling times (6 and 9 months*). Additionally, in this set of data, samples incubated with G. adspersum showed the lowest contact angle (85.3° for sterilized and 86.8° for the unsterilized) compared with untreated samples (91.6°), UV-treated samples (89.7°) and the soil samples (83.6° for sterilized and 96.0° for the unsterilized) (Figure 4b,d). These results revealed that the impact of the added fungus G. adspersum was different than the impact of the soil matrix and the natural microflora of the selected soil. Data from microcosms with a whc of 60% showed a similar trend but with a larger scatter and are presented in Figure S4.
In conclusion, we can confirm that obtained results suggest that some fungal depolymerization occurred on the surface of the samples by reducing hydrophobicity. However, to prove the potential of this specific fungus for the depolymerization of epoxy, further studies are necessary.

3.2. Microbiological Water

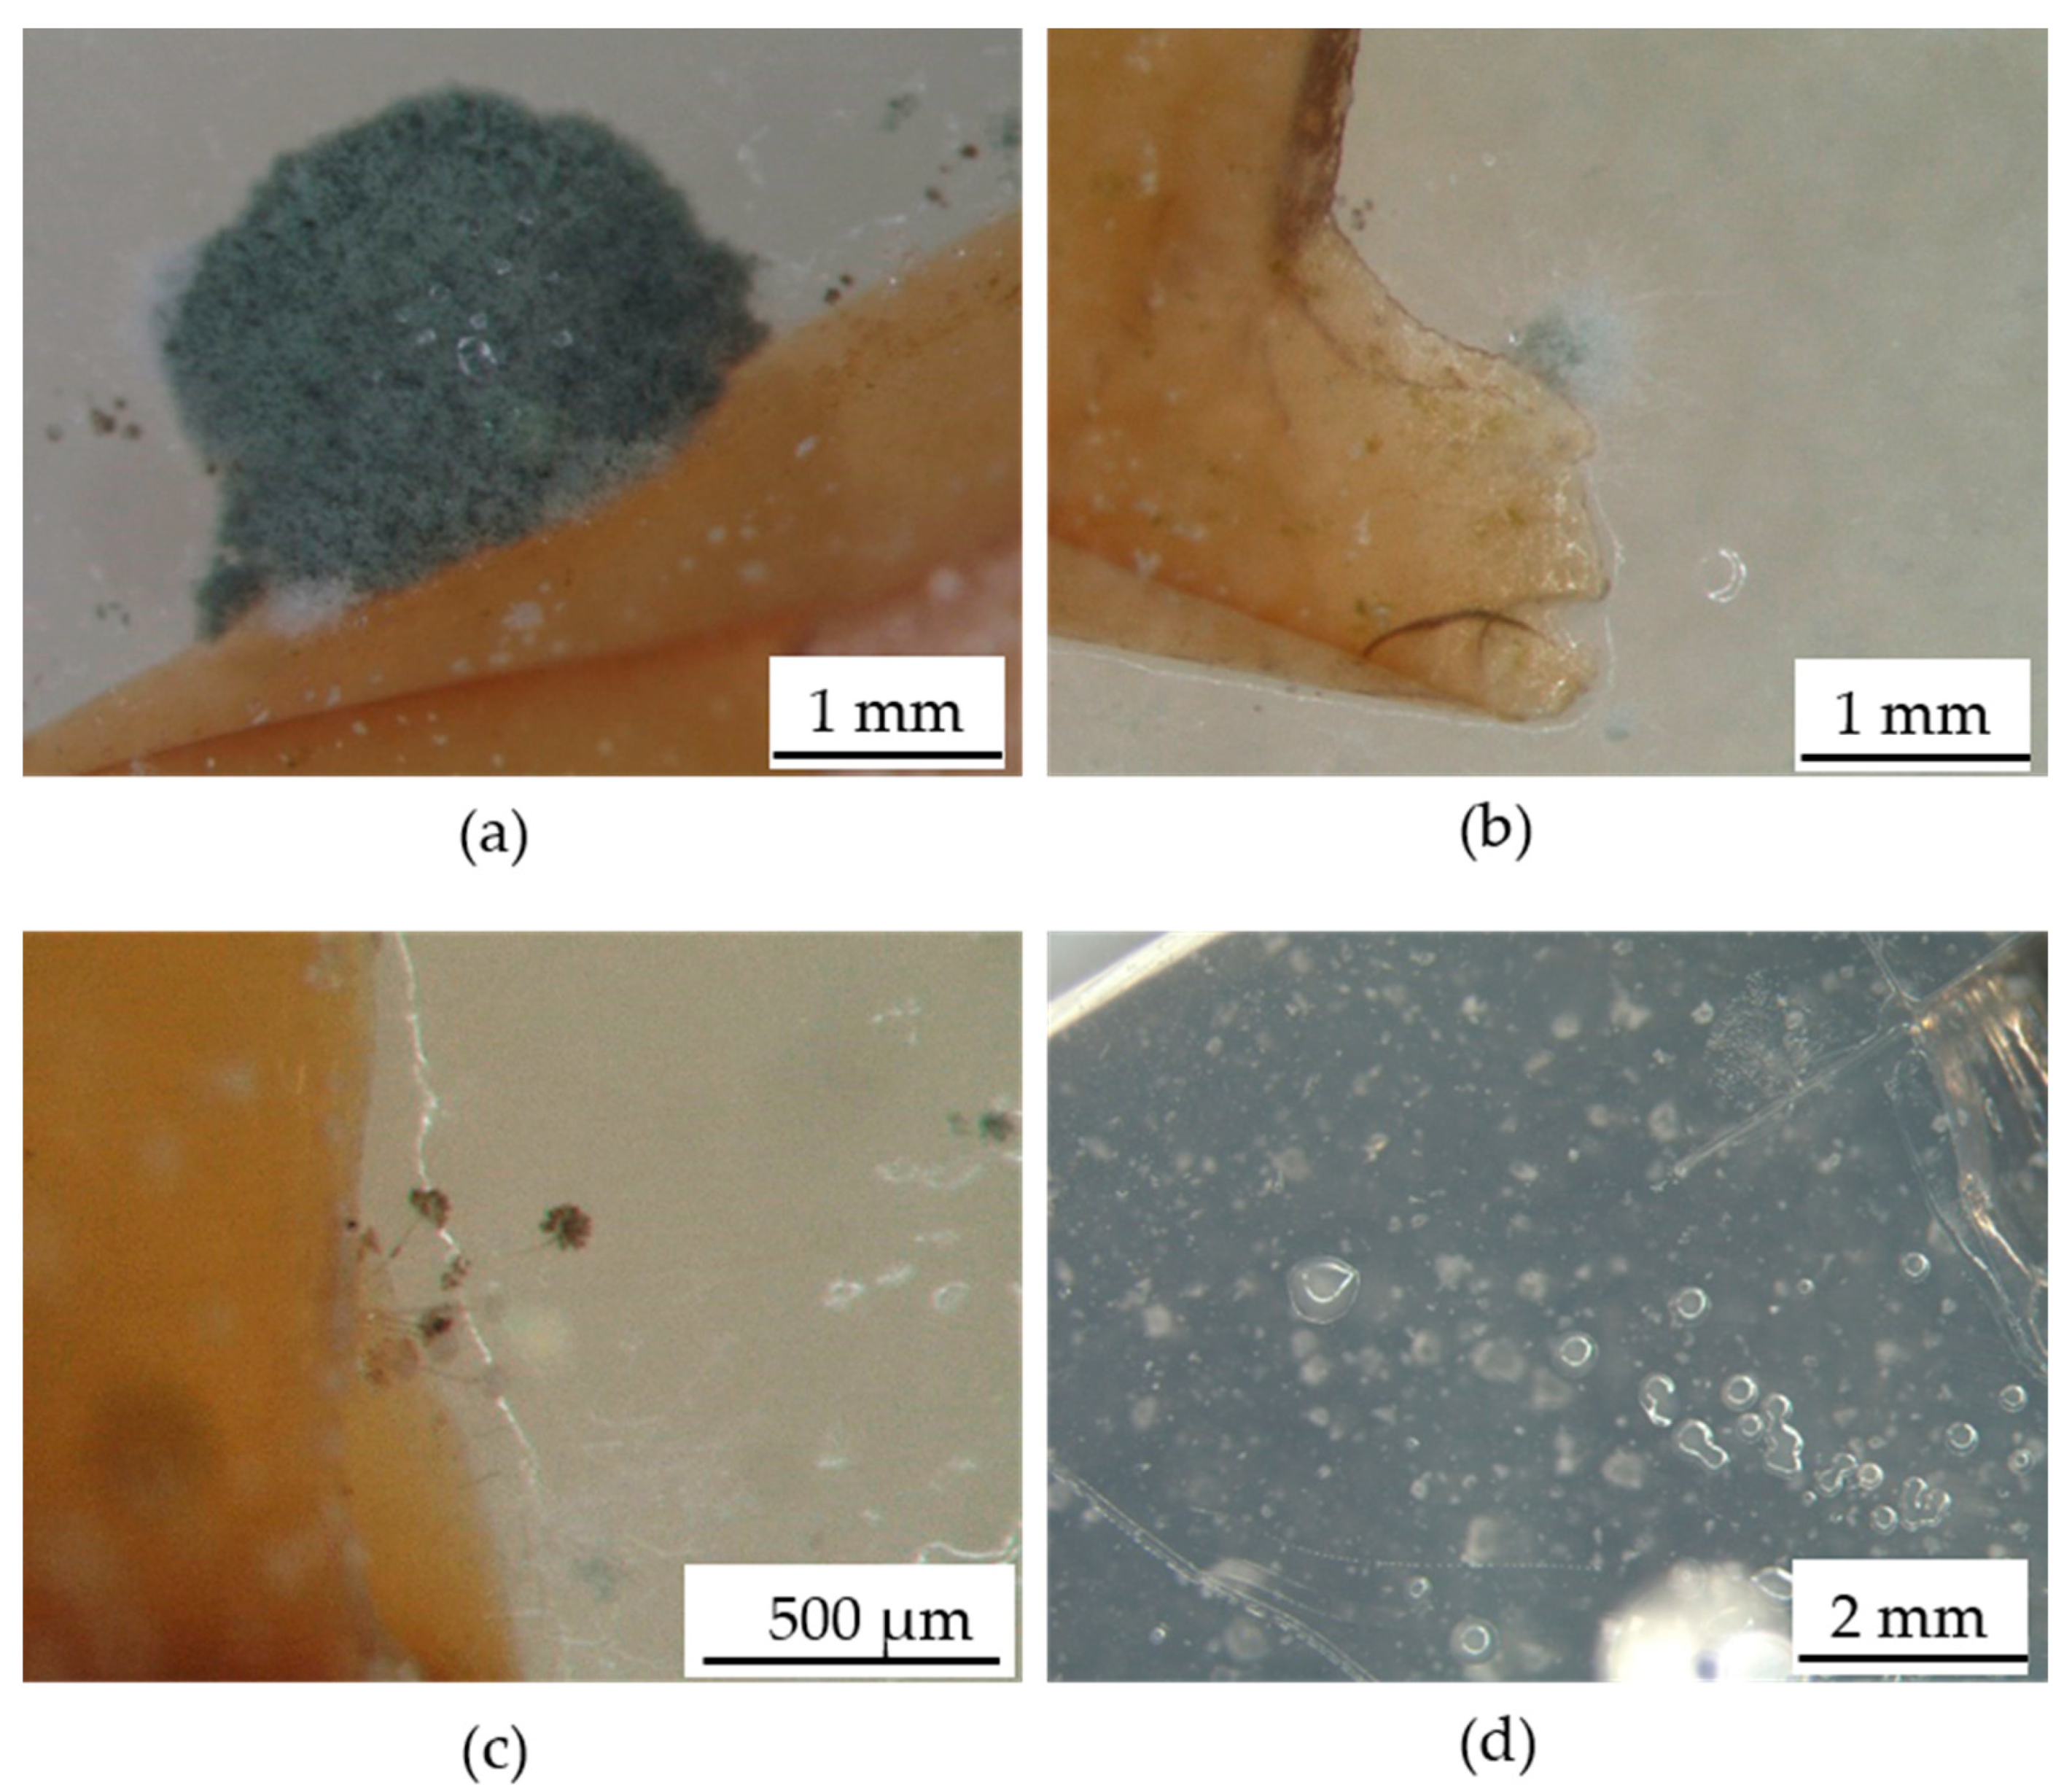
3.2.1. Observation on Older Samples from Microbiological Water

ESEM imaging on the epoxy samples incubated with microbiological water for more than 3 years revealed a various and abundant microbial community growing on their surface. A few examples of the diverse microbes are shown in Figure 5. The most abundant type showed a quasi-spherical shape with a diameter of 8–10 µm (Figure 5a–c). These cells were mostly in dense colonies connected to one another by some filamentous matrix, but in some cases, they were also present as sessile cells (Figure 5a–e). The size of these cells is on the border between typical prokaryotic cells (1–10 µm) and eukaryote cells (>10 µm). Therefore, it is not possible to assign it to one of the two reigns just based on size. The second most abundant type of microbes was rod-like microorganisms (Figure 5c–e). The rod structures were characterized by a length varying between 10 to 15 µm and a width around 1 µm.
These dimensions are typical of prokaryotic cells (1 µm), but it was not clear whether they were single rod-shaped cells or whether they consisted of more than one cell connected to each other. ESEM investigations also revealed some quasi-spherical cells growing in colonies with a far smaller size compared with the one previously described (1.5–3 µm; Figure 5f,g). This size suggests that they should be prokaryotic cells. Some areas with a mixed biofilm composed of microbes with different sizes and shapes, including filamentous structures, were also observed (Figure 5h). Finally, isolated filamentous structures with larger diameters were also found in well-defined colonies (Figure 5i).
Crystal aggregates were also detected close to the microbial colonies. These structures were not isolated, but microbial cells and filamentous matrix was observed between the mineral aggregates (Figure 5a,d,i). To determine the elemental composition of these mineral structures, EDX analysis was performed.
The detected elements in the analyzed spot were carbon, oxygen, nitrogen and calcium (Figure 6). Since the analysis revealed the presence of Ca as only detectable mineral, it is plausible that this element was part of the mineral salt composition. Mineral precipitation can occur under different conditions, but in natural ecosystems, where microorganisms are present, minerals are often involved in microbial metabolisms. Precipitation and/or dissolution of Ca-containing minerals is a widespread ability in the microbial world [34]. As previously described, filamentous matrices are present on and between the crystal structures. This could confirm our hypothesis that microbes are producing and/or exploiting these mineral aggregates.
While the imaging was performed, several surface modifications, such as cracks and holes, were also noticed. Interestingly, the majority of these structures were compatible in size and shape with the microbial cells previously described (Figure 7a,b). A closer look to the epoxy surface below the microbial cells revealed some depressions with a shape similar to the microbial structures (Figure 7c,d). Additional tests should be performed to draw definitive conclusion, but these results may suggest a first step of microbiologically driven depolymerization of parts of the samples surface.

3.2.2. Isolation and Identification of Microbes

Isolations were carried out by incubating water and epoxy samples from the tank containing the microbiological water in selective media containing the minerals necessary for microbial growth and epoxy powder, without the addition of an alternative carbon source. Based on color and colony morphologies, two fungi and three bacteria have been isolated. The presence of two distinct fungi was detected after four days of incubation. The first one (ER-F1) appeared white and woolly after four days of incubation, then after six days it turned to green, becoming more powdery and dense (Figure 8a,b). The second one (ER-F2) was characterized by black color, far less dense mycelium and the presence of visible conidiophores (Figure 8c). In addition, three bacteria were isolated from the water of the tank. Two of them (ER-BacA and ER-BacB) were growing close to each other. They had an opaque yellowish aspect, but since they had different dimensions, they were considered as distinct bacterial colonies. Another bacterial colony (ER-BacD) growing in a different zone of the Petri dish with more transparent appearance were also detected (Figure 8d).
All isolated fungi have been successfully identified through sequencing of the ITS rDNA region and comparison with known sequences using NCBIs’ Basic Local Alignment Tool (BLASTn) on the Genbank database. Sequencing data from ER-F1 showed 99.65% homology with Trichoderma harzianum ITEM908 (accession number OL831174). Sequencing data from ER-F2 showed 99.44% homology with Aspergillus calidoustus Kw18-1 (accession number OL831175). Identification of bacterial isolates was performed by 16S ribosomal RNA (rRNA) sequencing. Data allow to identify ER-BacA and ER-BacB both as Variovorax sp. (99.61% and 100% homology with Variovorax sp. 3LII(+)_OTU11, respectively) (accession numbers OL831168 and OL831169). Finally, sequencing data from ER-BacD showed 99.62% homology with Methyloversatilis discipulorum FAM1 (accession number OL831170).

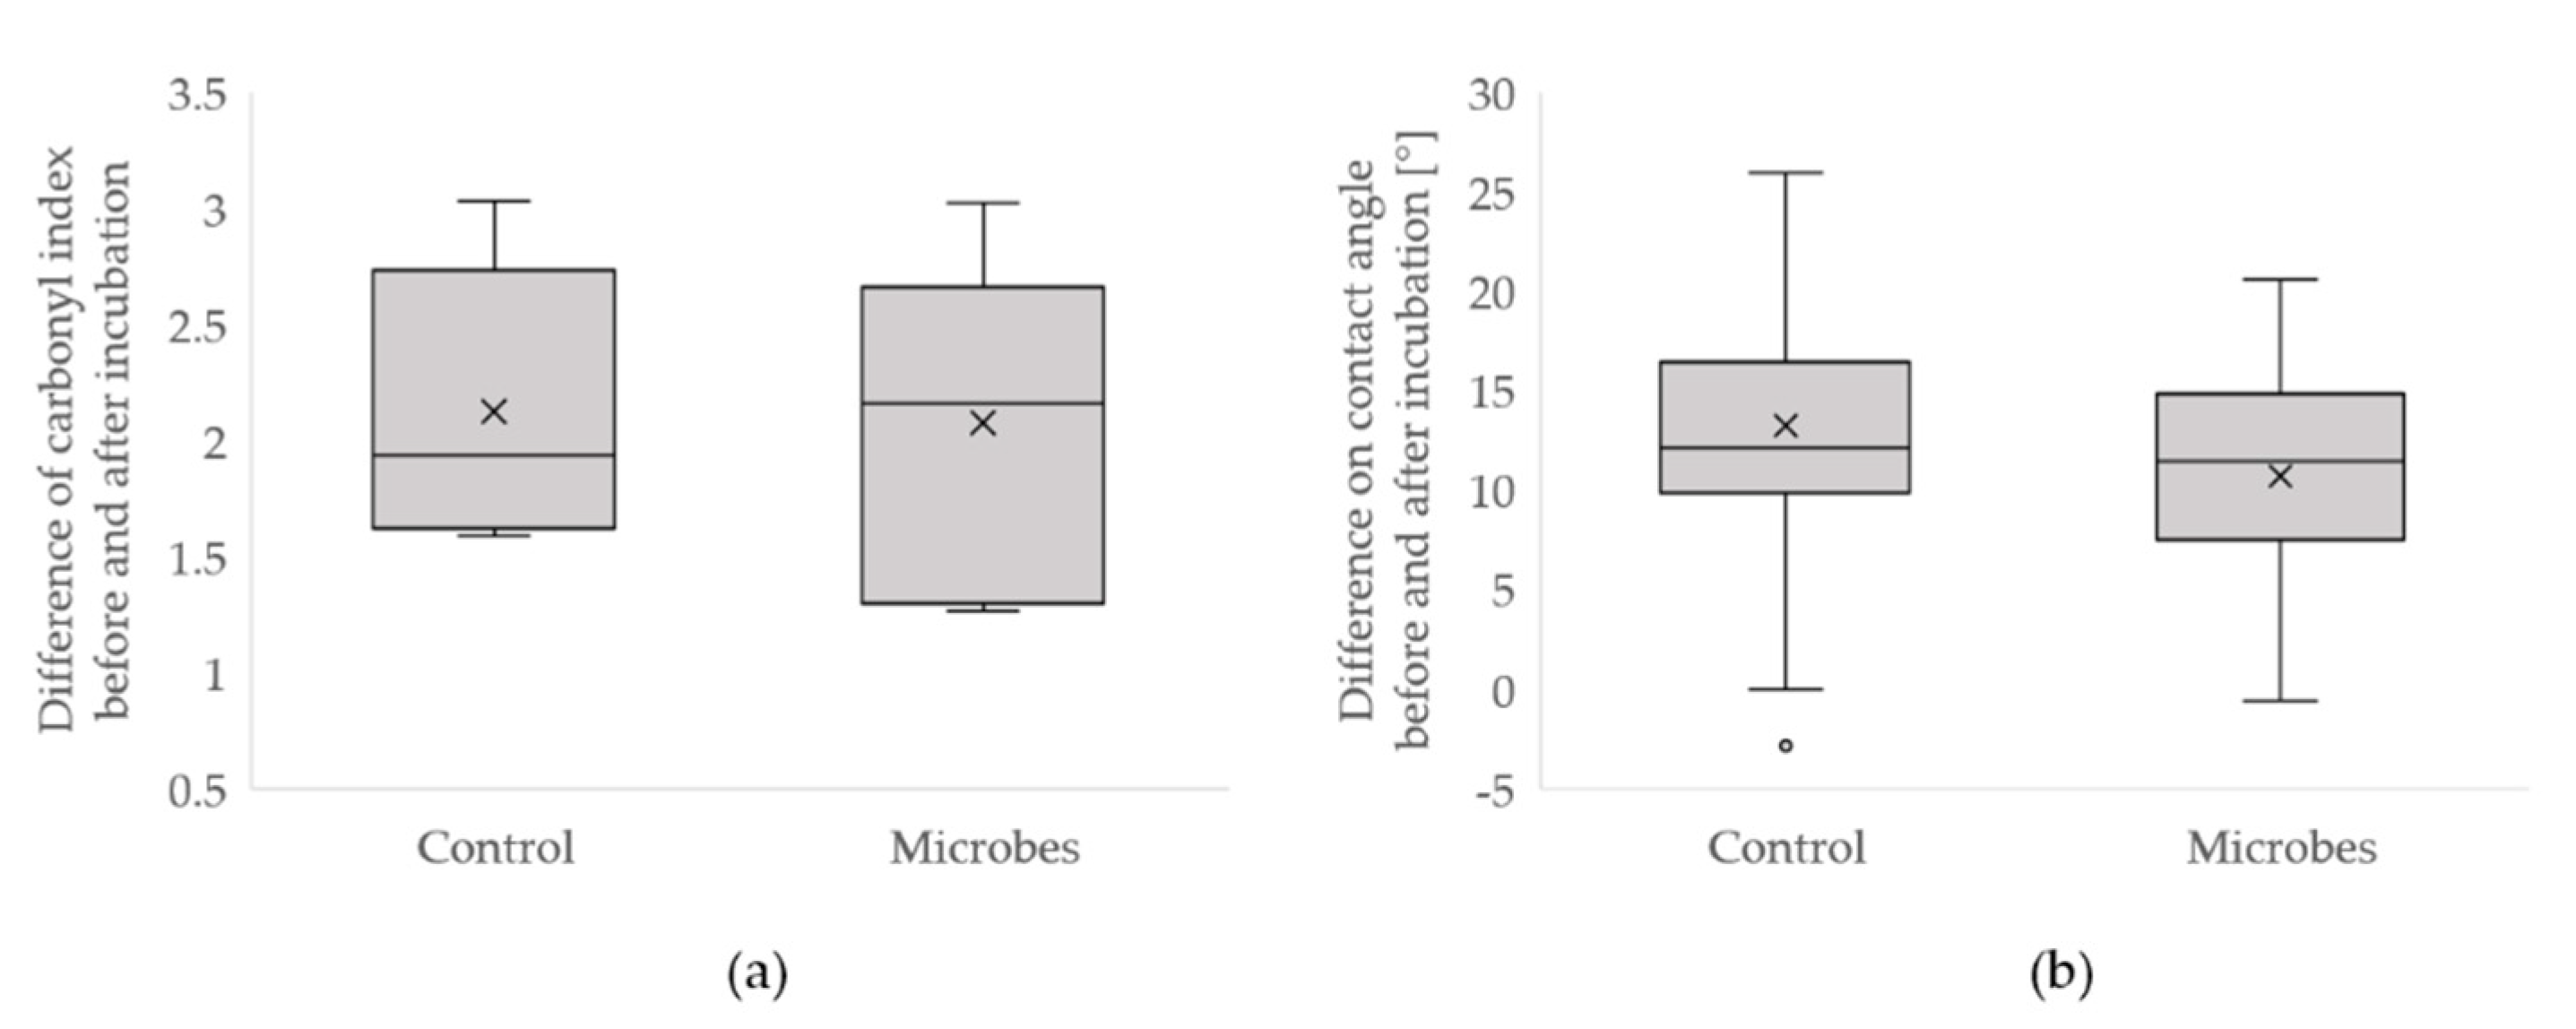
3.2.3. New Samples Incubated for Three Months in the Microbiological Water

Small epoxy cubes were incubated in the microbiological water for three months. Morphological ESEM mapping was performed before and after incubation on the same area to obtain more information on the colonization dynamics of the microbiome present in this aquatic ecosystem. Results revealed that, after three months, two types of microbes were presents on the sample surface. Colonies of quasi-spherical microbial cells with a diameter of roughly 10 µm similar to the one present in the older samples were identified in several area of the samples after incubation. Some filamentous matrix was also visible between the cells and attached to the epoxy surface (Figure S6). Furthermore, isolated filamentous structures were also detected in other areas of the same sample. These structures were not present on the samples before incubation. Hence, it can be concluded that these are the first colonizer of the epoxy samples and that the microbial community present on this aquatic ecosystem is still active. In fact, filamentous matrices are attached to the surface and between the cells, which rules out the possibility that these microbial structures were present in the water and simply settled on the surface by gravity.
In order to test the depolymerization potential of the microbial communities present on the microbiological water, larger epoxy samples were also incubated for 3 months, and several analyses were carried out. Overall, differences between data collected before and after incubation was detected for all the samples including the controls. Therefore, to facilitate data interpretation, the difference between data collected on samples before and after exposure was calculated for the controls and the samples incubated in the microbiological water (microbes). Concerning the carbonyl index, no significant differences were detected (Figure 9a). In contrast, contact angle data show a slight, but significant difference in the average from the values of control and samples treated with microbiological water. Surprisingly, difference in contact angle data between before and after incubation were higher in controls samples comparing with the treated ones.
On the other hand, colorimetric data showed some interesting differences in terms of visual appearance. In Figure 10, all the tested color coordinates (L*, a* and b*) showed significant differences between controls and samples incubated with microbes. This indicated a change in the properties of the epoxy induced by incubation in the microbiological water. Explicitly, difference in brightness values increased from 3.43 for the controls samples to 3.47 for the samples treated with microbiological water. The same trend could be noticed for a* and b* color coordinates. Indeed a higher difference of both these values was detected for samples treated with microbiological water compared with the controls (Figure 10b,c). Comparing these data with the colorimetric plot (Figure S7) it can be clearly seen a general shift of the color coordinates measured on the samples after treatment toward yellow and red (less green and less blue). This change in color coordinates measured on the samples after treatment was more pronounced in samples incubated in microbiological water. However, it is notable that, even though these changes are statistically significant, they are minimal changes, which are not perceivable to the human eye.
Together, these results are clearly not sufficient to draw any conclusion about microbial depolymerization of the epoxy surface. To obtain more significant results, samples should be incubated for a longer time.

4. Discussion

Overall, the results concerning the microcosms experiment are not sufficient to assess the potential of the tested fungus for the depolymerization of epoxy samples. Nevertheless, contact angle measurements showed that the fungus G. adspersum might be able to decrease the hydrophobicity of the epoxy surface more efficiently than the other tested conditions (untreated, UV treated and soil). This is an interesting result; G. adspersum is a withe-rot fungus, able to degrade lignin [35]. It is widely recognized that this phenolic compound is synthetized by plants for protection and structural purposes and it is composed by a strong hydrophobic meshwork [36]. However, fungi that are able to degrade lignin overcome this issue by the production of oxidative extracellular enzymes, able to attack this compound, such as peroxidases (lignin peroxidase and manganese peroxidase) and phenol oxidases (e.g., laccases). Therefore, it can be supposed that one or more of these enzymes could have partially oxidized the epoxy surface and reduced its hydrophobicity.
On the other hand, the data on the microbiological water allowed us to acquire more knowledge on the underexplored field of microbial depolymerization of epoxy-related materials. Indeed, as previously described, ESEM analysis revealed an intense microbial colonization on the surface of the older epoxy samples composed of microbes with different sizes and shapes. To the best of our knowledge, this is the first description of an abundant microbial colonization of a pure epoxy material in fresh water. In fact, very little is known on the microbial colonization and depolymerization of solid epoxy materials. Experimental evidence has described microbial colonization of epoxy varnish in marine water [17], revealing that, in the presence of Pseudomonas putida, the corrosion resistance of the coating was lower than in the samples just with marine water. Pangallo et al. (2015) [19] investigated the microflora responsible for the deterioration of an epoxy statue exposed to outdoor conditions. Through a culture-independent approach, Chlorella angustoellipsoidea was detected. This is a green algal microorganism, often associated with lichen [19]. The size and shape of these green algae show close similarity to those detected on the surface of the epoxy samples analyzed after more than 3 years in the microbiological water. Mineral aggregates were also discovered in this water, and these could be the results of microbial metabolisms. Indeed, biogenic mineral precipitation is a common ability of microbes. For instance, Monger et al. (1991) [37] reported that fungi and bacteria from desert soil were able to precipitate calcite, the most abundant CaCO3 polymorph, when cultured in Ca-rich media. Experimental evidences demonstrated that bacteria isolated from cave environments were able to precipitate CaCO3, producing three polymorphs—aragonite, calcite and vaterite [38]. Similarly, experimental evidence reported that some ureolytic bacteria isolated from sludge and calcareous soil precipitated crystals of CaCO3 in an enzymatic reaction catalyzed by ureases and carbonic anhydrases [39,40]. According to Banks et al. (2010) [38], biogenic CaCO3 formation is a fundamental defensive mechanism induced by microbes in order to prevent toxic effects and cell death provoked by excess of Ca in soil. Hence, one possible interpretation is that the microbes present in the microbiological water were precipitating CaCO3 to decrease the concentration of this ion in the medium. In fact, IC analysis of the water revealed that Ca was the most abundant ion in this environment (28.6 g/L, Supplementary Table S1). However, carbonate is not the only Ca-containing mineral involved in microbial metabolisms. It is well known that microbes are able to both produce [41,42] and dissolve [41,43,44] calcium oxalates. Oxalic acid is indeed a low molecular weight organic acid, frequently produced by microorganisms, with diverse roles in the microbial world, such as fungal wood degradation [45], microbial minerals weathering [46,47], nutrients acquisition [47], metal tolerance [48,49] and pathogenicity [50,51]. Further analysis should precisely identify the chemical composition of these crystals, but their presence close and/or inside the discovered microbial biofilms suggest that this microbiome is active. This hypothesis is also supported by the abundant presence of biofilm on the surface of the analyzed samples, as well as the colonization of new samples incubated for three months in the same environment. Aiming to study the microbial composition of this microbiome and to obtain pure culture of microbes potentially able to depolymerize epoxy resin, isolation in selective media was performed. Four different microbes were identified. The first one was the fungus T. hazardinus; organisms belonging to this genus are characterized by the ability to grow in different environments. This fungus was previously isolated from plants [52,53], wet and flatlands [54] and marine environments [55,56]. Some species of the genus Trichoderma are studied for their abilities in biodegradation of organic pollutants such as cyanide [57], pesticides [56,58], polycyiclic aromatic hydrocarbons [59] and poly(lactic acid) [60]. The second one was Aspergillus claidoustus, fungi belonging to this species can also be found both in outdoor [61,62] and indoor environments [63,64]. Strains of A. calidoustus find applications in degradation of biodegradable plastics [65] and petroleum [66]. ER-BacA and ER-BacB were both identified as Variovorax sp., and they had 99.61% sequence identity between each other. These bacteria are interesting because they have been described in several biodegradation applications. Some examples of compounds degraded by bacteria belonging to the Variovorax genus are phytates [67], insecticides [68], arsenite [69] and m-nitrophenol [70]. The last bacterial isolate (ER-BacD) was identified as Methyloversatilis sp. This bacterium belongs to a recently discovered genus [71] and only three different species have been described so far. The bacteria belonging to this genus are characterized by the capacity to grow and feed on either single or multi-carbon sources such as organic acids, alcohols, aromatic compounds, methanol and methylamine [72]. Some examples of compounds biodegraded by isolates of the Methyloversatilis genus are methanol [73], ammonia-containing molecules [74] and herbicides [75]. The results of the phylogenetic analysis revealed that the closest strain to ER-BacD was M. discipulorum FAM1, with a 99.62% of sequence identity, the first ever strain identified as M. discipulorum that is able to grow in the presence of phenol, methoxyphenol and naphthalene [72]. Epoxy resins are composed of phenolic monomers. Therefore, the isolated strain of M. discipulorum could be one of the microbes responsible for the surface modifications observed on the epoxy.
It is well known that culturable microbes represent only a minimal fraction of the microbial world. Therefore, to obtain more complete information on the overall composition of the discovered microbial community, phylogenetic and metagenomic approaches, such as next-generation sequencing, should also be undertaken.
In conclusion, the detected morphological modifications (holes and cracks) on the surface below the microbial cells also support the hypothesis that this microbial community is active and could be responsible for these modifications. This would imply that one or more microbes were able to partially depolymerize the epoxy. These are encouraging results, which would be strengthened by further research. In particular, the metabolic ability and the depolymerization capacity and pathways of pure cultures of isolated microbes, as well as of G. adspersum, could provide new opportunities for the development of more sustainable and efficient biotechnological methods for the recycling and upcycling of epoxy related materials.

Supplementary Materials

The following can be downloaded at: https://www.mdpi.com/article/10.3390/app12010466/s1, Figure S1: Bending modulus (Ef in GPa) of the samples incubated in microcosms with different conditions; Figure S2: Bending strength (σf max in MPa) of the samples incubated in microcosms with different conditions; Figure S3: Strain at failure (εB in %) of the samples incubated in microcosms with different conditions; Figure S4: Contact angle measurements on the epoxy samples incubated in the microcosms with different conditions; Figure S5: Graphics presenting the carbonyl and hydroxyl indexes calculated from the FTIR interferograms recorded on the epoxy samples; Figure S6: Morphological ESEM mapping of the epoxy cube incubated for 3 months in the microbiological water before and after the incubation; Figure S7: Colorimetry plot representing color coordinates a* (red-green opponent colors) and b* (yellow-blue opponent color) recorded on the control and epoxy samples incubated for three months in the microbiological water; Table S1:Percentage of weight loss of the epoxy samples incubated in the microcosms for 6 months; Table S2: Results of the analysis performed with ion chromatography (IC) on the microbiological water sampled before the experiment, showing the ionic composition of the water environment.

Author Contributions

L.P.-C. and M.B. designed the study; L.P.-C., M.H., A.C., Z.P. and S.R. performed the experiments; L.P.-C., A.C., Z.P. and S.R. participated in data analysis; L.P.-C. wrote the manuscript with the help of M.B., I.B. and M.T. for review and editing. All authors contributed to the article and approved the submitted version. All authors have read and agreed to the published version of the manuscript.

Funding

This research received no external funding.

Institutional Review Board Statement

Not applicable.

Informed Consent Statement

Not applicable.

Data Availability Statement

The data presented in this study are openly available in online repository (Genbank; https://www.ncbi.nlm.nih.gov/genbank/, accession numbers: OL831174, OL831175, OL831168, OL831169, OL831170), and on the supplementary materials.

Acknowledgments

We would like to thank Andreas J. Brunner for providing advice in data analysis, Marcel Rees for laboratory assistance during the preparation of the epoxy samples, Robin Pauer from the Electron Microscopy Center of Empa for the ESEM and EDX investigations and Michela Ruinelli and Sophie De Respinis for the assistance during microbial identification.

Conflicts of Interest

The authors declare no conflict of interest.

References

  1. Geyer, R.; Jambeck, J.R.; Law, K.L. Production, use, and fate of all plastics ever made. Sci. Adv. 2017, 3, e1700782. [Google Scholar] [CrossRef] [Green Version]
  2. Esposito, M.; Tse, T.; Soufani, K. Is the circular economy a new fast-expanding market? Thunderbird Int. Bus Rev. 2017, 59, 9–14. [Google Scholar] [CrossRef]
  3. Campbell, F.C. Structural Composite Materials; ASM International: Geauga County, OH, USA, 2010. [Google Scholar]
  4. Palucka, T.; Bensaude-Vincent, B. Composites Overview. 2002. Available online: http://authors.library.caltech.edu/5456/1/hrst.mit.edu/hrs/materials/public/composites/Composites_Overview.htm (accessed on 26 July 2017).
  5. Das, S.; Warren, J.; West, D.; Schexnayder, S.M. Global Carbon Fiber Composites Supply Chain Competitiveness Analysis; Oak Ridge National Laboratory: Oak Ridge, TN, USA; The University of Tennessee: Knoxville, TN, USA, 2016. [Google Scholar]
  6. Kunststoffe, A.V.K. Carbon Composites in Composites Market Report. 2016. Available online: https://www.carboncomposites.eu/media/2448/marktbericht_2016_ccev-avk (accessed on 26 July 2017).
  7. Teuten, E.L.; Saquing, J.M.; Knappe, D.R.; Barlaz, M.A.; Jonsson, S.; Björn, A. Transport and release of chemicals from plastics to the environment and to wildlife. Philos. Trans. R. Soc. Lond. B Biol. Sci. 2009, 364, 2027–2045. [Google Scholar] [CrossRef] [Green Version]
  8. Longana, M.L.; Yu, H.; Jalavand, M.; Wisnom, M.R.; Potter, K.D. Multiple closed loop recycling of carbon fibre composites with the HiPerDiF (High Performance Discontinuous Fibre) method. Compos. Struct. 2016, 153, 271–277. [Google Scholar] [CrossRef] [Green Version]
  9. Longana, M.L.; Yu, H.; Jalavand, M.; Wisnom, M.R.; Potter, K.D. Aligned discontinuous intermingled reclaimed/virgin carbon fibre composites for high performance and pseudo-ductile behaviour in interlaminated carbon-glass hybrids. Compos. Sci. Technol. 2017, 143, 13–21. [Google Scholar] [CrossRef] [Green Version]
  10. Feraboli, P.; Kawakami, H.; Wade, B.; Gasco, F.; DeOto, L.; Masini, A. Recyclability and reutilization of carbon fiber fabric/epoxy composites. J. Compos. Mater. 2012, 46, 1459–1473. [Google Scholar] [CrossRef]
  11. Pimenta, S.; Pinho, S.T. The effect of recycling on the mechanical response of carbon fibres and their composites. Compos. Struct. 2012, 94, 3669–3684. [Google Scholar] [CrossRef] [Green Version]
  12. Materials, K.K.T.N. Composite Recycling. 2010, pp. 1–26. Available online: https://compositesuk.co.uk/system/ (accessed on 26 July 2017).
  13. Tiso, T.; Narancic, T.; Wei, R.; Pollet, E.; Beagan, N.; Schröder, K.; Honak, A.; Jiang, M.; Shane, T.K.; Kenny, T.S.; et al. Towards bio-upcycling of polyethylene terephthalate. Metab. Eng. 2021, 66, 167–178. [Google Scholar] [CrossRef]
  14. Wagner, P.; Ray, R.; Hart, K.; Little, B.; Bradley, W. Microbial Degradation at Stressed Fiber Reinforced Polymeric Composites; Hitachi LDT Kanagawa (Japan) Production Engineering Research Lab: Tokyo, Japan, 1995. [Google Scholar]
  15. Cappitelli, F.; Principi, P.; Pedrazzani, R.; Toniolo, L.; Sorlini, C. Bacterial and fungal deterioration of the Milan Cathedral marble treated with protective synthetic resins. Sci. Total Environ. 2007, 385, 172–181. [Google Scholar] [CrossRef]
  16. Gu, J.-D. Microbiological deterioration and degradation of synthetic polymeric materials: Recent research advances. Int. Biodeterior. Biodegrad. 2003, 52, 69–91. [Google Scholar] [CrossRef]
  17. Wang, G.; Chai, K.; Wu, J.; Liu, F. Effect of Pseudomonas putida on the degradation of epoxy resin varnish coating in seawater. Int. Biodeterior. Biodegrad. 2016, 115, 156–163. [Google Scholar] [CrossRef]
  18. Gu, J.-D.; Ford, T.; Thorp, K.; Mitchell, R. Microbial growth on fiber reinforced composite materials. Int. Biodeter. 1996, 37, 197–204. [Google Scholar] [CrossRef]
  19. Pangallo, D.; Bučková, M.; Kraková, L.; Puškárová, A.; Šaková, N.; Grivalský, T.; Chovanová, K.; Zemánková, M. Biodeterioration of epoxy resin: A microbial survey through culture-independent and culture-dependent approaches. Environ. Microbiol. 2015, 17, 462–479. [Google Scholar] [CrossRef]
  20. Eliaz, N.; Ron, E.Z.; Gozin, M.; Younger, S.; Biran, D.; Tal, N. Microbial degradation of epoxy. Materials 2018, 11, 2123. [Google Scholar] [CrossRef] [Green Version]
  21. Cameron, M.D.; Timofeevski, S.; Aust, S.D. Enzymology of Phanerochaete chrysosporium with respect to the degradation of recalcitrant compounds and xenobiotics. Appl. Microbiol. Biotechnol. 2000, 54, 751–758. [Google Scholar] [CrossRef]
  22. Wong, D.W.S. Structure and Action Mechanism of Ligninolytic Enzymes. Appl. Biochem. Biotechnol. 2008, 157, 174–209. [Google Scholar] [CrossRef]
  23. Delgado-Baquerizo, M.; Eldridge, J.D.; Hamonts, K.; Singh, B.K. Ant colonies promote the diversity of soil microbial communities. ISME J. 2019, 13, 1114–1118. [Google Scholar] [CrossRef]
  24. Ginzburg, O.; Whitford, W.G.; Steinberger, Y. Effects of harvester ant (Messor spp.) activity on soil properties and microbial communities in a Negev Desert ecosystem. Biol. Fertil. 2008, 45, 165–173. [Google Scholar] [CrossRef]
  25. Brosius, J.; Dull, T.J.; Sleeter, D.D.; Noller, H.F. Gene organization and primary structure of a ribosomal RNA operon from Escherichia coli. J. Mol. Biol. 1981, 148, 107–127. [Google Scholar] [CrossRef]
  26. Alijani Mamaghani, N.; Javan-Nikkhah, M.S.H.; De Respinis, S.; Pianta, E.; Tonolla, M. Endophytic Cephalotrichum spp. from Solanum tuberosum (potato) in Iran—A polyphasic analysis. Sydowia. Submitted.
  27. Ausubel, F.M.; Kingston, R.E.B.R.; Moore, D.D.; Seidman, J.G.; Smith, J.A.; Struhl, K. Current Protocols in Molecular Biology; Greene Publishing Associated & Wiley Interscience: New York, NY, USA, 1989. [Google Scholar]
  28. White, T.J.; Bruns, T.; Lee, S.; Taylor, J. Amplification and direct sequencing of fungal ribosomal RNA genes for phylogenetics. PCR Protoc. 1990, 18, 315–322. [Google Scholar]
  29. Hall, B.G. Building Phylogenetic Trees from Molecular Data with MEGA. Mol. Biol. Evol. 2013, 30, 1229–1235. [Google Scholar] [CrossRef] [Green Version]
  30. Edgar, R.C. MUSCLE: Multiple sequence alignment with high accuracy and high throughput. Nucleic Acids Res. 2004, 32, 1792–1797. [Google Scholar] [CrossRef] [Green Version]
  31. ASTM D1557-12e1; Standard Test Methods for Laboratory Compaction Characteristics of Soil Using Modified Effort (56,000 ft-lbf/ft3 (2700 kN-m/m3)). ASTM International: West Conshohocken, PA, USA, 2012. Available online: https://www.astm.org/ (accessed on 23 April 2021).
  32. Domagała, I.; Gil, L.; Firlej, M.; Pieniak, D.; Selech, J.; Romek, D.; Biedziak, B. Statistical Comparison of the Hardness and Scratch-Resistance of the PMMA Polymers Used in Orthodontic Appliances. Adv. Sci. Technol. Eng. Syst. J. 2020, 14, 250–261. [Google Scholar] [CrossRef]
  33. ISO Standard DIN EN ISO 14125 A 2013 (Fibre-Reinforced Plastic Composites—Determination of Flexural Properties). Available online: https://www.iso.org/standard/23637.html (accessed on 21 July 2021).
  34. Reddy, M.S. Biomineralization of calcium carbonates and their engineered applications: A review. Front Microbiol. 2013, 4, 314. [Google Scholar]
  35. Songulashvili, G.; Elisashvili, V.; Wasser, S.; Nevo, E.; Hadar, Y. Laccase and manganese peroxidase activities of Phellinus robustus and Ganoderma adspersum grown on food industry wastes in submerged fermentation. Biotechnol. Lett. 2006, 28, 1425–1429. [Google Scholar] [CrossRef]
  36. Sitarz, A.K.; Mikkelsen, J.D.; Højrup, P.; Meyer, A.S. Identification of a laccase from Ganoderma lucidum CBS 229.93 having potential for enhancing cellulase catalyzed lignocellulose degradation. Enzyme Microb. Technol. 2013, 53, 378–385. [Google Scholar] [CrossRef]
  37. Monger, H.C.; Curtis, H.; Daugherty Lindemann, L.A.; Liddell, C.W.; Craig, M. Microbial precipitation of pedogenic calcite. Geology 1991, 19, 997–1000. [Google Scholar] [CrossRef]
  38. Banks, E.D.; Taylor, M.N.; Gulley, J.; Lubbers, B.R.; Giarrizzo, J.G.; Bullen, H.A.; Hoehler, T.M.; Barton, A.H. Bacterial calcium carbonate precipitation in cave environments: A function of calcium homeostasis. Geomicrobiol. J. 2010, 27, 444–454. [Google Scholar] [CrossRef]
  39. Al-Thawadi, S.M. Ureolytic bacteria and calcium carbonate formation as a mechanism of strength enhancement of sand. J. Adv. Sci. Eng. Res. 2011, 1, 98–114. [Google Scholar]
  40. Dhami, N.K.; Reddy, M.S.; Mukherjee, A. Biomineralization of calcium carbonate polymorphs by the bacterial strains isolated from calcareous sites. J. Microbiol. Biotechnol. 2013, 23, 707–714. [Google Scholar] [CrossRef] [Green Version]
  41. Guggiari, M.; Bloque, R.; Aragno, M.; Verrecchia, E.; Job, D.; Junier, P. Experimental calcium-oxalate crystal production and dissolution by selected wood-rot fungi. Int. Biodeter. 2011, 65, 803–809. [Google Scholar] [CrossRef] [Green Version]
  42. Gadd, G.M.; Bahri-Esfahani, J.; Li, Q.; Rhee, J.G.; Wei, Z.; Fomina, M.; Liang, X. Oxalate production by fungi: Significance in geomycology, biodeterioration and bioremediation. Fungal Biol. Rev. 2014, 28, 36–55. [Google Scholar] [CrossRef]
  43. Simon, A. Highways and Subways: A Story of Fungi and Bacteria in Soils. Ph.D. Thesis, University of Neuchatel, Neuchâtel, Switzerland, 2016. [Google Scholar]
  44. Hervé, V.; Junier, T.; Bindschedler, S.; Verrecchia, E.; Junier, P. Diversity and ecology of oxalotrophic bacteria. World J. Microbiol. Biotechnol. 2016, 32, 28. [Google Scholar] [CrossRef]
  45. Mäkelä, M.; Galkin, S.; Hatakka, A.; Lundell, T. Production of organic acids and oxalate decarboxylase in lignin-degrading white rot fungi. Enzyme Microb. Technol. 2002, 30, 542–549. [Google Scholar] [CrossRef]
  46. Becerra-Castro, C.; Kidd, P.; Kuffner, M.; Prieto-Fernández, Á.; Hann, S.; Monterroso, C.; Sessitsch, A.; Wenzel, W.; Puschenreiter, M. Bacterially Induced Weathering of Ultramafic Rock and Its Implications for Phytoextraction. Appl. Environ. Microbiol. 2013, 79, 5094–5103. [Google Scholar] [CrossRef] [Green Version]
  47. Arvieu, J.-C.; Leprince, F.; Plassard, C. Release of oxalate and protons by ectomycorrhizal fungi in response to P-deficiency and calcium carbonate in nutrient solution. Ann. For. Sci. 2003, 60, 815–821. [Google Scholar] [CrossRef]
  48. Hamel, R.; Levasseur, R.; Appanna, V.D. Oxalic acid production and aluminum tolerance in Pseudomonas fluorescens. J. Inorg. Biochem. 1999, 76, 99–104. [Google Scholar] [CrossRef]
  49. Fomina, M.; Hillier, S.; Charnock, J.M.; Melville, K.; Alexander, I.J.; Gadd, G.M. Role of Oxalic Acid Overexcretion in Transformations of Toxic Metal Minerals by Beauveria caledonica. Appl. Environ. Microbiol. 2005, 71, 371–381. [Google Scholar] [CrossRef] [Green Version]
  50. Nakata, P.A. The oxalic acid biosynthetic activity of Burkholderia mallei is encoded by a single locus. Microbiol. Res. 2011, 166, 531–538. [Google Scholar] [CrossRef]
  51. Van Kan, J.A.; Shaw, M.W.; Grant-Downton, R.T. Botrytis species: Relentless necrotrophic thugs or endophytes gone rogue? Mol. Plant. Pathol. 2014, 15, 957–961. [Google Scholar] [CrossRef]
  52. Bolaños, B.T.; Hernández, H.G.; Mejía, E.Z.; García, P.S.; Aguilera, G.M.; Díaz, C.N.; Laborde, J.I.D.R.; Cortes, R.R. Colonización de Trichoderma y Bacillus en Plántulas de Agave tequilana Weber, var. Azul y el Efecto Sobre la Fisiología de la Planta y Densidad de Fusarium. Rev. Mex. Fitopatol. 2014, 32, 62–74. [Google Scholar]
  53. Marzano, M.; Gallo, A.; Altomare, C. Improvement of biocontrol efficacy of Trichoderma harzianum vs. Fusarium oxysporum f. sp. lycopersici through UV-induced tolerance to fusaric acid. Biol. Control. 2013, 67, 397–408. [Google Scholar]
  54. Saravanakumar, K.; Yu, C.; Dou, K.; Wang, M.; Li, Y.; Chen, J. Biodiversity of Trichoderma community in the tidal flats and wetland of southeastern China. PLoS ONE 2016, 11, e0168020. [Google Scholar] [CrossRef]
  55. Greco, G.; Cecchi, G.; Di Piazza, S.; Cutroneo, L.; Capello, M.; Zotti, M. Fungal characterisation of a contaminated marine environment: The case of the Port of Genoa (North-Western Italy). Webbia 2018, 73, 97–106. [Google Scholar] [CrossRef]
  56. Vacondio, B.; Birolli, W.G.; Ferreira, I.M.; Seleghim, M.H.R.; Gonçalves, S.; Vasconcellos, S.P.; Porto, A.L.M. Biodegradation of pentachlorophenol by marine-derived fungus Trichoderma harzianum CBMAI 1677 isolated from ascidian Didemnun ligulum. Biocatal. Agric. Biotechnol. 2015, 4, 266–275. [Google Scholar] [CrossRef]
  57. Ezzi, M.I.; Lynch, J.M. Biodegradation of cyanide by Trichoderma spp. and Fusarium spp. Enzym. Microb. Technol. 2005, 36, 849–854. [Google Scholar] [CrossRef]
  58. Baarschers, W.H.; Heitland, H.S. Biodegradation of fenitrothion and fenitrooxon by the fungus Trichoderma viride. J. Agric. Food Chem. 1986, 34, 707–709. [Google Scholar] [CrossRef]
  59. Zafra, G.; Cortés-Espinosa, D.V. Biodegradation of polycyclic aromatic hydrocarbons by Trichoderma species: A mini review. Environ. Sci. Pollut. Res. 2015, 22, 19426–19433. [Google Scholar] [CrossRef]
  60. Lipsa, R.; Tudorachi, N.; Darie-Nita, R.N.; Oprică, L.; Vasile, C.; Chiriac, A. Biodegradation of poly (lactic acid) and some of its based systems with Trichoderma viride. Int. J. Biol. Macromol. 2016, 88, 515–526. [Google Scholar] [CrossRef]
  61. Wang, L. Four new records of Aspergillus sect. Usti from Shandong Province, China. Mycotaxon 2012, 120, 373–384. [Google Scholar] [CrossRef]
  62. De Carvalho, C.R.; Vieira, M.d.L.A.; Cantrell, C.L.; Wedge, D.E.; Alves, T.M.A.; Zani, C.L.; Pimenta, R.S.; Junior, P.A.S.; Murta, S.M.F.; Romanha, A.J.; et al. Biological activities of ophiobolin K and 6-epi-ophiobolin K produced by the endophytic fungus Aspergillus calidoustus. Nat. Prod. Res. 2016, 30, 478–481. [Google Scholar] [CrossRef]
  63. Samson, R.A. Ecology and general characteristics of indoor fungi. In Fundamentals of Mold Growth in Indoor Environments and Strategies for Healthy Living; Springer: Berlin/Heidelberg, Germany, 2011; pp. 101–116. [Google Scholar]
  64. Slack, G.J.; Puniani, E.; Frisvad, J.C.; Samson, R.A.; Miller, J.D. Secondary metabolites from Eurotium species, Aspergillus calidoustus and A. insuetus common in Canadian homes with a review of their chemistry and biological activities. Mycol. Res. 2009, 113, 480–490. [Google Scholar] [CrossRef]
  65. Antipova, T.V.; Zhelifonova, V.P.; Zaitsev, K.V.; Nedorezova, P.M.; Aladyshev, A.M.; Klyamkina, A.N.; Kostyuk, S.V.; Danilogorskaya, A.A.; Kozlovsky, A.G. Biodegradation of Poly-ε-caprolactones and Poly-l-lactides by Fungi. J. Polym. Environ. 2018, 26, 4350–4359. [Google Scholar] [CrossRef]
  66. Ghorbannezhad, H.; Moghimi, H.; Dastgheib, S.M.M. Biodegradation of high-molecular-weight aliphatic and aromatic hydrocarbons by Aspergillus calidoustus. J. Microb. World 2018, 4, 346–359. [Google Scholar]
  67. Sanguin, H.; Wilson, N.L.; Kertesz, M.A. Assessment of functional diversity and structure of phytate-hydrolysing bacterial community in Lolium perenne rhizosphere. Plant Soil 2016, 401, 151–167. [Google Scholar] [CrossRef] [Green Version]
  68. Choi, M.-K.; Kim, K.-D.; Ahn, K.-M.; Shin, D.-H.; Hwang, J.-H.; Seong, C.N.; Ka, J.O. Genetic and Phenotypic Diversity of Parathion-Degrading Bacteria Isolated from Rice Paddy Soils. J. Microbiol. Biotechnol. 2009, 19, 1679–1687. [Google Scholar] [CrossRef] [Green Version]
  69. Zeng, X.-C.; E, G.; Wang, J.; Wang, N.; Chen, X.; Mu, Y.; Li, H.; Yang, Y.; Liu, Y.; Wang, Y. Functions and Unique Diversity of Genes and Microorganisms Involved in Arsenite Oxidation from the Tailings of a Realgar Mine. Appl. Environ. Microbiol. 2016, 82, 7019–7029. [Google Scholar] [CrossRef] [Green Version]
  70. González, A.J.; Fortunato, M.S.; Papalia, M.; Radice, M.; Gutkind, G.; Magdaleno, A.; Gallego, A.; Korol, S.E. Selection and identification of a bacterial community able to degrade and detoxify m-nitrophenol in continuous biofilm reactors. Ecotoxicol. Environ. Saf. 2015, 122, 245–251. [Google Scholar] [CrossRef]
  71. Kalyuzhnaya, M.; De Marco, P.; Bowerman, S.; Pacheco, C.; Lara, J.C.; Lidstrom, M.E.; Chistoserdova, L. Methyloversatilis universalis gen. nov., sp. nov., a novel taxon within the Betaproteobacteria represented by three methylotrophic isolates. Int. J. Syst. Evol. Microbiol. 2006, 56, 2517–2522. [Google Scholar] [CrossRef] [Green Version]
  72. Smalley, N.E.; Taipale, S.J.; De Marco, P.; Doronina, N.V.; Kyrpides, N.; Shapiro, N.; Woyke, T.; Kalyuzhnaya, M. Functional and genomic diversity of methylotrophic Rhodocyclaceae: Description of Methyloversatilis discipulorum sp. nov. Int. J. Syst. Evol. Microbiol. 2015, 65, 2227–2233. [Google Scholar] [CrossRef]
  73. Doronina, N.V.; Kaparullina, E.; Trotsenko, Y.A. Methyloversatilis thermotolerans sp. nov., a novel thermotolerant facultative methylotroph isolated from a hot spring. Int. J. Syst. Evol. Microbiol. 2014, 64, 158–164. [Google Scholar] [CrossRef] [Green Version]
  74. Zhang, X.; Zheng, S.; Zhang, H.; Duan, S. Autotrophic and heterotrophic nitrification-anoxic denitrification dominated the anoxic/oxic sewage treatment process during optimization for higher loading rate and energy savings. Bioresour. Technol. 2018, 263, 84–93. [Google Scholar] [CrossRef]
  75. Cai, T.; Qian, L.; Cai, S.; Chen, L. Biodegradation of Benazolin-Ethyl by Strain Methyloversatilis sp. cd-1 Isolated from Activated Sludge. Curr. Microbiol. 2010, 62, 570–577. [Google Scholar] [CrossRef]
Scheme 1. Schematic representation of the experimental set up, showing the conditions tested for the 48 microcosms prepared for the experiment with the synthetic soil. Microcosm jars are represented by blue containers with grey caps filled with soil in brown. The four epoxy sample replicates are represented in orange-yellow colour. Different tested conditions are represented by the following symbols: —nothing added; Applsci 12 00466 i001—addition of 10 mL of fungal suspension.
Applsci 12 00466 sch001
Figure 1. Colorimetry plot representing color coordinates a* (red/green opponent color) and b* (yellow/blue opponents color) for all the tested samples at different incubation times—1, 3 and 6 months and 6 and 9 months*.
Applsci 12 00466 g001
Figure 2. Shore D hardness measurements of all the tested samples. (a,b) Data showing the results of the samples incubated for 1, 3 and 6 months in the microcosms prepared with a whc of 60% with (a) sterilized and (b) unsterilized soil. (c,d) Results recorded on the samples incubated for in the microcosms prepared with a whc of 90% with (c) sterilized and (d) unsterilized soil. Results of statistical analysis are represented by a and b letters. Different letters are attributed to values having a significant difference (p-value < 0.0016).
Applsci 12 00466 g002
Figure 3. Graphics presenting the carbonyl indexes calculated from the FTIR interferograms recorded on the epoxy samples incubated in the microcosms prepared with a whc of 90% after 9 months* of incubation at different conditions. (a) Carbonyl index of epoxy samples incubated in sterile soil; (b) carbonyl index of epoxy samples incubated in unsterilized soil. Results of statistical analyses are represented by a and b letters. Different letters are attributed to values having a significant difference (p-value < 0.0016).
Applsci 12 00466 g003
Figure 4. Graphs presenting the contact angle measurements on the epoxy samples incubated in the microcosms with a whc of 90% in soil microcosms at different conditions and exposure times. (a) Data showing the results of the samples incubated for 3 and additional 3 months (6 months*) in sterilized soil. (b) Data showing the results of the samples incubated for 6 and additional 3 months (9 months*) in sterilized soil. (c) Data obtained on the samples incubated for 3 and additional 3 months (6 months*) in unsterilized soil. (d) Data showing the results of the samples incubated for 6 and additional 3 months (9 months*) in unsterilized soil. Results of statistical analysis are represented by letters on top of the columns graphs. Different letters are attributed to values having a significant difference (p-value < 0.0016).
Applsci 12 00466 g004
Figure 5. ESEM images of the microbiome colonizing the surface of the epoxy samples removed after more than 3 years of incubation in microbiological water. (ac) The most abundant type of microbes observed in dense colonies or as sessile cells of quasi-spherical shape with crystals aggregates visible between cells, (d,e) rod-like microbial cells, (f,g) quasi-spherical cells with echinulate shape, (h) mixed biofilm composed of microbes of different sizes and shapes and (i) colony of a filamentous structure with crystals aggregates.
Applsci 12 00466 g005
Figure 6. Investigation of the composition of the crystals discovered between the microbial communities on the surface of the epoxy samples incubated in the microbiological water. A white box indicates the area where elemental mapping was performed. On the left, back-scattered electron images of the crystal found on the surface linked with microbes and microbial filamentous matrixes. On the right, back-scattered electrons images of the area subject to elemental mapping with elemental distribution of carbon, calcium, nitrogen and oxygen.
Applsci 12 00466 g006
Figure 7. ESEM images of the observed surface modifications potentially induced by microbial colonization, on the older epoxy samples sampled on the microbiological water. (a) Epoxy surface presenting microbes and holes, (b) closer look at the holes and the different shape of the microbes present close to the surface modifications, (c) typical quasi-spherical shape of the observed microbes with depression on the surface below the cells and (d) closer look at the depression discovered below the microbial cells.
Applsci 12 00466 g007
Figure 8. Photos of some microbes during the isolation process. (a) Fungal green and powdery colony partially growing on epoxy sample; (b) with-grey powdery fungal colony partially growing on epoxy sample; (c) black fungal conidiophores growing from the epoxy sample; (d) bacterial colonies growing on the selective medium containing epoxy powder.
Applsci 12 00466 g008
Figure 9. Box plots representing the differences between data recorded before and after incubation for the control and the samples incubated in the microbiological water for 3 months. (a) Difference in hydroxyl index calculated from FTIR spectra, p-value = 0.89. (b) Difference in contact angle measurements, p-value = 0.003.
Applsci 12 00466 g009
Figure 10. Box plots representing the differences between data recorded before and after incubation for control and samples incubated in the microbiological water for 3 months. (a) Difference in brightness L*, p-value = 1.20 × 10⁻⁷. (b) Difference in the red-green color component (a*), p-value = 3.97 × 10⁻²⁴. (c) Difference in the yellow-blue color component (b*), p-value = 8.96 × 10⁻⁶.
Applsci 12 00466 g010
Publisher’s Note: MDPI stays neutral with regard to jurisdictional claims in published maps and institutional affiliations.

