1. Introduction
Alternative fuels from renewable and sustainable feedstocks represent a viable route to decarbonize the transport sector toward the global targets of Greenhouse Gas (GHG) emissions reduction. Among the various options starting from bio-derived feedstock, such as lipidic and sugar-based feedstocks, lignocellulosic biomass is more attractive thanks to its non-competition vs. food sector, large availability, and low cost, and huge distribution over the globe. Among the conversion routes already available at a commercial scale, including both biological and thermochemical processes, fast pyrolysis of lignocellulosic feedstock is a market-ready conversion pathway with a high Technology Readiness Level (TRL) for rapid growth at the European Union (EU) level [
1]. The main product, called Fast Pyrolysis Bio-Oil (FPBO), is a bio-crude that can be further converted to fuels or valuable bio-based chemicals production [
2]. The conversion process involves the generation of condensable hot organic vapors consisting of fragments of cellulose, hemicellulose, and lignin polymers, obtained through rapid heating of biomass in an inert atmosphere, followed by fast quenching or cooling [
3]. Pure FPBO is not suitable for direct use as a transportation fuel in existing systems due to its chemical and physical properties, such as its high-water content, instability, acidity, and high oxygen content [
4]. Upgrading is, therefore, necessary to improve FPBO quality to meet end-use requirements, up to hydrocarbon fuels (i.e., hydro or catalytic deoxygenation [
5]). Alternatively, FPBO can be fed with crude oil streams in existing refineries as co-processed material for the production of liquid hydrocarbon fuels [
6,
7]. In addition, bio-oils can also be used as feedstock for bio-based chemicals to substitute specific petroleum-derived molecules with organic-derived chemicals (e.g., phenols) [
8]. Developing an effective separation method to extract specific components could be a potential route to improve the bio-oil quality prior to further upgrading (e.g., by removing acidic components and water) and/or extracting valuable organic chemicals for various application.
One possible solution to achieve selective bio-oil fractions consists in taking advantage of the specific temperatures at which the various organic groups go through the condensation step. Two main different approaches are reported in the literature, the first one is fractional distillation which operates on the final liquid products obtained from pyrolysis, while the other approach is the fractional condensation of hot pyrolysis vapors. The latter has the main advantage of minimizing the thermal energy demand compared to distillation, acting directly on a hot vapor stream [
9]. Distillation instead fractionates bio-oil components according to their different volatilities. Nevertheless, fast pyrolysis bio-oils have a thermally unstable behavior due to the high reactivity of organic molecules even at low temperatures (<100 °C), resulting in low yields [
10]. This behavior contrasts with conventional petroleum-derived fuels, namely diesel and kerosene, which have an up to 90 wt.% distillation yield between 220–300 °C and 190–240 °C, respectively [
11]. Literature, such as [
8], confirms that under atmospheric pressure, bio-oil starts boiling below 100 °C, and the distillation process leaves up to 35–50 wt.% of the initial material as a residue. Other distillation techniques for bio-oil applications, such as vacuum and flash distillation, have been extensively used and well described in the literature [
12,
13,
14]: however, technical difficulties in distilling raw FPBO still have to be effectively tackled [
15,
16,
17]. Traditionally, bio-oil cannot be easily distilled because of its high content of reactive oxygenates that give rise to polymerization and condensation reactions [
18]. Described results for direct distillation of bio-oil are not deemed satisfactory, mainly due to the formation of high residue yields as a result of pyrolytic lignin deposition [
19]. Moreover, it is widely known that bio-oils produced from pyrolysis of solid woody biomass show poor thermal stability and aging-related properties that could hinder their path to large-scale applications. Several techniques have been investigated to improve the properties of FPBO, for instance, through the addition of methanol or other alcohols in different proportions to lower the viscosity and delay the aging rate during storage [
20,
21,
22]. Understanding the bio-oil physical and chemical aging mechanisms is still nowadays a key step toward the design of more efficient production and upgrading processes [
23].
Besides that, all bio-oil separation approaches must prove to be economically and environmentally feasible to ensure that the value of the targeted products exceeds the recovery cost [
24]. This implies that the energy demand for recovering a bio-derived fuel should remain a modest fraction of the heating value of the final product itself. Since the distillation of fast pyrolysis bio-oils might not be attractive for the above-mentioned reasons, fractional condensation of bio-oil vapors has been constantly investigated as an effective solution to separate major bio-oil constituents [
25,
26,
27]. Following this approach, the product stream from the fast pyrolysis reactor is generally cooled down and condensed through a series of condensers kept at different temperatures to allow the collection of the different liquid fractions based on their dew point [
28]: condensers temperatures are varied with the aim of reducing the water content of pyrolysis oil [
29,
30]. A higher condenser temperature could be beneficial to the bio-oil quality; however, the application of a higher condensing temperature could result in a loss of lighter organics.
Due to the complex nature of pyrolysis volatiles, researchers generally used a combination of multiple condensation steps to allow for the complete recovery of the liquids by separation from non-condensable gases. Among these technologies, cooling and precipitator systems are some of the most frequently adopted solutions. Electrostatic Precipitators (ESPs) can remove suspended droplets from gas by charging the droplets in a corona discharge and separating them from the gas by means of an electric field [
31]. On the other hand, spray condensers can be defined as contact condensers, and just like jet condensers, they make use of water or some other liquid in direct contact with the vapor to be condensed. When working with pyrolysis vapors, generally, a paraffinic oil or even the bio-product itself is circulated as quench fluid. Some of the advantages of direct-contact condensers are that they are usually simpler in design and less expensive than the surface type. They rely on the simultaneous transfer of heat and mass, therefore resulting in higher condensing effectiveness [
32].
The appearance and composition of the resulting liquid pyrolysis products depend on the type of downstream staged fractionation adopted and the targeted liquid fraction. In addition to a staged approach to the pyrolysis processes in the primary reactor [
33], a further upgrading of bio-oils to transport fuels and chemicals can be achieved by stage-wise fractional condensation. In general, bio-oils collected from first condensers, operating at higher temperatures, contain significantly less water and acetic acid and large amounts of sugars and products of lignin pyrolysis. These fractions are often referred to as feedstocks for transportation fuel and monosaccharide production. The later condensation stages are designed to recover most of the water-soluble compounds with lower molecular weight compounds, such as light oxygenated compounds (e.g., ketones, acids) [
34]. Among the high value-added products derived from pyrolysis of biomass, it is worth also mentioning fertilizer applications meant to improve soil health and harvest yields. Just to cite a significant case, the pyroligneous acid, better known as wood vinegar (WV), has shown favorable properties as biochemical for agriculture [
35].
Generally, fast pyrolysis oil obtained via processing of lignocellulosic biomass is very acidic in nature, and the major component responsible for this property is acetic acid, which is present at levels up to 2–10 wt.% [
36] and responsible for FPBO low pH value (ca. 2–3). For the same reason (including the presence of light organics), aqueous phase products should be considered to be valuable and their further processing investigated within a biorefinery approach and circular economy perspectives [
37]. Acetic acid is an important industrial commodity, with a worldwide production of over eight million tons per year [
38]; its extraction shows some potential to significantly boost the economic attractiveness of the entire bio-oil production process.
The most recent experimental investigations focused on separating groups of target compounds as bio-oil fractions. Condensation temperature ranges are determined based on dew points of specific organic groups, thus allowing for the selective and physical separation between each fraction [
39]. Controlling nitrogen flow [
40] and narrowing cooling temperatures [
26] are key features for maximizing the recovery of liquids. At an industrial scale, the bio-oil itself is used as the condensing medium; however, due to the typical pilot-scale of the experiments available in the literature, generally, researchers used mineral oils as an indirect cooling medium to control the exit cooling temperature of vapors/aerosols [
41,
42]. In general, these paraffinic liquids are employed in direct-spray contact condensers to better control the condensation temperature if compared to the solutions involving jacketed devices [
26]. The quenching of volatiles in an almost immiscible hydrocarbon solvent eases the determination of mass balance and the compositional analysis of liquids also due to the well-known composition of the mineral oil, as demonstrated by Westerhof et al. [
39]. Despite industrial-scale fast pyrolysis plants recirculate bio-oil itself as a quench strategy (see BTG [
43]), from an experimental perspective, the hydrocarbon quench approach should be preferred, given the following advantages:
Freshly produced bio-oil is never mixed with previously produced bio-oil;
Rapid quenching, thanks to the good thermal exchange properties;
No thermal aging, which can instead occur when bio-oil is recirculated as condensing fluid.
From an energy standpoint, controlling the condensation temperature of fast pyrolysis vapors during the process is seen as a viable solution to increase its heating value towards the production of energy carriers with desired and normed qualities. The aim of concentrating the energy in the crude while removing water and heavier compounds from the main vapors stream is pursued by increasing the cooling temperature in the first stages. This approach also allows for other light components, such as aldehydes and acids, which are to be removed with water in the last stages [
39]. Therefore, the integration of the fractional condensation process in biorefinery systems could be beneficial both from an energy and economic standpoint.
The main scope of this study is to integrate the work performed by the SPT group at the Twente University [
39] with higher temperature stages of fractional condensation of fast pyrolysis vapors, observing the produced fractions’ properties and performing a detailed energy assessment of the whole process to generate valuable information for potential scale-ups. The present work introduced an innovative concept for bio-oil condensation at higher temperatures, coupling a pilot-scale fluidized bed reactor with spray condensers to demonstrate the improvement of bio-oil quality by increasing the condensing temperatures in the first stage (100–170 °C) of condensation. This study also confronted another condensation system based on an ESP as benchmark technology to assess the improvements in the liquid product composition. The aim is to demonstrate how the different condensing temperatures affect properties, energy recovery, and the separation of different chemical compounds towards alternative fuels and chemicals. Moreover, the present research also performed an energy assessment of the overall process toward possible industrial upscaling of the fractional condensation of pyrolysis vapors integrating an innovative biorefinery concept.
2. Materials & Methods
2.1. Feedstock
Pine wood was selected as feedstock for the pyrolysis process in the fluidized-bed continuous fast pyrolysis plant. Given its widespread use and applications, the valorization of pine wood-derived industrial waste such as sawdust, chips, shavings, and other forms of processing waste is a route worth to be further developed to meet ever increasingly ambitious renewable energy goals. Among its features, pine wood presents low amounts of nitrogen and ash, and it can withstand different environmental conditions during its life cycle [
44]. Moreover, it presents higher amounts of lignin, cellulose, and nitrogen and a lower content in hemicellulose and extractives when compared with residues derived from herbaceous crops [
45]. As physical pre-treatment, biomass feedstock was ground in particles of 1–2 mm size before being processed in the pilot plant.
2.2. Pyrolysis Unit
Experiments were performed in the 1 kg h
−1 fluidized bed (sand) pyrolysis unit (as described in [
29]) at the SPT group premises at the University of Twente (NL).
Fluidized bed reactors (FBR) are among the most used pyrolysis reactors at the experimental level. Their technology is based on the combination of convection and conduction heat transfer phenomena to effectively convey the heat from the hot sand to the biomass [
46]. This kind of reactor can obtain high bio-oil yields: given their poor thermal conductivity, the biomass particle size must be very small in order to reach the desired gas-solid heat transfer. The volatile mixing of sand with biomass particles leads to high heat and mass transfer coefficients, a favorable condition for fast pyrolysis. FBR can be well scaled up or down to meet different experimental requirements, and, in particular, the process temperature can be conveniently controlled, while catalysts can be introduced in the form of sand. Nevertheless, when considering industrial-scale applications of FBR, the process design and management might present some hurdles like the high volumes of carrier gas leading to considerable sand attrition problems and energy efficiency losses [
47].
Building on a theoretical background [
48], it has been possible to calculate all the functional parameters to achieve steady-state bed fluidization and to reach fast pyrolysis reactions and products. In our case, the bed was indirectly heated by being placed in an electric furnace in which two heating zones could be controlled independently. The main operating conditions and parameters of the process are listed in
Table 1.
The pre-existing layout was specifically modified to meet the required characteristic for the proposed experimental campaign. A simplified scheme of the pilot unit is presented in
Figure 1.
During operation, a Nitrogen flow was fed to the biomass hopper, creating a slight overpressure, which prevented vapors and gases leaving the fluidized bed pyrolysis reactor from flowing back to the hopper via the double screw feeding system. Sand was continuously fed to control the char holdup and to keep constant the bed height in the reactor. It is important to control and to know the char holdup as it catalyzes the cracking of pyrolysis vapors leading to a lower oil yield and influences fluidization behavior.
A mass flow controller was used to set the feed rate of the fluidization flow, keeping a constant sand-to-biomass ratio roughly at around 1.5. Details of the condensation trail are described in the next section.
The vapor/gas stream leaving the reactor results in containing sand fines and a fraction of the produced char. All the sand and most of the char particles were collected in a knockout vessel. A downstream series of three cyclones, equipped with collection vessels, to remove almost all residual char particles.
The gaseous stream leaving the condensing section was mainly composed of non-condensable gases and a mixture of aerosols, which were collected in a tubular cotton gas filter (10 μm). Finally, a dry gas meter was used to measure the gas flow before the main ventilation system.
The custom bubbling fluidized bed reactor (BFBR) allows rapid heating of the biomass particles by mixing them in a stream of moving sand particles at high temperatures. The volatile mixing of sand with biomass particles leads to high heat and mass transfer coefficients. The sand bed is indirectly heated by being placed in an electric furnace in which two heating zones can be controlled independently.
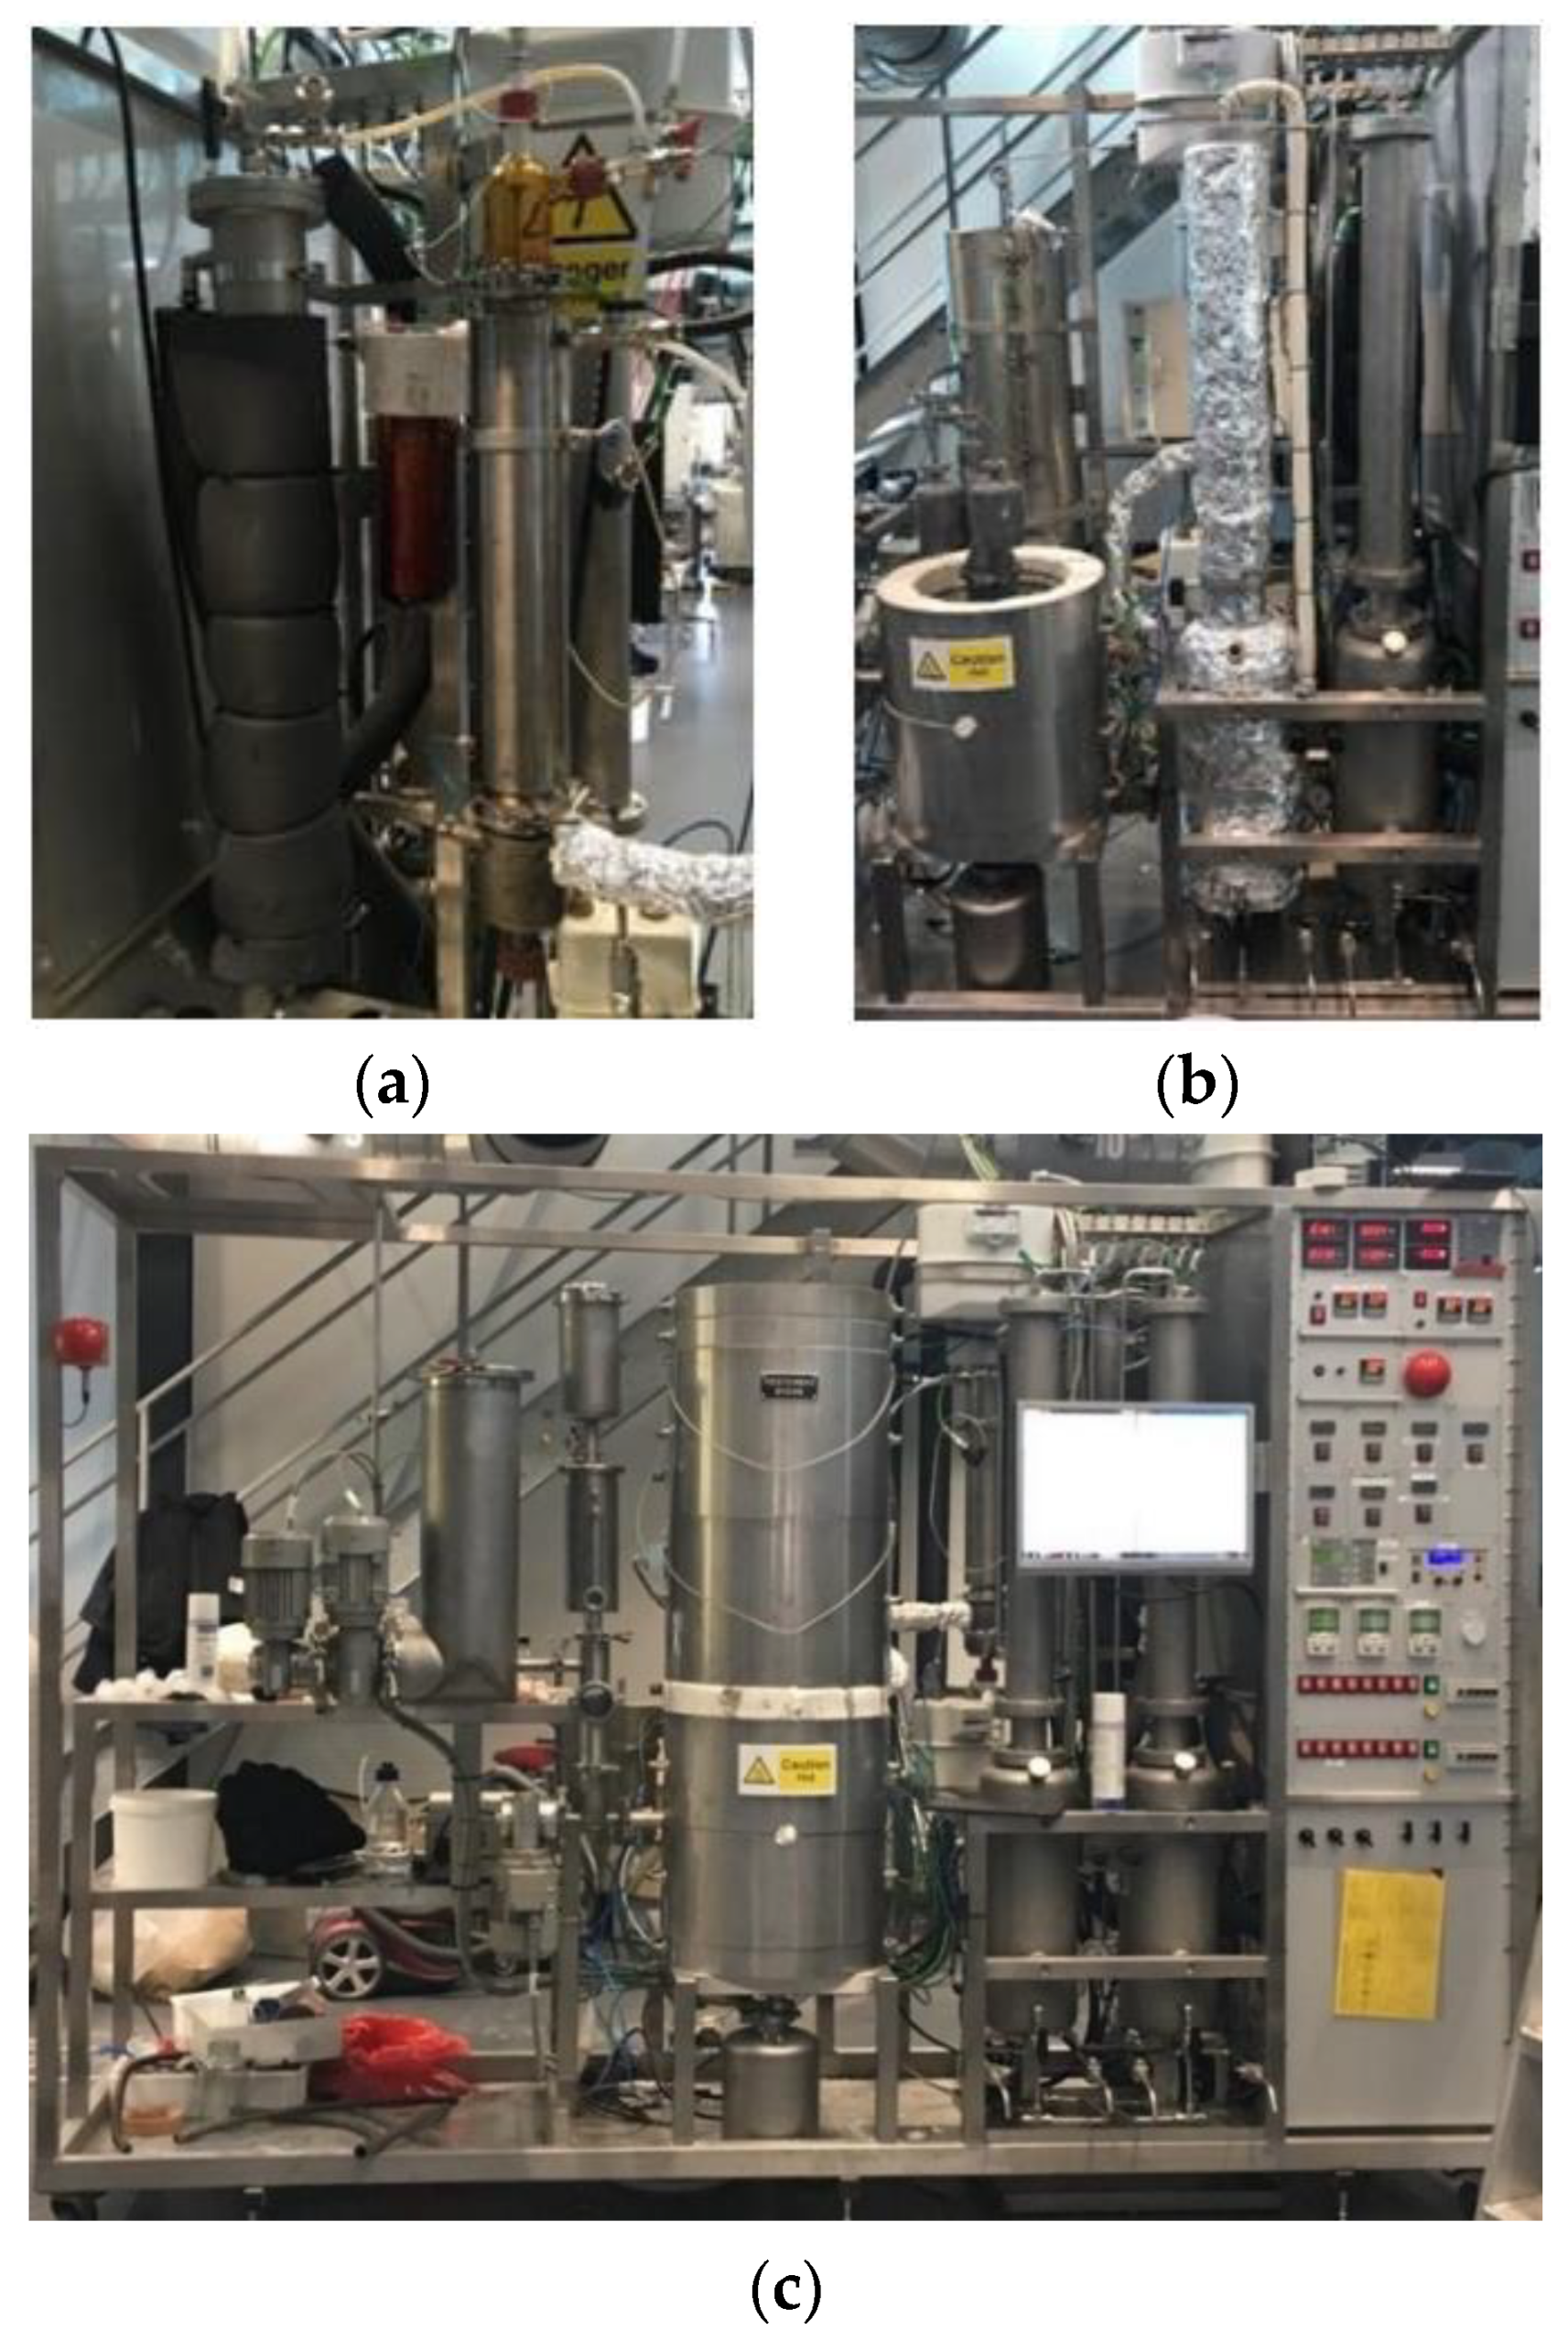
2.3. Condensation Units
Two condensation configurations were considered (
Figure 2). The first configuration was made by a thermally controlled ESP (Electrostatic Precipitator) as the main condensing system, followed by the intensive cooling stage meant to condense the very light vapors. The gaseous stream leaving the tubular reactor is condensed in a custom-made jacketed electrostatic precipitator tube with an internal diameter of 6.2 cm and 44 cm in length, operating a single electrode at 10 kV.
Temperature is controlled via circulating pre-heated water inside the ESP outer cylinder. During the experimental campaign, the ESP has also been always kept at a temperature of 70 °C by circulating pre-heated tap water inside the outer cylinder. The produced oil is collected in a coated bottle directly connected and sealed at the bottom of the precipitator tube and then extracted and weighed at the end of every experiment. The second configuration is based on spray condensers. It is composed of a spray condensers train that allows the simultaneous control of three different condensing temperatures to divide different boiling fractions present into the hot vapors.
First, two counter-current spray condensers were placed in series, which perform the direct-contact heat exchange that maximizes the liquid yields thanks to the simultaneous transfer of heat and mass. During the experiments, the temperature of the vapors leaving the condenser and the produced liquids were measured through thermocouples placed at the inlet and the outlet of each section.
The residence time of the produced liquids in the collector underneath the condenser (at the condenser’s temperature) was approximately 0.5–1 h. The pressure in the condensers was monitored during all the experiments and was always 1.1 ± 0.01 bar.
Bio-Oil Collection Methods—Spray Condensers
A closed-loop spray hydrocarbon quench system was incorporated into the fast pyrolysis pilot-scale facility in order to operate the direct-contact condensation system. The selected coolant fluid for this solution was a paraffin oil (Shell Ondina 919), composed of C 20 isoparaffinic hydrocarbons boiling between 280 and 300 °C. It was selected because of its low vapor pressure, thermal stability, and (alleged) immiscibility with bio-oil; its main properties are presented in
Table 2.
After condensation, bio-oils samples were removed from the bottom of the condenser. Subsequently, the mixture of paraffin oil and bio-oil was poured into a funnel and separated via gravitational phase separation thanks to the different density properties of the two liquids (Bio-oil = 1.2 kg dm−1, Shell Ondina 919 = 0.856 kg dm−1).
Fast pyrolysis bio-oils and isoparaffins are immiscible, as they cannot form a homogeneous liquid. Nevertheless, according to some recent studies [
41], contact between the two fluids results in a mass transfer, which is negligible for most bio-oil components but should not be ignored in a few specific cases.
Concentrations of some compounds identified as being leached out of bio-oil into the quenching fluid have been estimated to be in the range of 0.01–0.1% (by mass). Although these figures could represent a significant issue in certain cases, it was reasonable to consider these effects as negligible in the present work.
2.4. Design of Experiment (DOE)
Experiments were carried out keeping the pyrolysis fluidized bed reactor temperature fixed at 500 °C while testing the two different condensation systems; the temperature of the first condenser in the case of the spray columns setup was varied. The first set of three experiments operated with the first condensing configuration referred to with the experiment code FC_ESP. The hot gas stream leaving the reactor (T ≃ 480 °C) entered the ESP while its external jacket was heated up to 70 °C. The intensive cooler was kept at a temperature of −9 °C.
The fractional condensation configuration has been operated in 4 different test runs with the following operating conditions (as shown in
Table 3).
Efforts focused on varying the temperature of the first condenser alone in order to study the condensing behavior of several chemical species, which could be interesting to fractionate with the proposed solution. Three bio-liquid cuts have been produced and then analyzed according to the methods shown in the next section.
2.5. Analytical Methods
The application of different analytical techniques was necessary for the characterization of the produced bio-oil and aqueous phase for a total of 21 samples.
A GC-MS/FID device (Chromatogram GC 7890A MS 5975C Agilent Technologies, Santa Clara, CA, USA) has been utilized as the main tool for compound detection. The machine implements a capillary column Agilent HP-5MS, HP19091S-433 with Helium as a carrier gas, an end temperature of 280 °C, and a retention time of 24 min. The water content of the different fractions has been investigated via the Karl Fisher Titration method (Metrohm 787 KF Titrino, Herisau, Switzerland).
The elemental composition of 11 samples extracted from the produced different cuts was finally analyzed using a Thermo Fischer Scientific Flash 2000 elemental analyzer. A tiny fraction of bio-oil was placed in an autosampler connected to a quartz reactor housed in a furnace where the sample underwent full combustion at 900 °C. An internal chromatograph then analyzed the eluting products. From known carbon dioxide, water, and nitrate ion peaks, it then as back-calculated, by means of inverse-calculation, it detected the amount of each component of the sample. Finally, oxygen was calculated as the difference, while ash content was reasonably assumed as negligible [
11].
The elemental composition of the char was analyzed using the same elemental analytical machine. A small sample, approximately 2 to 3 mg, was placed in the machine. Here it was burned in the presence of oxygen. After burning the sample, carbon dioxide, water, and nitrogen gas were detected. The amount of the specific gas detected was used to calculate the output of the analysis. The output was a weight percentage of carbon, hydrogen, and nitrogen.
The non-condensable gases were analyzed by a GC machine. The molar fraction of the produced non-condensable gases was corrected for the amount of inert nitrogen (fluidization gas) in the gas stream. In the fluidized bed reactor, the nitrogen flow rate was set by a calibrated mass flow controller (Brooks, Seattle, WA, USA). Gas samples were taken every 10 min. These samples were analyzed in a gas chromatograph for O
2, H
2, CO
2, CO, CH
4, C
2H
4, C
2H
6, C
3H
6, and C
3H
8 (Varian Micro GC CP-4900, SpectraLab, Markham, ON, Canada, with two analytical columns, 10 m Molsieve 5A and 10 m PPQ, using Helium as carrier gas). The sum of C
2H
4, C
2H
6, C
3H
6, and C
3H
8 will further be referred to as C
2–C
3 compounds. Elemental analysis, ash, and HHV were measured according to the methods proposed by Westerhof et al. [
29].
2.6. Mass and Energy Balance
Product yields (
Y) were determined on an as-received basis and were defined as the ratio of the pyrolysis product
i (i.e., char, gas, or bio-oil) to the mass of the feedstock.
Products carbon yield (
Cy) was obtained as the ratio of the carbon concentration (%
Cfeed) in the feed to that recovered in pyrolysis products
i.According to K. Atsonios et al. [
49], a rough estimation of the heat of pyrolysis (
Qpy) can be calculated closing the energy balance on the pyrolyzer:
where Δ
Ht,k is the total enthalpy of the element
k (e.g., biomass, nitrogen, char, and pyrogas),
Qheat is the heat provided to the pyrolyzer by the electrical heaters, and
Qp,loss is the heat losses through the reactor wall.
The total enthalpy Δ
Ht,k was calculated by the following equation as the sum of the standard enthalpy of formation (Δ
Hf,k) at reference conditions (25 °C, 1 atm) and the sensible enthalpy (Δ
H(T)s,k) required to certain temperature
T:
where
nr,j,
h0f,j, and
cpj are the molar flow rate, the standard enthalpy of formation, and the heat capacity of component
i, respectively.
The standard enthalpy of formation (
h0f) of the element
k (e.g., pyrolysis products and biomass) is defined as the change of energy that is related to the formation of a substance from its elements at standard pressure and temperature. Furthermore, the standard enthalpy of formation of a fuel can be estimated based on its stoichiometric combustion balance and the fuel’s higher heating value:
where
mre,w and
mpr,w are the mass flow rate of the component
w of the reactants and the products, respectively.
The higher heating values (
HHV, MJ kg
−1) of the raw biomass, char, and bio-oil fractions were determined by the Channiwala and Parik unified correlation [
50].
where
C,
H,
O,
N,
S, and
Ash represent the carbon, hydrogen, oxygen, nitrogen, sulfur, and ash content of the sample expressed in mass percentages on a dry basis, respectively. Oxygen is calculated by difference.
The higher heating value (
HHV, MJ·Nm
−3) of the non-condensable gas can be calculated using the following equation [
51]:
where the gas content is given in vol% (or mol%) on a nitrogen-free basis. Heat losses
Qp,loss is the sum of heat transfer by natural convection and radiation. These have been evaluated by taking into account a mean room temperature of 25 °C and a wall temperature of 60 °C.
The energy recovered in the pyrolysis products (
ε) was determined as the ratio of the chemical energy retained by pyrolysis products
i to biomass chemical energy:
The performed elemental analysis of the bio-crude allowed assessing the distribution of carbon among the different condensed fractions. The initial carbon input constitutes up to 46.58% of the woody biomass feedstock. Then the carbon gets distributed into char, gas, and bio-oil, resulting in a transfer of the carbon content from raw biomass to bio-oil, which accounts for roughly the 30% of the initial input. This figure is then differently stirred into the final products depending on the condensation route tested. Consequently, the elemental and heating value figures of pyrolysis products have been elaborated as presented in
Section 2.6 (using Equations (9) and (10) for HHVs) to calculate the energy contents of each output.
3. Results and Discussion
3.1. Feedstock
The chemical characterization of the pine wood is given in
Table 4. The bulk density was measured at 570 kg m
−3, and moisture content was around 10 wt.%. HHV was calculated at 18.3 MJ kg
−1, in line with the figures occurring for comparable biomasses [
52,
53]. The feedstock’s composition data were derived from a previous study by Westerhof et al. [
29].
3.2. Char Analysis
The produced char was collected via a set of cyclones placed right at the reactor exit, taking advantage of the centrifugal separation principle to remove coarser solid particles from the vapors’ stream. The elemental composition, as well as the proximate analysis and the higher heating value, are presented in
Table 5.
These results are in agreement with the study of DeSisto et al. [
52], who experienced comparable values for CHN and HHV for fast pyrolysis of pine sawdust in a fluidized-bed reactor. Although this solid carbonaceous material is certainly not to be considered the main target when operating fast pyrolysis units, it represents a highly valuable by-product. Moreover, the well-known catalytic effect of char on the volatiles [
54] is what motivates the application of a volatile/solid separation device.
The elemental composition and properties of char are strictly dependent on the process’s main parameters, such as temperature and heating rate. Carbon content is expected to increase with temperature while concurrently, oxygen and hydrogen levels decrease [
55]. Nevertheless, the char considered in this study has been produced at fixed experiment conditions, i.e., T
react = 500 °C, since operational variations have been applied only to the condensation train.
3.3. Non-Condensable Gas Analysis
The composition of non-condensable gas, which consists of O2, H2, CO2, CO, CH4, C2H4, C2H6, C3H6, C3H8, and N2, was analyzed by GC. The samples collected from the outlet after the ESP or after the spray condensers train mainly consisted of N2 (the carrier gas), equal to ≃92% v/v, and a small portion of pyrogas, around 8% v/v, generated during the pyrolysis reactions.
Non-condensable gas contains CO, CO
2, H
2, O
2, CH
4, and a small amount of hydrocarbons (C
2–C
3). The volume percentages of the main non-condensable gases generated during the biomass pyrolysis reaction while operating the two spray columns are shown in
Figure 3. Measured values were averaged and normalized to nitrogen-free conditions. Experiment codes FC_ESP AV and FC_SC1 respectively refer to the average values registered to operate the ESP setup and the spray condensers configurations under the same conditions of FC_SC2 (the latter) in order to guarantee high reproducibility. The amount of CO, CO
2, CH
4, and C
2–C
3 showed good agreement with the values reported in the literature [
56]. The dominant components were CO and CO
2, in which concentrations ranged around 81%
v/
v. The release of CO
2 was generated by cracking and reforming of functional groups of carboxyl COO and COOH, while the CO formation was caused by the cracking of carbonyl (C=O) [
57]. Nevertheless, the hydrogen and oxygen volume percentages differed from the figures reported in the literature. In our case, the negligible percentage of the former (CO
2) was attributed to the quenching of free radicals that favored the charring reactions that led to H
2O and char production [
58]. The calculated higher heating value of the non-condensable gas-stream (N
2 and H
2O free) was 12.41 MJ Nm
−1, confirming that the non-condensable gases could be properly reused as fuel gas to self-support the pyrolysis process in a large-scale industrial plant [
43].
3.4. Bio-Oil Analysis
3.4.1. Qualitative Results
The produced liquids obtained during the experiments with the ESP and spray columns condensing systems have been qualitatively analyzed via GC-MS/FID.
Figure 4 below presents the results from FC_SC2 as an example. In this case, three fractions were collected while operating the first condenser at a temperature of 170 °C and keeping the downstream devices, respectively, at a temperature of 70 °C and −10 °C.
Components of bio-oil from fast pine wood pyrolysis and their relative retention time (RT) are shown in
Table 6. While several other compounds have been detected during the analytical campaign of all the experiments, this can be considered to represent a fair display of the mean composition of the produced samples via these specific procedures.
The overlying spectra of the bio-oil samples from the three condensers are shown in
Figure 5, showing the peak distribution in the three bio-oil fractions.
The first collector trapped most of the high molecular weight compounds (higher RT), while most of the light compounds were trapped in the final intensive cooler. The central trait (from 8 to 45 min of RT) was highly populated by several compound classes, which were concentrated in the second cut, including phenolics, cyclopentanones, methoxyphenols, and furans.
At a temperature of the first condenser of 170 °C, only long-chain anhydrosugars and lignin derivatives condensed because of their vapor pressure properties. Such behavior was confirmed over the entire range of tested temperatures. The levoglucosan concentration in the oil collected in the first condenser more than triples from 4 to 13 wt.% as the temperature in the first condenser was increased. Vapors leaving the first step and condensing into the second scrubber present a significant concentration of mid-boilers, mainly accounting for phenols, cyclopentenones, and some furans. In this section, the acid fraction was only 1.24 wt.%, coming from 6 wt.% at 100 °C. As for the final condensation step, light fractions are the compounds mostly present in the aqueous phase, showing a dependency on changes in the first step condensing temperature. For these operating conditions (170 °C), more than 90% of the acetic acid produced was recovered in the intensive cooler.
Figure 5 can be considered an effective overview of how the process affects fluid composition and distribution. As other literature studies suggest [
59,
60,
61,
62], both the oil and the aqueous phase contain several polar and non-polar compounds that can potentially be used as precursors for a multitude of bio-derived chemicals (e.g., commodity chemicals, polymers, agrochemicals, pharmaceuticals, etc.). However, further extraction and purification methods need to be implemented in order to extract targeted species (e.g., liquid-liquid extraction and distillation).
3.4.2. CHN Analysis
In addition to the qualitative characterization, liquid products were analyzed by means of elemental composition.
Table 7 shows the elemental analysis of the different fractions varying the condensation temperature of the first condenser. A slight decrement in carbon content was observed, reducing the temperature from 170 °C to 100 °C, meaning that some long-chain carbon-rich compounds present in the vapor stream were migrating to the downstream collectors due to complex interaction of dew point changing and residence time inside the condensing chamber. It is also well predicted and confirmed that the aqueous phase, obtained in the last condenser, concentrates a substantial amount of oxygen mainly due to the presence of a high percentage of water plus a small amount of trapped oxygenated compounds. Carbon content in this fraction was still relatively high and settled around roughly 16%.
CHN analysis was used to estimate the higher heating values (HHV) of the produced cuts.
Figure 6 shows the evolution of the higher heating values as a function of the condensation temperature. The higher heating value of the bio-oil collected in the first condenser increased from 24 to 25 MJ kg
−1 when the condenser temperature increased from 100 to 170 °C.
This is due to a higher concentration of lignin-derived compounds in the oil condensed at higher temperatures, which have a relatively low oxygen content compared to the light organic compounds passing through. HHV values for the second cut and the aqueous phase were found to be rather constant. The low values of the aqueous fraction were obviously due to water predominance in the composition. The average value for the bio-oil collected in the second condenser, which is the targeted liquid for the bio-fuel application, whether it is for combustion of the raw product or for the upgrading path, was shown to be significantly high (≃21.5 MJ kg−1).
The targeted oil fraction (i.e., the second cut) presented highly considerable HHV, therefore, concentrating a significant share of energy that can be further transferred into fuels for transport after further upgrading, while the other two fractions should not be underestimated as to what concerns the potential precursors towards chemicals production.
Finally, it was observed that the aqueous phase contains mainly light organic compounds such as acetic acid and phenol, which could be potentially extracted and further processed into bio-based commodity chemicals for several applications in the chemical industry [
38,
63,
64].
3.5. Mass Balance and Yield Calculations
The experimental campaign produced 11 samples of bio-oils (divided among the first, second, and aqueous phase fractions) and as many measurements on the non-condensable gases. Differently, char maintained uniform properties for all runs since it was not affected by any upstream variation from the bio-oil condensing apparatus.
The mass balance closure of the experiments was always between 88% and 95%, with an overall average of 92%. Product yields have been determined on an as-received basis. The overall liquid yields were obtained approximatively equal either for the ESP setup or the quenching columns systems. The average figures are in good agreement with those shown in the literature [
4] and can be summarized as follows: 12.7% of produced char, 62.9% of bio-oil, and 15.4% of non-condensable gases. The average mass balance closure was calculated at approximately 92% of the initial feedstock, and results are reported in the Sankey diagram given in
Figure 7.
Hereafter,
Table 8 shows the bio-oil yield and distribution among the condensers as a function of the temperature in the first step. Initially, the ESP setup was operated for several trials keeping the condensing temperature fixed (T
cond = 70 °C) in order to evaluate procedures and results in reproducibility. The results have shown good replicability.
Bio-oil mass distribution results are also presented in
Figure 8. The spray condensers were operated, also considering the mass fraction of vapors trapped in the last step of the condensation train (i.e., the cotton gas filter).
When operating the first condenser at 100 °C, more than 27 wt.% of the produced liquids condensed at this stage, while at temperatures of 130 °C and 170 °C, this amount roughly accounted for 23 wt.%. The first condensation temperature was varied over a span ranging from 170 °C to 100 °C, resulting in a trend of the increasing amount of collected liquids in the first column as the operating temperature decreased. At higher temperatures, liquid yields were slightly lower for the collection of sugars and lignin-derived oligomers in the heavy fraction. At the same time, the variation of first stage temperature influenced the bio-oil yield in the second condenser. This led to an increased mass yield of the second scrubber as the temperature of the first condenser was augmented, reaching a maximum value of 21 wt.%. Yields of the last two liquid collectors (i.e., including the gas filter) have shown to settle around a constant value (of 45 wt.% and 11 wt.% respectively) as the temperature never varied during the experimental campaign.
Tests with ESP setup reported the condensation of the largest fraction of bio-oil in the first step, including a high percentage of acidic compounds (up to 40 wt.% of the total amount of detected acids), which are an unwanted feature in terms of bio-fuel aging and storage properties [
65]. In the aqueous fraction, a high content of acids and a tiny percentage of furanics were identified as well; different analytical approaches could allegedly detect more light organics.
When considering the spray condensers setup, it can be noticed that a class-selective separation mechanism happened, leading to the expected fractionation of different chemical compound classes.
Based on compound dew points, the heavy, mid-boilers, and light fractions behavior is affected by the condensation temperature and technology. The observed compositions are in good agreement with other studies, confirming the possibility of tailoring the oil composition by varying the temperature of the condensation sections [
25,
39,
66].
3.6. Bio-Oil Water Content
As expected, water was not detected in the first condenser in all the fractional condensation experiments (i.e., temperature always kept above 100 °C), while the bio-oil condensed in the second column showed low amounts of water. The distribution of water fraction in the final products was poorly influenced by the variation of the first condenser temperature within the range of 100–170 °C, resulting in values of 67.49 wt.% for FC_SC2, 69.65 wt.% for FC_SC4, and 69.68 wt.% for FC_SC5, respectively, for the aqueous phase. On the other hand, the second collected fraction of bio-oil accounted for 6.23 wt.% of water in FC_SC2, 7.42 wt.% in FC_SC4, and 7.32 wt.% for FC_SC5. Similar results were encountered when operating the ESP-equipped setup: the measured water content in the aqueous phase and in the ESP oil was respectively ~68 wt.% and 5 wt.%.
3.7. Energy Assessment
The energy balance associated with the mass balance in 3.5 is reported in the Sankey diagram of
Figure 9. Data are expressed as a fraction of the chemical energy of the wet biomass input. The total energy input includes the process heat provided by the electrical heaters and the utilities’ electrical power consumption, respectively 7.2% and 10.7% of the chemical energy of the feedstock.
The heat of pyrolysis was assessed from the energy balance on the pyrolyzer: it corresponded to 1053.5 kJ per kg of raw biomass input (6.3% on an HHV basis), which is aligned with the data available in the literature [
49,
67]. Even though bio-oil represents the main product, about 21% and 9.3% of feedstock energy content remain in the char and non-condensable gas, respectively. The energy losses at the pyrolysis reactor were 10% due to thermal losses (1%) and unrecovered products (9%). The latter was considered as unconverted dried biomass trapped in the reactor since it was not practically recovered, as suggested by Atsonios et al. [
49]. In the plant configuration herein discussed, the heat required by the process, the sum of the heat of pyrolysis (6.3%) and water’s heat of vaporization (1.8%), was externally provided by means of electrical resistors, while in an industrial scenario this would likely be supplied by combustion of co-products and the heat in the off-gases recovered by ORC applications [
68].
Despite 10% of feedstock chemical energy being lost as heat losses and thermal power transferred to cooling fluids, a significant energy concentration effect was achieved by combining fast pyrolysis with fractional condensation: bio-oils collected in the first and second condenser account for the 43% of biomass chemical energy at the inlet, while that retained in the aqueous phase (13.7%) indicates the presence of soluble organics in the water fraction.
As liquid energy output, the first two fractions (excluding the aqueous phase) accounted for 43% of total energy (with an HHV of 24.4 and 21.7 MJ kg
−1, respectively) while representing 27.2% of the initial mass.
Figure 10 displays the mass and energy balances associated with the results presented in
Section 3.5 and
Section 3.7.
The present layout demonstrated that a consistent amount of energy outputs could be recovered in different bio-oil cuts, favoring further upgrading processes.
According to Castello et al. [
69], a lower hydrogen demand for a potential downstream upgrading process such as hydrotreatment can be achieved using the proposed strategy, increasing the overall life cycle efficiency. These findings, therefore, suggest that the conversion from solid to liquid in the proposed scheme has the potential to achieve a remarkable performance as regards the energy valorization of all products.
3.8. Discussion
The achieved results from the experimental campaign showed that mass and energy balances of an extended system lead to promising applications in an integrated biorefinery concept.
Nevertheless, qualitative analysis of the different produced fractions portrays meaningful insights into the complete valorization of the processed stream. As expected, a class-selective separation mechanism happens, leading to the concentration of different chemical compound classes. The evolution of the concentration of light compounds, water, and the acids in the oil, as well as for sugars and carbonyls obtained in the first and second condenser as a function of the condensation temperature, is significant. The content of light compounds, water, and acids decreases rapidly at an increasing condenser temperature. Based on the specific composition of each fraction, it is possible to identify different routes to maximize the overall performance of the proposed system.
Despite there being still open issues regarding the market valorization of the products, the energy assessment showed a high recovery potential for the plant output streams. This “improved” system layout, including the results carried out in the fractional condensation tests applied to the fast pine wood pyrolysis, leads to char and non-condensable gases production at about 28% of the initial biomass, while the bio-oil production resulted in a yield up to 70%.
In the context of the alternative fuels production, the second fraction collected in the system, due to its relatively low water content and a higher concentration of light organic compounds, represents the best candidate to be further upgraded into hydrocarbon fuels mixtures through hydrotreating/hydrocracking [
70,
71]. Although not the main destination envisaged by this study, co-processing in FCC reactors could also be a viable solution for the treatment of this fraction [
72] as well as co-refining together with crude oil [
73] Compared to the traditional fast pyrolysis oil obtained in a single-step of condensation, this solution also separates the heavier molecular weight compounds from the main product in the first fraction, facilitating the following downstream upgrading of the second fraction. In particular, the first fraction contains almost equal energy content to the second cut, but the heavier chemical compounds make its upgrading more challenging through a typical biorefinery direct hydrotreatment towards drop-in fuels. Given its nature, this product cannot be intended as a precursor for a subsequent hydrogenation step since its processing would entail high hydrogen consumption other than having a negative effect on the catalyst’s lifetime [
74]. Its removal can ease the downstream operations to the final fuel product derived from the central fraction. However, other studies in the literature suggest that also this fraction can be hydrotreated through different operating conditions due to the differences in the composition and oxygen content [
75]. The presence of sugars and lignin-derived oligomers opens considerations for further utilizations of these compounds via economically rewarding routes. For instance, levoglucosan can be hydrolyzed to form glucose or directly fermented to produce alcohols [
76,
77]. Similarly, the water-insoluble lignin-derived oligomers can be potentially used for manufacturing bio-based materials in products such as batteries and supercapacitors applications [
78,
79]. Furthermore, the heavier stream can be potentially used for the production of other higher-value co-products or energy production, therefore potentially improving the overall biorefinery economics. Finally, the aqueous phase collected in the last train of the condensation unit (the intensive cooler) was found to be rich in light acidic compounds due to a relatively high condensation temperature of the upstream steps. Even though the energy potential of this fraction is poor due to the low concentration of organics in water, this fraction may have the potential for recovering chemicals of interest to the agrochemicals industry. Extracting these compounds from the aqueous phase is beneficial because the recovery of organic compounds at these concentrations may be economically viable, especially in an aqueous stream containing no oligomers, which makes the extraction process easier.
4. Conclusions
The current study confirms that fractional condensation applied to fast pyrolysis vapors of lignocellulosic biomass is a promising and feasible approach to concentrate classes of compounds, aiming at controlling the quality of bio-oil fractions. Bio-oil yields in the quenching columns were observed to slightly vary with the condensing temperature. The identified trend confirms to be linked to the temperature decrease, resulting in higher yields at lower temperatures of condensation as the dew points of chemical compounds and the flash condensation theory can well unfold.
From a qualitative point of view, a slight difference can be noticed in the evolution of products collected in the first and second condenser as the temperature of the first was decreased, while differences in viscosity became a relevant issue preventing the operator from easy removal of the condensed compounds at each step of the investigated temperature range (100–170 °C). With the increase in the condensation temperature, a significant concentration of heavy compounds was detected in the first fraction (e.g., levoglucosan concentration presents an almost threefold increase from 4 to 13 wt.%). The second scrubber concentrated mainly on mid and light organic compounds for all the tested conditions (phenols, cyclopentenones, and some furans). What is important to emphasize from a qualitative point of view is the reduction in the acidity of the bio-oil with the rise in temperatures, ranging from 6 wt.% at 100 °C to 1.24 wt.% at 170 °C, as well as the low water content, around 7% for all the experiments due to the high condensation temperature of the second scrubber (i.e., 70 °C). The second cut visually appeared as single-phase liquid: no phase separation occurred at the time of extraction nor after several months of storage. The removal of light organic polar compounds and water improved the stability of the bio-oils. The reported low acidity values of the central fraction are known as important features for good bio-oil aging properties. Therefore, improved bio-oil quality was experimentally achieved, thus resulting in a potentially reduced energy demand in the downstream upgrading processes (i.e., lower hydrogen demand for the next hydrotreatment steps) for alternative fuel production.
Average mass balance figures for all the experiments resulted in 12.7% of produced char, 62.9% of bio-oil, and 15.4% of non-condensable gases, accounting for an overall mass balance closure of 92% of the initial feedstock. Although 10% of the chemical energy of the feedstock was lost as heat losses and thermal power transferred to the cooling fluids, a considerable energy concentration effect was obtained by combining fast pyrolysis with fractional condensation: the bio-oils collected in the first and second condensers constitute 43% of the chemical energy of the biomass input, while the energy retained in the aqueous phase (13.7%) indicates the presence of soluble organics in the aqueous fraction.
The energy content of the collected fractions was observed to remain rather constant over the temperature variations of the first scrubber, presenting a significantly high heating value (HHV) of ≃21.5 MJ kg−1 for the target fraction. A good trade-off between energy efficiency and product quality could result in setting the first spray column temperature at about 130 °C.
In conclusion, the overall energy assessment of the process supported by the qualitative analyses of the products resulted in a better understanding of the overall performance and product characteristics from fractional condensation: good quality bio-crude for fuel applications has been produced, while at the same time process energy requirements have been evaluated assessing the self-sufficiency of the conversion process. Therefore, the investigated condensation solutions offer a high potential in a modern biorefinery integration, including the combined production of bio-derived fuels and chemicals.

 ,
, 


