Article

A Modified Compact Flexible Vivaldi Antenna Array Design for Microwave Breast Cancer Detection

by
Ayman M. Qashlan
,
Rabah W. Aldhaheri
* and
Khalid H. Alharbi
Department of Electrical and Computer Engineering, King Abdulaziz University, Jeddah 21589, Saudi Arabia
*
Author to whom correspondence should be addressed.
Appl. Sci. 2022, 12(10), 4908; https://doi.org/10.3390/app12104908
Submission received: 11 April 2022 / Revised: 9 May 2022 / Accepted: 10 May 2022 / Published: 12 May 2022
(This article belongs to the Special Issue Design, Analysis, and Measurement of Antennas)

Abstract

:
In this paper, a compact, flexible Vivaldi antenna is designed, and an array of nine identical antennas of this type is used as a microwave breast imaging model to detect cancerous tumors in the multilayers phantom model presented in this paper. The nine-antenna array is used to measure the backscattering signal of the breast phantom, where one antenna acts as a transmitter and the other eight antennas act as receivers of the scattered signals. Then, the second antenna is used as a transmitter and the other antennas as receivers, and so on till we have gone through all the antennas. These collected backscattered signals are used to reconstruct the image of the breast phantom using software called “Microwave Radar-based Imaging Toolbox (MERIT)”. From the reconstructed image, the tumor inside the breast model can be identified and located. Different tumor sizes in different locations are tested, and it is found that the locations can be determined irrespective of the tumor size. The proposed modified Vivaldi antenna has a very compact size of 25 × 20 × 0.1 mm3 and has a different geometry compared with conventional Vivaldi antennas. The first version of the antenna has two resonant frequencies at 4 and 9.4 GHz, and because we are interested more in the first band, where it gives us sufficient resolution, we have notched the second frequency by etching two slots in the ground plane of the antenna and adding two rectangular parasitic elements on the radiating side of the antenna. This technique is utilized to block the second frequency at 9.4 GHz, and, as a result, the bandwidth of the first resonant frequency is enhanced by 20% compared with the first design bandwidth. The modified antenna is fabricated on Polyimide flexible material 0.1 mm thick with a dielectric constant of 3.5 using a standard PCB manufacturing process. The measured performance of this antenna is compared with the simulated results using the commercially available simulation software Ansoft HFSS, and it is found that the measured results and the simulated results are in good agreement.

1. Introduction

Breast cancer is considered a major health issue across the globe. It is considered the most common cancer that affects women among all cancer cases. In 2022, an estimated 287,850 new cases of invasive breast cancer will be diagnosed in the U.S. alone, which contributes to 30% of all cancer cases among women [1,2,3]. The early detection of such malignant cells is one of the most significant factors in improving the survival rate and quality of life experienced by breast cancer sufferers. X-ray mammography is the current detection method for early-stage breast cancer. However, this method is an invasive and ionizing technique. It also yields high false-negative rates [4,5]. Other non-ionizing detection methods, such as Magnetic Resonance Imaging (MRI), can be used for early-stage breast cancer diagnoses. However, this method is expensive and may not be accessible to a large number of patients [5,6].
In recent years, there has been a great demand for a new reliable, non-ionizing, cost-effective, and comfortable approach to breast cancer screening. Microwave imaging (MWI) methods are one of the promising techniques for early breast cancer diagnosis [7]. At microwave frequencies, the contrast between the electrical properties of cancerous cells and those of healthy breast tissue is significant. Several experimental studies of dielectric properties of healthy and malignant breast tissues have been reported in the literature. In [8], a large-scale study, with 319 measurements on freshly excised breast tissue specimens to experimentally determine the ultrawideband microwave dielectric properties of a variety of normal, malignant, and benign breast tissues, measured from 0.5 to 20 GHz, is reported. The analysis showed that the contrast in dielectric properties between malignant and normal adipose-dominated tissues in the breast is considerable, as large as 10:1. Moreover, the contrast in the microwave-frequency dielectric properties between malignant and normal glandular/fibroconnective tissues in the breast is no more than about 10%. In [9], experimental measurements of dielectric properties of normal and tumorous tissues on more than 220 tissue samples were performed in the frequency range of 0.5 to 50 GHz. The results showed that the mean values for tumorous and normal tissues are separated from each other at all frequencies. Moreover, the normal tissue samples were divided into three subgroups based on their adipose component percentage. It has been found that as fat content decreases, the average dielectric properties rise significantly between groups. An average contrast in dielectric properties of malignant and healthy tissues of 8.4:1, 2.2:1, and 1.4:1 exist for low-adipose, medium-adipose, and high-adipose tissues, respectively. Similar experimental results with 330 samples were also reported in [10]. This reported contrast allows for smaller breast tumors detection with higher accuracy than traditional methods [11,12].
In microwave imaging, there are two approaches: tomography- and radar-based. In microwave tomography, the dielectric properties of the breast are calculated by transmitting narrowband microwave signals through the breast. The backscattered signals are collected through multiple receiving antennas. However, this method requires many transmitting and receiving antennas. Additionally, it requires solving a non-linear inverse scattering problem which requires a computationally intensive reconstruction algorithm. In radar-based imaging, antennas are used to transmit and receive the backscattered signals using the transmitting antenna (monostatic) or additional antennas (multistatic). The monostatic arrangement can be used multiple times from multiple locations to provide a sufficient number of channels for imaging. Alternatively, the multistatic antenna array method uses multiple antennas at a fixed location to collect the backscattered signals. This method avoids the mechanical issues of monostatic imaging systems. Successful imaging systems based on this idea have been developed in [13,14,15].
In MWI, antennas play a vital role in the imaging process. They act as transceivers where a transmitting antenna becomes a receiving antenna (sensor) in the next iteration. Thus, careful antenna design is required to meet system requirements. Recent studies have shown that antennas used for MWI should have the following properties: small size, high gain, directive power radiation, and wide bandwidth. The operational frequency band is also important: lower frequency bands provide greater penetration, and higher bands offer better range resolution. However, lower frequency requires a larger antenna footprint, and higher frequency causes higher power losses [16,17].
UWB antennas have attracted researchers for their unique features: high data rate, small size, low cost, and power spectrum density. They can also be designed to operate in both low and high-frequency ranges. Moreover, they are environmentally friendly, biocompatible, and biologically friendly [18]. Several types of UWB antenna for MWI have been proposed, including omnidirectional vs. directional radiation pattern [19]; wide range vs. narrowband [20]; high vs. low frequency [21]; etc. However, in all cases, the system requires high efficiency, high gain, and compatibility to penetrate the human body [3]. To date, many UWB antennas for MWI breast imaging have been reported: compact planar UWB antenna [22], modified antipodal Vivaldi antenna [3], hemispherical antenna [17], reflectarray antenna [23], flexible monopole antenna [7], circular polarized radial line slot array antenna [24], and many more.
The human breast, on the other hand, has an inhomogeneous and complex structure of skin, fat, gland, and muscle. Each of these substances has different dielectric properties, namely relative permittivity and conductivity. This inhomogeneous environment can be modeled by stacking several homogeneous layers that represent the properties of skin, fat, gland, and muscle. The proposed structure is not a representation of the real breast. However, the model is widely used in laboratory environments for prototype breast imaging systems [5,7,25,26].
Successful imaging systems require preprocessing for backscattered signals to remove artefacts and reflections. Several artefact removal algorithms have been reported in the literature. The Average Subtraction method subtracts the response of each channel from a reference waveform. The reference waveform is the average response of all imaging channels [27]. This method assumes that the artefact is similar in each channel. Adaptive filtering extends this idea to compensate for channel-to-channel variation in the artefact [28]. The rotational subtraction method has been reported in [29]. In this method, the antenna array is physically rotated around its center, and a second radar measurement is performed. The two data sets are then subtracted to remove undesired signals.
In this paper, a modified and compact flexible Vivaldi antenna with a size of 25 × 20 × 0.1 mm3 is proposed and studied. Two versions of antennas, one with two resonant frequencies at 4 and 9.4 GHz and the other with one resonant frequency at 4.4 GHz, are discussed. Both are of the same size, and the improved antenna is fabricated on Polyimide flexible material with a thickness of 0.1 mm and a dielectric constant of 3.5 using a standard PCB manufacturing process. The reflection coefficients, current distribution, and radiation patterns are discussed and evaluated. An array of nine identical antennas of the second version, i.e., with one resonant frequency at 4.4 GHz, is used as a microwave breast imaging model to detect and locate the tumor inside the proposed multilayer phantom model using Microwave Radar-Based Imaging toolbox (MERIT). This simulation setup successfully identifies and locates tumors of different sizes and positions inside the phantom model. The imaging results are very promising for the practical use of the proposed microwave imaging as a good candidate for breast cancer detection. The novelty of the work is the use of the proposed modified flexible antenna and the proposed breast phantom for breast imaging applications.

2. Materials and Methods

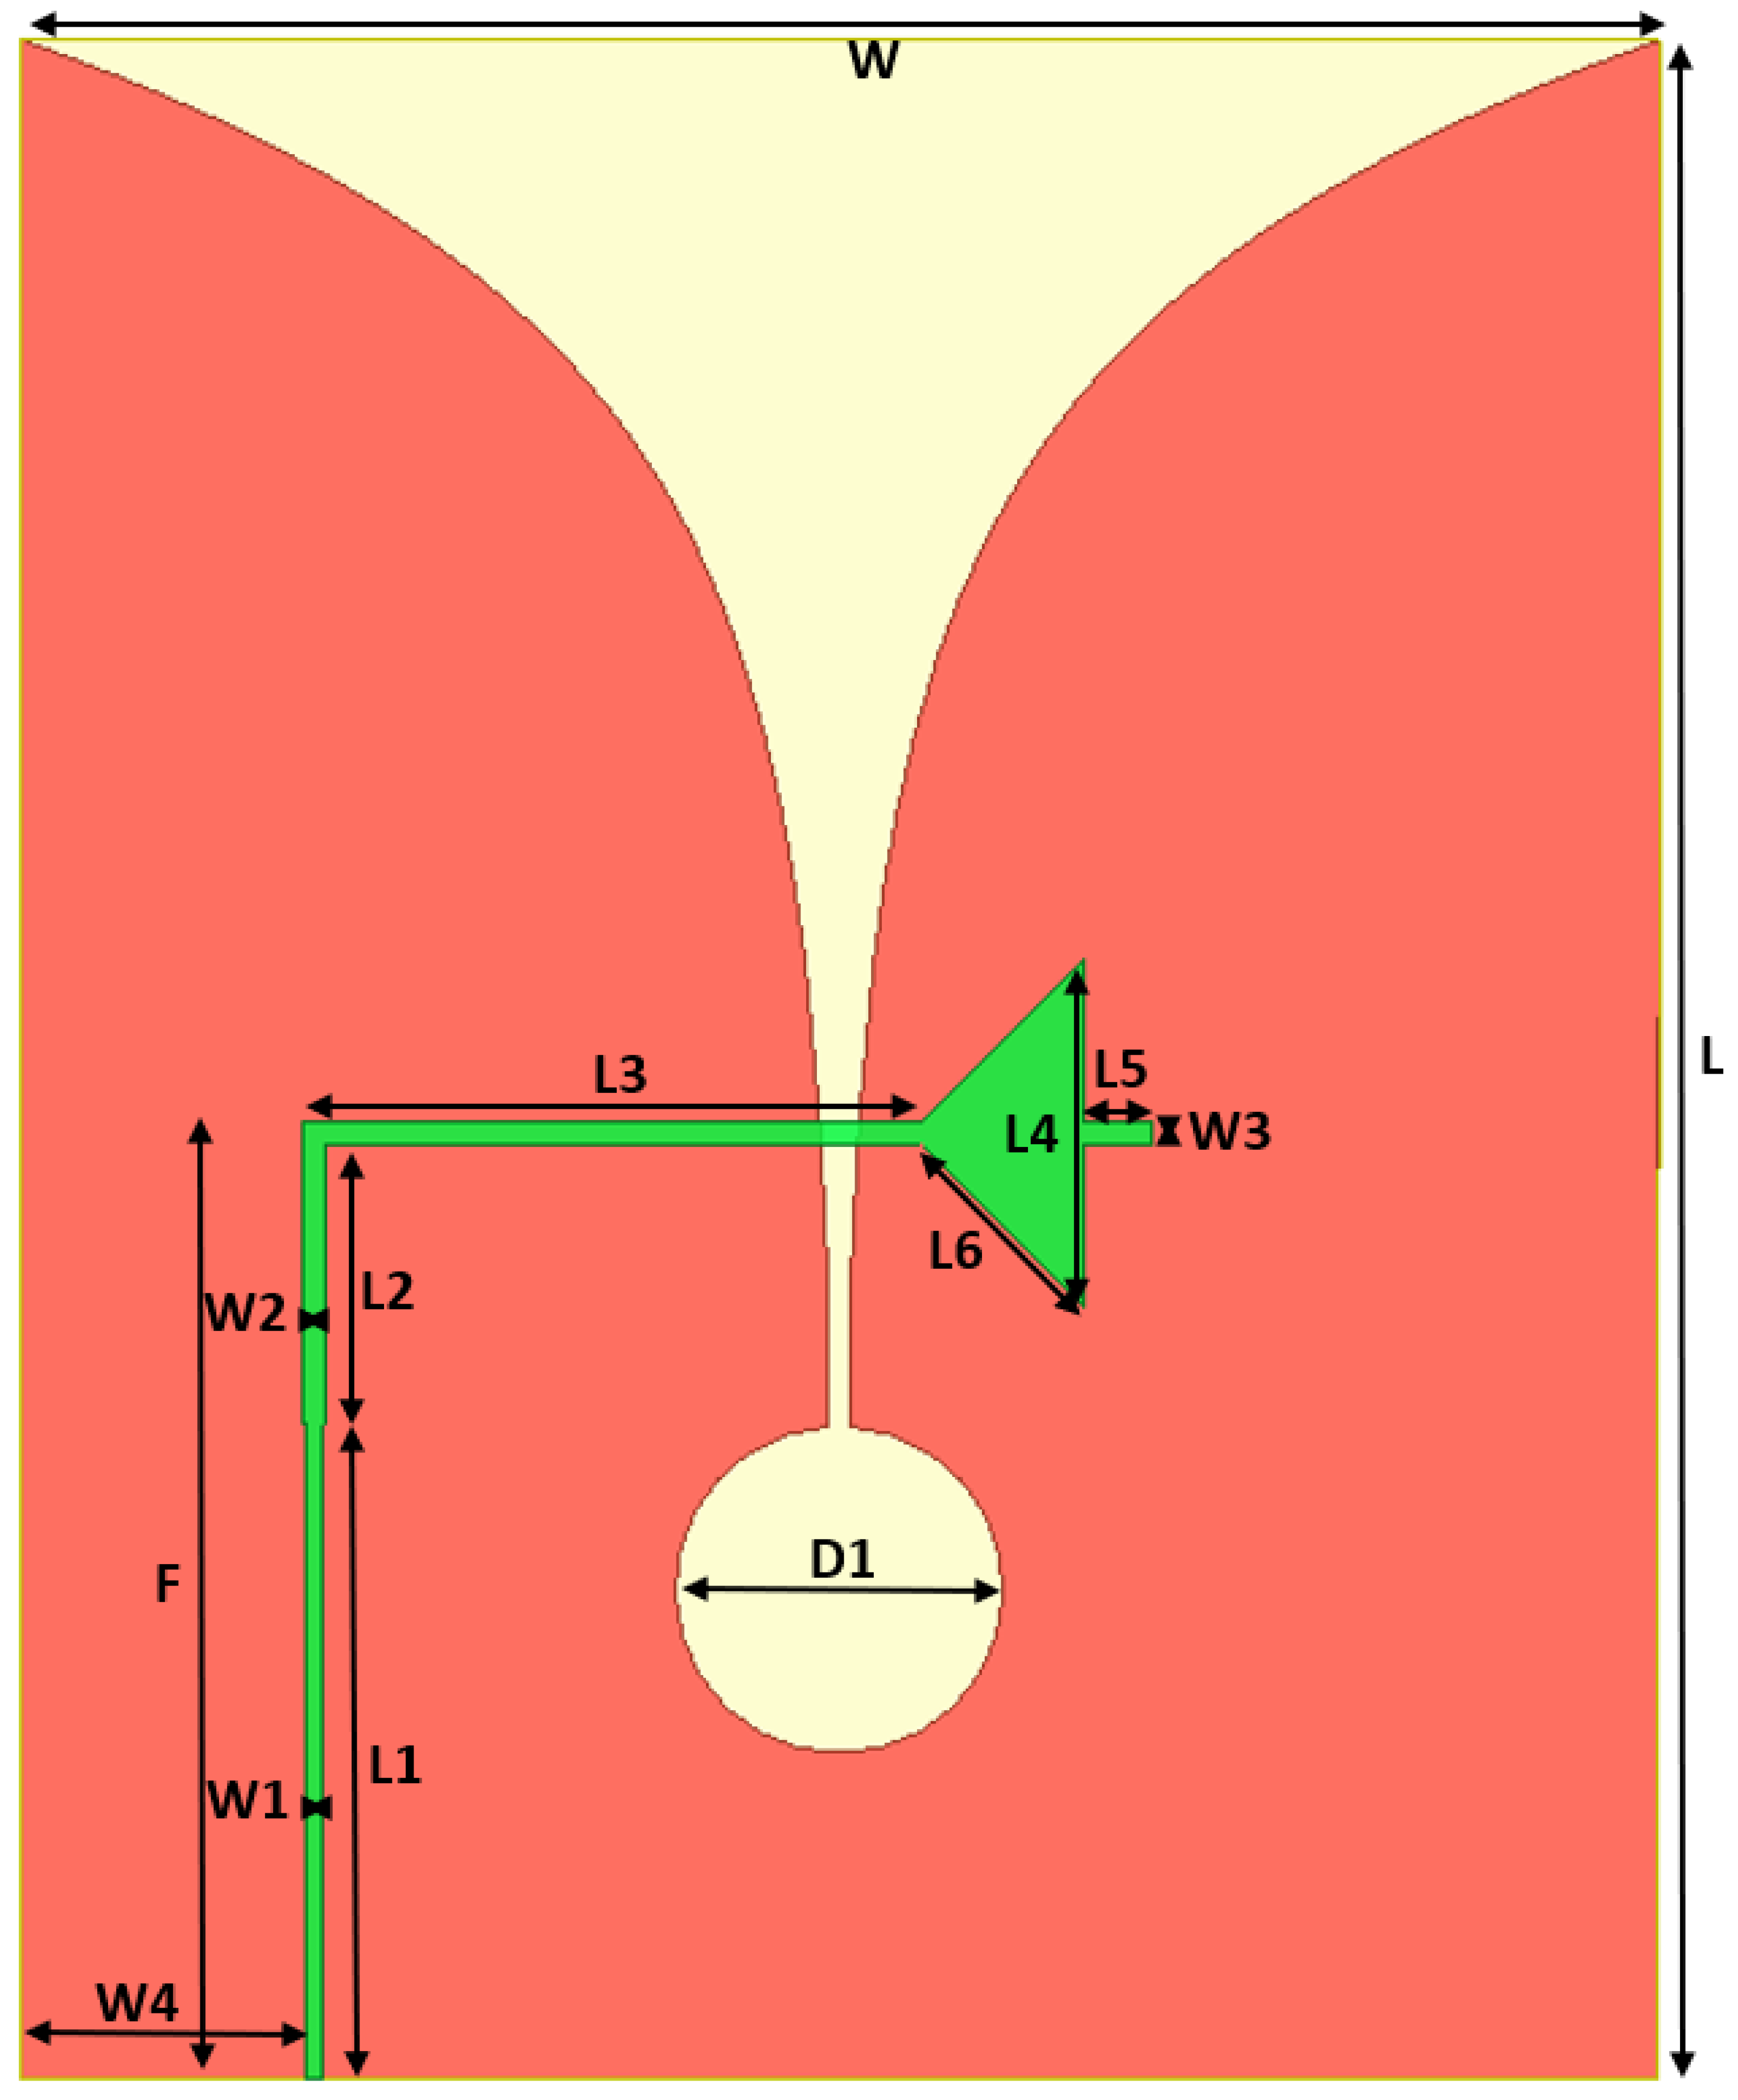
2.1. Antenna 1 Design

A simple, low-cost, compact, and flexible Vivaldi UWB antenna is designed. The antenna has a radiating triangular shape on the top side and a slotted ground plane on the bottom side. It has a relatively small size of 25 × 20 mm2 compared with conventional Vivaldi antennas presented in the literature. It is fabricated using standard printed circuit board (PCB) manufacturing processes with polyimide flexible material. To the best of our knowledge, the compact size of the flexible Vivaldi antenna presented here can be considered one of the smallest sizes that have been reported in the literature. Figure 1 illustrates the geometry of the proposed flexible Vivaldi antenna 1. The antenna is fabricated on an inexpensive Polyamide substrate with a thickness of 0.1 mm, relative permittivity of 3.5, and loss tangent, tanδ = 0.02. The radiating side of the antenna on the top layer consists of a microstrip feed line, a horizontal line that passes above the parabolic notch on the GND plane, and a triangular shape to enhance propagation. The feeder line of the antenna consists of two segments of the line where the first segment has a width of 0.21 mm, which results in a 50 Ω matching impedance. The second segment of the feeder has a width of 0.28 mm to match the first segment of the feeder to the horizontal line of the radiation side. The horizontal line extends through the triangular shape of the radiating side of the antenna. The antenna has a 50 Ω CPW feeder line on the top side, and an SMA connector is connected at the end of the line. The proposed antenna underwent many design stages. Starting with a 45 × 40 × 1.5 mm3 Vivaldi antenna, the parameters were optimized to yield the proposed final shape of 25 × 20 × 0.1 mm3. The radiating shape of the antenna was also investigated to yield the best possible outcome. The designed dimensions of the proposed Vivaldi antenna were obtained using the commercially available simulation software Ansoft HFSS. The optimized parameters of the final design of proposed Antenna 1 are given in Table 1.
The simulation results show that the antenna has two resonant frequencies: the first resonant frequency is at 4.0 GHz with a 1 GHz impedance bandwidth, and the second is located at 9.4 GHz with a 1 GHz impedance bandwidth. Figure 2 shows the reflection coefficient of this antenna against frequency.

2.2. Modified Antenna with One Resonant

Proposed Antenna 1 has two resonant frequencies, at 4 GHz and 9.4 GHz. However, only the bandwidth of the first resonant frequency is of interest. In this section, a modified antenna is presented to notch the second resonant frequency and further enhance the bandwidth at the first resonant frequency. The modified antenna has the same dimensions as Proposed Antenna 1. However, two slots (DGS) in the ground planes were added to notch the second resonant frequency at 9.4 GHz. The DGS creates a notch frequency at 8.2 GHz, which eliminates the second resonant frequency. Moreover, copper rectangles were added to the propagator side of the antenna. The rectangles work as parasitic elements through which the bandwidth of the antenna is enhanced. Modified Antenna dimensions are shown in Figure 3. The modified antenna has the same dimensions as Proposed Antenna 1 except for the added slots and parasitic elements. The dimension parameters of the added elements are listed in Table 2.
Figure 4 shows the reflection coefficients of the modified antenna. As can be seen, the modified antenna has only one resonant frequency, at 4.4 GHz. Moreover, the impedance bandwidth of the modified antenna, 1.2 GHz, is greater than the bandwidth of Proposed Antenna 1 by 20%. The current distribution of the modified antenna is higher at the feeder line of the radiator. On the bottom side, the current is concentrated around the edges of the parabolic cut in the ground plane, with a higher current around DGS, as shown in Figure 5. The gain, as demonstrated in Figure 6, increases over frequency, and it is at its minimum at the notch frequency. It has a local maximum of 2.33 dBi at 4.4 GHz, the center frequency of the antenna. The gain is at its minimum at 6.7 GHz, which corresponds to the maximum value of the reflection coefficient shown in Figure 4. The modified antenna has a directive radiation pattern. Figure 7 shows the 3D radiation pattern of the modified antenna. The E-plane and H-plane are shown in Figure 8, where the XZ plane represents the E-plane, and the YZ plane represents the H-plane.

2.3. Parametric Study of Modified Antenna

To achieve the highest possible bandwidth of the antenna and enhance the reflection coefficient, the DGS parameters and location were varied. Moreover, the dimensions and size of the parasitic element were studied. The modified antenna achieves the best possible result. The studies detailed below show the effects of changing each parameter.

2.3.1. Changing DGS Width, W1

The DGS width affects the bandwidth at the first and second resonant frequency. As can be seen in Figure 9, W1 = 0.2 mm shows the best result.

2.3.2. Changing Parasitic Element Width, W2

Reducing W2 results in a slightly higher BW but increases the reflection coefficient. It also introduces a second resonant at 8.2 GHz. Increasing W2 enhance the reflection coefficient but reduces the bandwidth. Figure 10 shows the effects of changing W2. It can be seen that W2 = 0.15 mm is the optimum value.

2.3.3. Changing DGS Length, L1

The length of DGS affects the bandwidth of the antenna at 4.4 GHz, as shown in Figure 11. A smaller value of L1 slightly decreases the BW of the antenna and enhances the reflection coefficient of the antenna. A larger value of L1 enhances the bandwidth but greatly increases the reflection coefficient.

2.3.4. Changing Parasitic Element Length, L2

Increasing L2 results in a similar BW but also increases the reflection coefficient, as shown in Figure 12. Reducing L2 increases the BW but introduces a second resonant frequency at 8.8 GHz and increases the reflection coefficient.

2.3.5. Changing DGS Height, h

The height of the DGS affects the resonant frequency and BW of the antenna, as shown in Figure 13. A higher value of h results in a better BW but introduces a second resonant frequency at 8.2 GHz, which conflicts with the purpose of the modified antenna. On the other hand, a smaller value of h results in a higher reflection coefficient.

2.3.6. Changing Parasitic Element Gap, g

The gap between the parasitic element and the radiator affects the center frequency location and reflection coefficient values. As shown in Figure 14, g = 0.2 mm is the optimum value for this antenna.

2.4. Comparison to Literature

The proposed antenna was compared with various antennas reported in the literature. The results are summarized in Table 3. The proposed antenna has a smaller BW than most reported antennas. However, a BW greater than 1 GHz is considered sufficient for breast imaging. Moreover, the proposed antenna reduces the size of a conventional Vivaldi antenna by half while keeping a directional radiation pattern.

2.5. Antenna Manufacture

The modified antenna was manufactured on flexible polyimide material with 18 µm copper from both sides using standard PCB manufacturing processes. A standard SMA connector was attached to the antenna as a feeder. The connector has four ground pins and is suitable for a PCB thickness of 1.6 mm. To overcome this issue, two ground pins were removed from the connector, and the connector was assembled diagonally so that it fit without bending the antenna. Figure 15 shows the top and bottom sides of the manufactured antenna after assembly. The reflection coefficient of the fabricated antenna was measured using Vector Network Analyzer (VNA). The result showed that the resonant frequency was shifted to 4.0 GHz. Moreover, the measured reflection coefficient showed that the antenna has higher bandwidth than the simulated antenna. The actual antenna has a bandwidth of 1.7 GHz centered at 4 GHz. The difference in antenna bandwidth and center frequency is mainly due to the fabrication and measurement errors. Figure 16 shows simulated and measured reflection coefficients. The radiation pattern of the antenna was measured in an anechoic chamber. Figure 17 shows the measured and simulated radiation patterns for the E-plane and H-plane at 4.3 GHz. The results are close to simulation results except for manufacturing and assembly errors.

2.6. Breast Model

A large-scale study of microwave dielectric properties of normal, benign, and malignant breast tissue was reported in [8,9,10]. It has been found that normal breast tissue spans a very large range of dielectric properties dependent on the adipose content of the sample. Low water content (high adipose) exhibits a low dielectric constant, and high water content glandular or fibroconnective tissue exhibits a high dielectric constant. In this paper, a half-spherical breast phantom was designed with electrical properties that match the human breast. The phantom radius is 45 mm, and it consists of three layers. The skin layer width is 2.5 mm with a dielectric constant and conductivity of 36 and 4 S/m, respectively. The width of the fat (tissue) layer is 42.5 mm with a dielectric constant and conductivity of 9 and 0.4 S/m, respectively. A spherical tumor of 2.5 mm and 5 mm radius is inserted inside the phantom in different places. The tumor has a relatively high dielectric constant of 55 and conductivity of 4 S/m. The proposed phantom presented in our work has similar dielectric properties and thicknesses to phantoms found in [3,14,20]. The proposed model is developed in HFSS, as shown in Figure 18.

2.7. Imaging Setup

The imaging setup consists of the proposed breast phantom surrounded by transmitting/receiving antenna elements. The number of antennas used for imaging affects the accuracy of the reconstructed image. In this paper, the modified Vivaldi antenna is used as a radiating/receiving element. Nine antenna elements are used as radiating/receiving elements. The placement of the antenna around the breast phantom is critical in this design since the modified antenna has a directional radiation pattern. The nine antennas are placed at an equal distance from each other and 10 mm from the phantom, with the radiating side of the antenna facing the phantom, as shown in Figure 19. The distance from the center of the phantom to the center of each antenna element is r3 = 67.5 mm, and the distance between adjacent antennas in the array is 46.2 mm (center to center). The setup is illustrated in Figure 19 with antennas numbered Antenna1–Antenna9. The fidelity of the modified antenna in the imaging setup was investigated. A signal centered at 4.3 GHz is transmitted from Antenna1 and received by all other antennas. The procedure is repeated nine times with Antenna2, Antenna3, … and Antenna9 as transmitting elements and all others as receiving elements. Backscattered signals are collected in the frequency range of 3.65 to 5.2 GHz. Table 4 shows the minimum reflected signal magnitude of S12, S13, …, S21, S23, …, S97, S98 with and without the presence of the tumor inside the breast phantom. The result shows that the presence of the tumor increases the reflected signal magnitude due to the presence of high-dielectric material. Moreover, a weaker signal magnitude is received when the tumor is not present in the breast phantom. The presence of tumor is very noticeable over the frequency range of 4.1 to 4.7 GHz. The imaging is performed in air; a coupling medium between the array and the phantom is not used.

2.8. Image Reconstruction

Image reconstruction was performed using open-source Matlab software that was developed by Martin Glavin, Edward Jones, and Martin O’Halloran. The software is called “The Microwave Radar-based Imaging Toolbox (MERIT) [34]. It aims to produce a robust, consistent framework for microwave image signal processing and reconstruction.
In the imaging software, collected signals are preprocessed to remove artefacts from system components such as skin and tissues, as well as antenna coupling signals. The software uses the Rotational Subtraction method to perform artefact removal. The imaging setup shown in Figure 19 is used to perform the first radar measurement set. After that, the antenna array is physically rotated around its center by 36°, and a second radar measurement set is performed. Undesired signals such as those from skin, tissues, and antenna coupling are almost identical and appear at the same time position. In contrast, tumor response appears at a different time position in the two data sets. Thus, the imaged object (tumor) response is isolated, and clutter is eliminated by subtracting the rotated scan from the original scan. Applying this technique depends on the homogeneity of the breast within the rotation angle. Therefore, during antenna array rotation, the distance between antennas and skin remains unchanged, while skin and tissue properties and thickness are the same.
The filtered signals are used for image reconstruction using the Delay-and-Sum (DAS) method. The method is based on synthetically focusing signals on points within the imaging domain. Synthetically focused signals from each channel are summed. Then, the energy of the summed signals is used to reconstruct the energy profile of the imaging domain. Points of high contrast exhibit coherent addition from multiple channels resulting in high energy at that point; thus, the areas of high dielectric contrast are highlighted. Synthetic focusing is achieved by compensating attenuation and phase for a given channel. The procedure is summarized in the steps below:
  • Propagation path is estimated from the Euclidian distance between the transmitting antenna, the points of interest, and the receiving antenna;
  • Distance traveled through different media along the path is calculated;
  • Dielectric properties of the media are estimated based on published dielectric datasets.
The distance travelled and the dielectric properties are used to synthetically focus the signals.

3. Results

The proposed imaging setup shown in Figure 19 was used to detect tumors at different locations inside the proposed half-spherical breast model. The imaging is performed in the commercially available software HFSS in the frequency range from 4.0 GHz to 5.2 GHz. Moreover, imaging is performed with a radius of 45 mm and a resolution of 5 × 10⁻⁴. As shown in the figures below, the proposed system could detect a small tumor of a 2.5 mm radius. Figure 20, Figure 21, Figure 22, Figure 23 and Figure 24 show the imaging setup and reconstructed image. The reconstructed image represents the breast phantom where the center of the phantom is the (0,0) point of the reconstructed image. The image extends from −45 to 45 mm on both x- and y-axis, which represent the 2d surface of the breast. The image has a color scale where objects in yellow have a high dielectric constant, indicating tumors. The dark blue object indicates normal healthy tissues. The red circle in the reconstructed image shows the actual size and location of the tumor. Table 5 summarizes tumor locations and sizes with respect to the breast phantom center. As can be seen, the proposed system efficiently detected the tumors with the correct location and size.

4. Discussion

Tumors of different sizes located at different locations inside the phantom were detected. The proposed system shows great accuracy at distinguishing cancerous masses inside human breast. Tumors were detected near the skin layer, as shown in Figure 20 and Figure 21. Although the skin layer has a relatively high dielectric constant of 36, the image reconstruction algorithm was capable of clearly identifying cancerous masses. In Figure 22 and Figure 23, tumors were detected further away from the skin layer inside the tissue layer. The system was also capable of detecting small tumors of size 5 mm and higher. The worst-case scenario is when the tumor is located at the furthest point inside the phantom, the center. In this setup, the initial radar measurement set and the rotated measurement set are similar, which complicates the detection. Figure 24 shows a 5 mm tumor located at (0,0), where it is clearly identified from healthy cells. However, in all cases, an acceptable amount of clutter is present in the reconstructed images due to the limited bandwidth of the antenna.

5. Conclusions

In this paper, a compact flexible Vivaldi antenna for breast imaging application is proposed. The resultant antenna has two resonant frequencies, at 4 and 9.4 GHz. To eliminate the second frequency and enhance the bandwidth of the proposed Vivaldi antenna, two slots have been etched on the ground side of the antenna. Moreover, two rectangular parasitic elements in the radiation side of the antenna have been added. Due to the added DGS and parasitic elements, the resonant frequency is shifted to 4.4 GHz and the simulated bandwidth increased by 20%. The antenna is fabricated on Polyimide flexible material with a thickness of 0.1 mm and dielectric constant of 3.5 using standard PCB manufacturing processes.
The measured and the simulated reflection coefficient are compared, and it is found that they are in good agreement with each other, as discussed in Section 2.5. An array of 9 antennas is used as a microwave breast imaging model to detect and locate the tumor inside the proposed multilayer phantom model using Microwave Radar Based Imaging toolbox (MERIT). This simulation setup successfully identifies and locates the tumors of different sizes and positions inside the phantom model. A more complex breast phantom model can be used that includes more layers such as the fibroglandural tissue, with a dielectric constant close to that of tumor. Moreover, an imaging setup with a higher number of antennas may be used to enhance imaging quality. In the nine-antenna array, the resolution we obtained is good enough to detect a tumor of 5 mm in diameter, but if we consider more antennas, we might be able to detect tumors of smaller sizes. This will be considered in a future study to generate a more realistic model.

Author Contributions

Conceptualization, A.M.Q. and R.W.A.; methodology, A.M.Q., R.W.A., and K.H.A.; software, A.M.Q.; validation, A.M.Q., R.W.A., and K.H.A.; formal analysis, A.M.Q.; investigation, A.M.Q.; writing—original draft preparation, A.M.Q.; writing—review and editing, R.W.A.; visualization, A.M.Q.; supervision, R.W.A.; project administration, R.W.A. All authors have read and agreed to the published version of the manuscript.

Funding

This research was funded by the Deanship of Scientific Research (DSR) at King Abdulaziz University, Jeddah, Saudi Arabia, under grant number FP-208-43.

Institutional Review Board Statement

Not applicable.

Informed Consent Statement

Not applicable.

Data Availability Statement

Not applicable.

Conflicts of Interest

The authors declare no conflict of interest.

References

  1. Siegel, R.L.; Miller, K.D.; Fuchs, H.E.; Jemal, A. Cancer statistics. CA Cancer J. Clin. 2022. [Google Scholar] [CrossRef]
  2. Byrne, D.; Ohalloran, M.; Jones, E.; Glavin, M. A comparison of data-independent microwave beamforming algorithms for the early detection of breast cancer. In Proceedings of the Annual International Conference of the IEEE Engineering in Medicine and Biology Society, Minneapolis, MN, USA, 3–6 September 2009. [Google Scholar] [CrossRef]
  3. Samsuzzaman, M.; Islam, M.T.; Shovon, A.; Faruque, R.I.; Misran, N. A 16-modified antipodal Vivaldi Antenna Array for microwave-based breast tumor imaging applications. Microw. Opt. Technol. Lett. 2019, 61, 2110–2118. [Google Scholar] [CrossRef]
  4. Munawar, A.; Adabi, S.; Ismail, A.; Saripan, M.; Mahmood, R.; Mahadi, W.; Abdullah, R. Breast cancer detection using Forward Scattering Radar technique. In Proceedings of the IEEE International RF and Microwave Conference, Kuala Lumpur, Malaysia, 2–4 December 2008. [Google Scholar] [CrossRef]
  5. Li, Q.; Xiao, X.; Wang, L.; Song, H.; Kono, H.; Liu, P.; Lu, H.; Kikkawa, T. Direct Extraction of Tumor Response Based on Ensemble Empirical Mode Decomposition for Image Reconstruction of Early Breast Cancer Detection by UWB. IEEE Trans. Biomed. Circuits Syst. 2015, 9, 710–724. [Google Scholar] [CrossRef] [PubMed]
  6. Woten, A.; Lusth, J.; El-Shenawee, M. Interpreting Artificial Neural Networks for Microwave Detection of Breast Cancer. IEEE Microw. Wirel. Compon. Lett. 2007, 17, 825–827. [Google Scholar] [CrossRef]
  7. Bahrami, H.; Porter, E.; Santorelli, A.; Gosselin, B.; Popovic, M.; Rusch, L.A. Flexible sixteen monopole antenna array for microwave breast cancer detection. In Proceedings of the 36th Annual International Conference of the IEEE Engineering in Medicine and Biology Society, Chicago, IL, USA, 26–30 August 2014. [Google Scholar] [CrossRef]
  8. Lazebnik, M.; Popovic, D.; McCartney, L.; Watkins, C.B.; Lindstrom, M.J.; Harter, J.; Sewall, S.; Ogilvie, T.; Magliocco, A.; Breslin, T.M.; et al. A large-scale study of the ultrawideband microwave dielectric properties of normal, benign and malignant breast tissues obtained from cancer surgeries. Phys. Med. Biol. 2007, 52, 6093. [Google Scholar] [CrossRef]
  9. Martellosio, A.; Bellomi, M.; Pasian, M.; Bozzi, M.; Perregrini, L.; Mazzanti, A.; Svelto, F.; Summers, P.E.; Renne, G.; Preda, L. Dielectric properties characterization from 0.5 to 50 GHz of breast cancer tissues. IEEE Trans. Microw. Theory Tech. 2017, 65, 998–1011. [Google Scholar] [CrossRef]
  10. Di Meo, S.; Espin-Lopez, P.F.; Martellosio, A.; Pasian, M.; Bozzi, M.; Perregrini, L.; Mazzanti, A.; Svelto, F.; Summers, P.E.; Renne, G.; et al. Dielectric properties of breast tissues: Experimental results up to 50 GHz. In Proceedings of the 12th European Conference on Antennas and Propagation, London, UK, 9–13 April 2018. [Google Scholar] [CrossRef]
  11. Misilmani, H.M.; Naous, T.; Khatib, S.K.; Kabalan, K.Y. A survey on antenna designs for breast cancer detection using microwave imaging. IEEE Access 2020, 8, 102570–102594. [Google Scholar] [CrossRef]
  12. Woten, D.A.; El-Shenawee, M. Broadband Dual Linear Polarized Antenna for Statistical Detection of Breast Cancer. IEEE Trans. Antennas Propag. 2008, 56, 3576–3580. [Google Scholar] [CrossRef]
  13. Sugitani, T.; Kubota, S.; Toya, A.; Xiao, X.; Kikkawa, T. A Compact 4 × 4 Planar UWB Antenna Array for 3-D Breast Cancer Detection. IEEE Antennas Wirel. Propag. Lett. 2013, 12, 733–736. [Google Scholar] [CrossRef]
  14. Ouerghi, K.; Fadlallah, N.; Smida, A.; Ghayoula, R.; Fattahi, J.; Boulejfen, N. Circular antenna array design for breast cancer detection. In Proceedings of the Sensors Networks Smart and Emerging Technologies (SENSET), Beiriut, Lebanon, 12–14 September 2017. [Google Scholar] [CrossRef] [Green Version]
  15. Alibakhshikenari, M.; Virdee, B.S.; Shukla, P.; Parchin, N.O.; Azpilicueta, L.; See, C.H.; Abd-Alhameed, R.A.; Falcone, F.; Huynen, I.; Denidni, T.A.; et al. Metamaterial-inspired antenna array for application in microwave breast imaging systems for tumor detection. IEEE Access 2020, 8, 174667–174678. [Google Scholar] [CrossRef]
  16. Jalilvand, M.; Li, X.; Zwirello, L.; Zwick, T. Ultra wideband compact near-field imaging system for breast cancer detection. IET Microw. Antennas Propag. 2015, 9, 1009–1014. [Google Scholar] [CrossRef]
  17. Craddock, I.J.; Klemm, M.; Leendertz, J.; Preece, A.W.; Benjamin, R. An improved hemispherical antenna array design for breast imaging. In Proceedings of the 2nd European Conference on Antennas and Propagation, Edinburgh, UK, 11–16 November 2007. [Google Scholar] [CrossRef]
  18. Mahmud, M.; Islam, M.; Misran, N.; Almutairi, A.; Cho, M. Ultra-Wideband (UWB) Antenna Sensor Based Microwave Breast Imaging: A Review. Sensors 2018, 18, 2951. [Google Scholar] [CrossRef] [PubMed] [Green Version]
  19. Mobashsher, A.T.; Abbosh, A.M. Performance of Directional and Omnidirectional Antennas in Wideband Head Imaging. IEEE Antennas Wirel. Propag. Lett. 2016, 15, 1618–1621. [Google Scholar] [CrossRef]
  20. Hailu, D.M.; Safavi-Naeini, S. Narrow focus ultra-wideband antenna for breast cancer detection. In Proceedings of the IEEE Radio and Wireless Symposium, San Diego, CA, USA, 18–22 January 2009. [Google Scholar] [CrossRef]
  21. Faisal, M.A.; Uddin, M.J.; Ullah, M.W.; Kamrul, M.I.; Haque, K.M.; Rahman, E. Comparative analysis of different types of breast cancer cell detection antennas. In Proceedings of the 2017 International Conference on Inventive Computing and Informatics (ICICI), Coimbatore, India, 23–24 November 2017. [Google Scholar] [CrossRef]
  22. Sugitani, T.; Kubota, S.; Toya, A.; Kikkawa, T. Compact planar UWB antenna array for breast cancer detection. In Proceedings of the 2012 IEEE International Symposium on Antennas and Propagation, Chicago, IL, USA, 8–14 July 2012. [Google Scholar] [CrossRef]
  23. Hasan, K.; Hadidy, M.E.; Morsi, H. Reflectarray antenna for breast cancer detection and biomedical applications. In Proceedings of the IEEE Middle East Conference on Antennas and Propagation (MECAP), Beirut, Lebanon, 20–22 September 2016. [Google Scholar] [CrossRef]
  24. Iliopoulos, I.; Meo, S.D.; Pasian, M.; Zhadobov, M.; Pouliguen, P.; Potier, P.; Perregrini, L.; Sauleau, R.; Ettorre, M. Enhancement of penetration of millimeter waves by field focusing applied to breast cancer detection. IEEE Trans. Biomed. Eng. 2021, 68, 959–966. [Google Scholar] [CrossRef]
  25. Ley, S.; Sachs, J.; Faenger, B.; Hilger, I.; Helbig, M. MNP-enhanced microwave medical imaging by means of Pseudo-Noise Sensing. Sensors 2021, 21, 6613. [Google Scholar] [CrossRef]
  26. Botterill, T.; Lotz, T.; Kashif, A.; Chase, G. Reconstructing 3-D Skin Surface Motion for the DIET Breast Cancer Screening System. IEEE Trans. Med. Imaging 2014, 33, 1109–1118. [Google Scholar] [CrossRef]
  27. Li, X.; Hagness, S.C. A confocal microwave imaging algorithm for Breast Cancer Detection. IEEE Microw. Wirel. Compon. Lett. 2001, 11, 130–132. [Google Scholar] [CrossRef] [Green Version]
  28. Bond, E.J.; Li, X.; Hagness, S.C.; Van Veen, B.D. Microwave Imaging via space-time beamforming for early detection of breast cancer. In Proceedings of the IEEE International Conference on Acoustics Speech and Signal Processing, Orlando, FL, USA, 13–17 May 2002. [Google Scholar] [CrossRef]
  29. Klemm, M.; Craddock, I.J.; Leendertz, J.A.; Preece, A.; Benjamin, R. Improved delay-and-sum beamforming algorithm for Breast Cancer Detection. Int. J. Antennas Propag. 2008, 2008, 761402. [Google Scholar] [CrossRef] [Green Version]
  30. Özmen, H.; Kurt, M.B. Radar-based Microwave Breast Cancer Detection System with a high-performance ultrawide band Antipodal Vivaldi Antenna. Turk. J. Electr. Eng. Comput. Sci. 2021, 29, 2326–2345. [Google Scholar] [CrossRef]
  31. Guruswamy, S.; Chinniah, R.; Thangavelu, K. Design and implementation of compact ultra-wideband Vivaldi antenna with directors for microwave-based imaging of breast cancer. Analog. Integr. Circuits Signal Processing 2021, 108, 45–57. [Google Scholar] [CrossRef]
  32. Danjuma, I.M.; Noras, J.M.; Abd-Alhameed, R.A.; Obeidat, H.A.; Oguntala, G.A.; Eya, N.N.; Mohammad, B.A. Microwave imaging using arrays of Vivaldi antenna for breast cancer applications. Int. J. Microw. Appl. 2018, 7, 32–37. [Google Scholar] [CrossRef]
  33. Islam, M.T.; Mahmud, M.Z.; Islam, M.T.; Kibria, S.; Samsuzzaman, M. A low cost and portable microwave imaging system for breast tumor detection using UWB directional antenna array. Sci. Rep. 2019, 9, 15491. [Google Scholar] [CrossRef] [PubMed] [Green Version]
  34. O’Loughlin, D.; Elahi, M.A.; Porter, E.; Shahzad, A.; Oliveira, B.L.; Glavin, M.; Jones, E.; O’Halloran, M. Open-source software for microwave radar-based Image Reconstruction. In Proceedings of the 12th European Conference on Antennas and Propagation, London, UK, 9–13 April 2018. [Google Scholar] [CrossRef]
Figure 1. Proposed Antenna 1 Dimensions.
Applsci 12 04908 g001
Figure 2. Reflection Coefficient of Proposed Antenna 1.
Applsci 12 04908 g002
Figure 3. Modified Antenna’s dimensions.
Applsci 12 04908 g003
Figure 4. Reflection Coefficient of the Modified Antenna.
Applsci 12 04908 g004
Figure 5. Current Distribution at 4.3 GHz: (a) Top Side; (b) Bottom Side.
Applsci 12 04908 g005
Figure 6. Maximum Gain of the Modified Antenna.
Applsci 12 04908 g006
Figure 7. Three-dimensional Radiation Pattern of the Modified Antenna at 4.3 GHz.
Applsci 12 04908 g007
Figure 8. Two-dimensional Radiation Pattern at 4 GHz of Modified Antenna.
Applsci 12 04908 g008
Figure 9. Effects of Changing W1.
Applsci 12 04908 g009
Figure 10. Effects of Changing W2.
Applsci 12 04908 g010
Figure 11. Effects of DGS Length L1.
Applsci 12 04908 g011
Figure 12. Effects of Changing L2.
Applsci 12 04908 g012
Figure 13. Effects of Changing DGS Height.
Applsci 12 04908 g013
Figure 14. Effects of Changing Parasitic Element Gap.
Applsci 12 04908 g014
Figure 15. Modified Antenna: (a) Top Side; (b) Bottom Side.
Applsci 12 04908 g015
Figure 16. Simulated and Measured Reflection Coefficients.
Applsci 12 04908 g016
Figure 17. Radiation Pattern at 4.3 GHz: (a) E-Plane; (b) H-Plane.
Applsci 12 04908 g017
Figure 18. Proposed Breast Phantom.
Applsci 12 04908 g018
Figure 19. Imaging Setup using Modified Antenna.
Applsci 12 04908 g019
Figure 20. Tumor Detection: (a) Imaging Setup; (b) Detected Tumor.
Applsci 12 04908 g020
Figure 21. Tumor Detection: (a) Imaging Setup; (b) Detected Tumor.
Applsci 12 04908 g021
Figure 22. Tumor Detection: (a) Imaging Setup; (b) Detected Tumor.
Applsci 12 04908 g022
Figure 23. Tumor Detection: (a) Imaging Setup; (b) Detected Tumor.
Applsci 12 04908 g023
Figure 24. Tumor Detection: (a) Imaging Setup; (b) Detected Tumor.
Applsci 12 04908 g024
Table 1. Proposed Optimal Dimensions of Antenna 1.
ParameterValue (mm)ParameterValue (mm)
L25W20
L18L23.45
L37.54L44.27
L50.8L62.83
W10.21W20.28
W30.27D14
W43.5F11.45
Table 2. Modified Antenna optimal parameters.
ParameterValue (mm)ParameterValue (mm)
L12.8L27
W10.2W20.15
h15.2g0.2
Table 3. Comparison of Proposed Antennas and others reported in the Literature.
CitationTypeRadiationSize
mm3
Band
(GHz)
Fc
(GHz)
BW (GHz)Gain
(dBi)
[3]VivaldiDirectional40 × 40 × 1.62.5–11NA8.57.2
[7]Flexible MonopoleOmni-directional20 × 20 × 0.052–432NA
[30]VivaldiDirectional36 × 36 × 1.63–127.298.2
[31]VivaldiDirectional48 × 46 × 0.83.1–10.67.87.58.25
[32]VivaldiDirectional57 × 41 × 1.63–93.86NA
[33]VivaldiDirectional51 × 42 × 0.052.8–754.27.5
Proposed 1
With two resonant
VivaldiDirectional25 × 20 × 0.13.8–4.8 and 9–104.0 and 9.51.0 and1.02.24 and 2.7
Proposed 2
With one resonant
VivaldiDirectional25 × 20 × 0.14.0–5.24.41.22.33
Table 4. Backscattered Signal Magnitude with and without the Presence of Tumor.
Frequency Range (GHz)Minimum Reflected-Signal Magnitude without Tumor (dB)Minimum Reflected-Signal Magnitude with Tumor (dB)Variation in Magnitude (dB)Presence of Tumor
3.65–3.8−7.5−5.6−1.9Weak Noticeable
3.8–3.95−10.6−7.7−2.9Weak Noticeable
3.95–4.11−16.1−11.9−4.2Noticeable
4.1–4.25−30.3−21.8−8.5Strong Noticeable
4.25–4.4−34.0−18.6−15.5Strong Noticeable
4.4–4.6−28.0−16.4−11.6Strong Noticeable
4.6–4.7−21.5−14.3−7.2Strong Noticeable
4.7–4.9−16.4−11.7−4.7Noticeable
4.9–5−14.0−10.6−3.4Noticeable
5–5.2−16.5−13.0−3.5Weak Noticeable
Table 5. Tumor Locations and Sizes.
Imaging SetupLocation (x,y)Tumor Size (mm) (Diameter)
Figure 20−28, 285
Figure 21−23, 2810
Figure 2220, 135
Figure 23−5, −1710
Figure 240, 05
Publisher’s Note: MDPI stays neutral with regard to jurisdictional claims in published maps and institutional affiliations.

