Abstract
Stray neutrons might cause several negative impacts. However, it is usually difficult to conduct precise stray neutron simulations using the Monte Carlo method. Therefore, in this study, a measurement technique was proposed to study the stray neutrons experimentally inside the neutron scattering instruments at China Spallation Neutron Source (CSNS). The adopted measurement instruments comprise an extended-range Bonner sphere spectrometer and a commercial neutron ambient-dose-equivalent dosimeter, which enables us to directly measure the neutron spectra and ambient-dose equivalent H*(10) values. Verification experiments were performed inside the BL06 beam line experimental area at CSNS at two exposed locations with different sample conditions. Comparison of the experimentally measured neutron spectra, integral neutron fluence, and H*(10) value with the simulations demonstrated the feasibility of using the proposed method for studying stray neutrons for the neutron instruments.
1. Introduction
Several neutron instruments [1,2,3,4] have been constructed at China Spallation Neutron Source (CSNS) [5]. Generated by high-energy protons, spallation neutrons are first slowed down by the moderators. Then, the cold and thermal neutrons are transported through optical neutron devices, such as neutron guides and choppers, to carry out experiments on neutron instruments. However, intermediate and fast neutrons may escape from the moderator, and secondary neutrons can be generated by their interaction with the beam line equipment and shielding materials. Entering the scattering room, those neutrons, together with the cold and thermal neutrons present in the beam line, will continue to collide with the devices and walls inside the neutron scattering instruments and form a complex stray neutron field.
Stray neutrons can cause numerous problems. Firstly, the detection counts introduced by these neutrons cannot be discriminated by the time-of-flight technology because their time correlation will have been destructed during multiple collisions. This may reduce the signal-to-noise ratio of scattered neutrons and affect the overall performance of the neutron scattering instruments. In addition, stray neutrons can penetrate the labyrinth shielding and reach the personnel area, causing radiation damage. At present, Monte Carlo simulation codes, such as MCNPX [6] and FLUKA [7], are widely used to simulate stray neutron fields. However, they have limitations that can have a negative impact on the simulation accuracy. Firstly, a secondary source term technique or variance reduction has to be adopted, since the average length of a neutron instrument can reach tens of meters. Moreover, the complexity of the scattering room, always containing a sample environment, neutron collimator, and neutron detector, can necessitate the adoption of a simplified geometric model. Therefore, the simulation accuracy needs to be verified by experimental measurements.
For the measurements of neutrons with a wide energy distribution, spanning from thermal neutrons to hundreds of MeV, and a large range of integral fluxes, the Bonner sphere spectrometer (BSS) [8,9] is considered to be an effective candidate. Conventional and extended-range BSS (ERBSS) have been reported in [10,11,12] to measure the neutron fields inside the experimental halls of Advanced Superconducting Tokamak, the working area of the British Atomic Weapons Agency, and the CSNS back-streaming white neutron source, respectively. This paper aims at developing a stray neutron field measurement method for neutron scattering instruments at CSNS by introducing a measurement technique that combines an ERBSS [13] and a neutron ambient dose equivalent dosimeter (NADED). Verification experiments were performed at the BL06 beam line area at different locations and sample conditions. The results demonstrate that the measured neutron spectra, as well as the deduced fluence rates and ambient dose equivalent H*(10) values, agree with MCNPX simulations, thus confirming the reliability of the method.
2. Instruments and Methods
The BSS has been widely applied in spectrometry research due to its desirable characteristics, including wide energy range, isotropic response, good photon discrimination, and simple signal management. Since the maximum neutron energy can reach hundreds of MeV during the spallation reaction induced by protons with an energy of 1.6 GeV, there will be a certain proportion of fast neutrons in stray neutron fields for the scattering instruments at CSNS, for which the ERBSS has been developed. It comprises a bared 3He-filled spherical proportional counter (type SP9, 2.3Bar, Centronic Ltd., Croydon, UK), 10 high-density polyethylene (PE) shells with outer diameters of 3.0, 3.5, 4.0, 4.5, 5.0, 6.0, 7.0, 8.0, 10 and 12 inches, and three modified multi-shell spheres—4Cu5-7, 4Pb5-7 and 4Pb6-8. A modified sphere consists, from inside to outside, of an inner PE shell, a metal layer, and an outer PE shell. The metallic layer was made of lead or copper because of their large (n, xn) cross-section for high-energy neutrons, and it was sandwiched between the PE shells to smooth the structures in the response functions resulting from resonances in the cross-section.
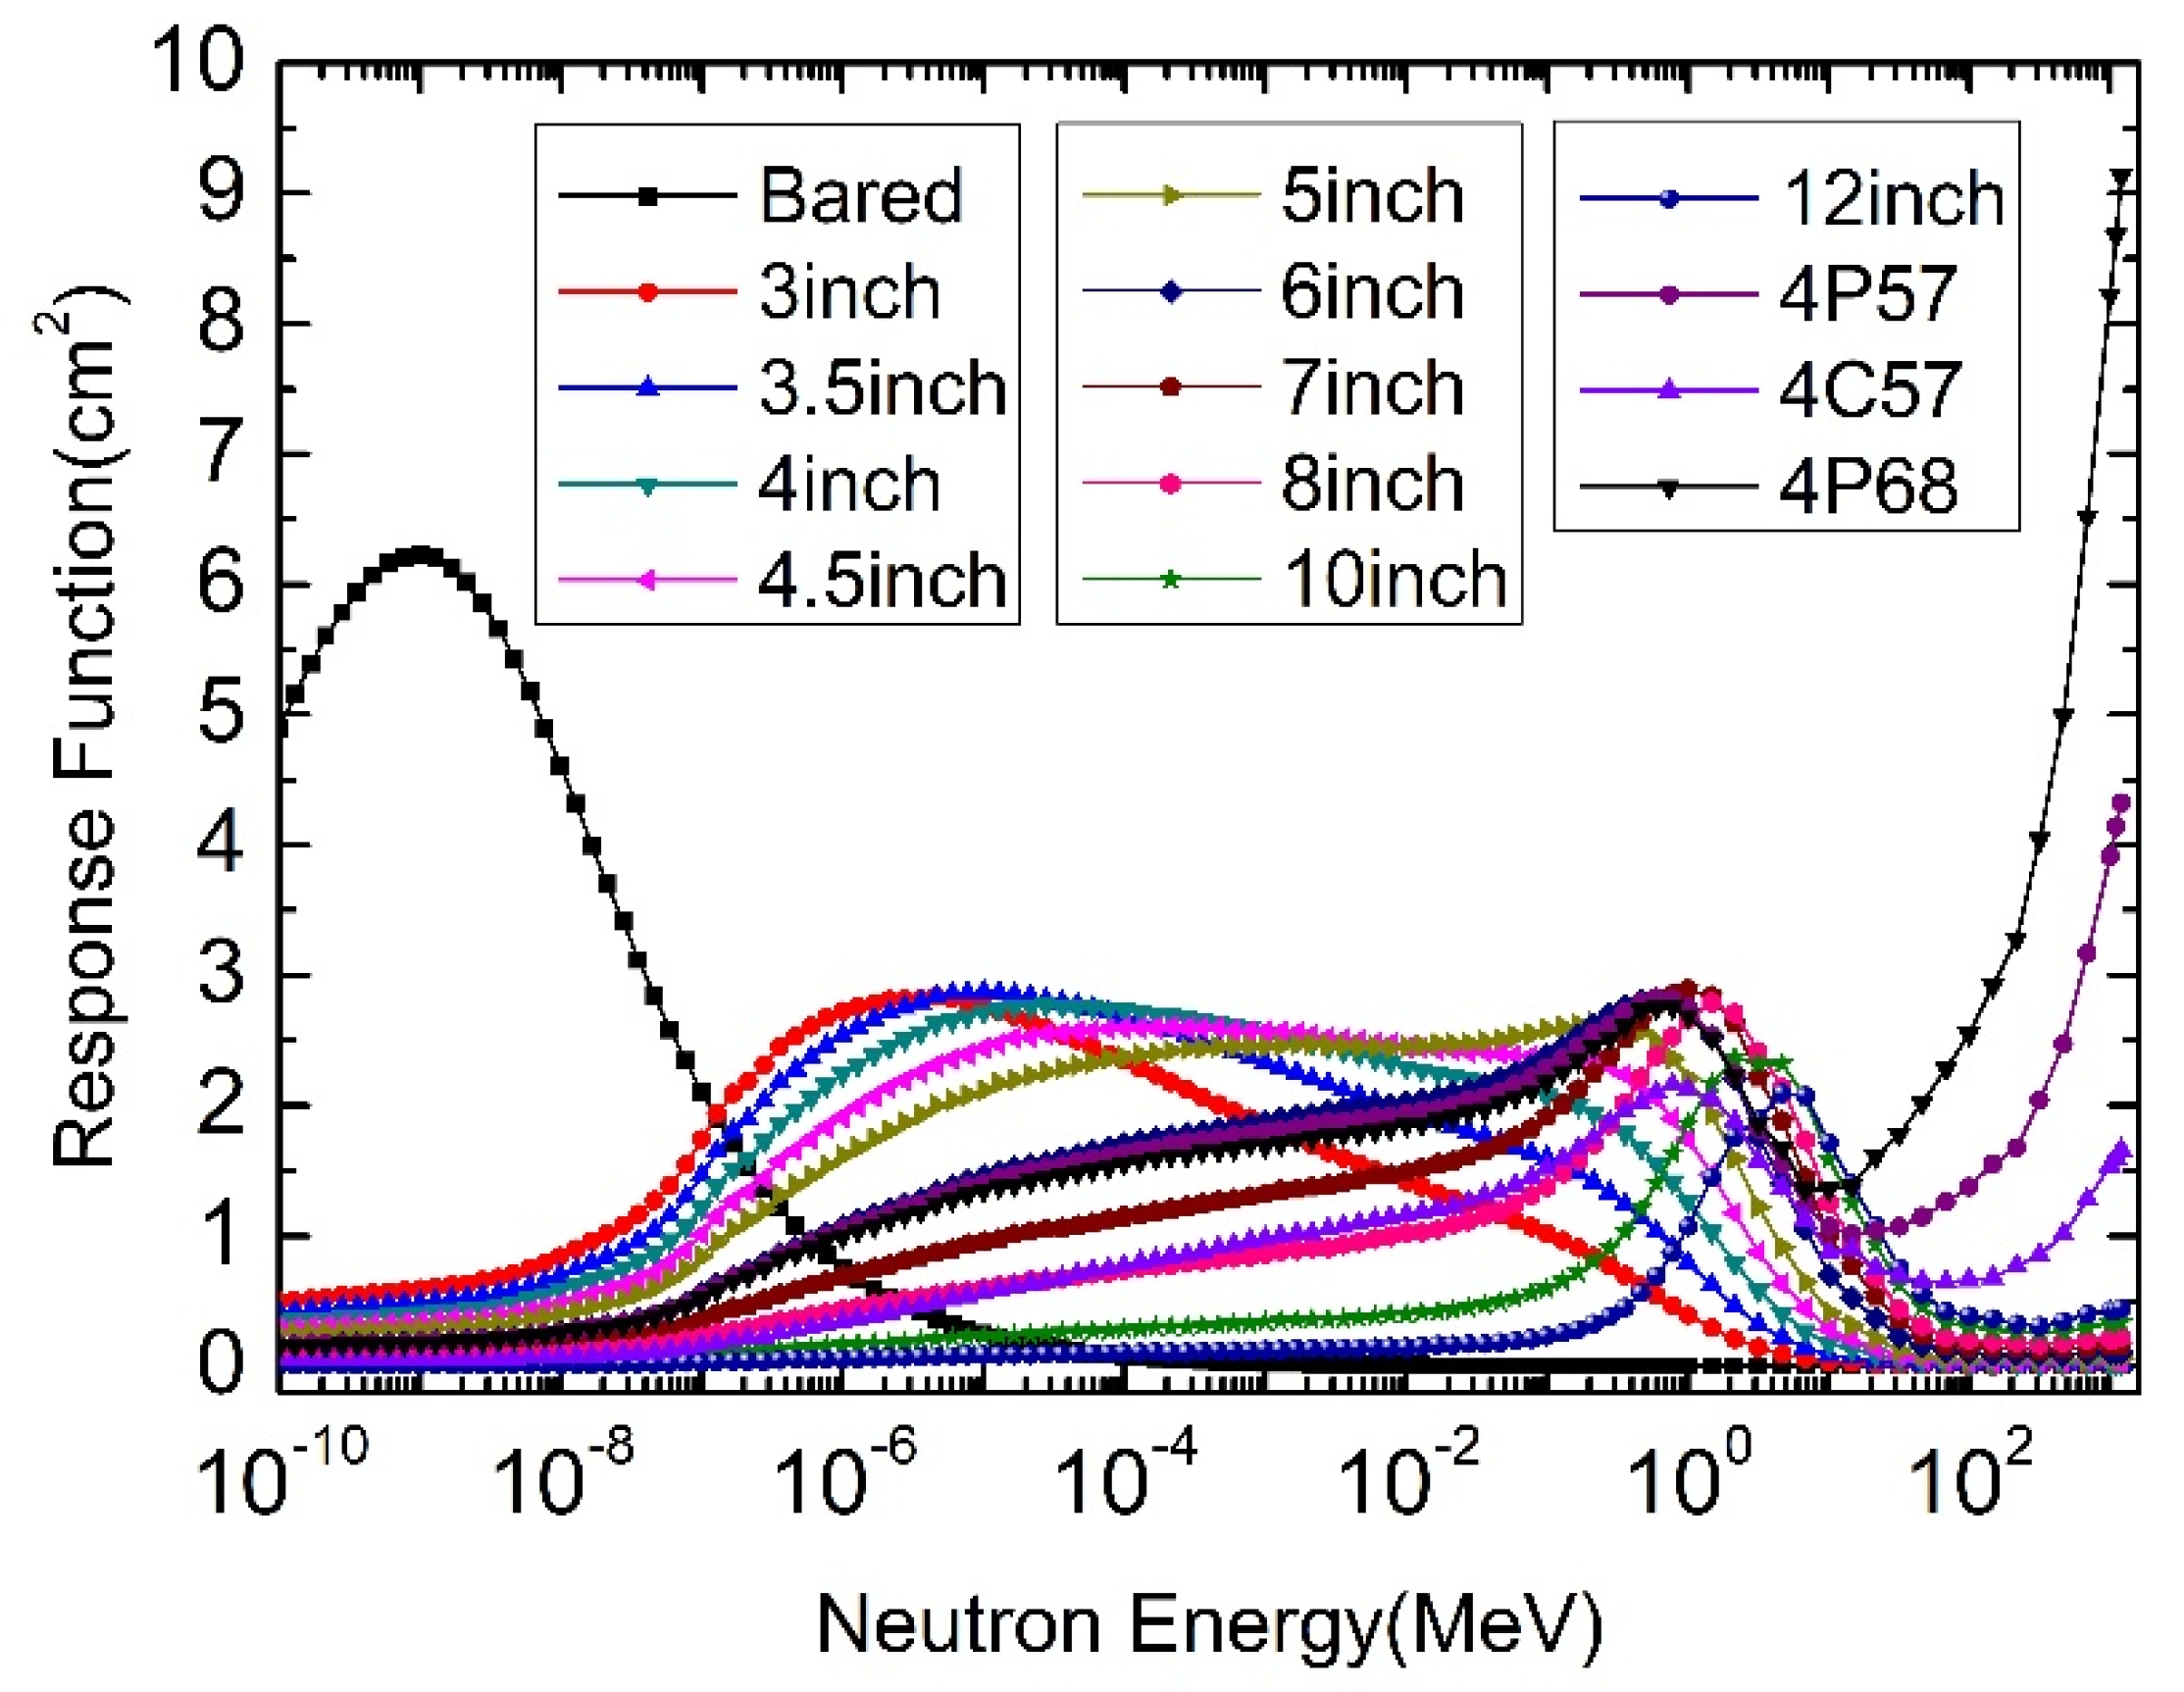
Figure 1 illustrates the neutron response functions of the BSS in the energy range from 1 × 10⁻⁴ eV to 1 GeV, which were simulated using MCNPX-2.5.0. The validation of the response function was performed at China Institute of Atomic Energy, with the 144 keV and 1.2 MeV neutron sources, and the deviations obtained were less than 5%. A compact integrated electronics module (type PDT-10A) [14], manufactured by Precision Data Technology Inc., Everett, WA, USA, was used to supply a high voltage of +830 V to the central 3He sensor, and process signals through a charge-sensitive preamplifier, shaper, and discriminator, and eventually to generate TTL pulses.
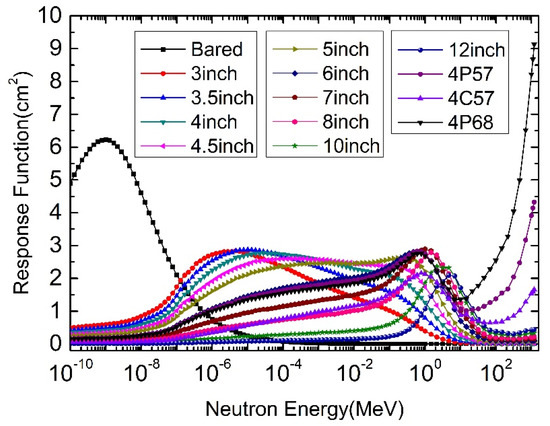
Figure 1.
Response functions of the developed ERBSS.
In addition to the ERBSS, a carefully calibrated NADED was also employed in this work for two main reasons. The NADED of a volume smaller compared to the ERBSS was considered to be easier to operate. However, the feasibility of using it alone to measure the stray neutrons inside the neutron instruments needs to be investigated because of its relatively low sensitivity to fast neutrons. Moreover, since the neutron spectra measured by the ERBSS can be converted into H*(10) values using the fluence-to-ambient dose equivalent conversion coefficients established by ICRP [15] and ICRU [16], it was expected that the two measurement methods could cross-check each other. The adopted NADED (type N3020) [17] was purchased from SIM-MAX Technology Inc., Shanghai, China. It includes a highly sensitive 6LiI(Eu) scintillator, and can directly display and record the neutron ambient dose rate. The neutron response energy range from 0.025 eV to 16 MeV and the dynamic range is from 0.1 to 1.0 × 10⁵ μSv/h.
3. Experiments and Discussion
To verify the reliability of the adopted stray neutron measurement methods, neutron fluence spectra and H*(10) values were measured using the ERBSS and the NADED, respectively, inside the BL06 beam line at CSNS.
3.1. Experimental Setup
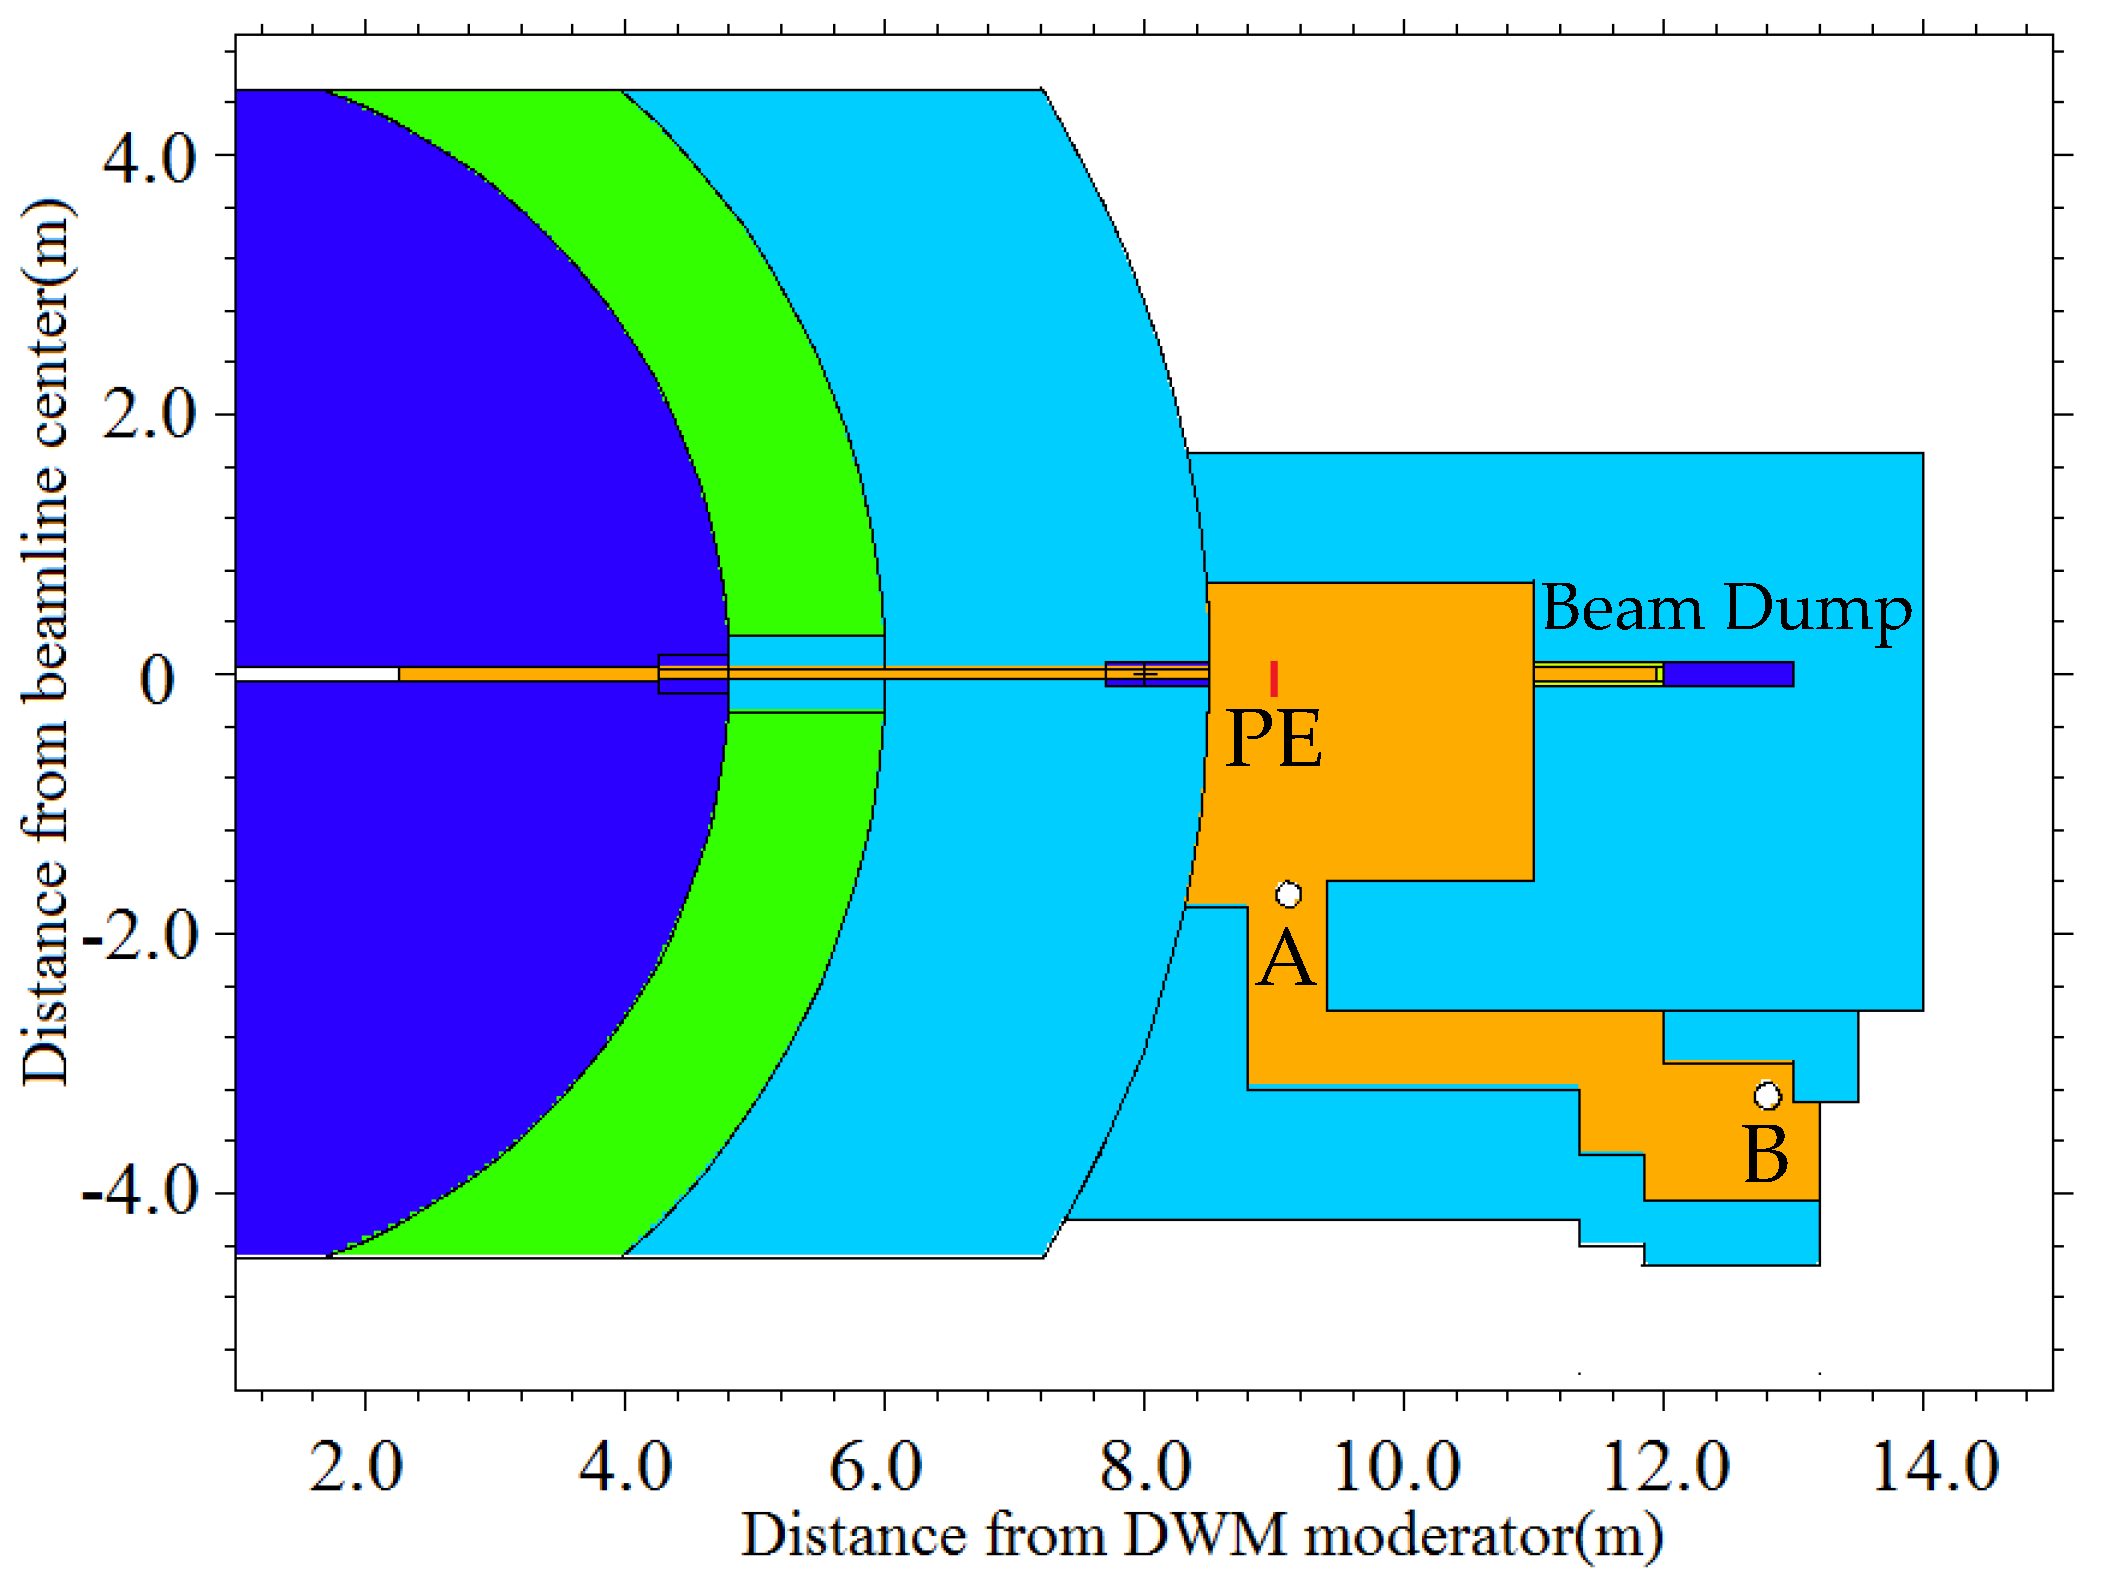
BL06 is a temporary test beam line without any neutron optical devices, which was constructed to perform neutron detector tests and prototype neutron experiment scheme research and validation. It extracted neutrons from a decoupled water moderator [5] located at a distance of 8.5 m. As illustrated in Figure 2, the experimental area of BL06 is around 2.3 m (W) × 2.5 m (L) × 2.8 m (H). The diameter of the beam spot is 6 cm. A beam dump made of boron-containing PE and carbon steel with dimensions of 0.2 m (W) × 2.0 m (D) × 0.2 m (H) was added to reduce the scattered neutrons. A labyrinth structure, composed of 1 m thick concrete blocks and a 0.6 m (W) × 2.0 m (H) corridor, was designed to attenuate the neutron intensity.
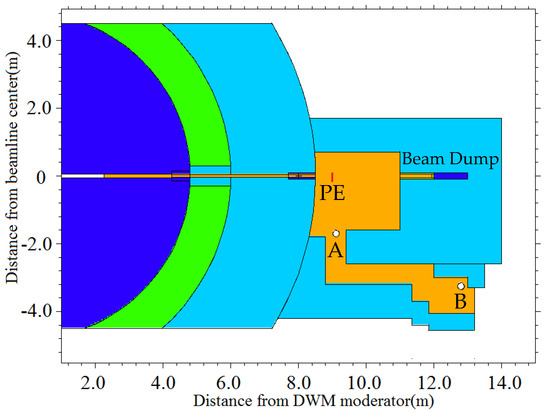
Figure 2.
Geometry of BL06. A and B indicate two measurement locations. (Dark blue—carbon steel; green—heavy concrete; light blue—ordinary concrete; orange—experimental area).
Considering the main hazards of stray neutrons described in Section 1, two locations were selected inside the experimental area: location A was at the entrance to the labyrinth, perpendicular to the beam line from the center with a distance of around 1.8 m, while location B was near the exit of the labyrinth. The plate samples used were 10 cm × 10 cm PE plate samples with thicknesses of 1 cm and 2 cm and located at a distance of 50 cm from the terminal.
3.2. Measurements
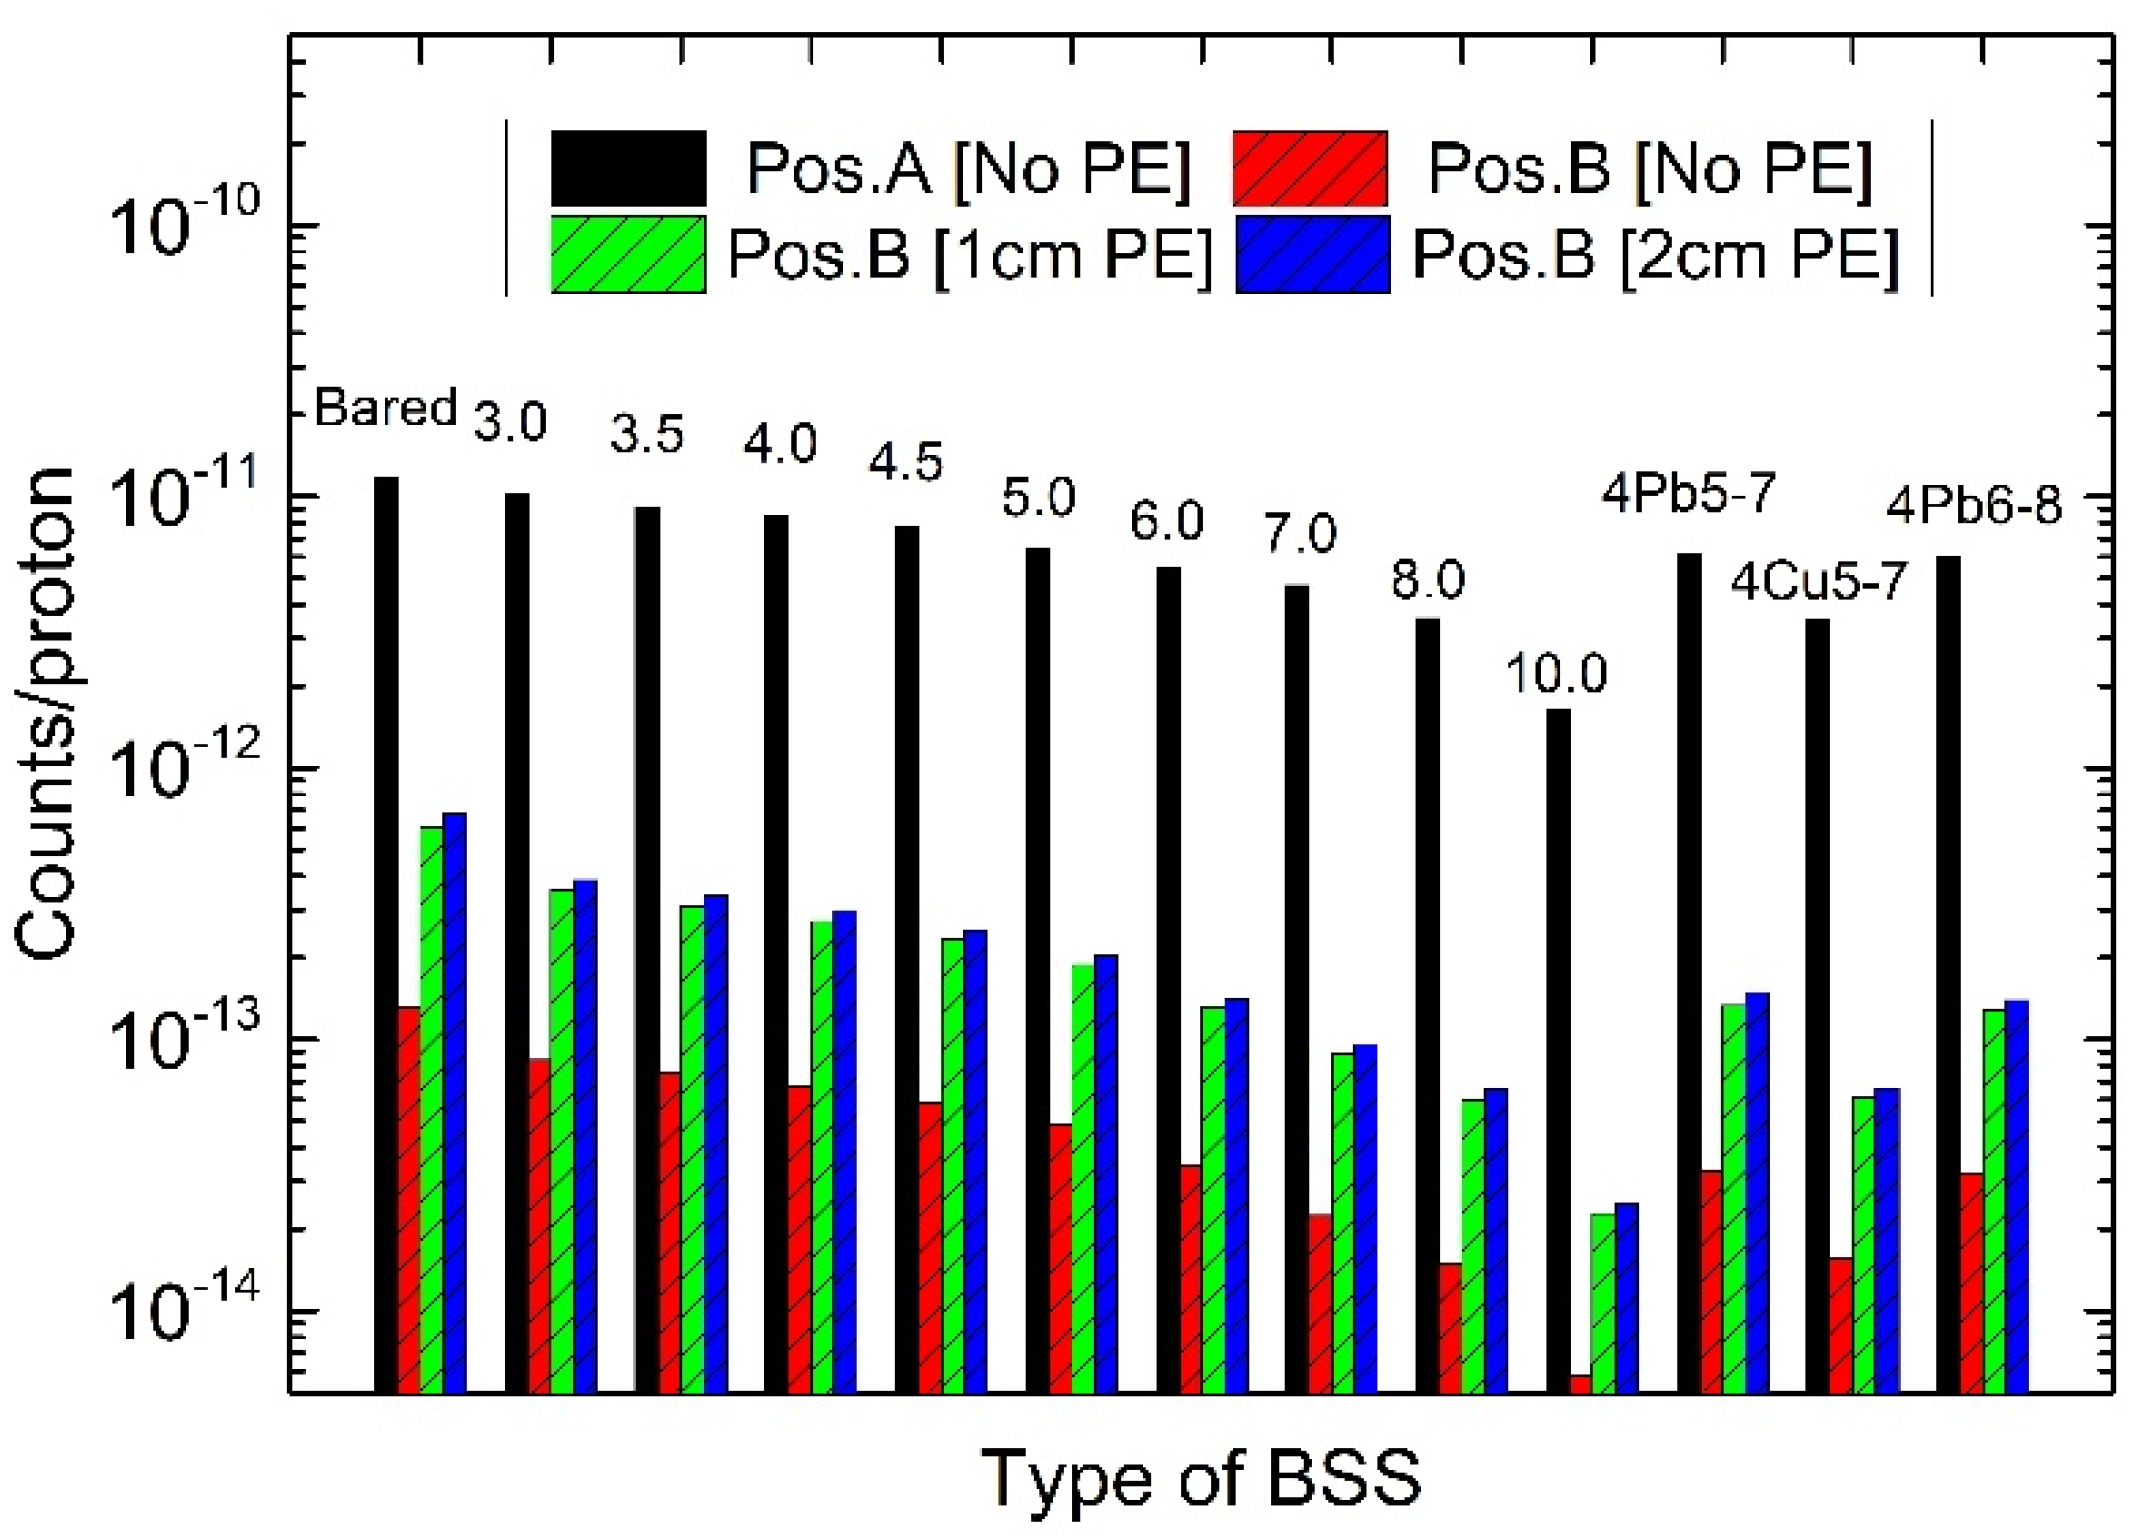
Each sphere of the ERBSS acquires data in turn during the measurement. The 3He counter and the neutron beam of BL06 were aligned horizontally. Depending on the experimental conditions, the duration of data acquisition by each sphere was between several minutes to around an hour, thus ensuring a statistical uncertainty of less than 3%. It was confirmed that the natural neutron background was negligible. The beam-on counting rates were thousands of times larger than when the neutron shutter was off. Figure 3 shows the measured count rates related to protons intensity, which was supplied by a beam monitor with a precision of ±2%. As can be seen, because location A was closer to the neutron aperture and suffered less flux loss, its counting rates were higher than those for any condition at location B. The small-size ERBSS had relatively higher counting rates, suggesting that there was a large portion of low-energy neutrons at each location.

Figure 3.
Counting rates of ERBSS at two measurement locations. ERBSS sphere type indicated above bars.
The NADED took measurements at the same position as the ERBSS and for the same beam conditions. To eliminate statistical fluctuations, each measurement duration exceeded 20 min.
3.3. Results and Discussion
The counting rates of the ERBSS were used to calculate the neutron spectra by employing the SAND-II iterative method [18]. The standard deviation limit, Qk, between the calculated and measured counting rates of the ERBSS can be expressed as follows:
where the N is the total number of the ERBSS, Ai is the measured counting rate for a specific BSS, and Ai[K] is the calculated counting rate by the K-th iteration spectrum. In this study, the standard deviation limit, Qk, was assumed as 0.05. For the number of the sphere less than the energy bins in the neutron spectra, a prior spectrum was required. Because of the unsatisfactory validation statistics for location B, the prior spectrum simulated by MCNPX at location A was used as the initial spectrum to start the unfolding procedure for all of the cases.
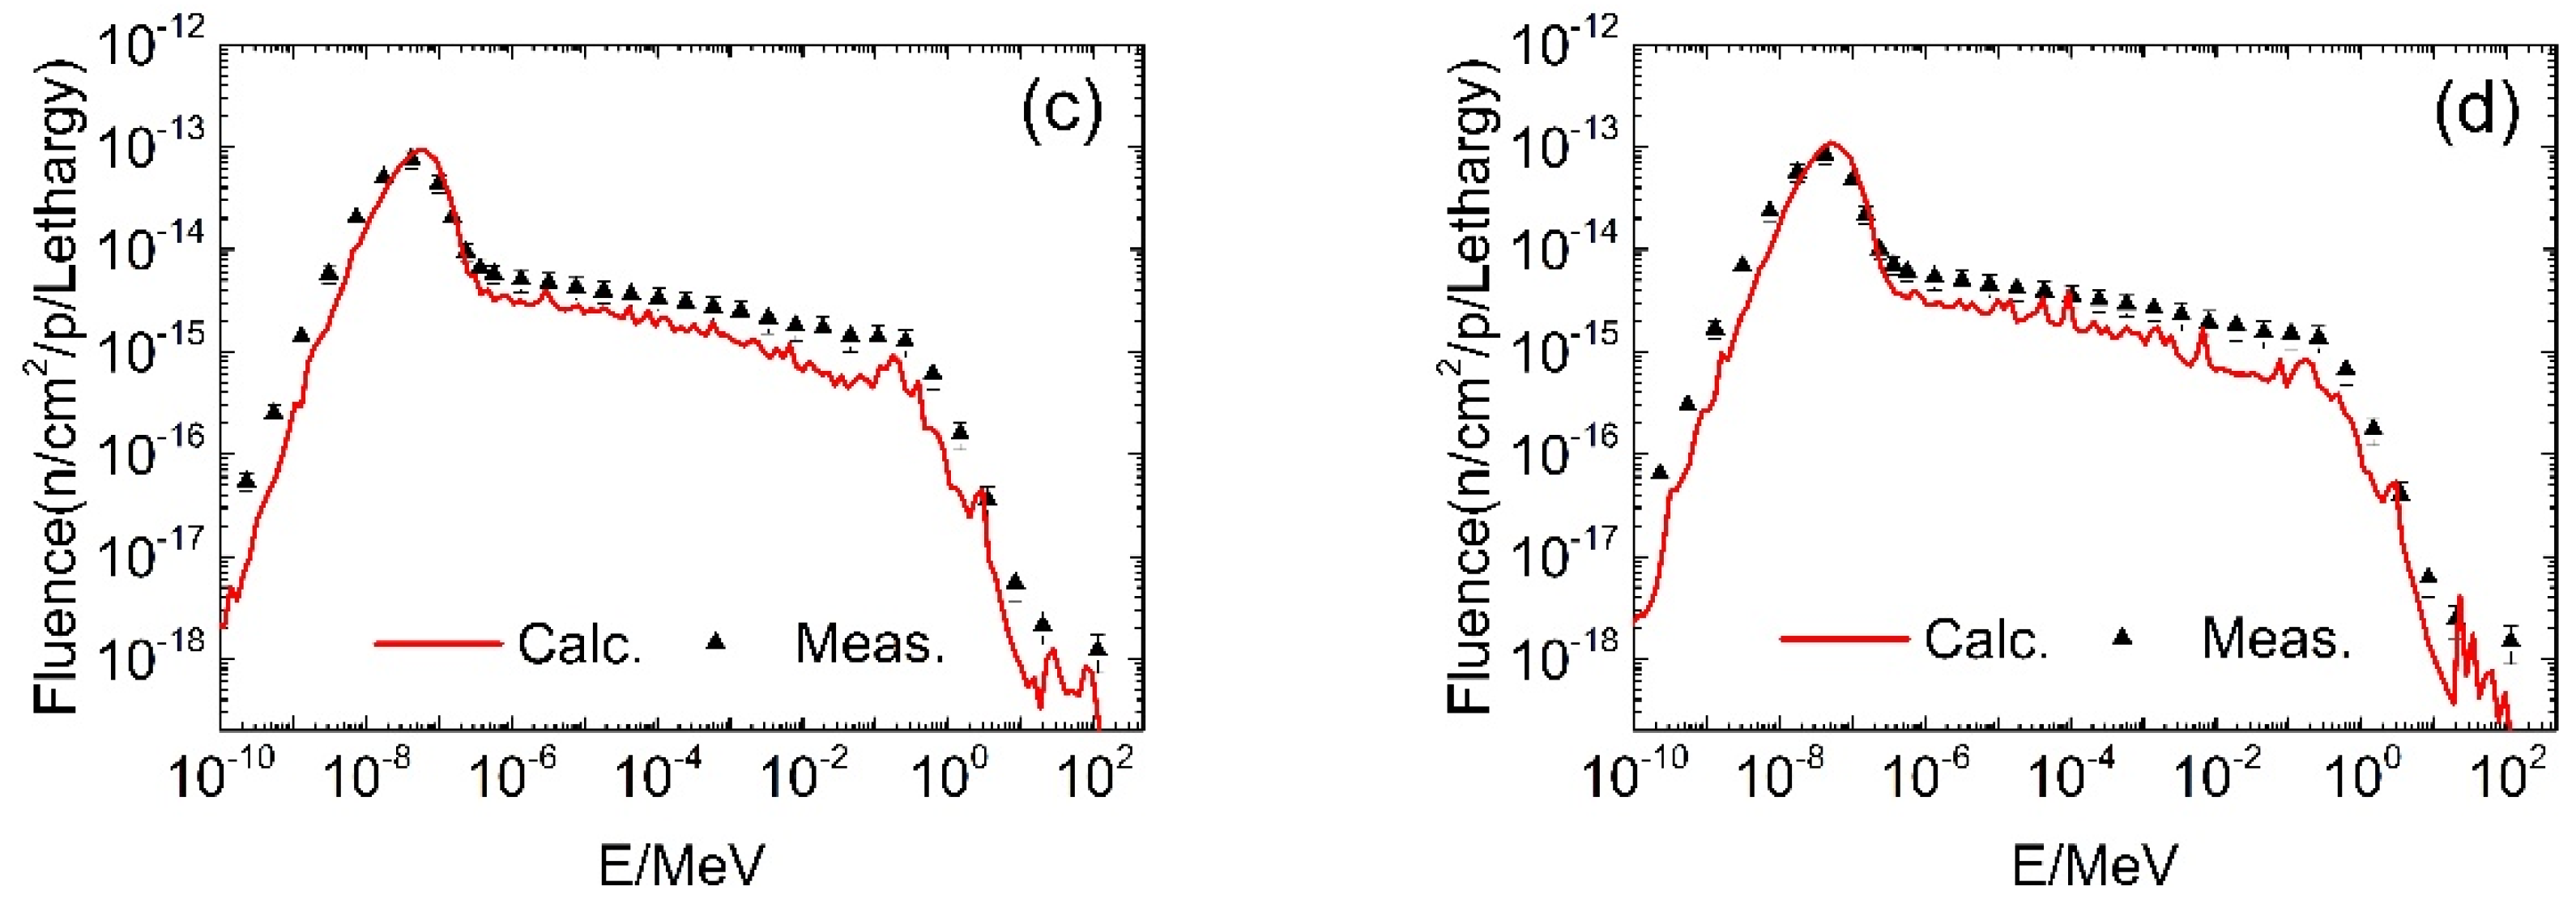
To obtain good validation statistics, the secondary source-term technique was employed in the simulations. A surface source with a cross-sectional area of 10 cm × 10 cm located 100 cm away from the moderator was used. The F5 card was adopted to simulate the neutron spectrum in a vacuum sphere with a diameter of 20 cm. Comparisons between the calculated stray neutron spectra and those measured by the ERBSS at the two locations are shown in Figure 4. At location A, it can be seen that the portion of the thermal neutron was very high and the measured thermal neutron spectra agree well with the simulations. These low-energy stray neutrons may have a great impact on the neutron scattering instrument, since the neutron detectors installed inside the scattering room are highly sensitive to them. It can be also observed in Figure 4a that there are deviations in the epithermal regions with the energy between 1 eV and tens of keV. The main reason is considered to be the deviations between the simulations and the measurements; for instance, the supporting structures for the BSS made of thin stainless steel were not included in the simulation model. At location B, as shown in Figure 4b, the measured spectra agreed well with the calculations, which demonstrated the validity of the measurements and data processing. Figure 4c,d show that the PE plates had a negligible effect on the neutron spectra in shape.
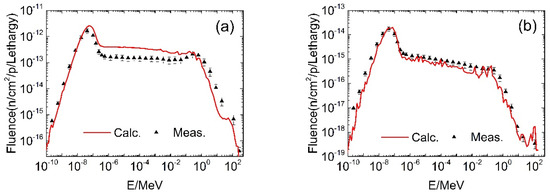

Figure 4.
Comparisons between measured and simulated neutron spectra, (a) location A without PE plate; (b) location B without PE plate; (c) location B with a 1 cm PE plate; (d) location B with a 2 cm PE plate.
To quantify the difference between the measured and calculated neutron spectra, Table 1 lists the integral neutron fluence rate in different energy regions, including the thermal neutrons (below 1 eV), epithermal neutrons (1 eV–1 keV), intermediate energy neutrons (1 keV–1 MeV), and fast neutrons (>1 MeV). Because there was no shielding material between location A and the neutron beam aperture, the total neutron fluence rates of the stray neutrons at location A in each energy range were much higher than those at location B. Although the spectra differed, the portion of fast neutrons at location A was only 2.4%. The total integral flux at location A was about 38% lower than the simulated value, while all the measurements were around 10% higher for location B.

Table 1.
Integral neutron fluence rate (n/cm2/proton) and their percentages in different energy ranges.
Table 2 presents the H*(10) values for the neutrons with different energies, which were derived from the neutron spectra shown in Figure 4 and the ICRP recommended conversion coefficients [15]. The results demonstrate that the discrepancies in the dose rates, contributed by epithermal and fast neutron at location A, were clearly due to the differences in the neutron fluences. On the other hand, at location B, the total neutron dose rates were dominated by the thermal neutrons because of their relatively strong intensity.
Table 2.
H*(10) values for different energy ranges obtained from simulated and experimental spectra from ERBSS, and total ambient dose equivalent rate (μSv/h @ 80kW) from simulations and measurements.
Table 2 also illustrates that the neutron dose rates measured by the NADED were generally higher than those obtained by simulations and measured by the ERBSS. Although the adopted NADED was calibrated with a reference 252Cf neutron source annually, a systematic bias of its response function should be considered. The device might give an incorrect estimate of the dose rate when the energy spectrum at the measurement location differs markedly from the calibration source spectrum. Thus, the applicability of the NADED should be further investigated and a correction factor should be calibrated using the measured results.
The uncertainty of the dose rate measured by the BSS is considered to be ±15%, mainly from the deviation of the response function and the unfolding algorithms. The accuracy of the NADED given by the manufacturer is around ±20%.
4. Conclusions
The stray neutron field inside the neutron scattering instruments at CSNS is characterized by wide energy distribution, spanning from the thermal range to hundreds of MeV. The neutron spectra vary with the locations, and the fluence rate could change by several orders of magnitude as well. In this paper, a stray neutron measurement technique using an ERBSS and a commercial NADED was proposed. To verify the reliability of the method, stray neutron spectra, integral fluence rates, and H*(10) values were measured at the entrance (location A) and exit (location B) of the labyrinth of the BL06 beam line at CSNS. Comparisons between the measured and simulated neutron spectra showed that the discrepancy at location A was larger than that at location B. However, the measured results at location B agreed well with the simulations. The comparison of the H*(10) values obtained from the spectra determined from the ERBSS measurements, the direct NADED measurements, and the Monte Carlo simulations, showed all the measured values were larger than the simulation ones, but the discrepancies were within the acceptable error range. Thus, it can be concluded that the proposed method is suitable for studying the stray neutron fields for the neutron scattering instruments at CSNS, whose features are very similar to the BL06 beam line.
Author Contributions
Conceptualization, B.Z. and F.S.; methodology, B.Z. and S.W.; software, F.S.; data curation, B.Z. and Z.H.; writing—original draft preparation, B.Z.; writing—review and editing, X.R. and T.L.; supervision, X.R.; funding acquisition, T.L. All authors have read and agreed to the published version of the manuscript.
Funding
This work was supported by the Regional Joint Fund of Guangdong (No. 2020A1515110280), the Guangdong-Hong Kong-Macao Joint Laboratory for Neutron Scattering Science and Technology (No. 2019B121205003), the Program for Guangdong Introducing Innovative and Entrepreneurial Teams (No. 2017ZT07S225), and the Guangdong Provincial Science and Technology Plan (No. 2017B090921001).
Institutional Review Board Statement
Not applicable.
Informed Consent Statement
Not applicable.
Data Availability Statement
Not applicable.
Conflicts of Interest
The authors declare no conflict of interest.
References
- Xu, J.P.; Xia, Y.G.; Li, Z.D.; Chen, H.C.; Wang, X.L.; Sun, Z.Z.; Yin, W. Multi-physics instrument: Total scattering neutron time-of-flight diffractometer at China Spallation Neutron Source. Nucl. Instrum. Methods Phys. Res. A 2021, 1013, 165642. [Google Scholar] [CrossRef]
- Chen, J.; Kang, L.; Lu, H.L.; Luo, P.; Wang, F.W.; He, L.H. The general purpose powder diffractometer at CSNS. Phys. B Condens. Matter 2018, 551, 370–372. [Google Scholar] [CrossRef]
- Zhu, T.; Zhan, X.Z.; Xiao, S.W.; Sun, Y.; Wu, Y.Y.; Zhou, A.Y.; Han, Q.F. MR: The multipurpose reflectometer at CSNS. Neutron News 2018, 29, 11–13. [Google Scholar] [CrossRef]
- Ke, Y.B.; He, C.Y.; Zhang, H.B.; Geng, Y.S.; Fu, J.Y.; Zhang, S.K.; Hu, H.T.; Wang, S.L.; Zhou, B.; Wang, F.; et al. The time-of-flight Small-Angle Neutron Spectrometer at China Spallation Neutron Source. Neutron News 2018, 29, 14–17. [Google Scholar] [CrossRef]
- Wang, F.W.; Liang, T.J.; Yin, W.; Yu, Q.Z.; He, L.H.; Tao, J.Z.; Jia, X.J.; Zhang, S.Y. Physical design of target station and neutron instruments for China Spallation Neutron Source. Sci. China Phys. Mech. Astron. 2013, 56, 2410–2424. [Google Scholar] [CrossRef]
- Denise, B.; Pelowitz, D. MCNPXTM User’s Manual Version 2.5.0; LA-CP-05-0369; Los Alamos National Laboratory: Los Alamos, NM, USA, 2005. [Google Scholar]
- Ferrari, A.; Sala, P.R.; Fasso, A.; Ranft, J. FLUKA: A Multi-Particle Transport Code; CERN: Geneva, Switzerland, 2005. [Google Scholar]
- Richard, L.B.; Ronald, I.E.; Bonner, T.W. A new type of neutron spectrometer. Nucl. Instrum. Methods Phys. Res. 1960, 9, 1–12. [Google Scholar]
- Thomas, D.J.; Alevra, A.V. Bonner sphere spectrometers—A critical review. Nucl. Instrum. Methods Phys. Res. A 2002, 476, 12–20. [Google Scholar] [CrossRef]
- Hu, Z.M.; Zhong, G.Q.; Ge, L.J.; Du, T.F.; Peng, X.Y.; Chen, Z.J.; Xie, X.F.; Yuan, X.; Zhang, Y.; Sun, J.; et al. Neutron field measurement at the Experimental Advanced Superconducting Tokamak using a Bonner sphere spectrometer. Nucl. Instrum. Methods Phys. Res. A 2018, 895, 100–106. [Google Scholar] [CrossRef]
- Peter, D. Measurement of neutron spectra in the AWE workplace using a Bonner sphere spectrometer. J. Radiol. Prot. 2010, 30, 699–715. [Google Scholar]
- Li, Q.; Jing, H.T.; Zhou, B.; Ning, C.J.; Tang, J.; Ren, J.; Yi, H.; Zhu, X.; Zhang, L.; Jiang, W.; et al. Neutron and γ background measurements of the experimental halls at the CSNS back-streaming white neutron source. Nucl. Instrum. Methods Phys. Res. A 2020, 980, 164506. [Google Scholar] [CrossRef]
- Wiegel, B.; Alevra, A.V. NEMUS- the PTB Neutron Multisphere Spectrometer: Bonner spheres and more. Nucl. Instrum. Methods Phys. Res. A 2002, 476, 36–41. [Google Scholar] [CrossRef]
- The PDT-10A Compact Electronics Module Datasheet. Available online: http://www.pdt-inc.com/products/10series/10series_datasheet.htm (accessed on 15 August 2021).
- ICRP. Conversion Coefficients for Use in Radiological Protection against External Radiation; Pergamon Press: Oxford, UK, 1996; Volume 40. [Google Scholar]
- ICRU. Conversion Coefficients for Use in Radiological Protection against External Radiation. International Commission on Radiation Units and Measurements; ICRU Report 57; ICRU: Bethesda, MD, USA, 1998. [Google Scholar]
- The NADED Datasheet. Available online: http://en.simaxtechnology.com/handhie/information_88.shtml (accessed on 12 November 2020).
- Berg, S.; McElroy, W.N. A computer-automated iterative method for neutron flux spectra determination by foil activation. In SAND II (Spectrum Analysis by Neutron Detectors II) and Associated Codes AFWL-TR-67-41; Atomics International: Canoga Park, CA, USA, 1967; Volume II. [Google Scholar]

Publisher’s Note: MDPI stays neutral with regard to jurisdictional claims in published maps and institutional affiliations. |
© 2022 by the authors. Licensee MDPI, Basel, Switzerland. This article is an open access article distributed under the terms and conditions of the Creative Commons Attribution (CC BY) license (https://creativecommons.org/licenses/by/4.0/).