Article

Contribution of Etalon Observation to Earth Rotation Parameters under a New Observation Scenario

1
National Time Service Center, Chinese Academy of Sciences, Xi’an 710600, China
2
University of Chinese Academy of Sciences, Beijing 100049, China
3
Key Laboratory of Precise Positioning and Time Technology, Chinese Academy of Sciences, Xi’an 710600, China
4
School of Electronics and Information, Xi’an Polytechnic University, Xi’an 710048, China
*
Author to whom correspondence should be addressed.
Appl. Sci. 2022, 12(10), 4936; https://doi.org/10.3390/app12104936
Submission received: 4 March 2022 / Revised: 4 May 2022 / Accepted: 11 May 2022 / Published: 13 May 2022
(This article belongs to the Section Earth Sciences)

Abstract

:
The standard products of the International Laser Ranging Service (ILRS) are mainly based on the two laser geodynamics satellites (LAGEOS) due to the sparse observations of the Etalon satellites. With improvements in the ability to track high-altitude satellites, ILRS conducted a 3-month Etalon tracking campaign. In this paper, we study the contribution of more Etalon observations in the new observation scenario to weekly ILRS products, such as station coordinates, Earth rotation parameters (ERPs) and satellite orbit. We compare the ILRS products estimated from LAGEOS-only solutions and LAGEOS+Etalon solutions. In the new observation scenario of 2019, the numbers of observations of Etalon satellites are 1.4 and 1.7 times larger than those in 2018. It is shown that the quality of station coordinates, and the satellite orbit of LAGESOS satellites are only slightly affected by the increase in Etalon observations of the campaign. However, for station 1868, which is dedicated to high-altitude satellites, the root mean square (RMS) values of the residuals in the N, E, and U components are improved by 3.1 cm, 2.1 cm and 2.3 cm, respectively. The internal precision of orbit for Etalon-1/2 satellites in tangle and normal directions are improved by 1.5 cm and 2.9 cm, respectively. Most remarkably, the standard deviations for Xp, Yp and LOD can be improved by 6.9%, 14.3% and 5.1%, respectively, compared with the International Earth Rotation System (IERS)-14-C04 series. With our research, the ILRS could increase efforts on Etalon satellite tracking without affecting the routine observations of LAGEOS satellites.

1. Introduction

As a space geodetic technique, satellite laser ranging (SLR) is indispensable for deriving SLR station coordinates, geocenter coordinates, Earth rotation parameters (ERPs) [1,2,3,4,5], the scale parameters of the International Terrestrial Reference Frame (ITRF) [6], the standard gravitational constant parameter (GM), the low-degree coefficients of Earth’s gravity field [7,8,9] and many other parameters [10,11]. The International Laser Ranging Service (ILRS) [12] is the main institution responsible for collecting and processing SLR observations of various satellites and distributing products to users for scientific research. Because of their spherical shape, high altitude and area–mass ratio, laser geodynamics satellites (LAGEOS) and Etalon satellites are the main tracking targets processed by ILRS to estimate geodetic parameters. However, the number of SLR observations of the Etalon satellites is approximately one-tenth of that to the two LAGEOS satellites [13]. Therefore, the calculations of ILRS are mainly based on the two LAGEOS Satellites. High-precision applications, such as sea level change monitoring, require the ITRF to be accurate at the level of 1 mm in terms of station position and 0.1 mm/year in terms of station velocity [14], which is a task of the global geodetic observing system (GGOS) [15], founded by the International Association of Geodesy [16]. To fulfill the requirements of GGOS, ILRS has coordinated analysis centers operated by analysts of various international institutions to carry out extensive research [17,18,19,20], where employing more SLR observations of satellites with different orbital characteristics and extending the SLR tracking network are two feasible approaches.
The potential of passive geodetic satellites for ITRF generation, such as Starlette, Stella, AJISAI and laser relativity satellite (LARES), was studied by some researchers. Gourine et al. estimated the station coordinates and Earth orientation parameters (EOPs) using SLR observations of the Starlette, Stella and LAGEOS-1/2 satellites for the period between 2002 and 2005. The results showed that good quality SLR station coordinates and EOPs can be achieved by combining observations of the Starlette, Stella with LAGEOS-1/2 satellites [21]. Sosnica et al. assessed the impacts of Starlette, Stella and AJISAI SLR observations on SLR-derived products and studied the factors of the arc lengths and orbit parameterization of low Earth orbit (LEO) satellites in detail. The results showed that the quality of polar coordinates and the scale parameter and the repeatability of the estimation of the horizontal components of station coordinates are improved when observations of the Starlette, AJISAI, Stella with LAGEOS-1/2 satellites are combined [2]. Schillak et al. analyzed the quality of SLR station coordinates using SLR data of LARES satellites. The results reveal that the stability of SLR station coordinates ranges from 9 mm to 46 mm, while that of LAGEOS solutions from 5 mm to 15 mm. The SLR data of some active satellites, including GNSS satellites and Earth observation LEO satellites, were used for the estimation of station coordinates, ERPs and other geodetic parameters [22]. Sosnica et al. investigated the contribution of the SLR observations of a multi-GNSS constellation to the estimation of geodetic parameters, using 55 GNSS satellites for the period from 2014.0 to 2017.4. The data analysis showed that the quantity of weekly solutions for some SLR sites can be improved by 41%, that the root mean square (RMS) of LOD can be reduced by 65% and that the mean offsets of the LOD are decreased from −81.6 μs/d to 0.5 μs/d when LAGEOS and GNSS satellite observations are combined [23,24]. Strugarek et al. checked the possibility of using SLR observations of Sentinel-3 satellites for determining the global geodetic parameters using data from between July 2016 and July 2018. The results demonstrated that the SLR data of active Sentinel satellites contributed greatly to the determination of ERPs and geocenter coordinates [25]. Li et al. investigated the contribution of seven LEO satellites to ERPs estimation. The results show that the combination of LEO observations improves the Xp, Yp and LOD by 0.644 ms, 0.629 ms and 0.028 ms, respectively [26]. In 2021, Strugarek et al. analyzed the station coordinates estimated by SLR observations of LEO, Laser Relativity Satellite (LARES), LAGEOS and Galileo satellites. The results showed that the consistency in the horizontal components of the coordinates of noncore stations can be increased by 10% [27]. However, the full employment of GNSS satellites and LEO satellites is still hindered by the lack of precise models for perturbation forces, such as air drag for LEO satellites and solar pressure for GNSS satellites, and deficiencies in the measurement models of certain parameters, such as station-specific range biases for LEO and GNSS satellites. Apart from employing observation from satellites with different orbit characteristic, some researchers have analyzed the impact of constructing new sites in the present SLR tracking network on SLR products by simulations. The results demonstrated that it would be useful to add a new station in the southern hemisphere and that the most effective place for the new SLR station differs for different geodetic parameters [28,29]. However, the addition of new SLR stations is limited by high costs.
Compared with GNSS and LEO satellites, Etalon satellites are a good tool for the definition of geocenter coordinates, ERPs and other ITRF parameters, due to their spherical shape, large area–mass ratio and high number of corner cubes. In some previous studies, it was shown that the impact of Etalon observations to SLR processing was limited by its low number of observation, which is approximately 10% of that of LAGEOS [30,31]. Therefore, Andritsch et al. investigated the impact of changing the tracking methods of the LAGEOS and Etalon satellites on SLR standard products. With the simulation of different tracking conditions, the results showed that the quality of parameters related to the ITRF does not significantly degrade with a decrease of 20% in the quantity of data from LAGEOS-1/2 and that the ERPs can be improved by 10% when the number of SLR measurements of Etalon satellites under the new conditions is three times more than that of the routine observation scenario [32]. However, with the improvement in the ability of the ILRS network to track high-altitude satellites, the ILRS Analysis Standing Committee (ASC) proposed conducting a 3-month tracking campaign with Etalon satellites from February 15 to May 15 in 2019, during which the number of passes and observations of the two Etalon satellites increased. Thus, it is worthwhile to process the Etalon observations from the campaign and to analyze their impact on the ILRS routine products, including station coordinates, ERPs, satellite orbit and so on. This paper delivers the first investigation of the contribution of more Etalon observations from the new real observation conditions to ILRS products, especially to the ERPs, station coordinates and satellite orbit. The impact of Etalon observations was evaluated by comparing ILRS products estimated from LAGEOS-only solutions and those from LAGEOS+Etalon solutions. SLR data of Etalon and LAGEOS satellites from non-campaign period were also processed for comparison purposes.
This paper is organized as follows: In Section 2, we present the SLR data used for the estimation of ITRF-relevant parameters in detail. In Section 3, the approaches employed for the processing of the LAGEOS and Etalon satellite data are illustrated. In Section 4, we describe the results of SLR data processing, in particular, the station coordinates, ERPs and satellite orbit. Finally, in Section 5, a summary of the work is given, and conclusions are drawn.

2. Data and Methods

2.1. Data

SLR observations of the LAGEOS-1/2 and Etalon-1/2 satellites were provided by the ILRS data center in the normal point (NP) form in accordance with the consolidated data format. Original SLR observations from the EUROLAS Data Center (EDC) and Crustal Dynamics Data Information System (CDDIS), which are two data centers of ILRS, were combined for data processing. SLR observations in the interval from 15 February to 15 May of 2019 were processed. For comparison purposes, SLR observations from the same period in 2018 were also analyzed.
Figure 1 shows the distribution map of SLR stations observing the Etalon-1/2 satellites in the two periods. In total, there were 32 SLR stations involved in the observation of the Etalon-1/2 satellites, of which 30 and 28 stations could observe the Etalon-1/2 satellites in the periods in 2018 and 2019, respectively. Four stations, Svetloe, Russia (1888); Zelenchukskya, Russia (1889); Katzively, Ukraine (1893); and Borowiec, Poland (7811) could observe the Etalon-1/2 satellites only in 2018, and the numbers of NPs of these stations were 7, 11, 8 and 15, respectively. Brasilia, Brazil (7407), and Grasse, France (7845), could provide observations of Etalon-1/2 satellites only in 2019, and the numbers of NPs of these stations were 19 and 594, respectively. In addition, there were only 6 stations distributed in the southern hemisphere, but 26 stations located in the northern hemisphere, most of which were focused in Europe and Asia. The station information, including Site ID, DOMES, Location, Country and Station Coordinates in ITRF2014, is given in Table 1.
Figure 2 displays the number of weekly SLR observations (NPs) in the two periods. Generally, the number of NPs to the Etalon-1/2 satellites in 2019 was approximately 2 times larger than that in 2018, except for 4 weeks, where the number of NPs in 2018 was almost equal to or larger than that in 2019. On average, there were 202 and 222 NPs for the Etalon-1 and Etalon-2 satellites, respectively, for 7-day solutions in 2019. In contrast, the numbers in the noncampaign period were 140 and 129, respectively. The numbers of NPs for Etalon-1 and Etalon-2 in 2019 were approximately 1.4 and 1.7 times larger than those in 2018, respectively. Figure 3 shows the quantity of NPs in each week for 12 SLR stations, which are sorted by the overall quantity of observations of Etalon satellites. The top 12 SLR stations were Yarragadee (7090), (Wettzell) 8834, (Zimmerland) 7810, (Grasse) 7845, (Matera) 7941, (Herstmonceux) 7840, (Wettzell) 7827, (Graz) 7839, (Changchun) 7237, (Kunming) 7819, (Altay) 1879 and (Komsomolsk) 1868. Of the 12 stations, the top 4 stations provided 72, 54, 47 and 42 NPs for the Etalon-1/2 satellites on average. In addition, Figure 4 illustrates the number of SLR observations of LAGEOS-1/2 satellites for the 7-day solutions in the periods of 2018 and 2019. On average, the weekly numbers of SLR data points for the LAGEOS-1/2 satellites in 2018 were 1622 and 1285, respectively. The numbers in 2019 were 1433 and 1351, respectively. Compared with that in the period in 2018, the number of NPs for LAGEOS-1 was reduced by 5%, and the number of NPs for LAGEOS-2 was increased by 11%. The characteristic observation minimum occurred in week 4.

2.2. Methodology

The SLR data of the LAGEOS-1/2 and Etalon-1/2 satellites were processed with Bernese GNSS Software 5.2 [33], which was modified by the National Time Service Center (NTSC), Chinese Academy of Sciences (CAS) for SLR data processing.
The SLR observations of the LAGEOS-1/2 and Etalon-1/2 satellites were jointly processed at the observation level using a 7-day interval, similar to the standard ASC solutions. According to the principle of SLR observation, the measured range between the corner cubes in the satellite and the reference point on the earth is defined as
P = ρ + σ t r p + σ r e l + σ r b + σ c o m + ε
where P represents observed range between satellite and the receiver, ρ represents the geometric distance, σ t r p is troposphere signal delay, σ r e l is the general relativistic correction, σ r b is the range bias correction, σ c o m is the correction of center of mass, ε is noise in SLR observation.
According to Equation (1), the SLR data required various corrections, such as the correction of troposphere delay, correction of range bias, correction of the center of mass, correction of the atmosphere pole tide, ocean tide and solid Earth tide, and general relativistic correction. Table 2 lists the measurement model used in the LAGEOS+Etalon solutions. The troposphere delay was corrected using the Mendes–Pavlis model [34], which calculated the signal delay caused by the troposphere by multiplying the delay in the zenith path with a mapping function using station-specific metrological data. Range bias is another error source that should be considered in the processing of LAGEOS SLR data. Most of the stations used the information from the ILRS-recommended data handling file to correct the range bias. However, some specific stations estimated the range biases as a specific parameter of the station and satellite. The effects of ocean tides, solid Earth tides, atmospheric poles and general relativity were corrected according to the 2010 International Earth Rotation System (IERS) convention [35]. The error in the center of mass for the LAGEOS-1/2 and Etalon-1/2 satellites was corrected using station- and time-dependent correction tables provided by ILRS instead of using only one constant value for all stations [36]. In addition, the elevation angle cutoff was 3 degrees. During data processing, the rules of 2.5 sigma editing and a maximum sigma value of 30 mm for SLR residuals were applied for data screening. Based on the data quality of satellites, the weight between LAGEOS-1/2 and Etalon-1/2 was set to 1/9.
In the LAGEOS+Etalon weekly solutions, the following parameters were estimated: SLR station coordinates, geocenter coordinates, satellite orbit, range bias, and ERPs. The parameters and the corresponding strategies are listed in Table 3. The geocenter parameters and SLR station coordinates were both estimated as piecewise constants in weekly solutions. SLRF2014 [37], which is the ILRS realization of ITRF2014, is employed as a prior reference frame. The SLR core sites were selected in accordance with the recommendation of ILRS for datum definition. The minimum constraint approach was employed to select the stations for defining the terrestrial reference frame. According to the research conducted by Zajdel [18], the minimum constraint using no net rotation and no net translation was found to be optimal for SLR data processing. Some stations whose station coordinate residuals are larger than 25 mm for at least one component were rejected from the set of core stations. The coordinates of the noncore stations were estimated with no constraints. In accordance with the recommendations of the ILRS data handling file, range biases were estimated only for some selected stations as constants in the weekly solution, which was station- and satellite dependent. For the LAGEOS-1/2 and Etalon-1/2 satellites, six Keplerian orbit elements and five empirical parameters were estimated. The empirical orbit parameters comprised a constant acceleration in the along-track and once-per-revolution sine and cosine accelerations in the along-track and cross-track directions, respectively. The predicted orbit provided by ILRS in the consolidated prediction format (CPF) was used as a prior orbit. The ERPs, including the polar motion Xp and Yp and UT1-UTC, were estimated as piecewise constants with a one-day interval. Then, the LOD parameter could be obtained by calculating the differences in the estimated UT1-UTC values. The BULLET_A time series of the ERP was used as a prior ERP, and the fourth UT1-UTC parameter was fixed to the BULLET_A series to provide the absolute orientation due to its linear correlation with the right ascension of satellite orbit nodes. The parameters of Xp, Yp and LOD were loosely constrained to the BULLET_A series with a sigma of 1 m.
The options of the dynamic model considered for the LAGEOS+Etalon solutions are described in Table 4. The earth gravity model EGM2008 [38] was used up to degree and order 30 for the LAGEOS-1/2 and Etalon-1/2 satellites for modeling the earth nonspherical perturbation. The ocean tide model CSR 4.0 [39] up to degree and order 30 was employed for four satellites. The N-body perturbation caused by the Sun, Moon, Venus, Mars and Jupiter was calculated by the solar system ephemeris DE405 [40], which was provided by the Jet Propulsion Laboratory (JPL). The perturbation caused by general relativity, namely, Schwarzschild orbit perturbation, was modeled according to the 2010 IERS convention. In terms of nongravitational forces, the direct solar radiation pressure and Earth radiation pressure were included. The radiation pressure coefficients of Cr = 1.13 and Cr = 1.20 were applied to the LAGEOS-1/2 and Etalon-1/2 satellites for direct solar radiation pressure correction, respectively. The equations of motion for LAGEOS-1/2 and Etalon-1/2 were integrated using the method of Adams’s collocation with an order of 12 and a step size of 120 s.

3. Results

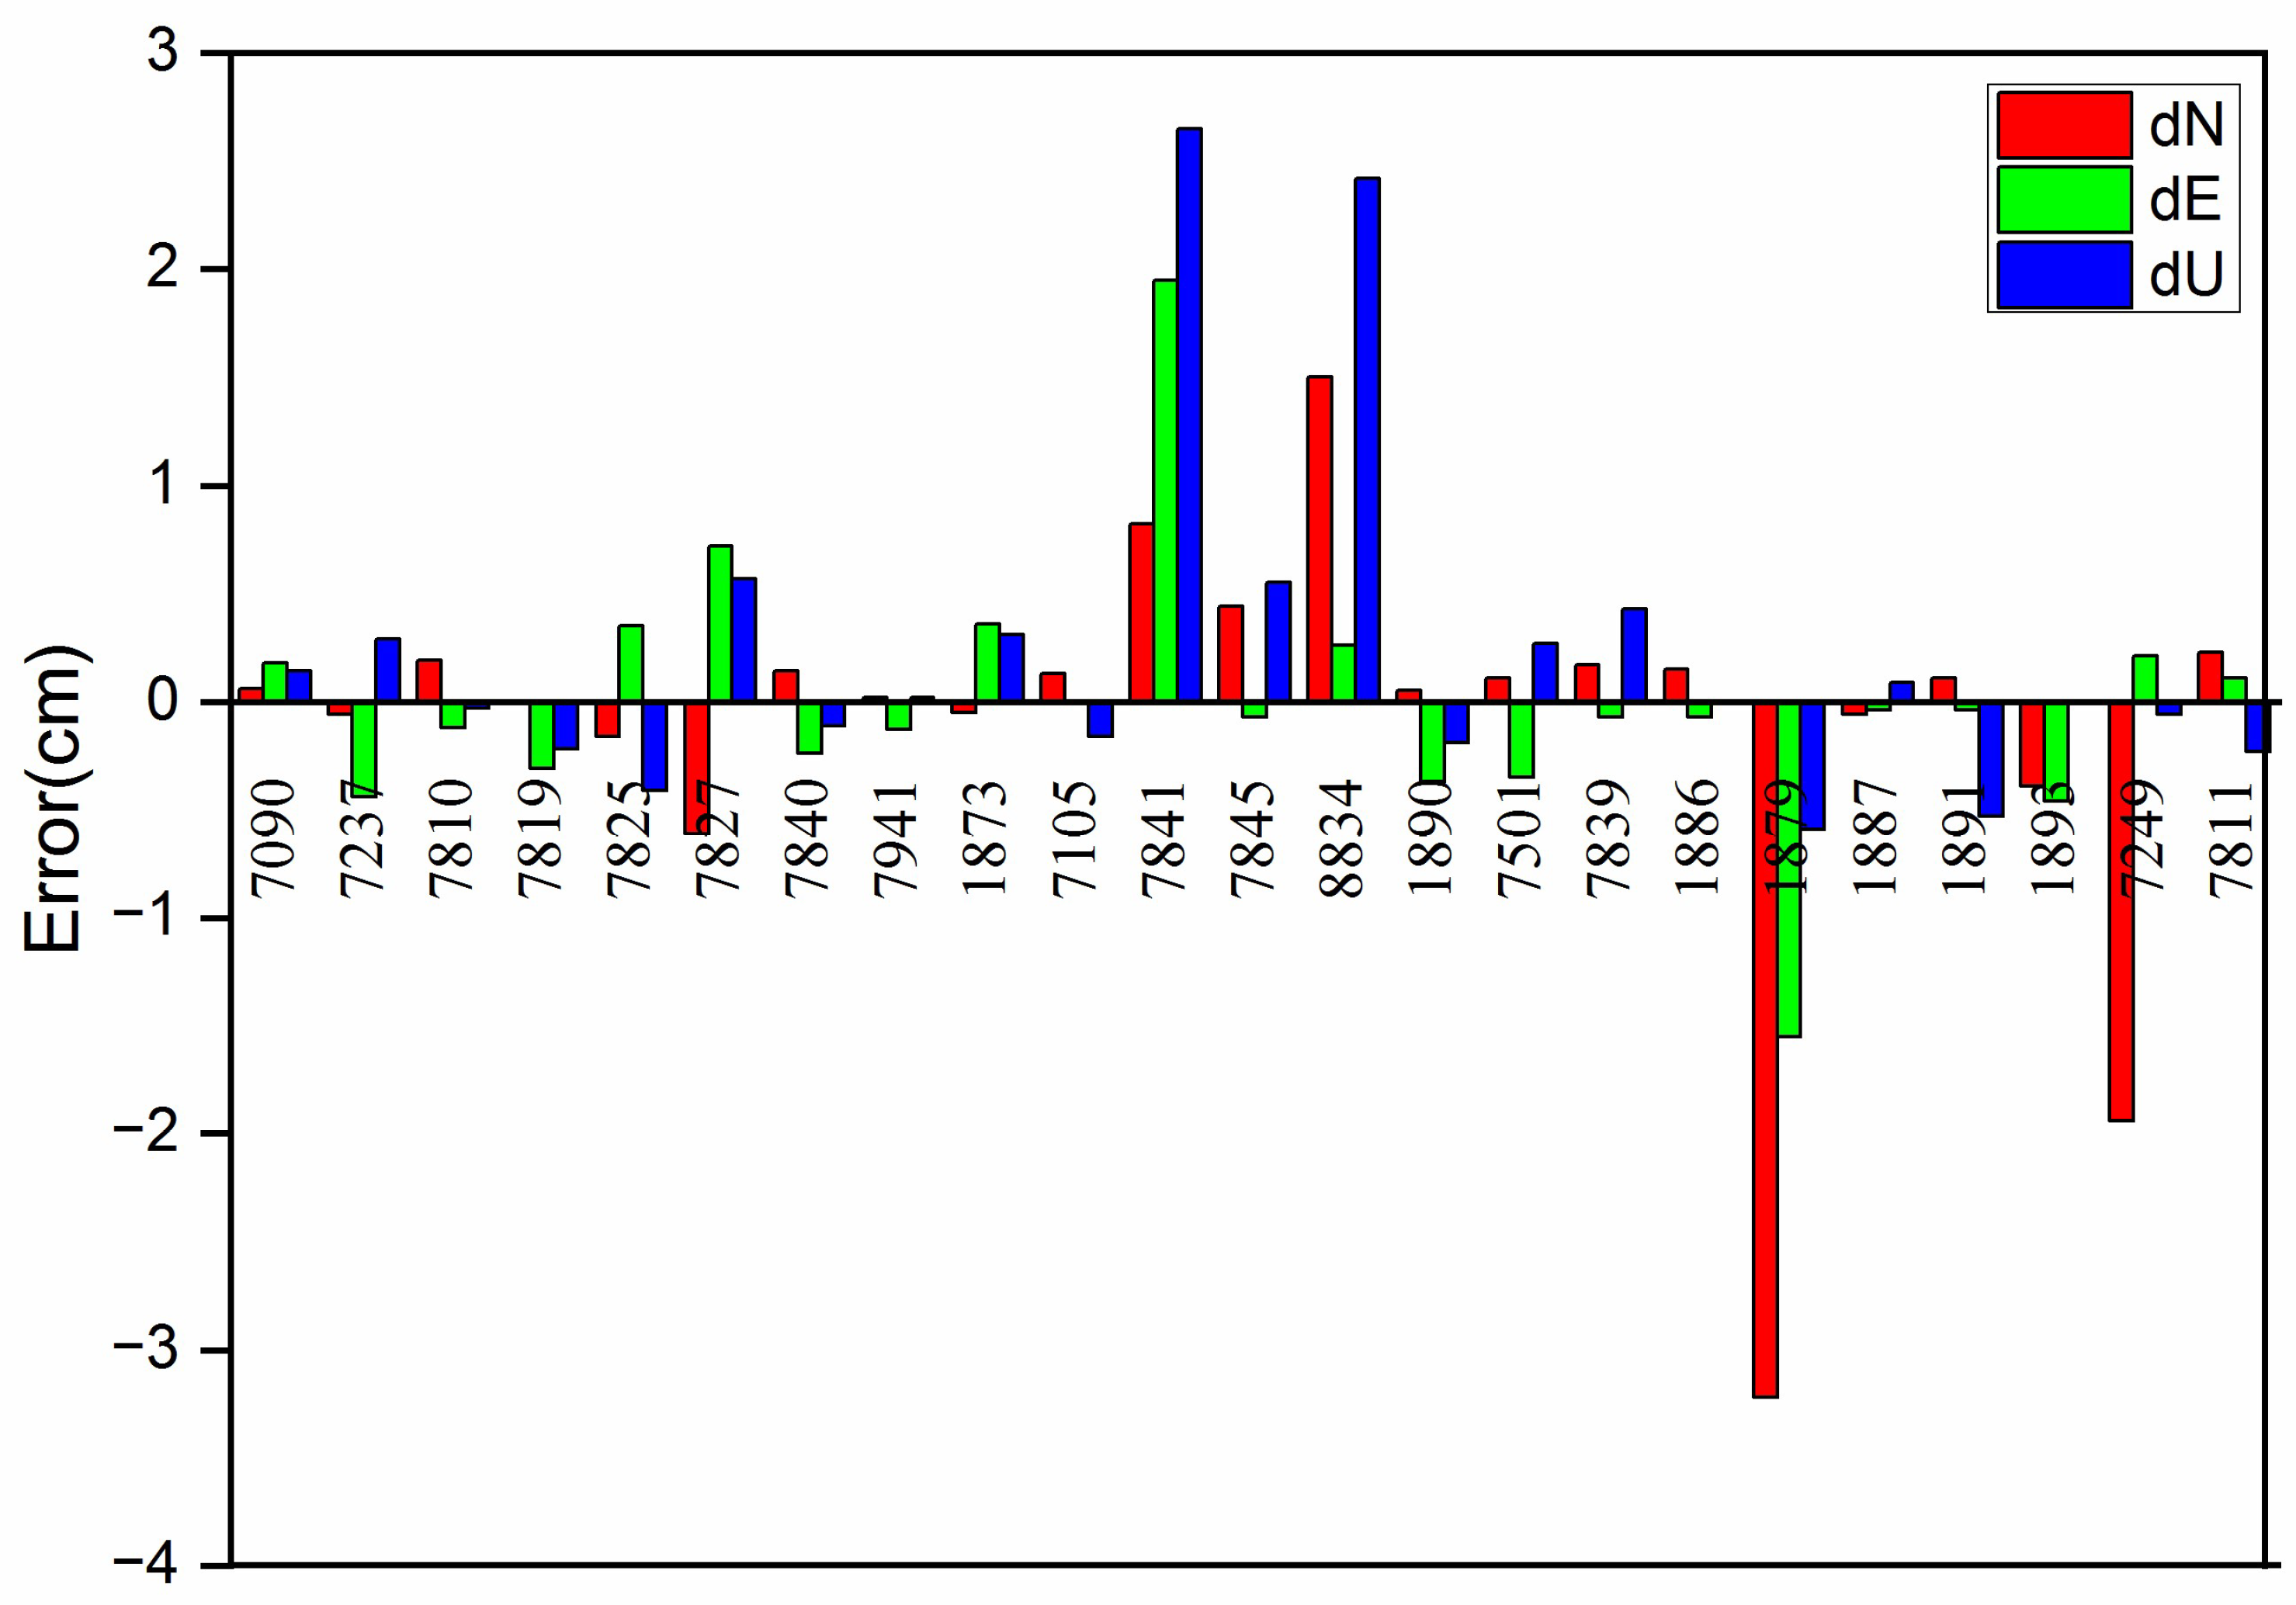
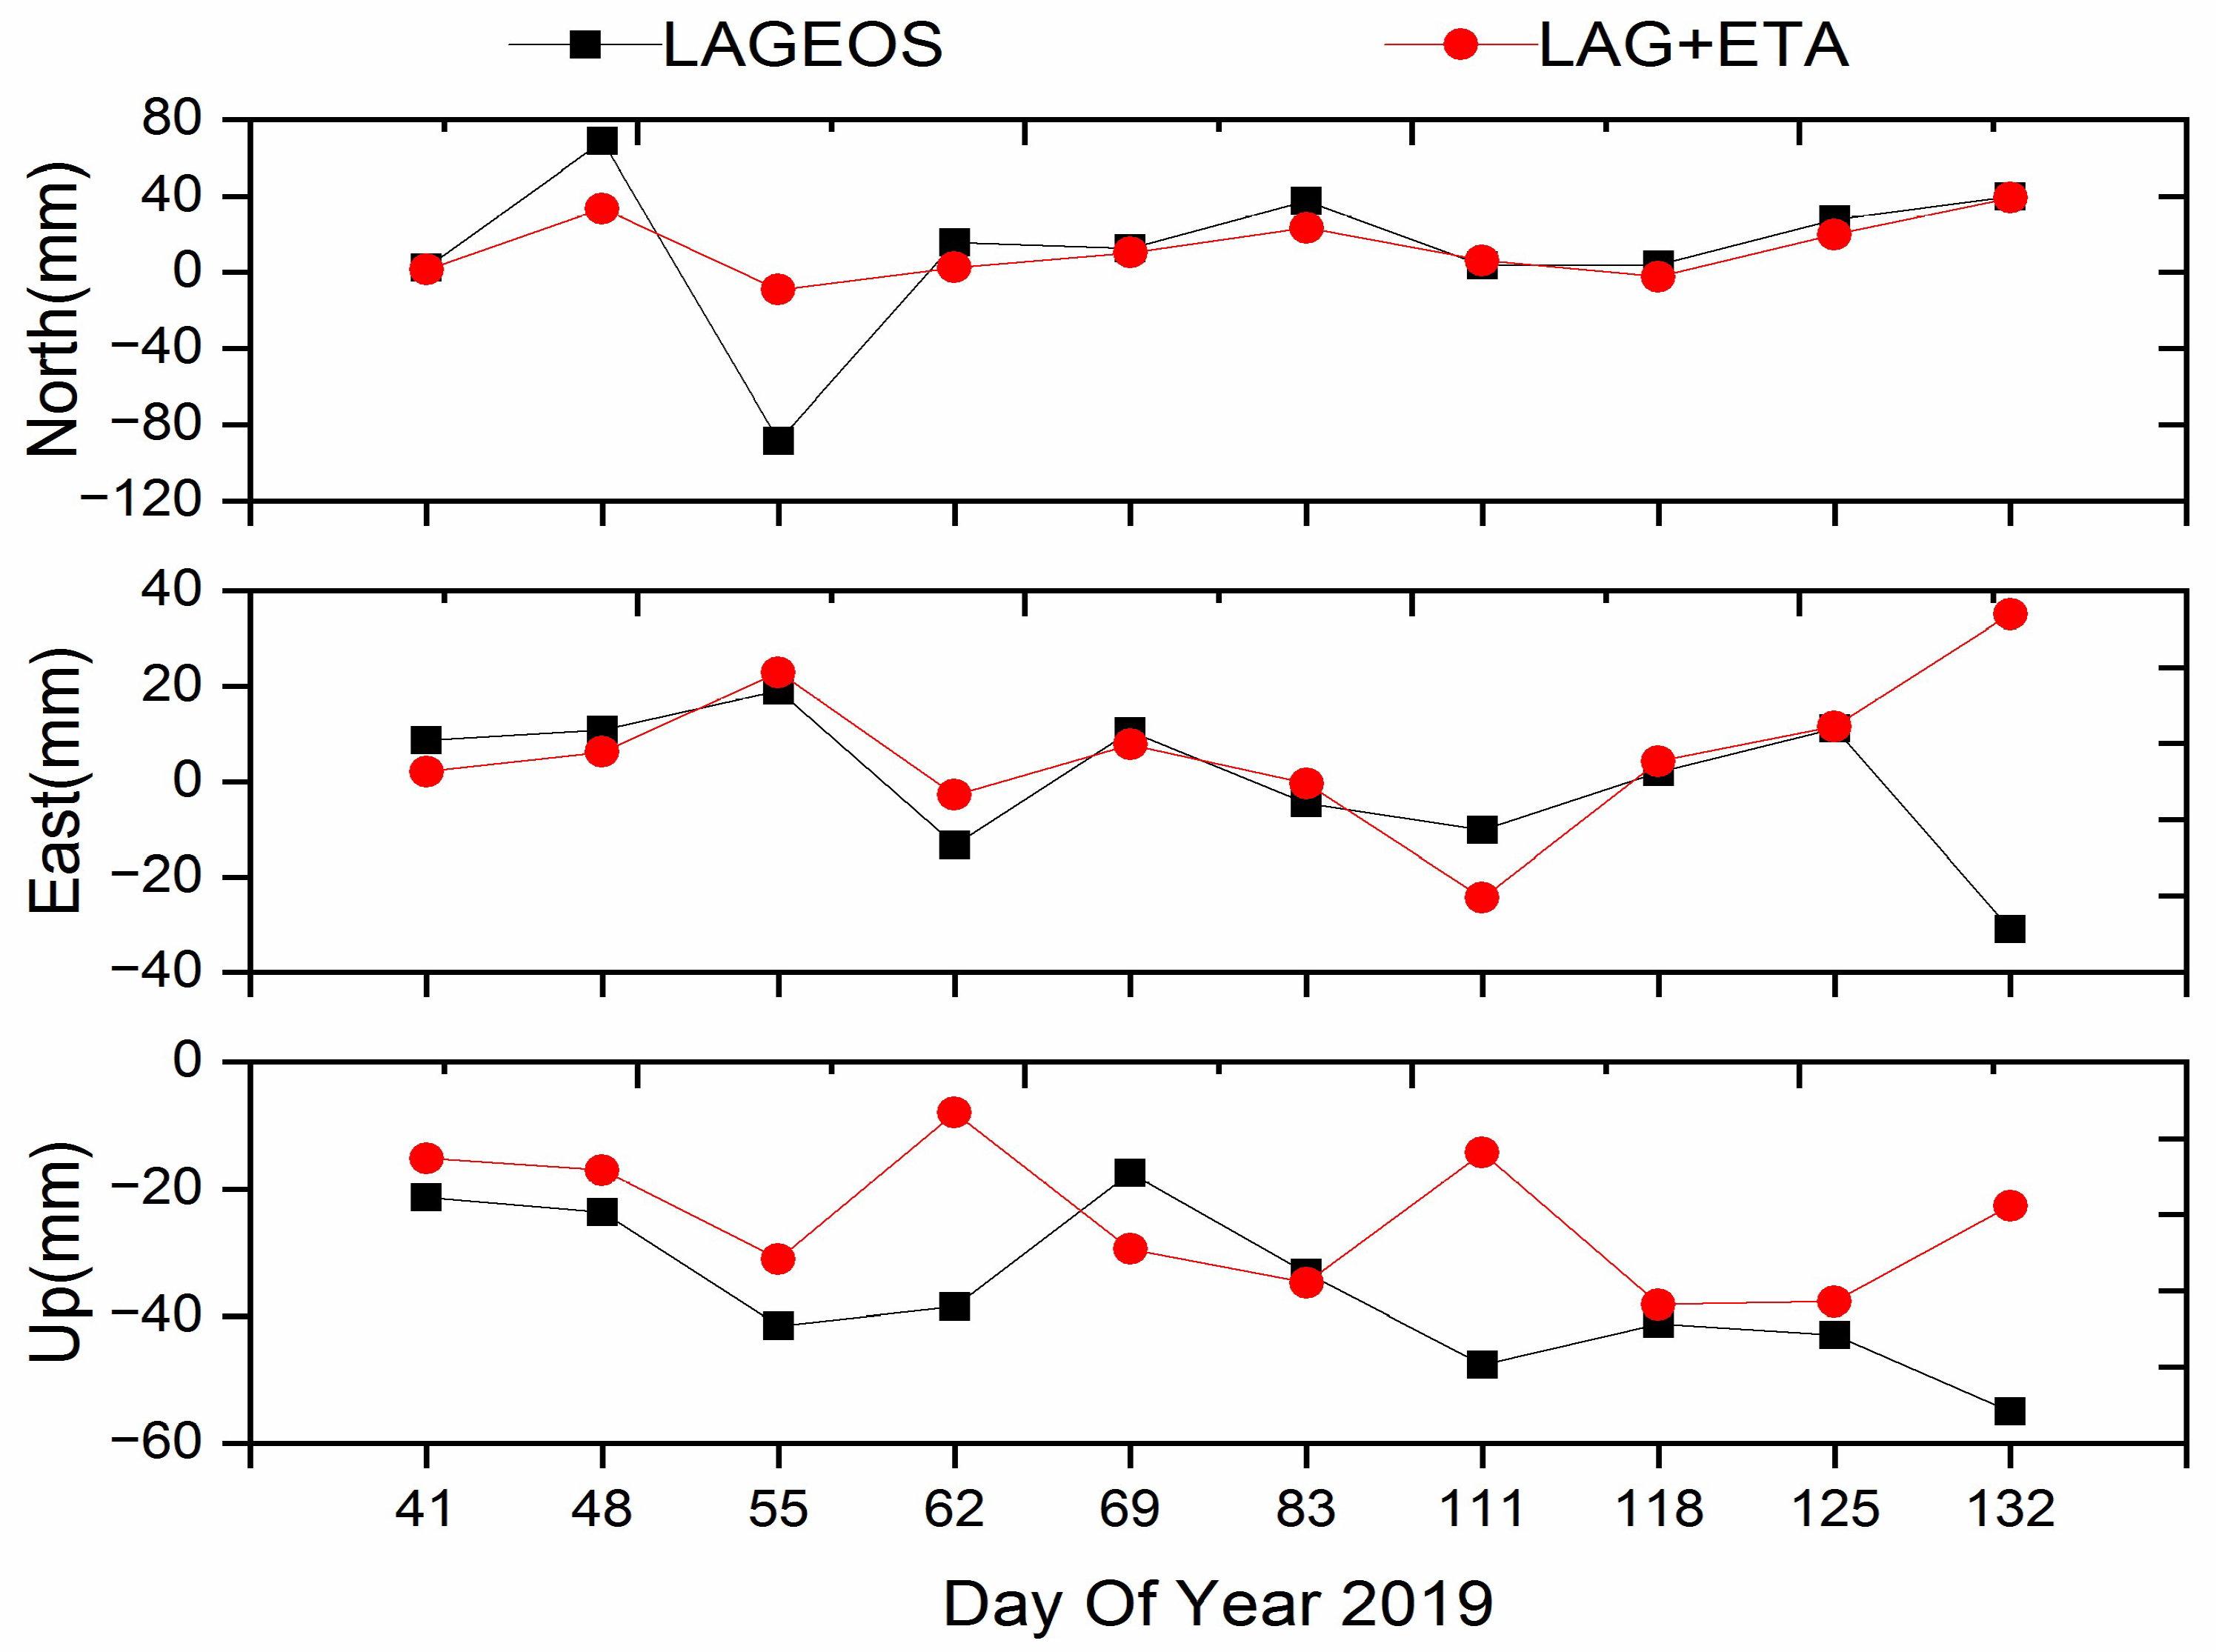
3.1. Station Coordinates

The differences in the repeatability of station coordinates between the LAGEOS-only solutions and LAGEOS+Etalon solutions in 2019 are displayed in Figure 5. A better repeatability for the LAGEOS-only solutions is presented by positive values, while the opposite result is illustrated by negative values. The SLR stations are sorted according to the number of 7-day solutions. Of the 23 stations listed in Figure 5, 10, 13 and 10 stations show negative values in the N, E, and U components, respectively. Generally, the differences in coordinate repeatability in all three components are within the range of −1 mm and 1 mm. However, there are few exceptions, e.g., Potsdam (7841), Wettzell (8834), Altay (1879), and Beijing (7249), for which the repeatability of at least one component of the coordinates is approximately 3 mm. For the Potsdam (7841) and Wettzell (8834) stations, the differences in coordinate repeatability in the N, E, and U components are approximately 1.5 mm, 2 mm, and 3 mm, respectively, which may be caused by the nosier Etalon observations, especially for station Wettzell (8834), which is a high-performing site contributing to the observations of Etalon-1/2 satellites. For stations Altay (1879) and Beijing (7249), the differences in the repeatability of station coordinates between LAGEOS-only solutions and LAGEOS+Etalon solutions are −3.22 mm, −1.55 mm, and −0.59 mm, respectively, which may be related to the improved observation geometry.
In addition, the impact of the increased quantity of observations of Etalon satellites on the station coordinates in the 2019 campaign is analyzed for four stations in detail, stations Yarragadee (7090), Wettzell (8834), Komsomolsk (1868), and Altay (1879). Figure 6, Figure 7, Figure 8 and Figure 9 present the residuals of the weekly Helmert transformation with respect to SLRF2014 for the LAGEOS-only solutions and LAGEOS+Etalon solutions of 2019 for those four stations. For most of the top 12 stations contributing to the observations of Etalon satellites, such as Yarragadee (7090) and Wettzell (8834), the ratio of the number of observations between Etalon and LAGEOS lies within 10% and 35%. From Figure 6 and Figure 7, we can observe similar values for the residuals of the N, E, and U components of the Helmert transformation for LAGEOS-only solutions and LAGEOS+Etalon solutions. However, the ratios of the observation numbers of Etalon satellites to LAGEOS satellites of station Komsomolsk (1868) and station Altay (1879) are 48.3% and 54.4%, respectively. For station Komsomolsk (1868), most of the residuals for the LAGEOS+Etalon solutions are smaller than those of the LAGEOS-only solutions for all three components. The RMS values of the residuals of the N, E, and U components for the LAGEOS+Etalon solutions are 3.1 cm, 2.0 cm, and 2.3 cm smaller than those of the LAGEOS-only solutions. Different from station Komsomolsk (1868), the RMS values the of residuals for station Altay (1879) in horizontal components of LAGEOS+Etalon solutions are 1.02 cm and 0.16 cm larger than those of the LAGEOS-only solutions, while the RMS in the U direction is 1.32 cm lower than that of the LAGEOS-only solutions. The different results for the horizontal and vertical components for station Altay (1879) should be studied. This part of the results shows that the increase in Etalon observations from the new tracking scenario can improve the station coordinates only for some specific stations that are dedicated for high-orbiter satellite tracking.

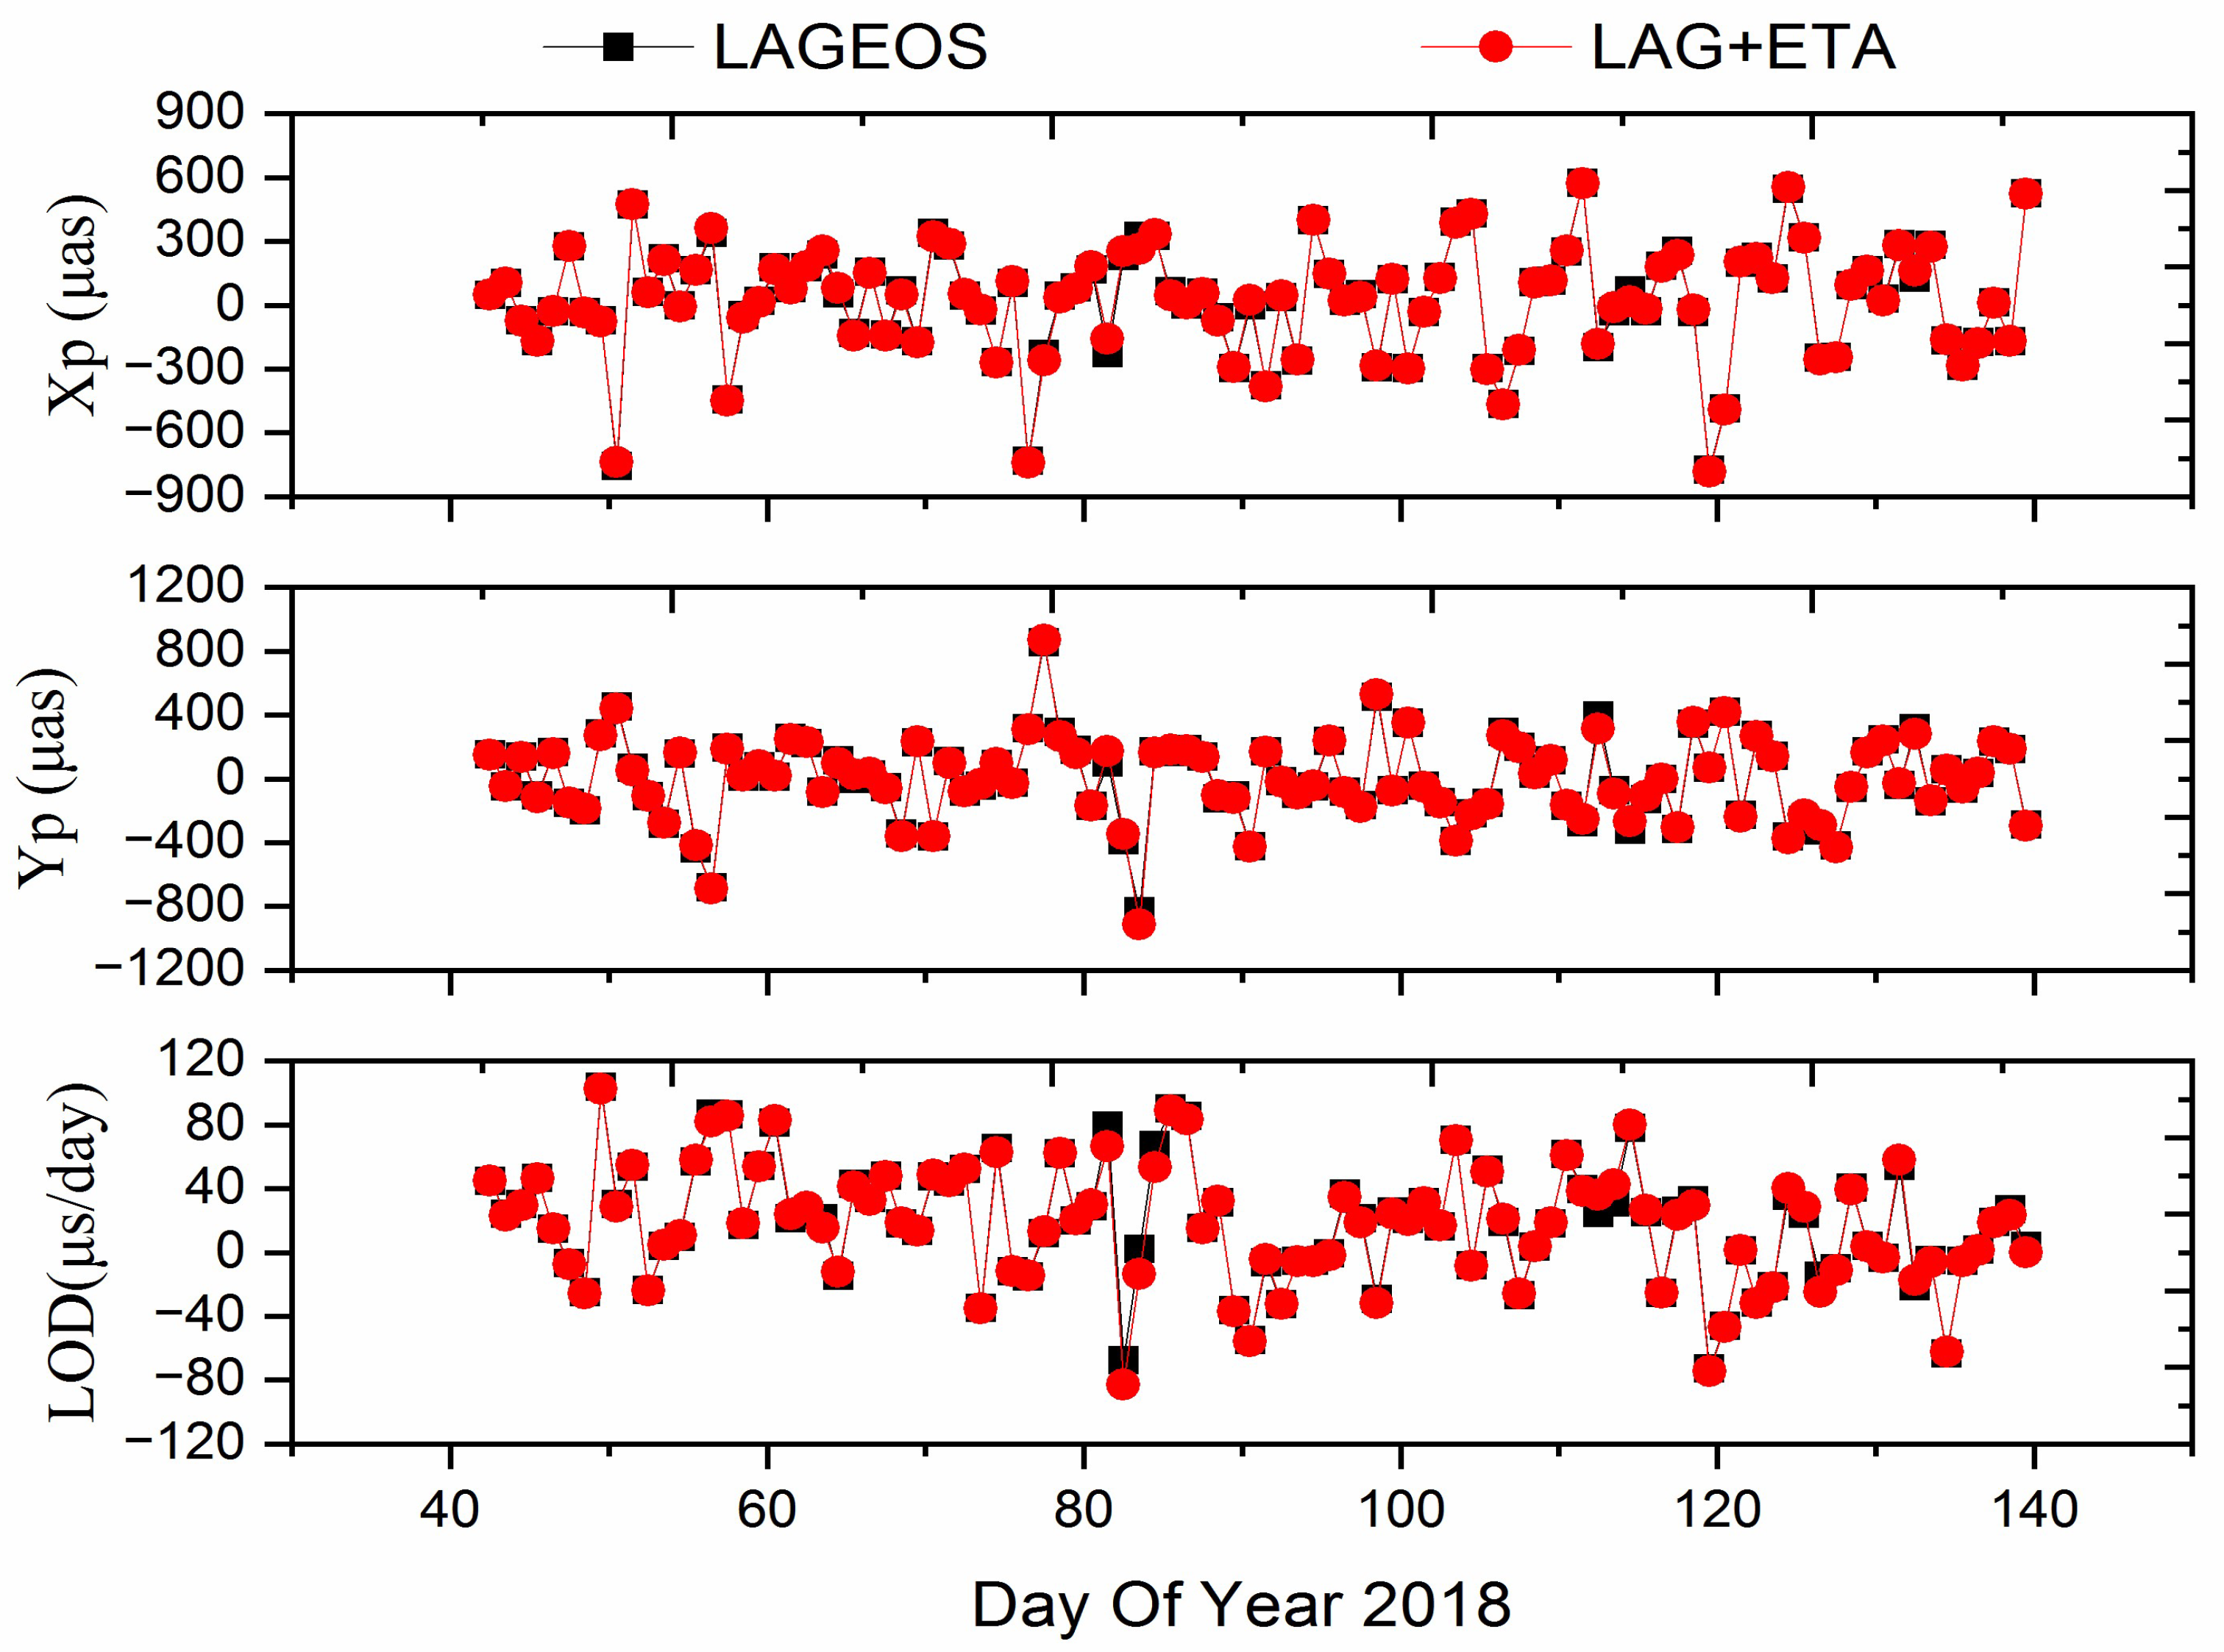
3.2. Earth Rotation Parameters
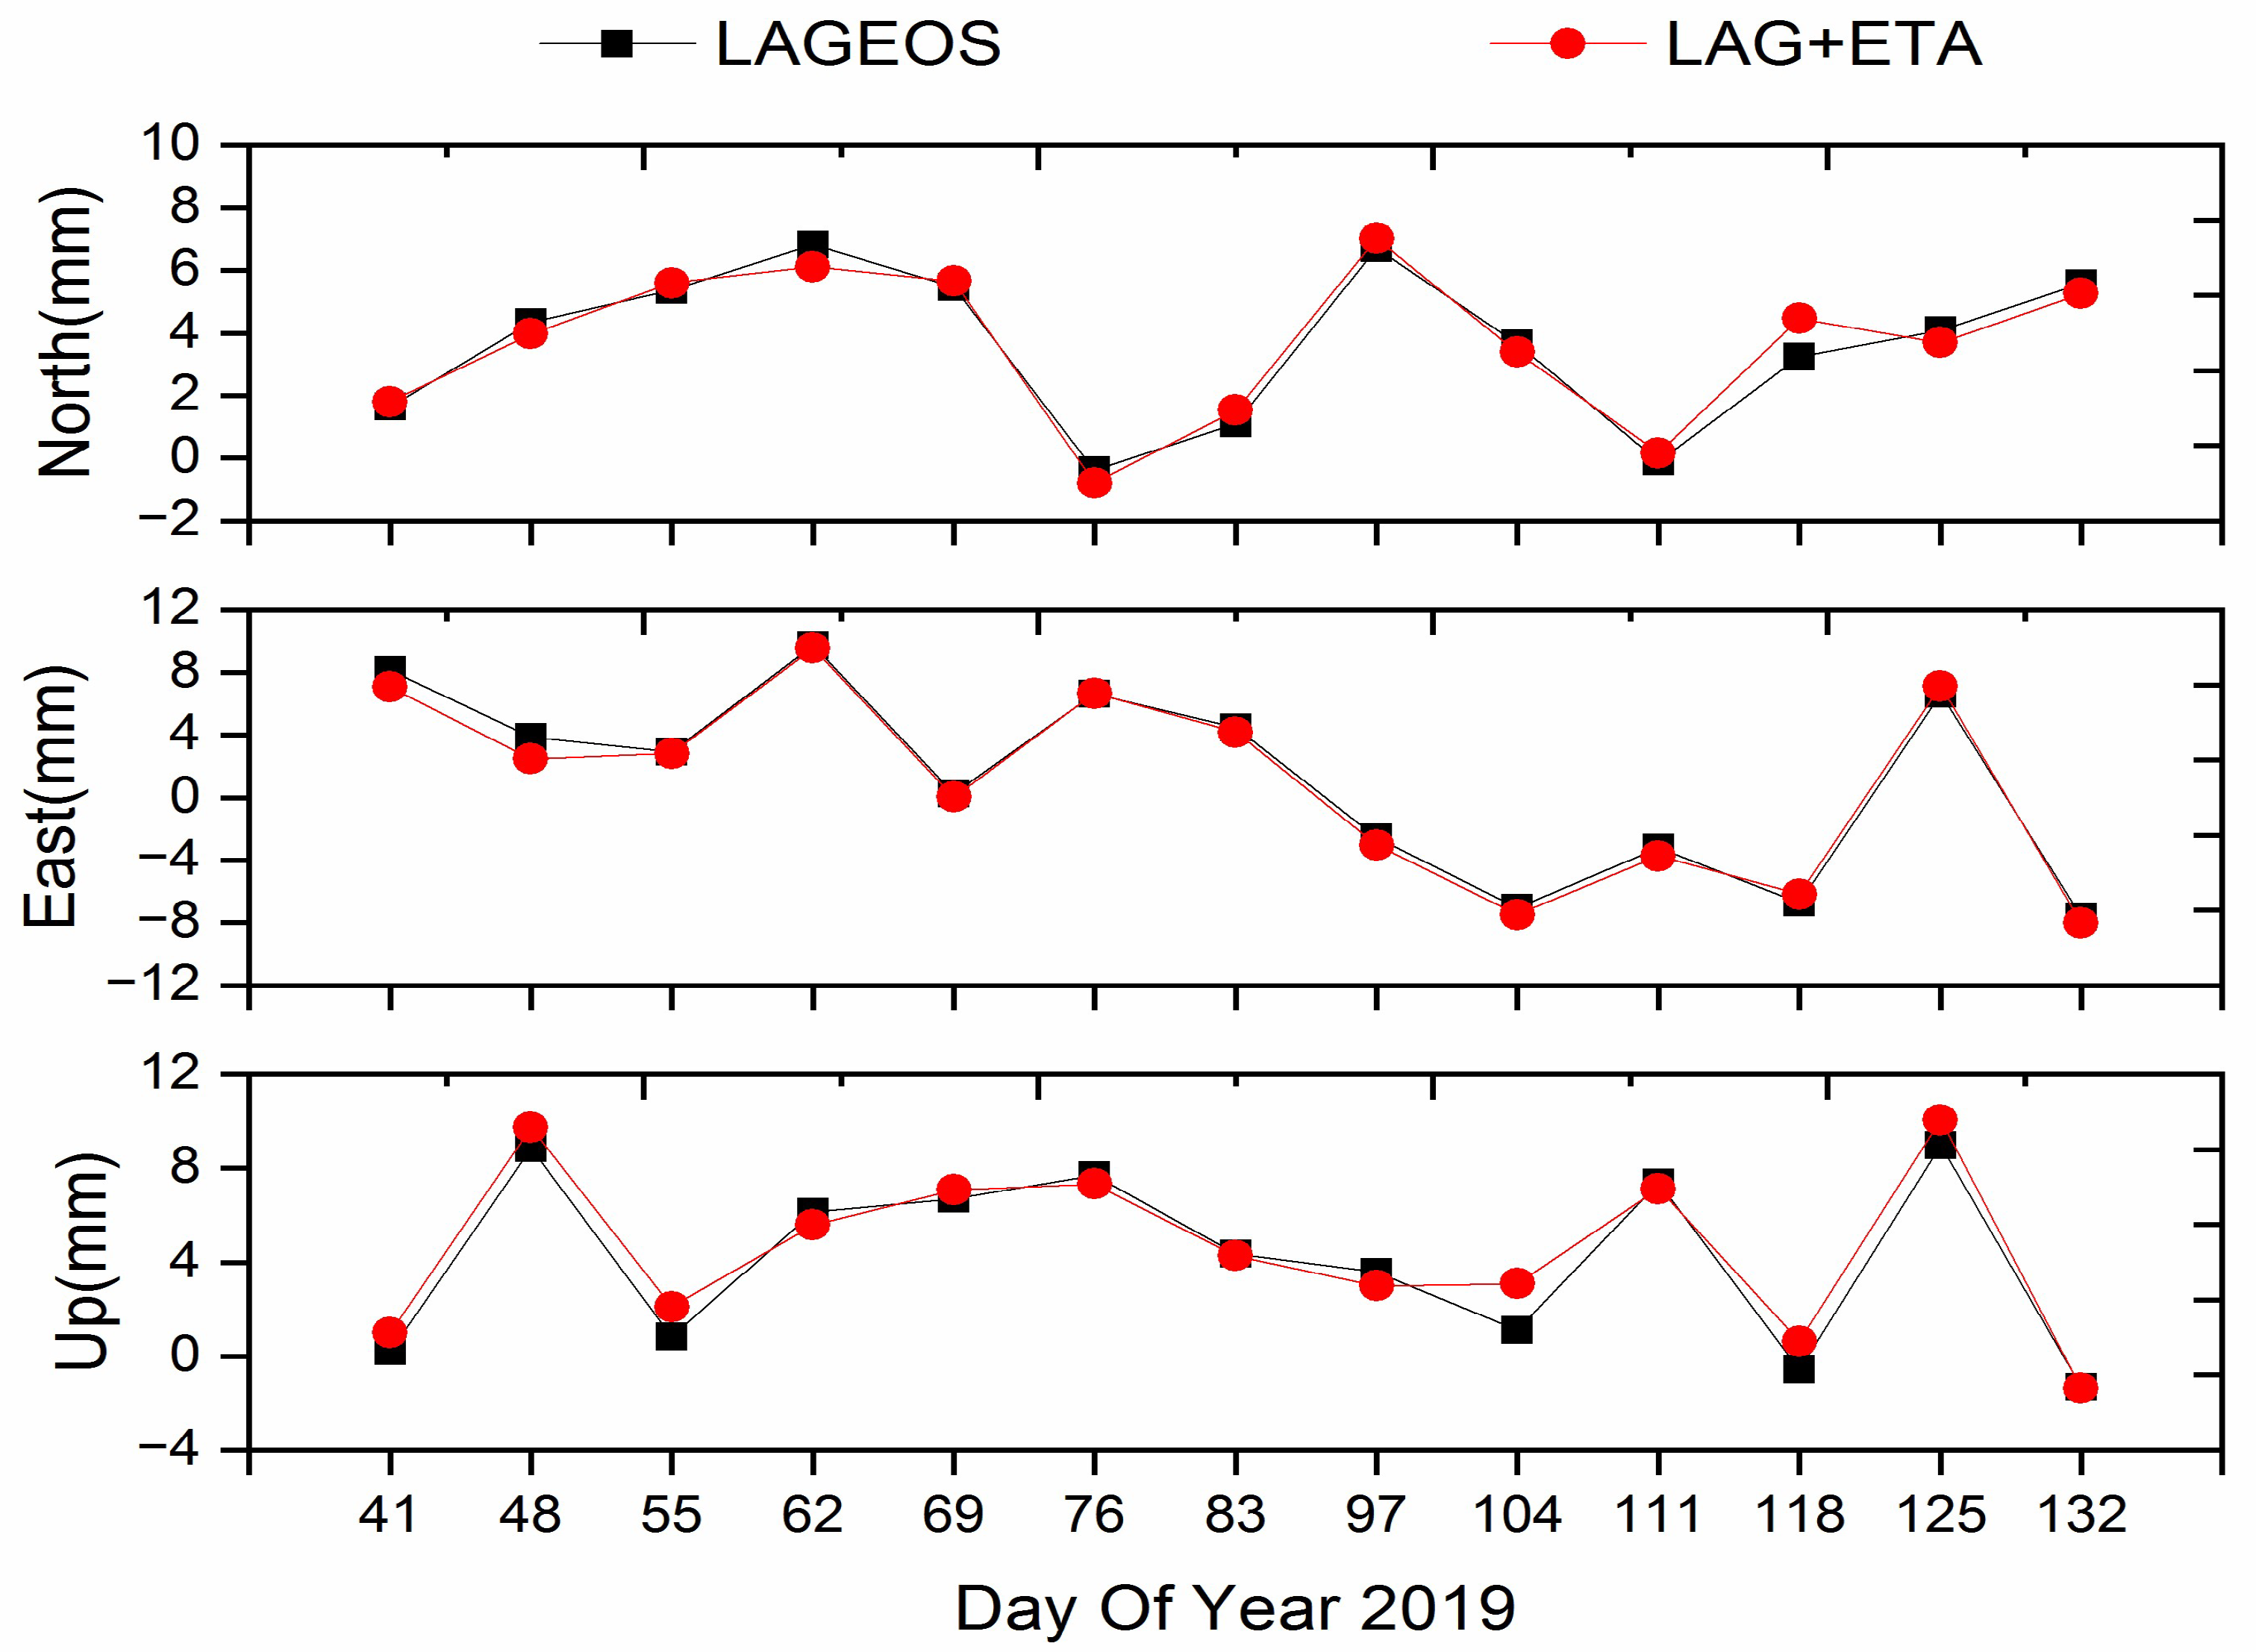
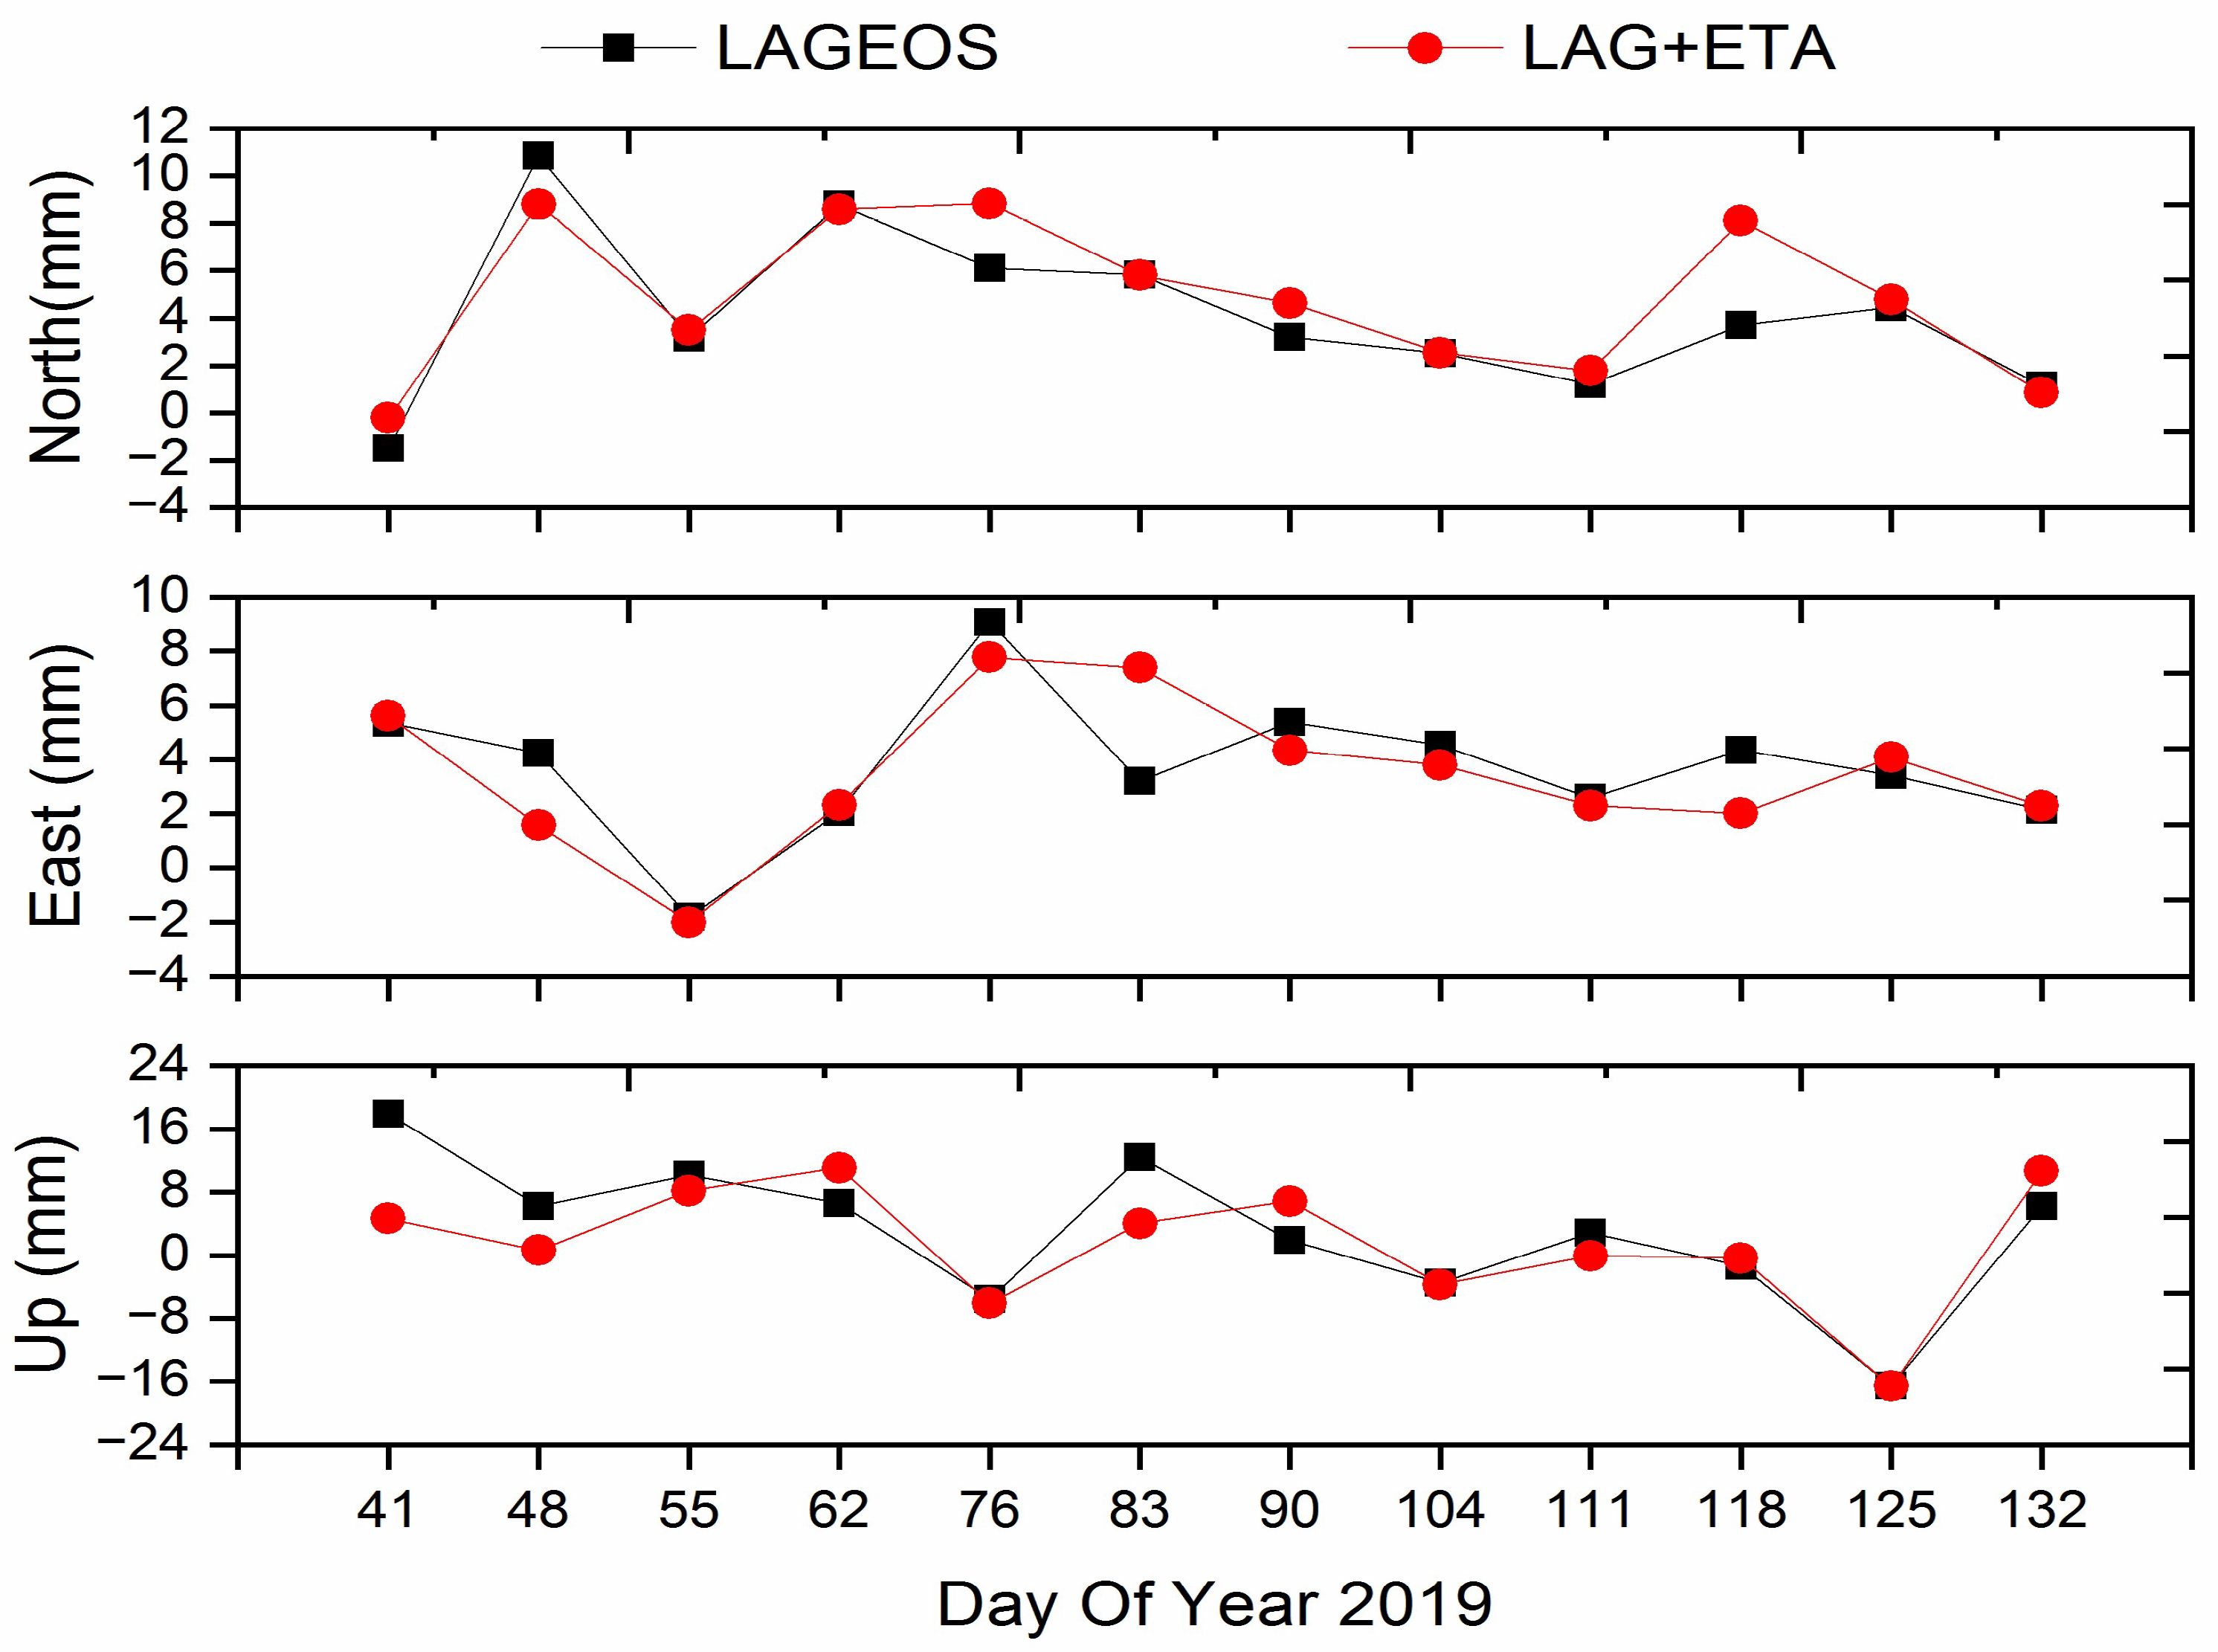
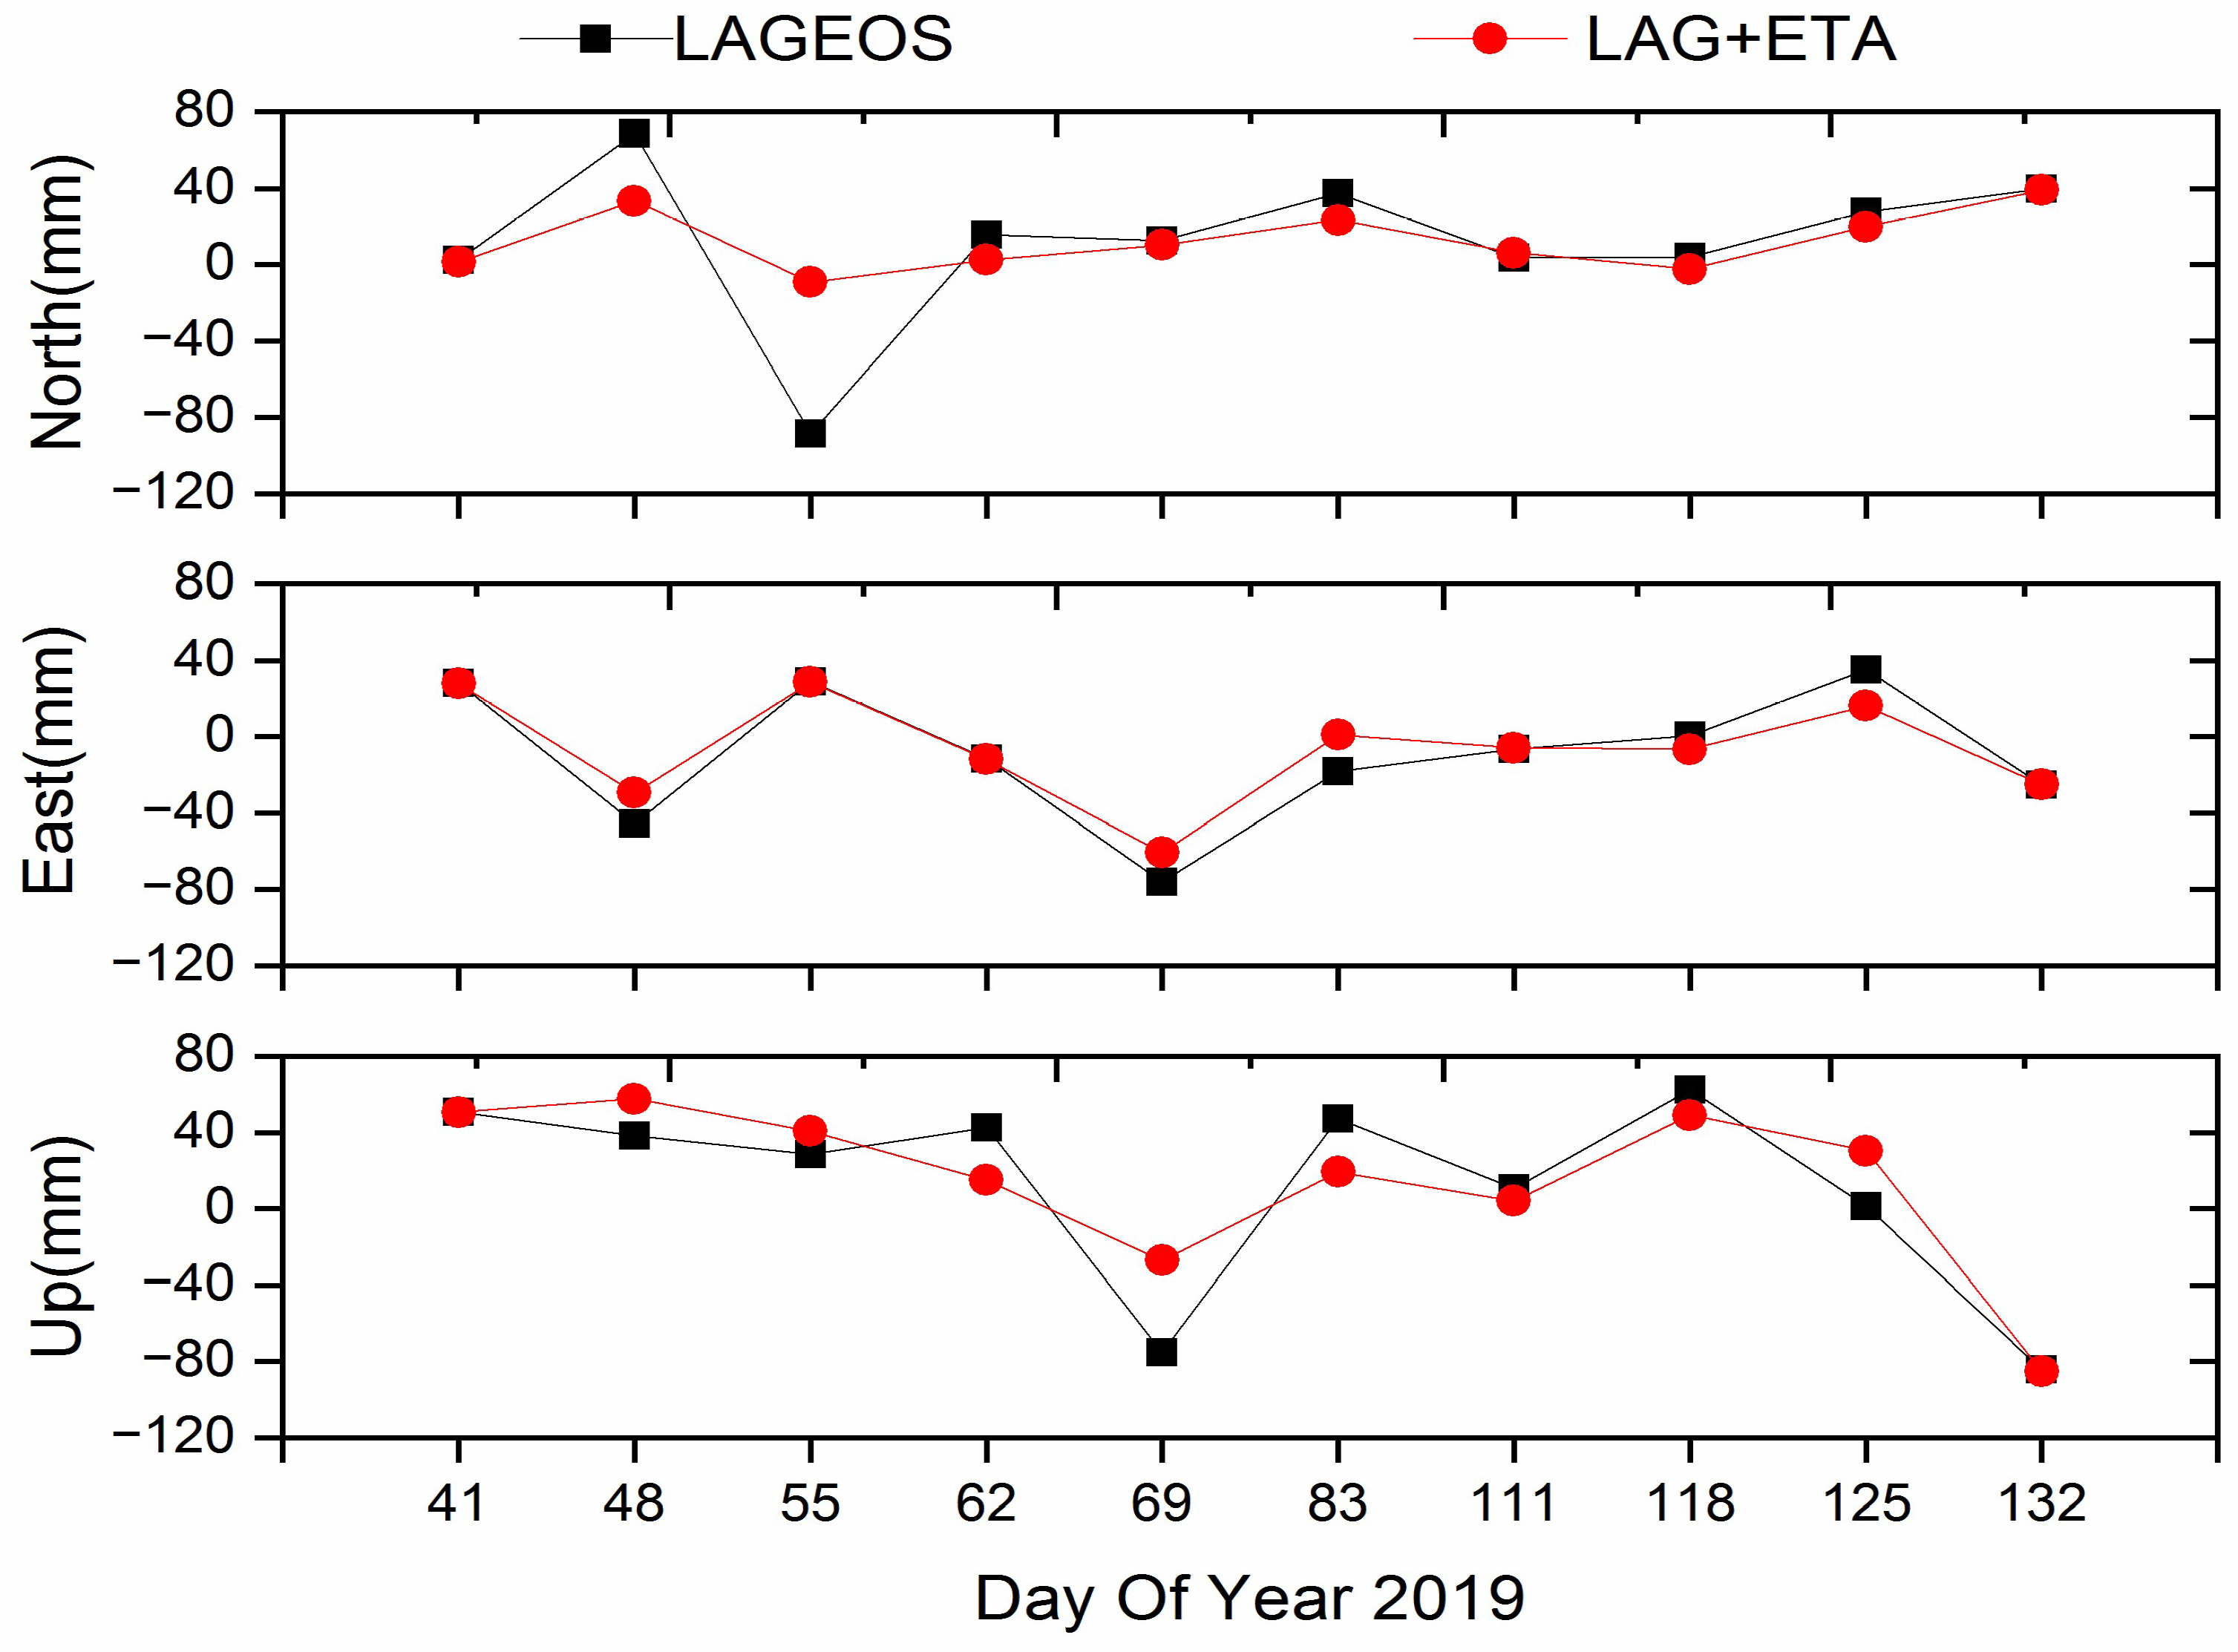
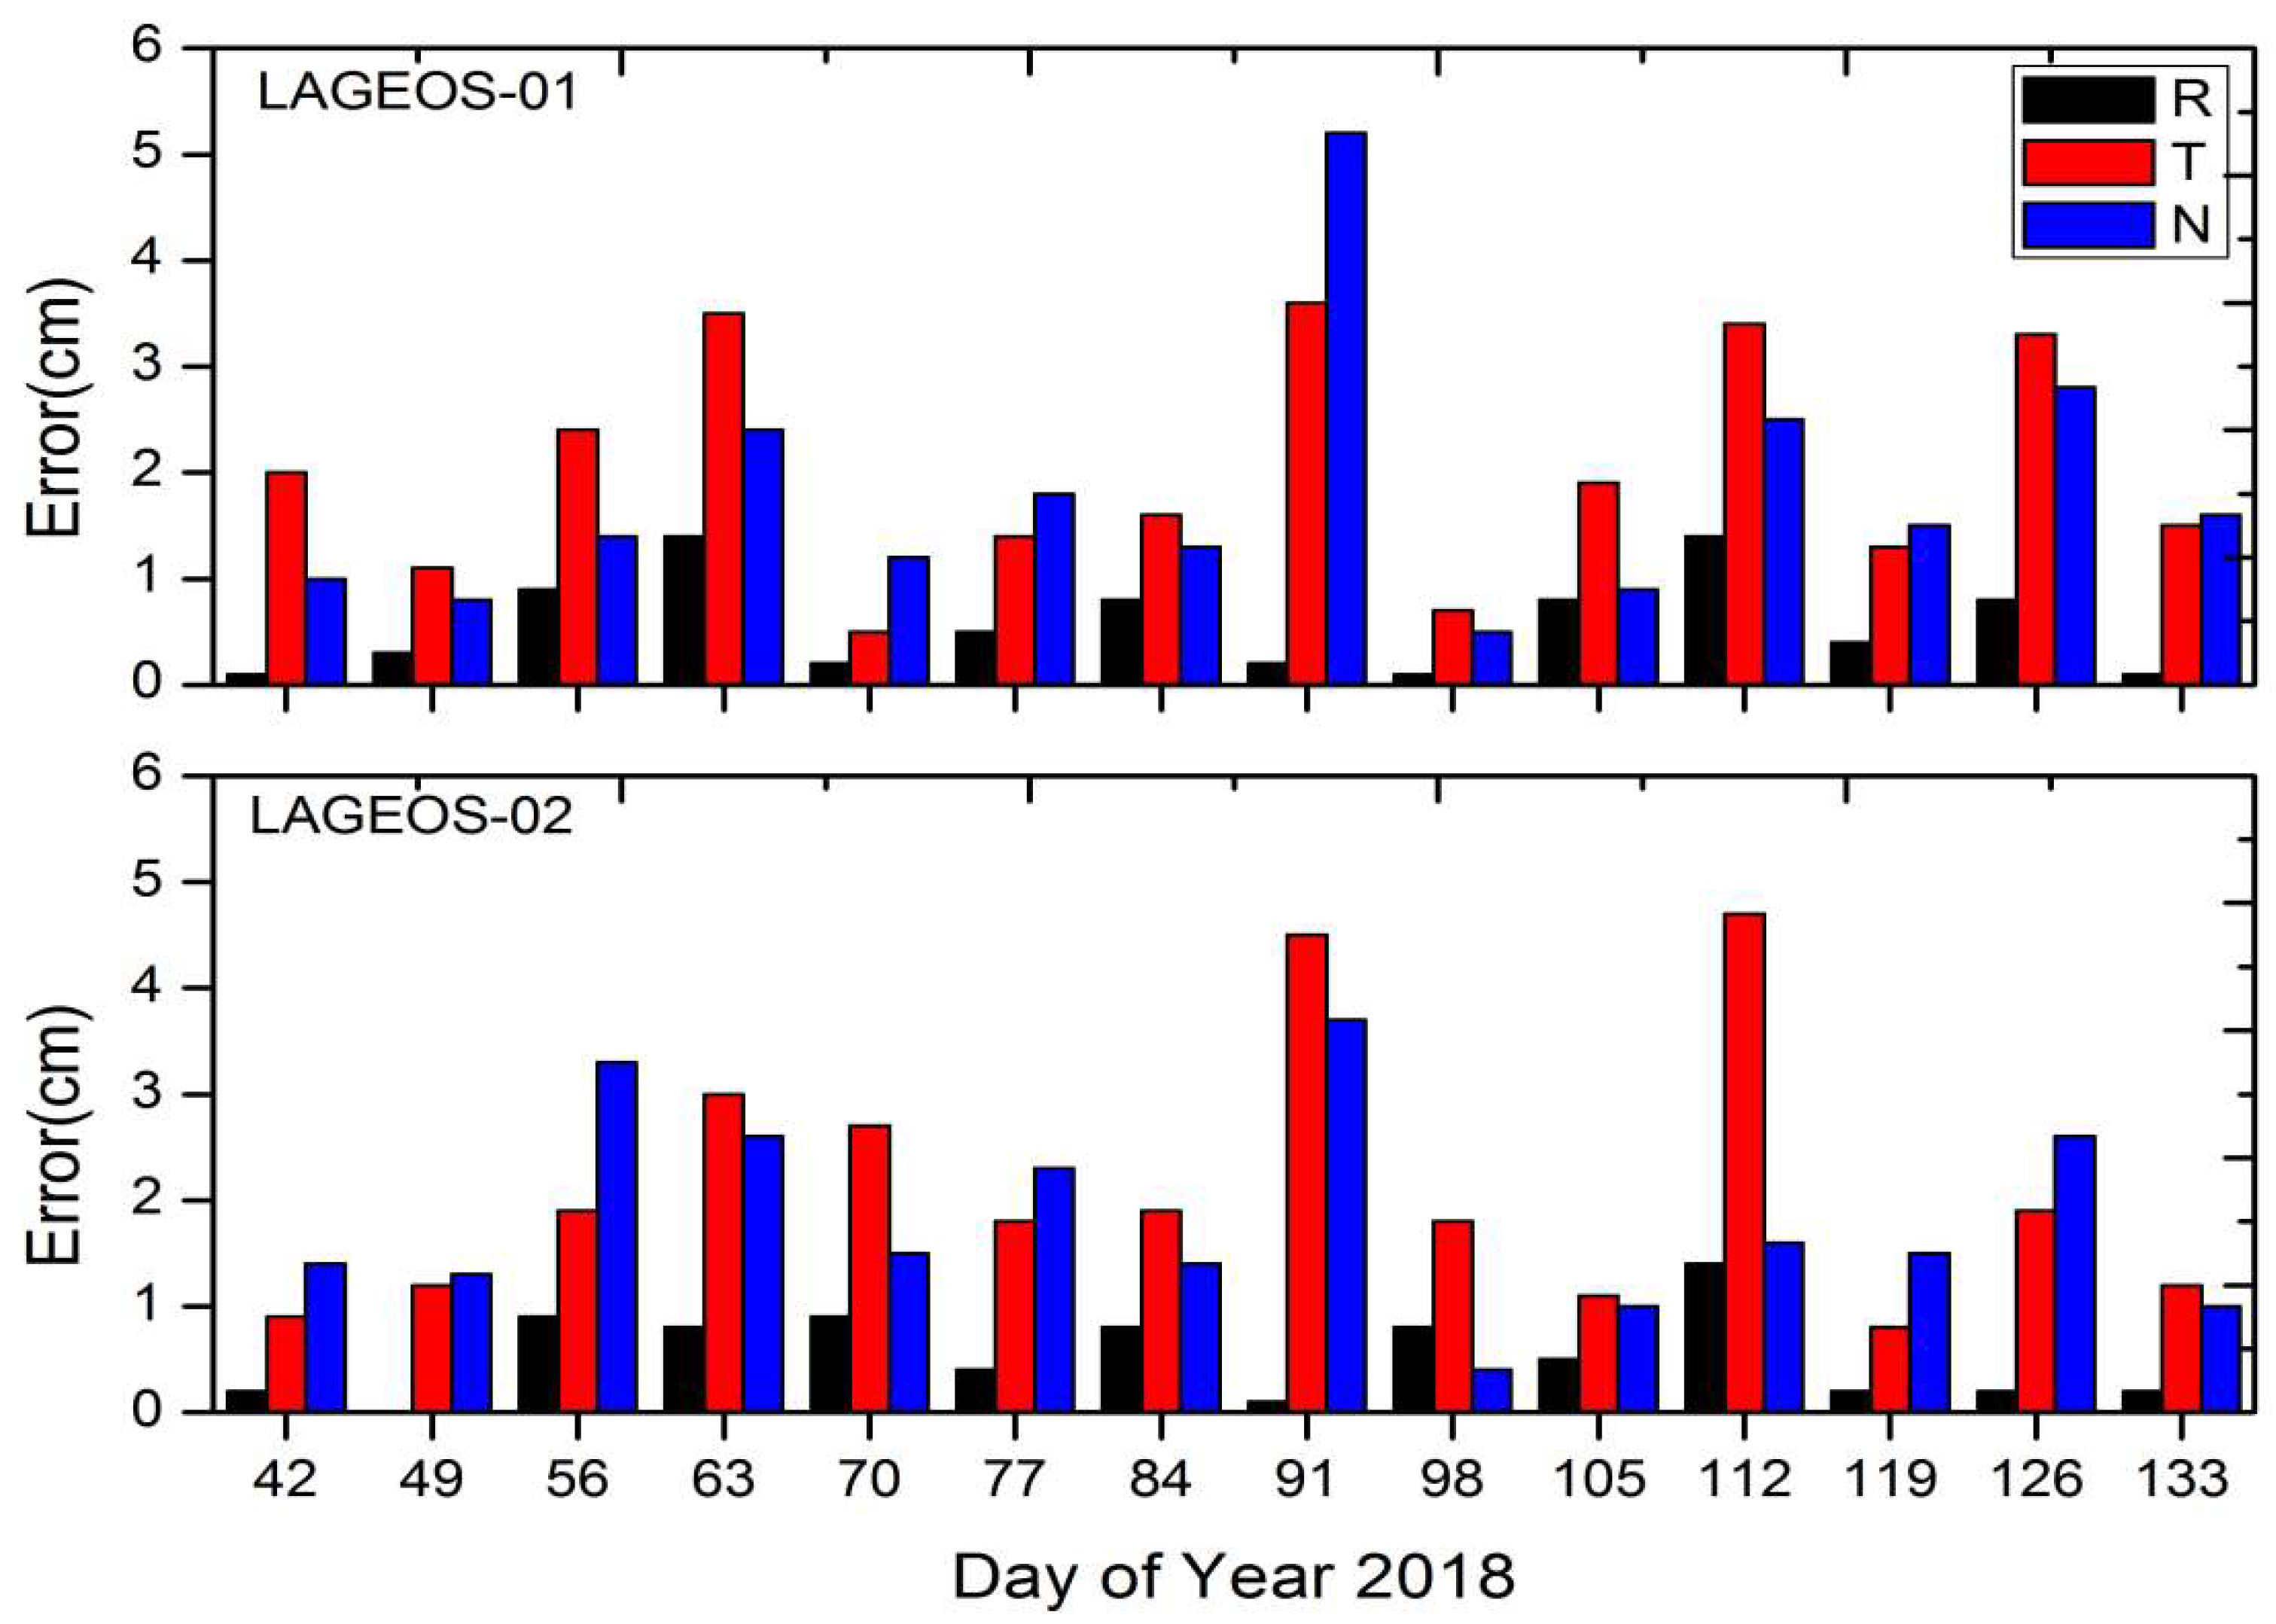
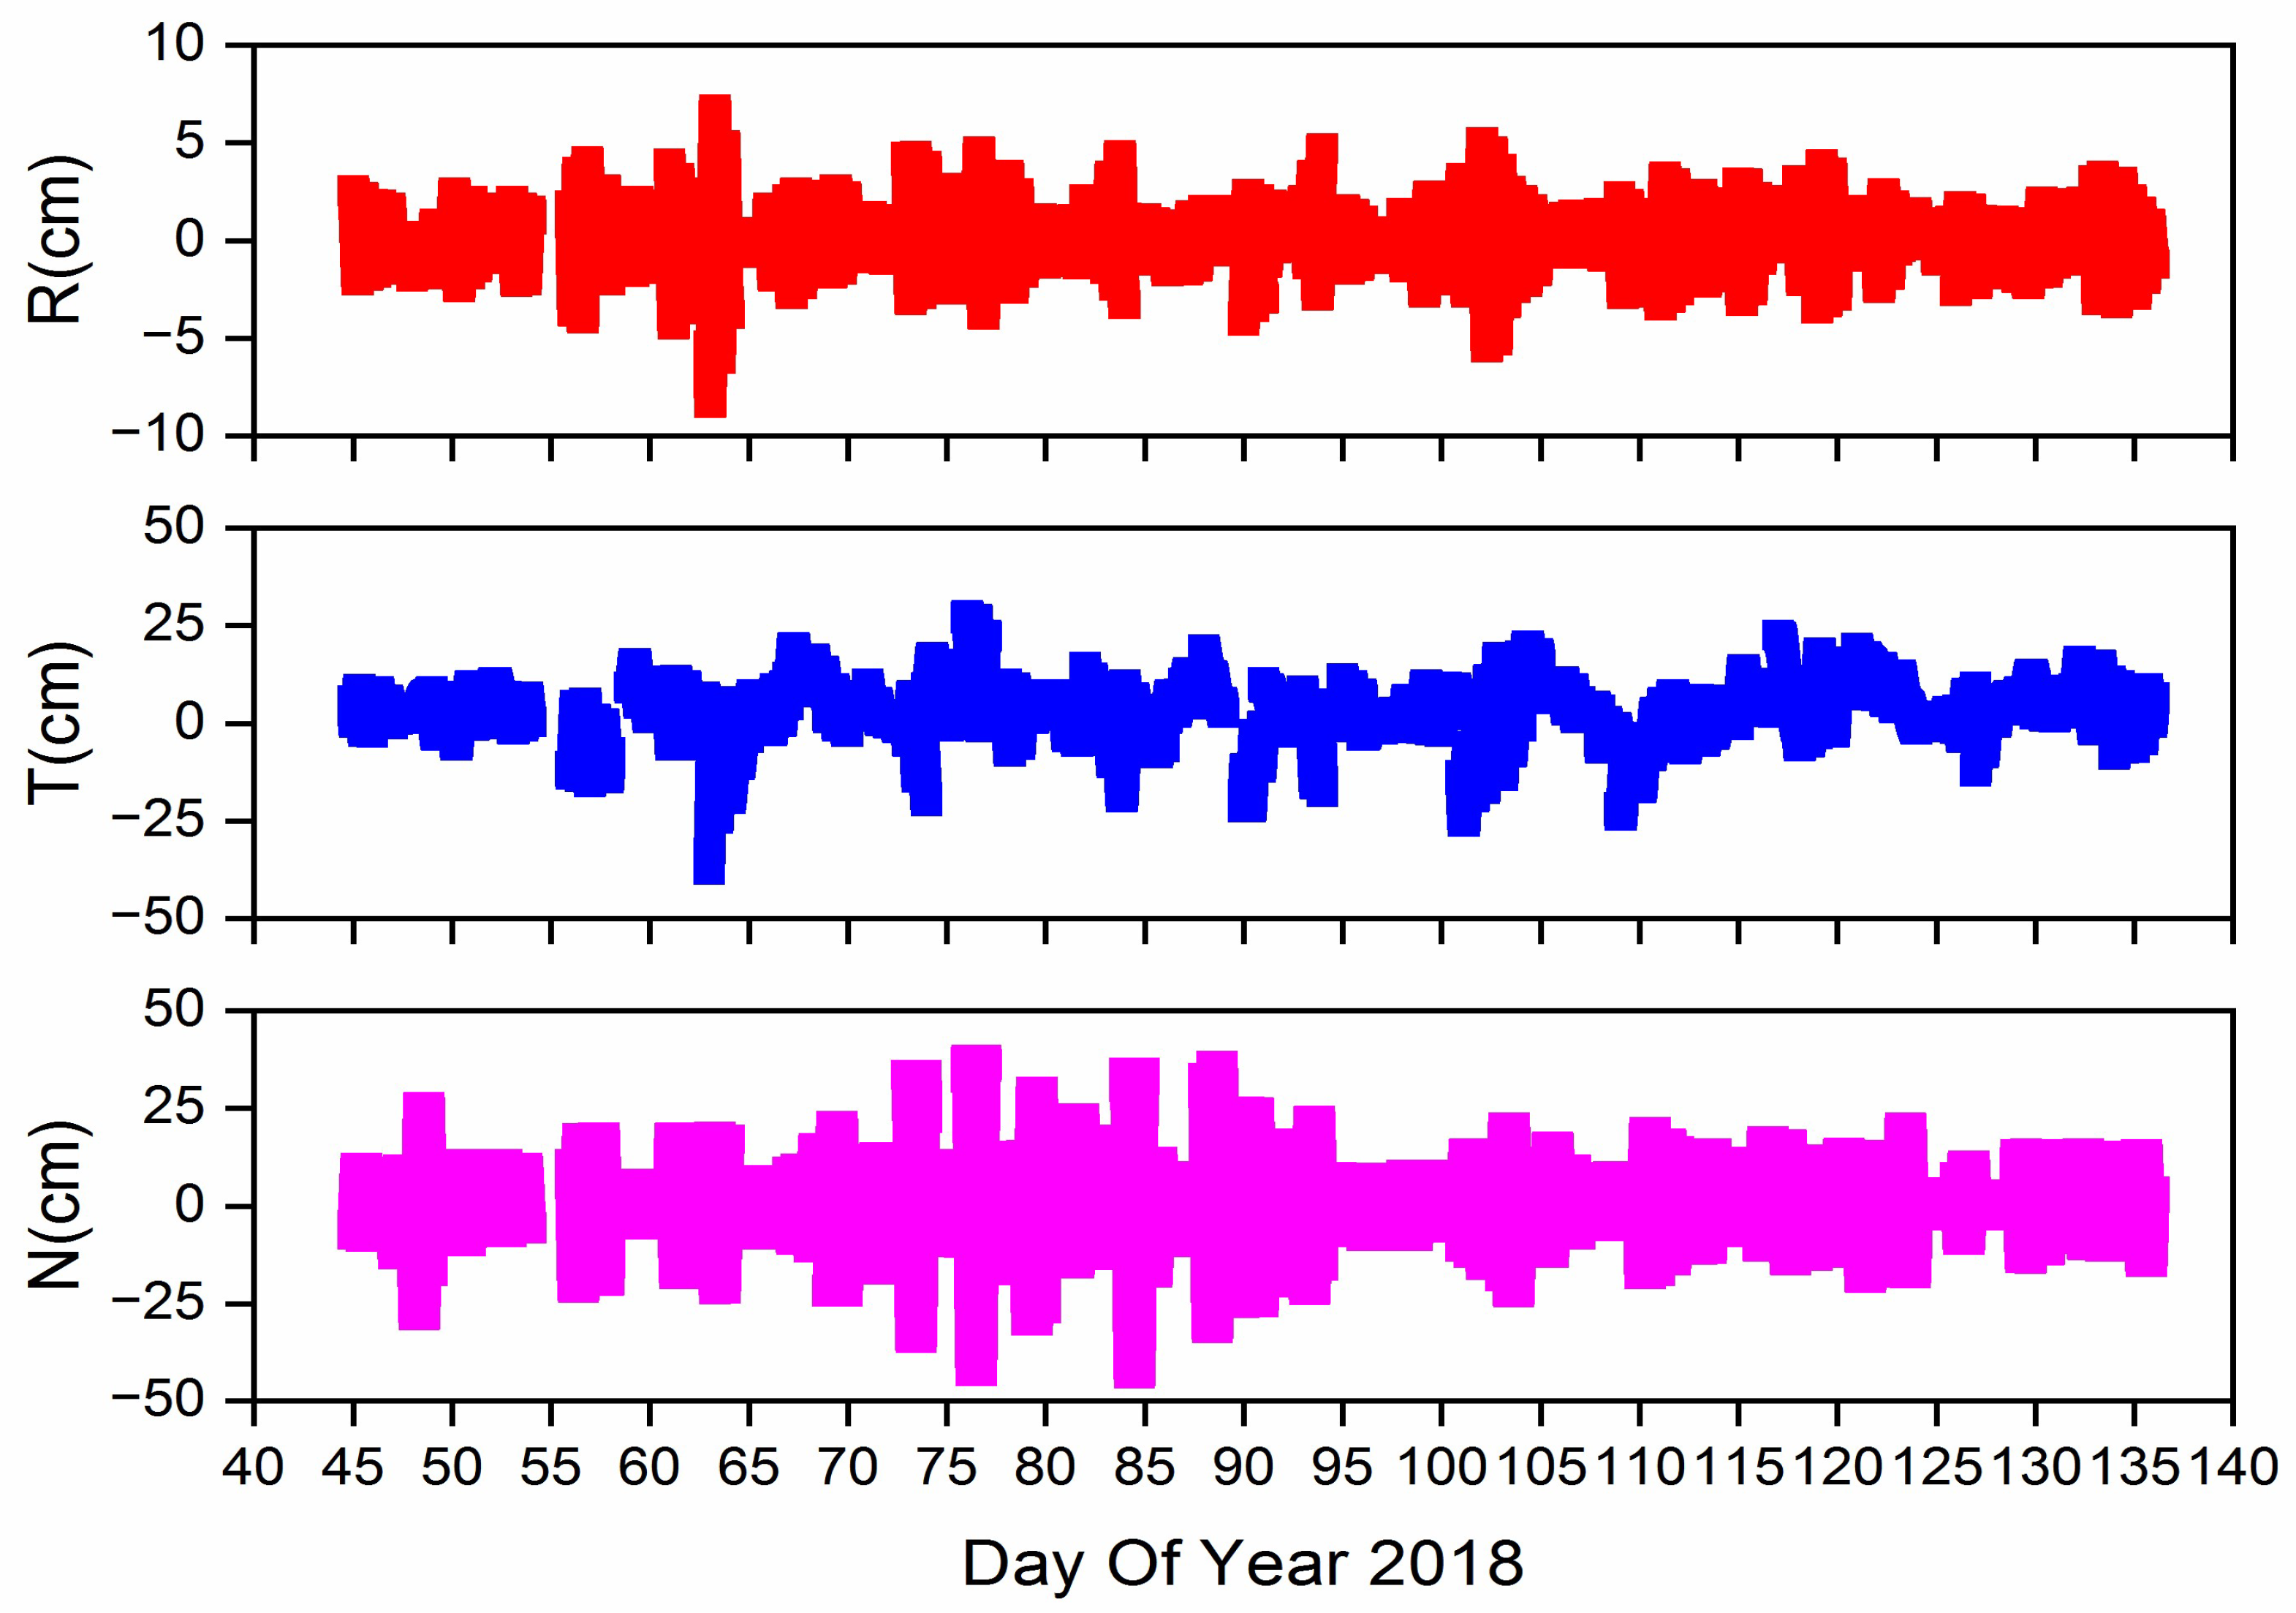
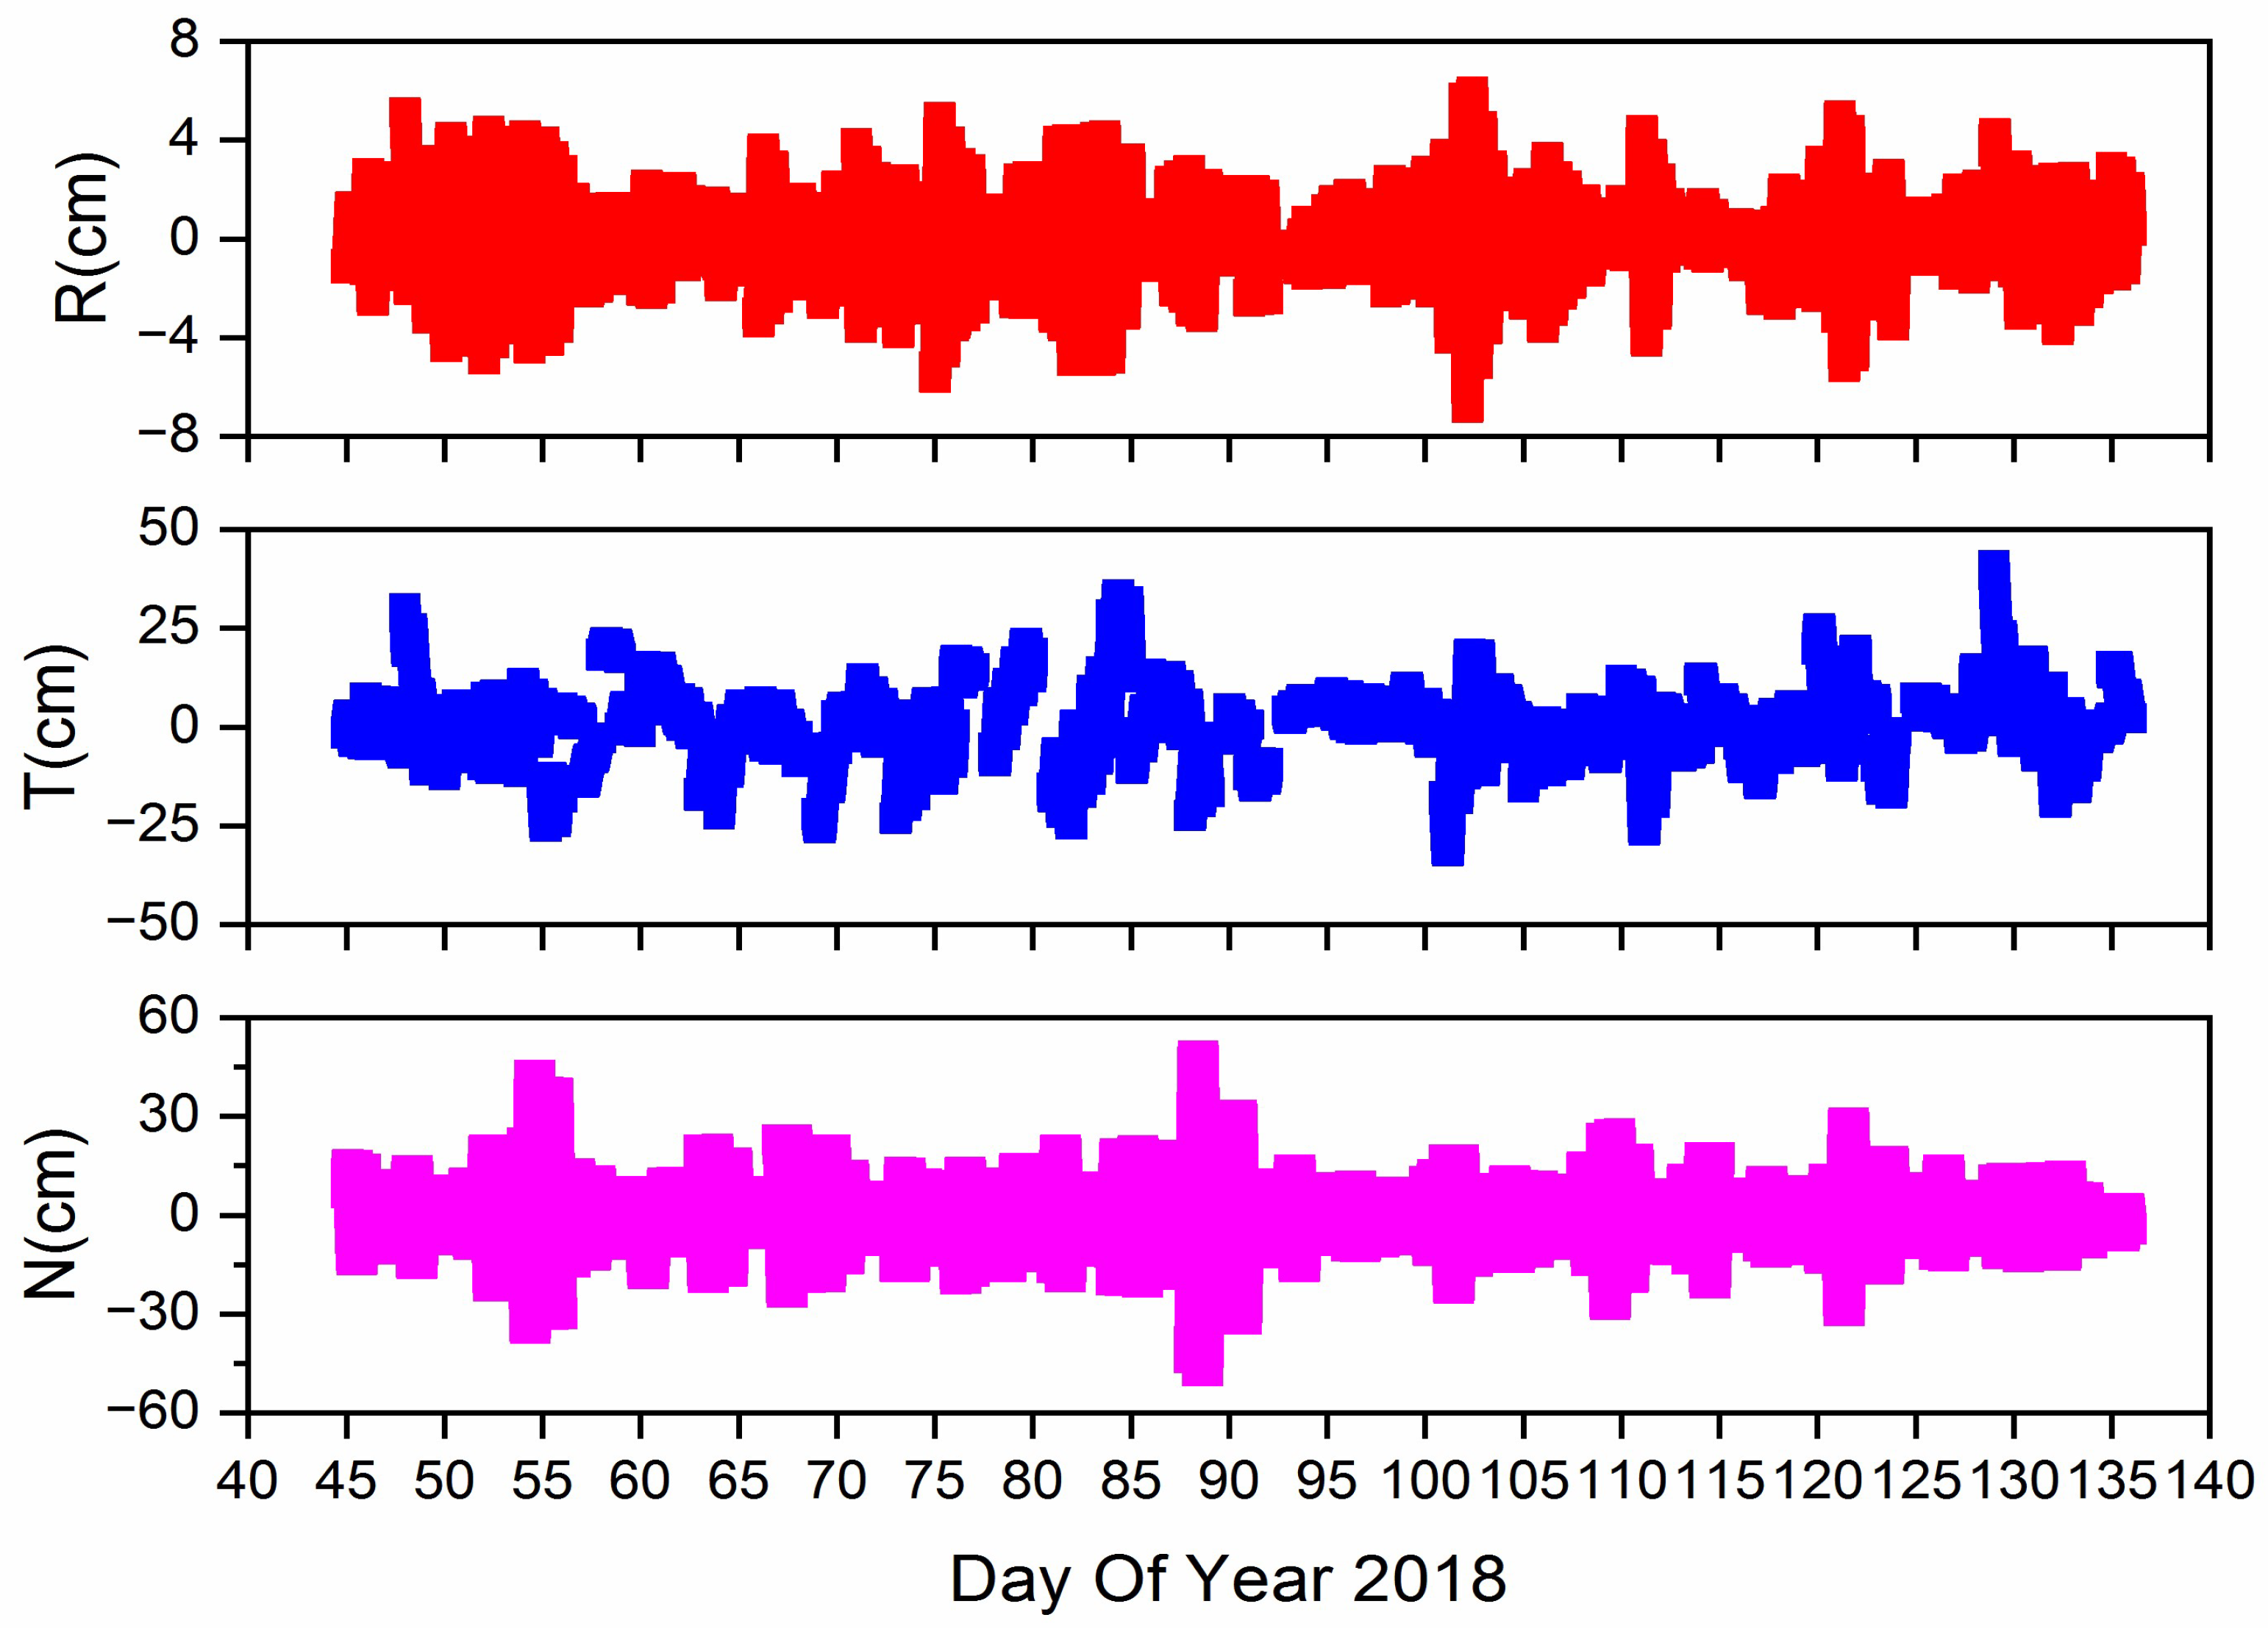
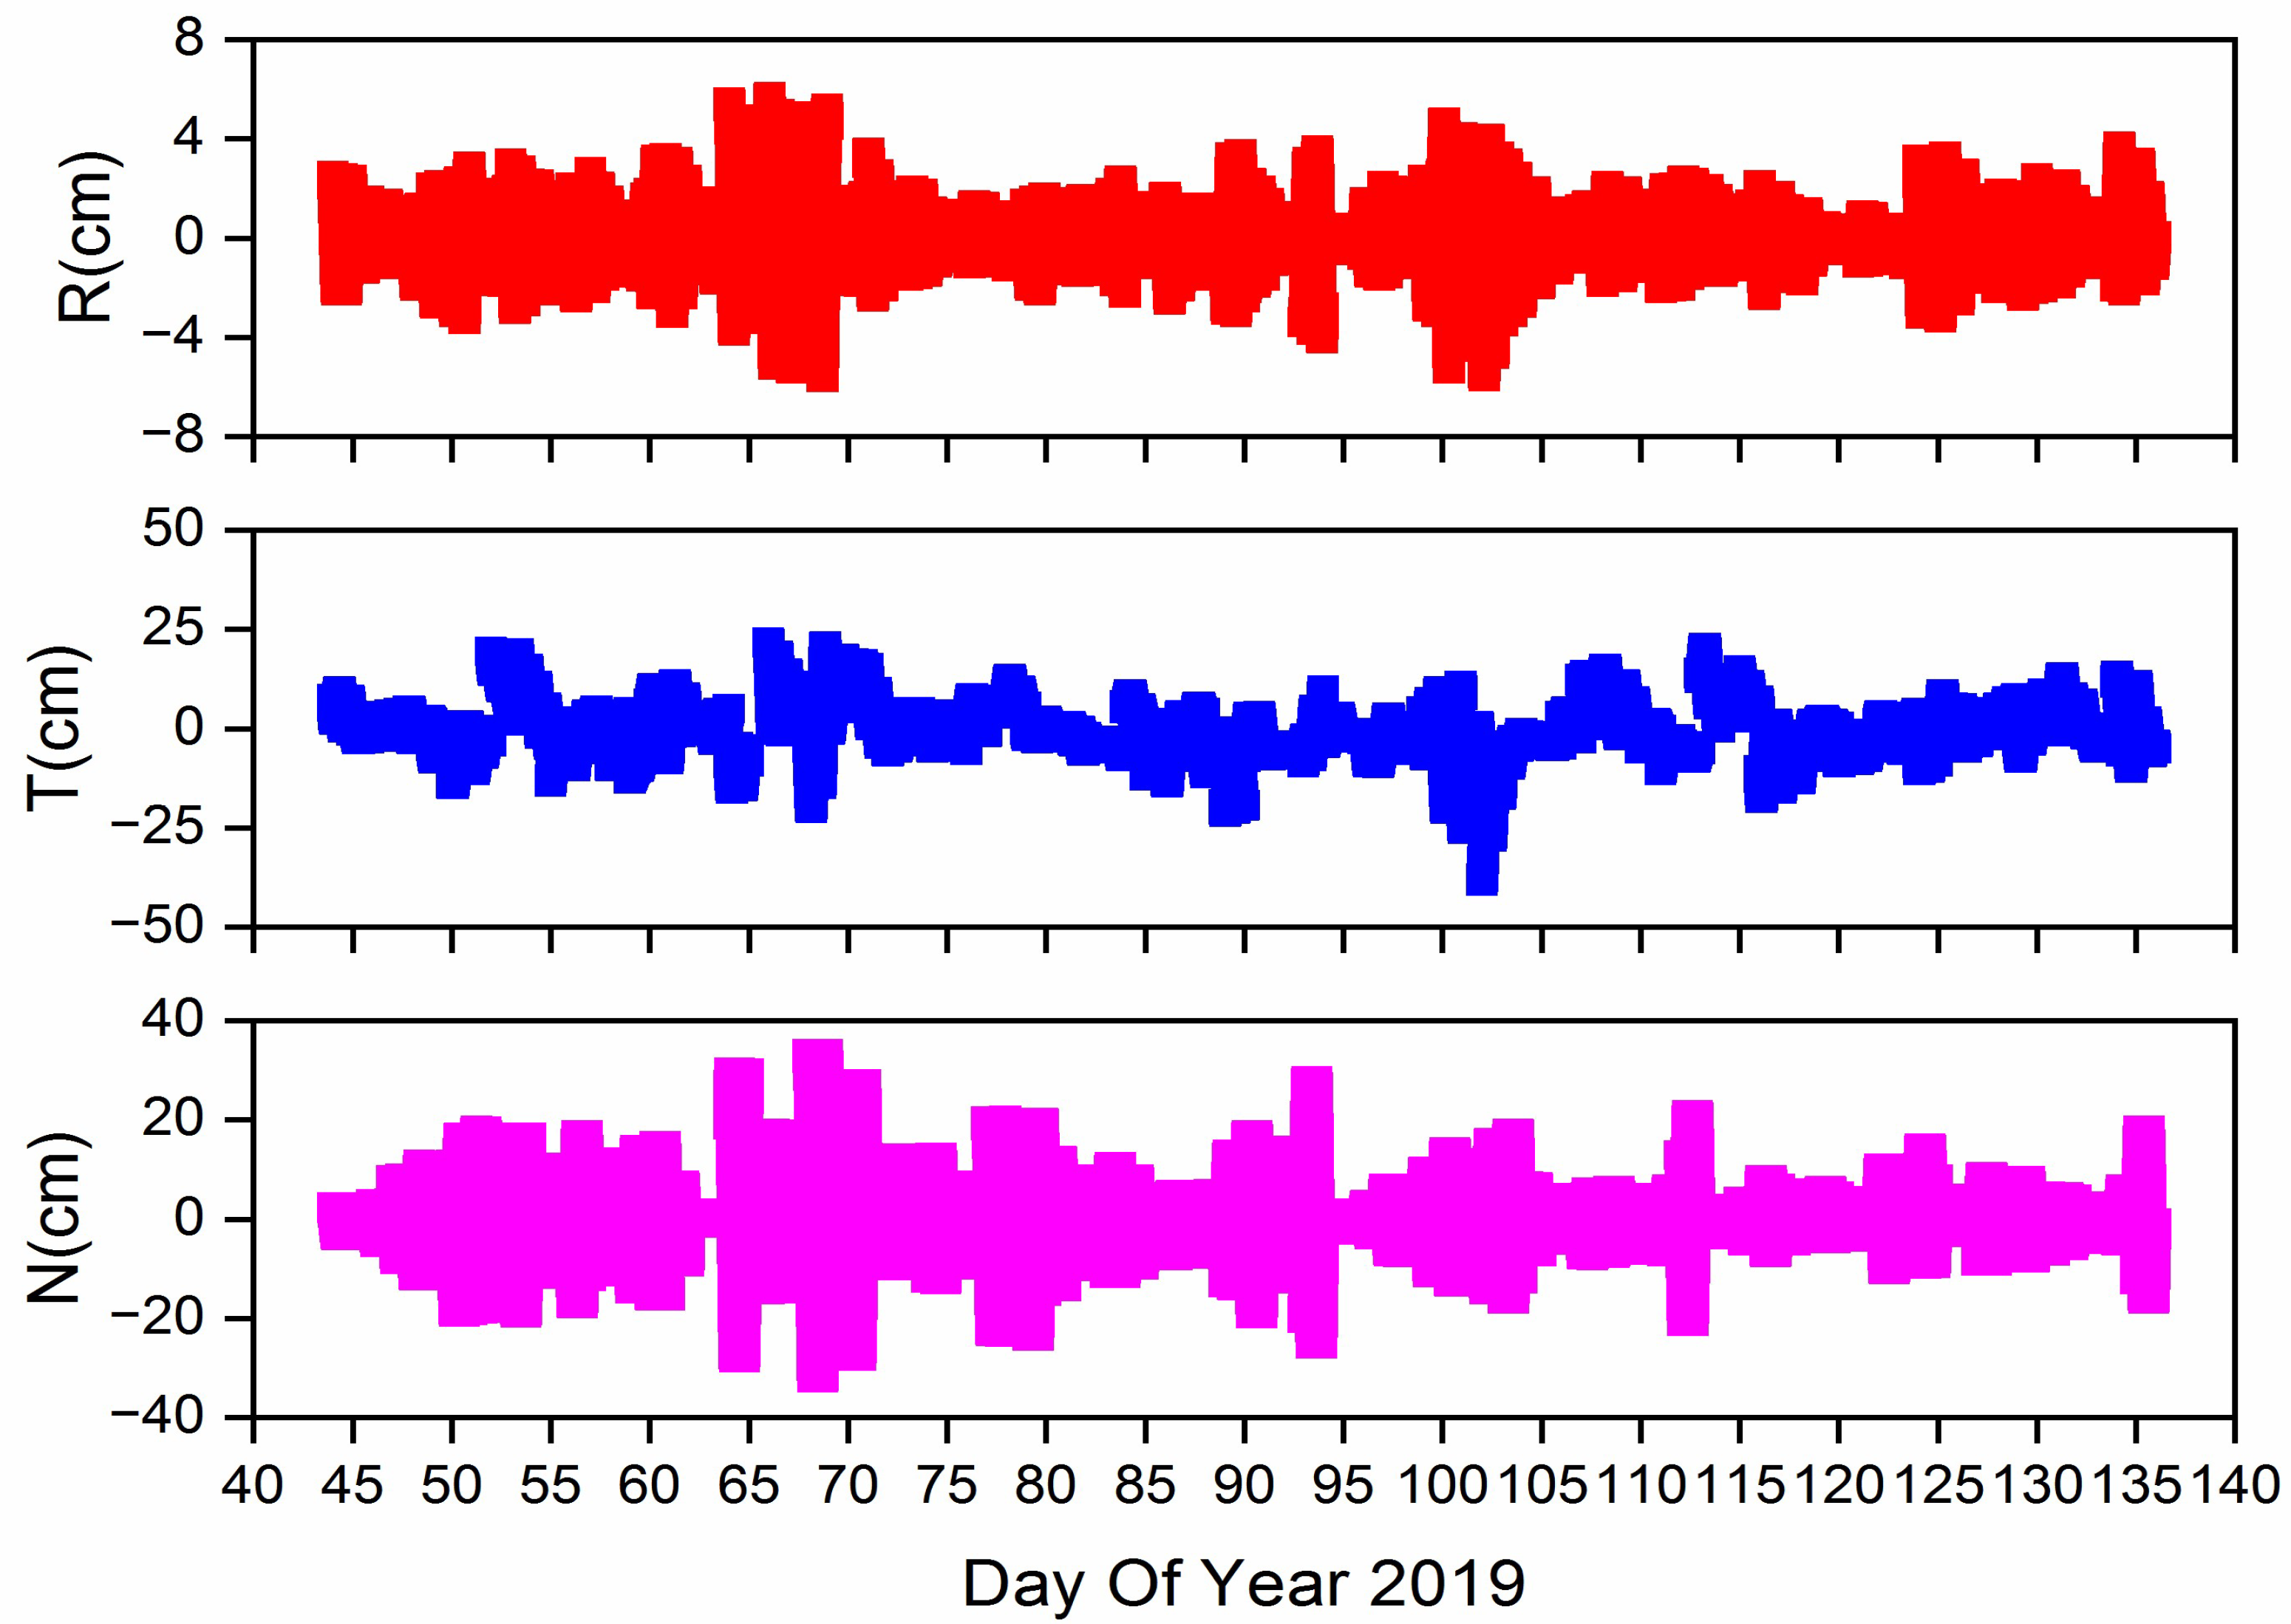
The quality of the estimated ERPs is evaluated by comparison with the IERS-14-C04 product [41], which is generated by combining four space geodetic techniques: GNSS, SLR, very long baseline interferometry (VLBI), and doppler orbitography radiopositioning integrated by satellite (DORIS). Figure 10 displays the error series of Xp, Yp and LOD with respect to the IERS-14-C04 products for the period in 2018, and Table 5 presents the corresponding statistical information. As shown in Figure 10, the error series of Xp, Yp and LOD are almost the same for the LAGEOS-only solutions and LAGEOS+Etalon solutions. Table 5 shows that the mean values for the error in the Xp component of the pole motion of the LAGEOS-only solutions and LAGEOS+Etalon solutions are 19.87 μas and 19.77 μas, respectively; the standard deviations are 263.37 μas and 263.36 μas, respectively. The mean values for the error in the Yp component of the pole motion in the LAGEOS-only solutions and the LAGEOS+Etalon solutions are 0.24 μas and 0.23 μas, respectively; the standard deviations of these two solutions are 259.08 μas and 259.86 μas, respectively. The mean values of the LOD in the LAGEOS-only solutions and LAGEOS+Etalon solutions are 18.25 μs/day and 17.69 μs/day, respectively; the standard deviation of the two solutions is 36.66 and 36.93 μs/day, respectively. After the observations of Etalon are added in 2018, the quality levels of Xp, Yp and LOD are slightly changed.
Figure 11 shows the error series of Xp, Yp and LOD with respect to the IERS-14-C04 products for the period in 2019. Figure 11 clearly shows that, compared with the differences in LAGEOS-only solutions, the differences in Xp, Yp and LOD in the LAGEOS+Etalon solutions are smaller. Statistical information for Xp, Yp and LOD, such as maximum, minimum, mean and standard deviation, are given in Table 6. Table 6 shows that when the Etalon observations are added, the standard deviation of Xp is reduced from 179.97 μas to 167.64 μas and that of Yp is reduced from 270.45 μas to 231.90 μas. For LOD, the standard deviation is reduced from 47.5 μs/day to 45.13 μs/day. Compared with the results from 2018, the quality levels of Xp, Yp and LOD are more affected by adding Etalon observations in 2019.

3.3. Orbit

In addition to global geodetic parameters, such as station coordinates, ERP, geocenter coordinates and range bias, the orbits of LAGEOS and Etalon satellites were estimated. To investigate the impact of Etalon observations on the LAGEOS orbit estimation, the orbits from the LAGEOS-only solutions and LAGEOS+Etalon solutions were compared. Figure 12 illustrates the RMS values of the differences in weekly LAGEOS-1/2 orbits in the radial, transverse and normal directions for the periods in 2018. For LAGEOS-1/2 in 2018, the RMS of the orbit error in the R component is the smallest and is generally less than 1 mm; the RMS of that in the T component is the largest and is approximately 5 mm in some weekly solutions; and the RMS of that in N is approximately 3 mm, except for on DOY 91. Figure 13 provides the orbit differences for LAGEOS-1/2 in 2019. Compared with those in 2018, similar values are obtained for LAGEOS-1/2 in 2019. However, the RMS values of the orbit error of LAGEOS-2 on DOY 090 are 8 mm and 5 mm in the T and N components, respectively, which needs to be investigated further. The mean RMSs of the orbit difference in the R, T and N parts are 0.05 cm, 0.22 cm, and 0.16 cm, respectively. Based on the above analysis, the SLR observations of Etalon in the new tracking scenario lead to an orbit difference of less than 1 cm for LAGEOS satellites.
For Etalon-1 and Etalon-2 satellites, the precision of the orbit is evaluated by the method of overlap comparison. The middle day of the orbit solutions is compared with the first day of the corresponding solutions. Figure 14 and Figure 15 show the orbit error of overlap comparison in the R, T, and N directions for Etalon-1 and Etalon-2, respectively. The orbit error in R direction lie in the range of −10 cm and 8 cm, for T direction in the range of −50 cm and 50 cm, for N direction in the range of −60 cm and 60 cm. Figure 16 and Figure 17 illustrate the orbit error for two Etalon satellites in 2019. Compare with the situations in 2018, the error in the R direction is within the range of −6 cm and 6 cm for T and N directions within the range of −40 cm and 40 cm. Table 7 gives the statistical values of overlap comparison for two Etalon satellites in 2018 and 2019. For Etalon-2 satellite, the RMS value in R direction reduced from 1.68 cm in 2018 to 1.48 cm in 2019, that in T direction reduced from 8.61 cm to 7.15 cm, and that in the N direction reduced from 10.55 cm to 8.22 cm. The situations for Etalon-2 are similar to those of Etalon-1. Compared with the orbit in 2018, the orbit error in the R, T and N directions for Etalon-1/2 satellites can be improved by 0.2 cm, 1.5 cm and 2.9 cm, respectively. For Etalon-1, the improvement in the R, T and N directions are 0.03 cm, 1.22 cm and 2.32 cm. Under the new observation scenario, the internal precision of orbit for Etalon-1/2 satellites in N direction is improved mostly.

4. Discussion

A 3-month Etalon tracking campaign was conducted by ILRS in 2019. On average, the numbers of weekly SLR observations to Etalon-1/2 satellites in the new observation scenario are 1.4 and 1.7 times larger than in the noncampaign period. This paper analyzes the contribution of Etalon observations in a new scenario to the ILRS standard products, such as station coordinates, ERPs and satellite orbit. The standard deviations of Xp, Yp and LOD for LAGEOS+Etalon solutions in the new scenario are 167.64 μas, 231.90 μas and 45.13 μs/day, respectively. Compared with the statistical information of the LAGEOS-only solutions, the precisions of Xp, Yp and LOD are improved by 6.9%, 14.3% and 5.1%, respectively. The results are similar to those shown in [32], in which the quality of Xp and Yp can be improved by 10% when the Etalon observations are increased by a factor of three in simulations. The work of Sosnica in [2] reveals that the RMS of Xp and Yp can be improved by 7% and 10%, respectively, by combining LAGEOS with Starlette, Stella and AJISAI, which are LEO satellites. In addition, the research conducted by Sosnica in [23,24] reports that combining the SLR data of LAGEOS and GNSS satellites has little effect on the estimation of pole motion. However, the quantity of weekly observations of Etalon satellites in the new scenario is approximately a factor of eight or more lower than those of LEO and GNSS satellites, which implies that more time is spent to achieve the same level of improvement. The results obtained with real data in this paper confirm that Etalon satellite observations are beneficial for ERP estimation, particularly pole motion.
Compared with ERPs, the effect of Etalon observations from the new observation scenario on station coordinates and orbit of LAGEOS satellites is marginal. For station coordinates, the range for the differences in station repeatability between LAGEOS and the combined solutions are -1 mm and 1 mm, which can be ignored. Notably, for station Komsomolsk (1868), the RMS values of coordinate residuals in the N, E and U directions using Helmert transformation are improved by 3.1 cm, 2.0 cm, and 2.3 cm when combining Etalon and LAGEOS satellite observations. This may result from the fact that station Komsomolsk (1868) is focused on the tracking of GNSS satellites and the low quantity of data on LAGEOS satellites.

5. Conclusions

Under the coordination and endeavors of ILRS, the number of SLR observations of Etalon satellites in the 3-month campaign period of 2019 increased significantly. On average, the numbers of weekly observations of Etalon satellites in 2019 were 202 and 222, which were 1.4 and 1.7 times larger than those in 2018. The ratio between SLR observations of Etalon satellites and those of LAGEOS satellites increased from 9.2% to 15.2%. For some specific SLR tracking stations, such as Komsomolsk (1868) and station Altay (1879), the ratio between the number of observations of Etalon satellites and that of LAGEOS satellites was approximately 50%. Based on the data from this new observation scenario, the effect of increased Etalon observations on most geodetic parameters generated by ILRS was investigated in this paper.
Based on the analysis of the repeatability of station coordinate estimation, the impact of the increased Etalon observations of the new tracking scenario in 2019 on station coordinates was marginal. For most of the SLR stations, the differences in repeatability for station coordinates of LAGEOS-only solutions with respect to those from LAGEOS+Etalon solutions were between −1 mm and 1 mm. For some high-performance stations, the maximum value of differences in all components was approximately 3 mm, which was lower than the impact of LEO satellites on station coordinates. However, for SLR stations not dedicated to LAGEOS satellite tracking, the RMS values of residuals in the N, E, and U components were reduced by 3.1 cm, 2.0 cm and 2.3 cm, respectively. Under the new observation scenario, the LAGEOS satellites’ orbit was affected by less than 1 cm. However, the internal precision of Etalon-1/2 satellites in T and N directions was improved by 1.5 cm and 2.9 cm, respectively. The most significant improvement gained by processing more Etalon observations from the campaign period could be seen in the recovery of the ERPs. Compared with IERS-14-C04 series, the standard deviation of Xp was reduced from 179.97 μas to 167.64 μas; that of Yp was reduced from 270.45 μas to 231.90 μas; and that of LOD was improved from 47.58 μs/day to 45.13 μs/day. The standard deviations of Xp, Yp and LOD could be improved by 6.9%, 14.3% and 5.1%, respectively. The comparison with IERS-14-C04 series demonstrates that using the more Etalon observations under the new observation scenario improves the consistency between ERPs estimated with SLR and that from other space geodetic techniques. So, it can be concluded that the more Etalon observations under the new observation scenario are more beneficial for the estimation of ERPs, especially polar motion.
The results presented in this paper serve as an example of the possible advantages of increasing the observations of Etalon satellites. In this study, the impact of Etalon observations on the ILRS product was evaluated with only a 3-month tracking campaign, and a longer period analysis covering one year or more would allow a more precise conclusion on the impact of SLR observations to Etalon satellites on more geodetic parameters, such as geocenter coordinates and scale. Thus, with our improving ability to track high-orbiting satellites, such as GNSS satellites, the ILRS should increase efforts on tracking Etalon satellites, including increasing the number of passes and data volume for Etalon satellites in the future.

Author Contributions

Conceptualization, X.Z. and Y.K.; methodology, X.Z.; software, X.Z. and Y.K.; validation, X.Z., and Y.K.; formal analysis, X.Z., Y.K. and D.Z.; investigation, X.Z.; resources, X.Z., Y.K. and D.Z.; data curation, X.Z.; writing—original draft preparation, X.Z.; writing—review and editing, Y.K. and X.L.; visualization, X.Z.; supervision, D.Z. and X.L.; project administration, D.Z. and X.Z.; funding acquisition, X.L. All authors have read and agreed to the published version of the manuscript.

Funding

This research was funded by the Natural Science Foundation of Shaanxi Province, China (grant number: 2021JQ-656).

Institutional Review Board Statement

Not applicable.

Informed Consent Statement

Not applicable.

Data Availability Statement

The datasets generated in study are available from the corresponding author on reasonable request. The original SLR data were downloaded from the ILRS Servers.

Acknowledgments

We would like to thank ILRS, CDDIS, and ILRSAC for providing the SLR data and corresponding summary files. Finally, the authors are also grateful for the comments and remarks of the reviewers, who helped significantly improve the manuscript.

Conflicts of Interest

The authors declare no conflict of interest.

References

  1. Pavlis, E.C. High resolution Earth orientation parameters from LAGEOS SLR data analysis at GSFC. In IERS Technical Note 16; IERS: Washington, DC, USA, 1994. [Google Scholar]
  2. Sosnica, K.; Jaeggi, A.; Thaller, D.; Beutler, G.; Dach, R. Contribution of Starlette, Stella, and AJISAI to the SLR-derived global reference frame. J. Geod. 2014, 88, 789–804. [Google Scholar] [CrossRef] [Green Version]
  3. Blossfeld, M.; Gerstl, M.; Hugentobler, U.; Angermann, D.; Mueller, H. Systematic effects in LOD from SLR observations. Adv. Space Res. 2014, 54, 1049–1063. [Google Scholar] [CrossRef]
  4. Glaser, S.; Fritsche, M.; Sośnica, K.; Rodríguez-Solano, C.; Wang, K.; Dach, R.; Hugentobler, U.; Rothacher, M.; Dietrich, R. A consistent combination of GNSS and SLR with minimum constraints. J. Geod. 2015, 89, 1165–1180. [Google Scholar] [CrossRef]
  5. Bloßfeld, M.; Rudenko, S.; Kehm, A.; Panafidina, N.; Müller, H.; Angermann, D.; Hugentobler, U.; Seitz, M. Consistent estimation of geodetic parameters from SLR satellite constellation measurements. J. Geod. 2018, 92, 1003–1021. [Google Scholar] [CrossRef]
  6. Altamimi, Z.; Rebischung, P.; Métivier, L.; Collilieux, X. ITRF2014: A new release of the International Terrestrial Reference Frame modeling nonlinear station motions. J. Geophys. Res. Solid Earth 2016, 121, 6109–6131. [Google Scholar] [CrossRef] [Green Version]
  7. Blossfeld, M.; Müller, H.; Gerstl, M.; Tefka, V.; Bouman, J.; Gttl, F.; Horwath, M. Second-degree Stokes coefficients from multi-satellite SLR. J. Geod. 2015, 89, 857–871. [Google Scholar] [CrossRef]
  8. Sosnica, K.; Jaeggi, A.; Meyer, U.; Thaller, D.; Beutler, G.; Arnold, D.; Dach, R. Time variable Earth’s gravity field from SLR satellites. J. Geod. 2015, 89, 945–960. [Google Scholar] [CrossRef] [Green Version]
  9. Cheng, M.; Ries, J. The unexpected signal in GRACE estimates of C20. J. Geod. 2017, 97, 897–914. [Google Scholar] [CrossRef]
  10. Pardini, C.; Anselmo, L.; Lucchesi, D.M.; Peron, R. On the secular decay of the LARES semi-major axis. Acta Astronaut. 2017, 140, 469–477. [Google Scholar] [CrossRef]
  11. Strugarek, D.; Sośnica, K.; Jäggi, A. Characteristics of GOCE orbits based on Satellite Laser Ranging. Adv. Space Res. 2019, 63, 417–431. [Google Scholar] [CrossRef]
  12. Pearlman, M.R.; Degnan, J.J.; Bosworth, J.M. The International Laser Ranging Service. Adv. Space Res. 2002, 30, 135–143. [Google Scholar] [CrossRef]
  13. Appleby, G.M. Long-arc analyses of SLR observations of the Etalon geodetic satellites. J. Geod. 1998, 72, 333–342. [Google Scholar] [CrossRef]
  14. Altamimi, Z.; Boucher, C.; Willis, P. Terrestrial reference frame requirements within GGOS perspective. J. Geod. 2005, 40, 363–374. [Google Scholar] [CrossRef]
  15. Plag, H.P.; Pearlman, M. Global Geodetic Observing System: Meeting the Requirements of a Global Society on a Changing Planet in 2020; Springer: Berlin/Heidelberg, Germany, 2009. [Google Scholar]
  16. Beutler, G.; Drewes, H.; Verdun, A. The new structure of the International Association of Geodesy (IAG) viewed from the perspective of history. J. Geod. 2004, 77, 560–584. [Google Scholar] [CrossRef]
  17. Luceri, V.; Pirri, M.; Rodriguez, J.; Appleby, G.; Pavlis, E.C.; Mueller, H. Systematic errors in SLR data and their impact on the ILRS products. J. Geod. 2019, 93, 2357–2366. [Google Scholar] [CrossRef]
  18. Zajdel, R.; Sonica, K.; Drodewski, M.; Bury, G.; Strugarek, D. Impact of network constraining on the terrestrial reference frame realization based on SLR observations to LAGEOS. J. Geod. 2019, 93, 2293–2313. [Google Scholar] [CrossRef] [Green Version]
  19. Drożdżewski, M.; Sośnica, K. Tropospheric and range biases in Satellite Laser Ranging. J. Geod. 2021, 95, 100. [Google Scholar] [CrossRef]
  20. Drożdżewski, M.; Sośnica, K.; Zus, F. Troposphere delay modeling with horizontal gradients for satellite laser ranging. J. Geod. 2019, 93, 1853–1866. [Google Scholar] [CrossRef] [Green Version]
  21. Gourine, B.; Hasni, K.; Belmehdi, F.B. Analysis of 04 years (2002–2005) of laser data on Starlette, Stella and LAGEOS-I/II satellites for stations coordinates and Earth Orientation Parameters (EOP). In Proceedings of the 1st International Electronic Conference on Geosciences, Virtual, 15–30 June 2018. [Google Scholar]
  22. Schillak, S.; Lejba, P.; Michałek, P. Analysis of the Quality of SLR Station Coordinates Determined from Laser Ranging to the LARES Satellite. Sensors 2021, 21, 737. [Google Scholar] [CrossRef]
  23. Sośnica, K.; Bury, G.; Zajdel, R. Contribution of Multi-GNSS Constellation to SLR-Derived Terrestrial Reference Frame. Geophys. Res. Lett. 2018, 45, 2339–2348. [Google Scholar] [CrossRef]
  24. Sośnica, K.; Bury, G.; Zajdel, R.; Drożdżewski, M.; Kazmierski, K. Estimating global geodetic parameters using SLR observations to Galileo, GLONASS, BeiDou, GPS, and QZSS. Earth Planets Space 2019, 71, 1–11. [Google Scholar] [CrossRef] [Green Version]
  25. Strugarek, D.; Sonica, K.; Arnold, D.; Jggi, A.; Drodewski, M. Determination of Global Geodetic Parameters Using Satellite Laser Ranging Measurements to Sentinel-3 Satellites. Remote Sens. 2019, 11, 2282. [Google Scholar] [CrossRef] [Green Version]
  26. Li, X.; Zhang, H.; Zhang, K.; Yuan, Y.; Zhang, W.; Qin, Y. Earth Rotation Parameters Estimation Using GPS and SLR Measurements to Multiple LEO Satellites. Remote Sens. 2022, 13, 3046. [Google Scholar] [CrossRef]
  27. Strugarek, D.; Sośnica, K.; Arnold, D.; Jäggi, A.; Zajdel, R.; Bury, G. Determination of SLR station coordinates based on LEO, LARES, LAGEOS, and Galileo satellites. Earth Planets Space 2021, 73, 1–21. [Google Scholar] [CrossRef]
  28. Pavlis, E.; Kuzmicz-Cieslak, M. SLR and the next generation global geodetic networks of low satellites. In Proceedings of the 16th International Workshop on Laser Ranging, Poznan, Poland, 13–17 October 2008; Schilliak, S., Ed.; JCET/UMBC and NASA Goddard: Greenbelt, MA, USA, 2008. [Google Scholar]
  29. Otsubo, T.; Matsuo, K.; Aoyama, Y.; Yamamoto, K.; Hobiger, T.; Kubo-Oka, T. Effective expansion of satellite laser ranging network to improve global geodetic parameters. Earth Planets and Space 2018, 68, 1–7. [Google Scholar] [CrossRef] [Green Version]
  30. Thaller, D.; Sosnica, K.; Dach, R.; Jäggi, A.; Beutler, G. LAGEOS-ETALON solutions using the Bernese Software; Mittlungen Des Bundesamtes Für Kartogr. Und Geodsie: Frankfurt, Germany, 2012; Volume 48, pp. 333–336. ISBN 978-3-89888-999-5. [Google Scholar]
  31. Thaller, D.; So’Snica, K.; Dach, R.; Jäggi, A.; Richter, B. Geocenter Coordinates from GNSS and Combined GNSS-SLR Solutions Using Satellite Co-Locations; Springer: Berlin/Heidelberg, Germany, 2014. [Google Scholar]
  32. Andritsch, F.; Grahsl, A.; Dach, R.; Schildknecht, T.; Jggi, A. Simulation of tracking scenarios to LAGEOS and Etalon satellites. J. Geod. 2020, 94, 1–15. [Google Scholar] [CrossRef]
  33. Dach, R.; Lutz, S.; Walser, P.; Fridez, P. Bernese GNSS Software Version 5.2; University of Bern, Bern Open Publishing: Bern, Switzerland, 2015; ISBN 978-3-906813-05-9. [Google Scholar]
  34. Mendes, V.B.; Pavlis, E.C. High-accuracy zenith delay prediction at optical wavelengths. Geophys. Res. Lett. 2004, 31, 189–207. [Google Scholar] [CrossRef] [Green Version]
  35. Petit, G.; Luzum, B. IERS Conventions. (IERS Technical Note; No. 36) Frankfurt am Main: Verlag des Bundesamts für Kartographie und Geodäsie; IERS Technical Note: Frankfurt, Germany, 2010; p. 179. [Google Scholar]
  36. Otsubo, T.; Appleby, G. System dependent center of mass correction for spherical geodetic satellites. J Geophys Res. 2003, 108, B4. [Google Scholar] [CrossRef]
  37. Luceri, V.; Pavlis, E.C.; Pace, B.; Ku´zmicz-Cie’slak, M.; König, M.; Bianco, G.; Evans, K. The ILRS Contribution to the Development of the ITRF2014. In Proceedings of the 26th IUGG General Assembly, Prague, Czech Republic, 22 June–2 July 2015. [Google Scholar]
  38. Pavlis, N.K.; Holmes, S.A.; Kenyon, S.C.; Factor, J.F. The development and evaluation of Earth Gravitational Model (EGM2008). J. Geophys. Res. Atmos. 2012, 117, B4. [Google Scholar]
  39. Eanes, R. An Improved Global Ocean Tide Model from TOPEX/Poseidon Altimetry: CSR4.0. In Proceedings of the EGS 24th General Assembly, Hague, The Netherlands, 19–23 April 1999. [Google Scholar]
  40. Standish, E.M., Jr. The observational basis for JPL’s DE 200, the planetary ephemerides of the Astronomical Almanac. Astron. Astrophys. 1990, 233, 252–271. [Google Scholar]
  41. Bizouard, C.; Lambert, S.; Gattano, C.; Becker, O.; Richard, J.Y. The IERS EOP 14C04 solution for Earth orientation parameters consistent with ITRF 2014. J. Geod. 2018, 93, 621–633. [Google Scholar] [CrossRef]
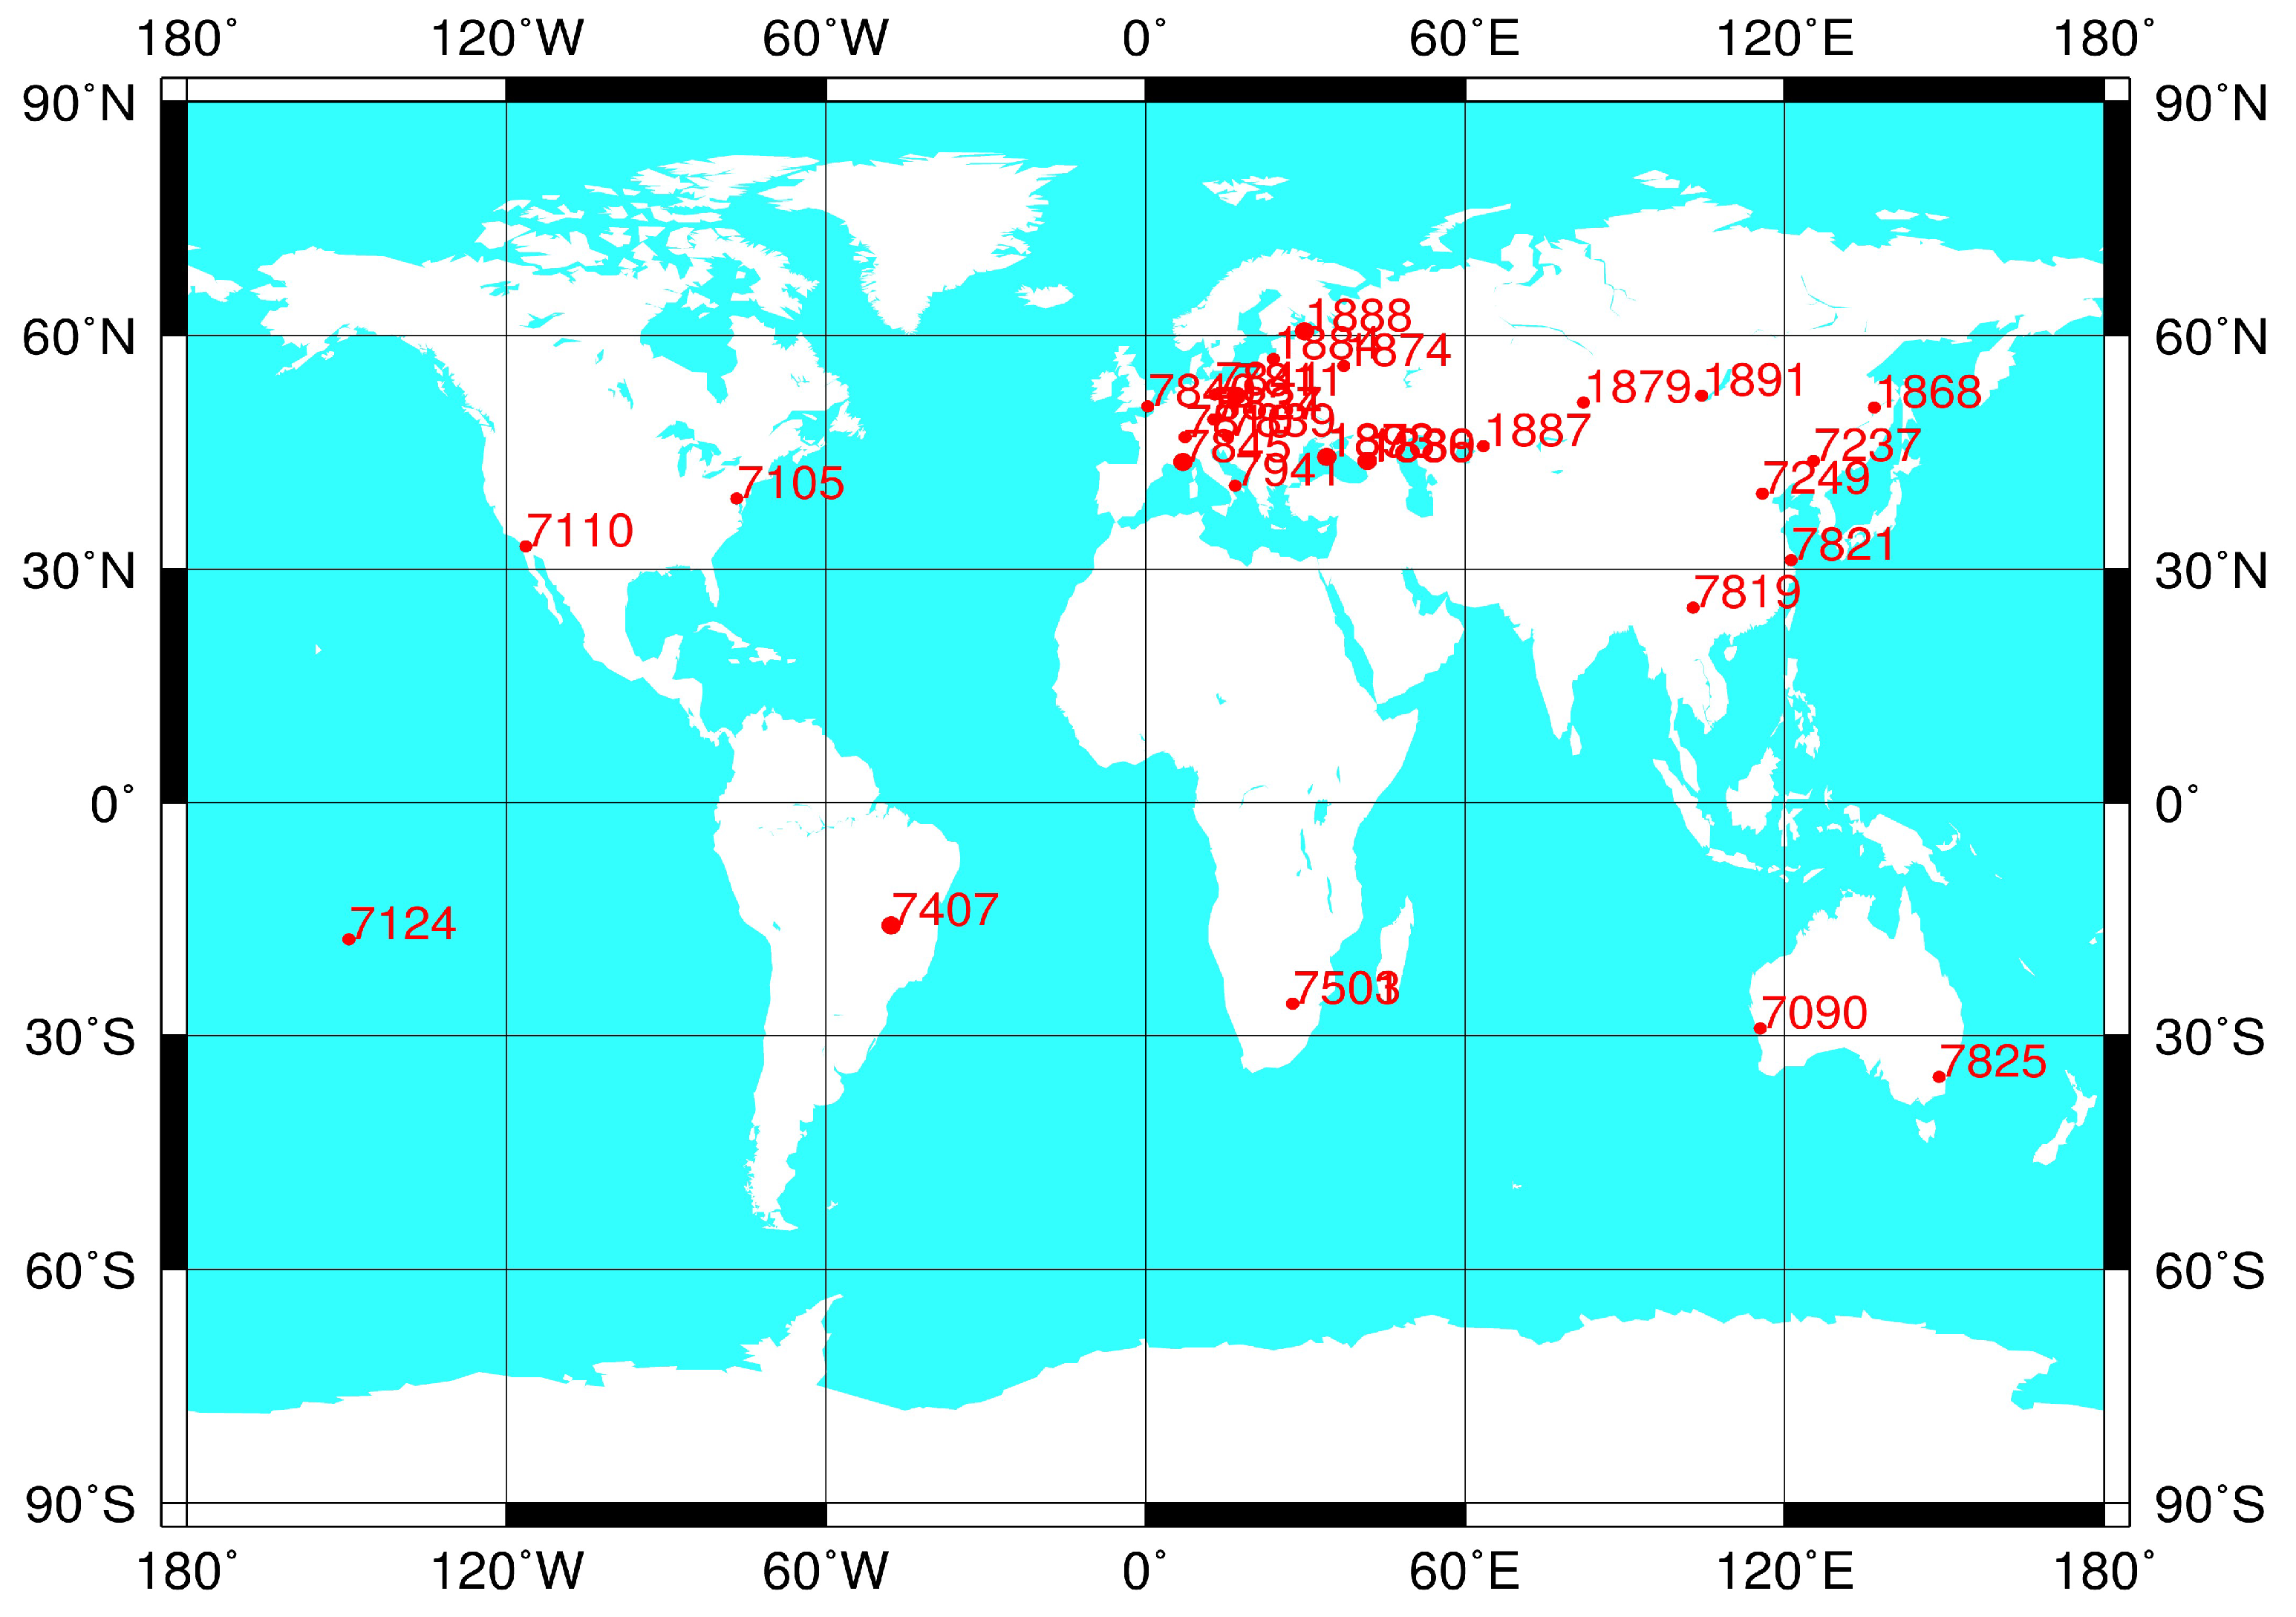
Figure 1. The distribution map of SLR stations observing the Etalon-1/2 satellites.
Applsci 12 04936 g001
Figure 2. Number of weekly observations for Etalon-1 and Etalon-2.
Applsci 12 04936 g002
Figure 3. Number of weekly observations of Etalon-1/2 satellites of 12 SLR stations.
Applsci 12 04936 g003
Figure 4. Number of weekly observations for LAGEOS-1 and LAGEOS-2.
Applsci 12 04936 g004
Figure 5. Differences in the repeatability of station coordinates between LAGEOS-only solutions and LAGEOS+Etalon solutions in 2019.
Applsci 12 04936 g005
Figure 6. Residual series of the N, E, and U components of the station coordinates for station 7090 after the Helmert transformation.
Applsci 12 04936 g006
Figure 7. Residual series of the N, E, and U components of the station coordinates for station 8834 after the Helmert transformation.
Applsci 12 04936 g007
Figure 8. Residual series of the N, E, and U components of the station coordinates for station 1868 after the Helmert transformation.
Applsci 12 04936 g008
Figure 9. Residual series of the N, E, and U components of the station coordinates for station 1879 after the Helmert transformation.
Applsci 12 04936 g009
Figure 10. Error series of Xp, Yp, and LOD for the period of 2018.
Applsci 12 04936 g010
Figure 11. Error series of Xp, Yp, and LOD for 2019.
Applsci 12 04936 g011
Figure 12. RMS of orbit differences in the R, T, and N directions for weekly solutions of LAGEOS-1 (up) and LAGEOS-2 (down) in 2018 between the LAGEOS-only solutions and LAGEOS+Etalon solutions.
Applsci 12 04936 g012
Figure 13. RMS of orbit differences in the R, T, and N directions for weekly solutions of LAGEOS-1 (up) and LAGEOS-2 (down) in 2019 between the LAGEOS-only solutions and LAGEOS+Etalon solutions.
Applsci 12 04936 g013
Figure 14. Orbit overlap differences in the R, T, N directions for Etalon-1 in 2018.
Applsci 12 04936 g014
Figure 15. Orbit overlap differences in the R, T, N directions for Etalon-2 in 2018.
Applsci 12 04936 g015
Figure 16. Orbit overlap differences in the R, T, N directions for Etalon-1 in 2019.
Applsci 12 04936 g016
Figure 17. Orbit overlap differences in the R, T, N directions for Etalon-2 in 2019.
Applsci 12 04936 g017
Table 1. SLR stations tracking the Etalon-1/2 satellites.
Site IDDOMESLocationCountryX (m)Y (m)Z (m)
186812341S001Komsomolsk-na-AmureRussia−2,948,545.553 2,774,312.979 4,912,302.412
187312337S003SimeizUkraine3,783,902.151 2,551,405.114 4,441,257.548
187412309S003MendeleevoRussia2,844,591.622 2,161,111.992 5,266,356.882
187912372S001AltayRussia543,405.811 3,955,302.296 4,957,821.036
188412302S002RigaLatvia3,183,895.637 1,421,497.208 5,322,803.793
188612373S001ArkhyzRussia3,466,773.366 3,059,757.881 4,381,456.800
188725603S001BaikonurKazakhstan2,001,873.318 3,987,633.388 4,542,477.667
188812350S002SvetloeRussia2,730,138.911 1,562,328.755 5,529,998.665
188912351S002ZelenchukskyaRussia3,451,135.973 3,060,335.220 4,391,970.306
189112313S007IrkutskRussia−968,340.229 3,794,415.115 5,018,178.124
189312337S006KatzivelyUkraine3,785,944.345 2,550,780.789 4,439,461.397
709050107M001YarragadeeAustralia−2,389,007.534 5,043,329.448 −3,078,524.223
710540451M105GreenbeltAmerica1,130,719.438 −4,831,350.580 3,994,106.573
711040497M001Monument PeakAmerica−2,386,278.627 −4,802,353.816 3,444,881.772
712492201M007TahitiFrench Polynesia−5,246,407.299 −3,077,284.309 −1,913,813.757
723721611S001ChangchunChina−2,674,387.081 3,757,189.194 4,391,508.287
724921601S004BeijingChina−2,148,760.760 4,426,759.548 4,044,509.606
739423907S002Sejong CityRepublic of Korea−3,110,108.284 4,082,170.384 3,774,911.853
740748081S001BrasiliaBrazil4,119,502.121 −4,553,595.202 −1,722,855.131
750130302M003HartebeesthoekSouth Africa5,085,401.092 2,668,330.330 −2,768,688.650
750330301S010HartebeesthoekSouth Africa5,085,428.440 2,668,340.694 −2,768,641.399
781014001S007ZimmerwaldSwitzerland4,331,283.485 567,549.979 4,633,140.413
781112205S001BorowiecPoland3,738,332.592 1,148,246.687 5,021,816.135
781921609S004KunmingChina−1,281,301.323 5,640,724.593 2,682,905.687
782121605S010ShanghaiChina−2,830,744.597 4,676,580.229 3,275,072.784
782550119S003Mt StromloAustralia−4,467,064.778 2,683,034.887 −3,667,007.319
782714201S045WettzellGermany4,075,530.996 931,781.927 4,801,620.007
783911001S002GrazAustria4,194,426.293 1,162,694.265 4,647,246.785
784013212S001HerstmonceuxUnited Kingdom4,033,463.542 23,662.700 4,924,305.303
784114106S011PotsdamGermany3,800,432.096 881,692.172 5,029,030.173
794112734S008MateraItaly4,641,978.617 1,393,067.723 4,133,249.623
883414201S018WettzellGermany4,075,576.651 931,785.679 4,801,583.698
Table 2. Measurement model of the LAGEOS+Etalon solutions.
Type of ModelDescription
Arc length7 days
Elevation angle cutoff3 degrees
Sampling intervalLAGEOS-1/2: 120 sc
Etalon-1/2: 300 sc
Satellite weightingLAGEOS-1/2: 10 mm Etalon-1/2: 30 mm
Troposphere delayZTD: Mendes-Pavlis model
Mapping function: Mendes-Pavlis model
Ionosphere delayNot modeled
Range biasesEstimated for some selected stations
Relativistic delayIERS Convention 2010
Tide loadingOcean tide loading: FES2004 model
Earth tide loading: IERS Convention 2010
Satellite center of massTables of CoM values from ILRS
Data edit2.5 sigma editing,
maximum overall sigma: 30 mm
Table 3. Characteristics of parameters estimated in LAGEOS+Etalon solutions.
ParametersDescription
Orbit parametersOne set per week arc
6 Keplerian orbit elements (7 days) and 5 empirical parameters,
S0, SS, SC, WS, WC
Station coordinatesOne set per week arc
Core stations: Network constrains
Minimum constraint: no net rotation
and no net translation
Noncore stations: freely estimated
Range biasesOne set per week arc, estimated only for selected stations recommended by ILRS
ERPsXp, Yp, LOD (1-day), piecewise constant
Geocenter coordinatesThree parameters in x, y, z components, piecewise constant
Table 4. Force models of LAGEOS+Etalon solutions.
Table 2008Description
GeopotentialEGM2008 model (degree and order 30)
Third-bodyDE405: Sun, Moon, Jupiter, Venus, Mars;
Tide forcesOcean tides: CSR 4.0A
Solid Earth tides: IERS conventions 2010
Atmospheric tides: Ray and Ponte model 2003
Solar radiation pressureDirect radiation: applied
CR: 1.13 for LAGEOS-1/2
CR: 1.20 for Etalon-1/2
Albedo radiationNot applied
Earth thermal radiationApplied
Relativistic correctionIERS Conventions 2010
Numerical integrationAdams collocation method; 12th order,
step size: 120 s
Table 5. Characteristics of Xp, Yp and LOD for the period of 2018.
LAGEOS-OnlyLAGEOS+Etalon
Xp (μas)Yp (μas)LOD
(μs/day)
XP (μas)Yp (μas)LOD
(μs/day)
Maximum574.00853.00103.80574.00873.00102.70
Minimum−774.00−831.00−72.80−784.00−913.00−82.80
Mean19.870.2418.2519.770.2317.69
Standard
deviation
263.37259.0836.66263.36259.8636.93
Table 6. Characteristics of Xp, Yp and LOD for the period in 2019.
ParameterLAGEOS-OnlyLAGEOS+Etalon
Xp (μas)Yp (μas)LOD
(μs/day)
XP (μas)Yp (μas)LOD
(μs/day)
Maximum433.00874.00150.30387.00715.00144.80
Minimum−710.00−997.00−64.90−617.00−560.00−80.80
Mean−29.1511.8622.69−30.8522.9917.41
Standard
deviation
179.97270.4547.58167.64231.9045.13
Table 7. Characteristics of orbital error for Etalon-1/2 satellites in 2018 and 2019.
SatellitesParameters20182019
R (cm)T (cm)N (cm)R (cm)T (cm)N (cm)
Etalon-1Maximum6.7327.8237.645.7121.8033.39
Minimum−8.38−37.68−43.17−5.64−38.56−32.08
Mean0.032.85−0.05−0.004−0.41−0.19
RMS1.49 7.8510.551.466.648.22
Etalon-2Maximum5.9941.1548.855.4620.6627.26
Minimum−6.88−31.77−47.61−5.18−41.41−23.46
Mean−0.030.300.57−0.01−1.250.22
RMS1.688.6110.061.487.157.15
Publisher’s Note: MDPI stays neutral with regard to jurisdictional claims in published maps and institutional affiliations.

