Article

Application of Improved MFDFA and D-S Evidence Theory in Fault Diagnosis

Jiangxi Province Key Laboratory of Precision Drive and Control, Nanchang Institute of Technology, Nanchang 330099, China
*
Author to whom correspondence should be addressed.
Appl. Sci. 2022, 12(10), 4976; https://doi.org/10.3390/app12104976
Submission received: 19 April 2022 / Revised: 7 May 2022 / Accepted: 12 May 2022 / Published: 14 May 2022

Abstract

:
To improve the accuracy of centrifugal pump fault diagnosis, a novel fault diagnosis method based on improved multiple fractal detrended fluctuation analysis (MFDFA), the fusion of multi-sensing information derived from the back propagation (BP) neural network and the Dempster–Shafter (D-S) evidence theory, is accordingly proposed. Firstly, the multifractal spectral parameters of four sensor signals under four different operating conditions were extracted as centrifugal pump fault feature vectors using improved MFDFA and input to the BP neural network. Then, the basic trust assignment function was constructed by calculating trustworthiness (both local and global) as priori information, which is based on the output results of the neural networks specific to of each group of sensors. Finally, the basic trust assignment function was fused with decision processing in accordance with the D-S evidence combination rule in order to effectively achieve the multi-sensor information fusion centrifugal pump fault diagnosis. The experimental results show the multiple fractal spectrum feature parameters extracted by the improved MFDFA can accurately reflect the signal essence, and can be used as the fault feature vector. On this basis, this multi-sensor fault diagnosis reduces the uncertainty of fault classification and demonstrates improved accuracy compared to the single-sensor fault diagnosis thanks to being based on a combination of the BP neural networks and D-S evidence theory. Thereby, this method can facilitate accurate diagnosis of the centrifugal pump fault type with high confidence, subsequently providing a novel and alternative method to existing methods of diagnosis.

1. Introduction

The traditional technique of fault diagnosis consists of acquiring single sensor data and obtaining the corresponding features using the signal feature extraction method for fault pattern identification. However, traditional signal feature extraction method presents with certain limitations, and the fault information contained in a single sensor is incomplete, thereby this approach is incapable of fully reflecting the fault status of the specific object being tested [1,2,3]. To address this problem, scholars have proposed solutions from improving the accuracy of fault signal feature extraction and using data fusion techniques. For example, Pei [4] applied MFDFA, as proposed by Kantelhardt [5], to the acoustic signal, and extracted the multiple fractal spectral feature parameters as the eigenvalues, which finally allowed for the fault diagnosis to be realized. In addition, Su [6] used SVM and information fusion technology to diagnose the fault by a single signal. With the improvement of monitoring technology, the research of fault diagnosis tends to use multi-sensor data, and D-S theory is more and more widely used [7]. For example, Yu [8] integrated the empirical modal decomposition of fault vibration signals from different position sensors to obtain energy values as fault eigenvalues and used the D-S evidence theory to achieve integrated diagnostic results. Further, Mcdonald [9] and Ye [10] obtained the fault features of multiple sensor signals through different feature extraction methods and applied the D-S evidence theory to consolidate the information, effectively resulting in the improvement of the diagnosis rate.
Kracik [11] used the improved MFDFA to analyze the random part of the power load data to obtain the information of the probability distribution and reveal the information contained in these data, which further shows that the MFDFA has a good effect on processing nonlinear non-stationary data and has a wide range of applications. Xi [12] and Martínez [13], for the MFDFA’s flaws, assuming that the signal local trend term is in polynomial form, but the actual signal local trend is not all polynomial form, improved this via the introduction of moving average method and in other ways, instead of polynomial fitting for local trend removal, but such methods lack adaptability to signals. Therefore, inspired by various studies, this paper offers an improved MFDFA [14] and combines BP neural network [15] output with D-S evidence theory [7] to propose a new method of fault diagnosis. Among them, in order to overcome the defects of MFDFA, the automatic determination of EMD trend term method is introduced and the least squares method is fitted instead of polynomial fitting, so that it can well describe the structural characteristics and local scale behavior of the fault signal and quantitatively reflect the characteristics of the fault signal, while D-S evidence theory [16], as a decision-level information fusion method of data fusion technology, can effectively synthesize the information of multiple sensors and overcome the uncertainty and limitations of single sensors. It provides a new way to solve the uncertainty of equipment failure in complex systems. Therefore, this paper takes the centrifugal pump as the research object, the proposed method is applied by using the improved MFDFA method to extract the multifractal spectral parameters of the signals from centrifugal pump vibration, torque, motor vibration, and oscillation sensors and form them into feature vectors Δ f , α 0 , Δ α , α min , and α max . This is then input to the BP neural network and combined with D-S evidence theory for the decision level fusion of the multi-sensor data. The final fault diagnosis results of the centrifugal pump are subsequently obtained according to the established diagnostic rules. Therefore, this method can provide a practical reference for the accuracy of fault diagnosis in the field of signal analysis of complex power systems.
The organizational structure of this article is as follows: In Section 2, we describe the theoretical basis of the method. Specific methods for improving MFDFA are introduced first, followed by BP neural networks and D-S evidence theory. In Section 3, we introduce the test setup and the multi-sensor fault diagnosis model. In Section 4, we use the method of Section 2 to analyze multiple sets of sensor data. Finally, in Section 5, we come to the conclusions of our study.

2. Theoretical Basis

MFDFA is a process to remove the influence of the non-stationary trend of the time series, can finely characterize its fractal structure, this section on how to improve the MFDFA is analyzed, and according to the relationship between the generalized Hurst index, the mass index and the multi-fractal spectrum to extract the five multi-fractal spectrum characteristic parameters that can describe the dynamic behavior of the time series, in the face of the complexity of the actual operation of the centrifugal pump, multiple sets of sensor data are selected for feature extraction. Different BP neural network diagnostic results are obtained, and then on the basis of D-S evidence theory research, the information fusion of different diagnostic results is carried out, and the basic probability allocation function that can reflect the objective reality is constructed, thereby improving the fault diagnosis effect of the centrifugal pump.

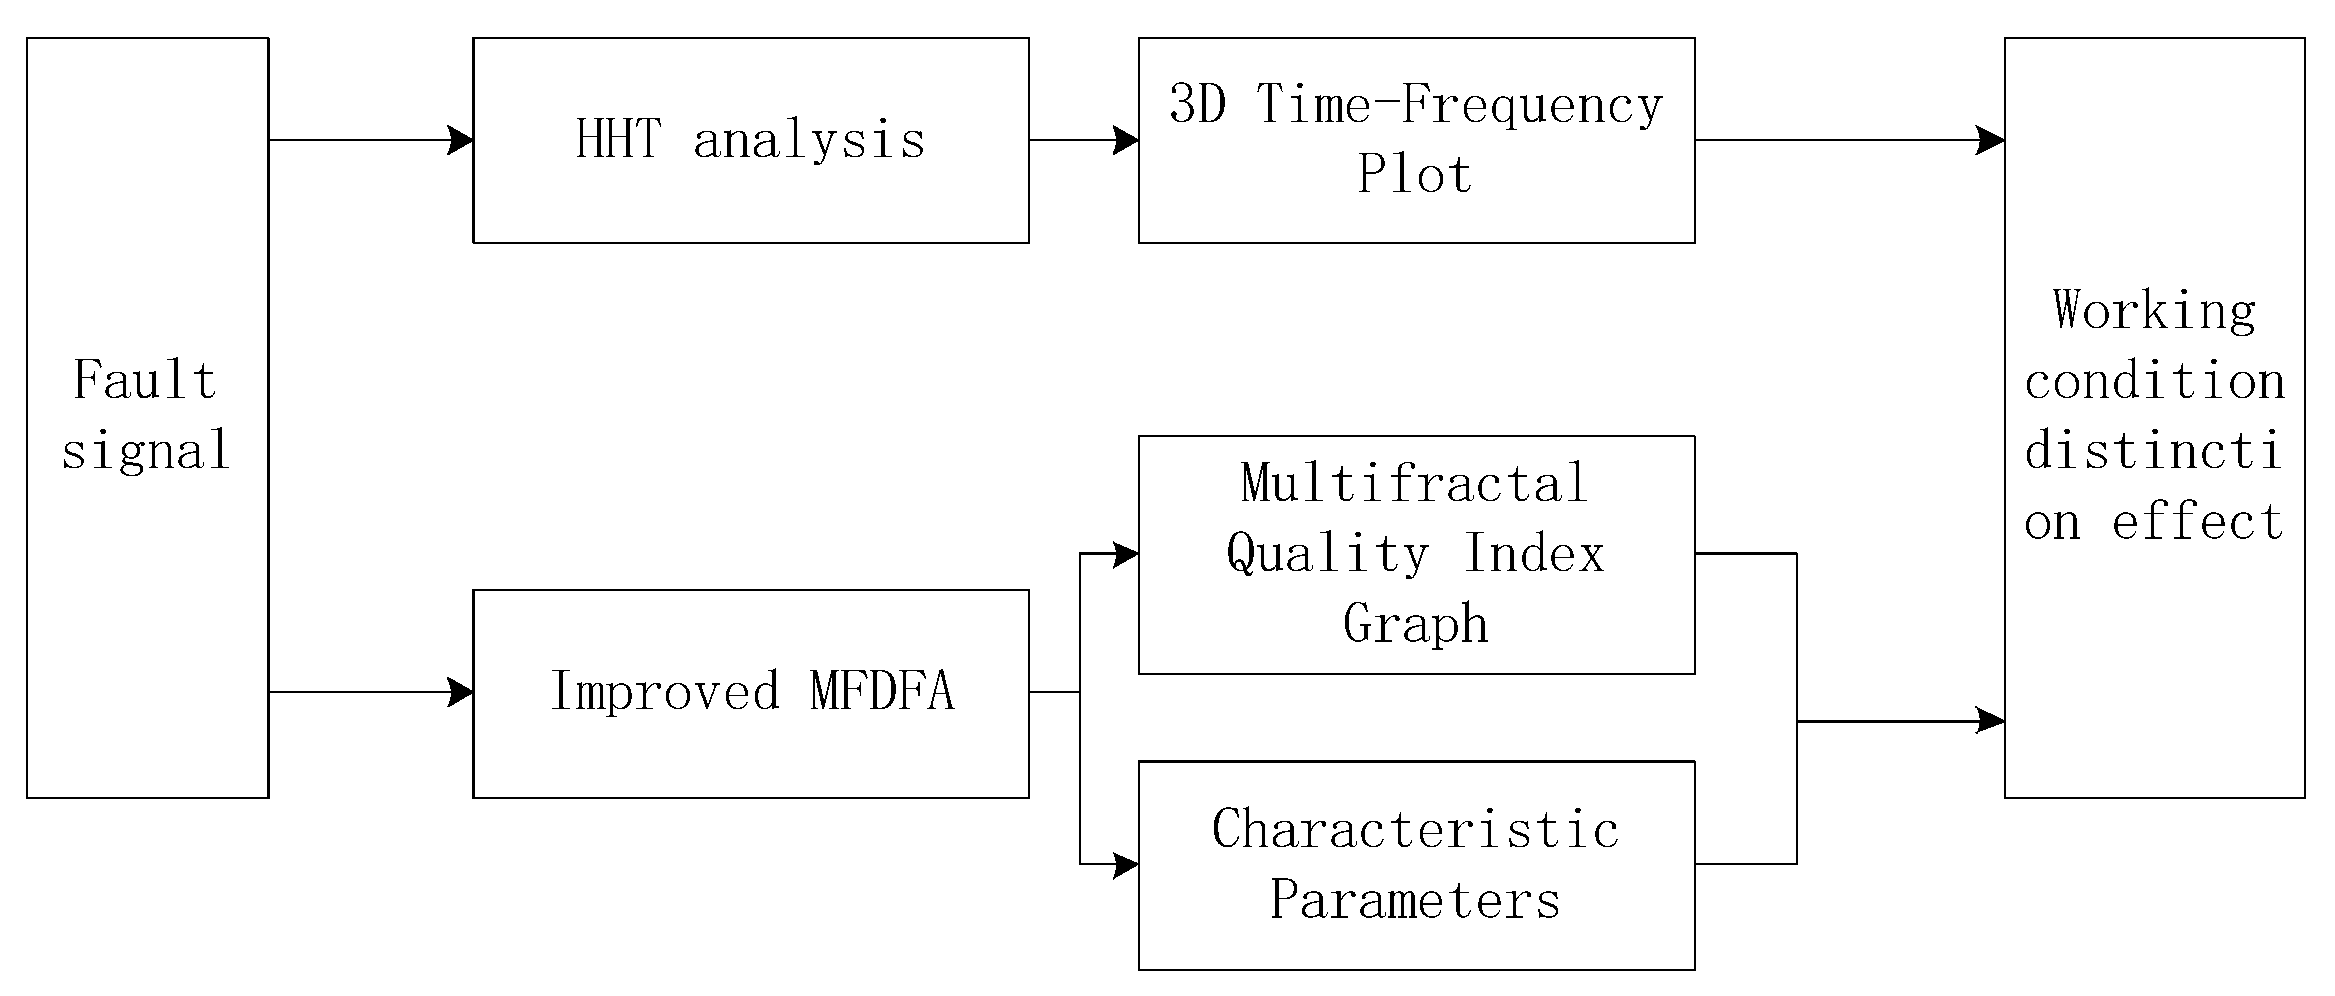
2.1. Improved MFDFA Method

The MFDFA method processes the fault signal by assuming the local trend of the signal as a polynomial for removal, which affects its applicability. Thus, a multifractal analysis method of EMD-LS-MFDFA is proposed to address this problem. The proposed approach integrates the automatic determination of EMD trend term method [17,18] and the least squares (LS) method [19]. This removes limitations associated with the complete decomposition of EMD, while simultaneously overcoming the defects of modal confusion and the endpoint effect. In addition, this approach also successfully avoids the influence of the original signal on the LS fitting accuracy. The EMD-LS-MFDFA method can therefore be assured to accurately obtain the trend terms of the faulty signal at different scales, allowing extraction of the multi fractal spectrum parameters.
For the original signal x ( i ) ( i = 1 , 2 , , N ) , the fitting process of trend terms by EMD-LS can be expressed as:
x ( i ) = j = 1 n c j ( i ) + r n ( i )
In Equation (1), n is the number of intrinsic mode functions (IMFs) decomposed out of x ( i ) by EMD according to its own scale characteristics, c j ( i ) is the j t h IMF component ( j = 1 , 2 , , n ) and r n ( i ) is the residual component of the signal.
Ideally, r n ( i ) is used as the final trend term of the original signal [17]. However, in practice, the trend term also contains some low-frequency IMF components, and if r n ( i ) alone is used as the final trend term, there will be a large error. Therefore, if the residual component is set as the last IMF component, considering that the trend term of the original signal may be the sum from the T t h IMF component to the last IMF component, it can be expressed by the following formula:
M ( i ) = j = T n c j ( i )
For determining the value of T , an automatic criterion for EMD trend terms is introduced, which can be expressed by the following formula:
Z = j = T n + 1 i = 0 N c j ( i ) i = 0 N x ( i )
Ideally, Z = 1, but in practice, real conditions are too harsh, so after extensive simulation analysis, the value Z = 0.95 was determined.
After automatic determination, let the trend term M ( i ) be a series ( i = 1 , 2 , N ) with sampling frequency f , then the trend term can be expressed as below:
w ( i ) = k = 1 K b k a k
where a = i / f and b k is the coefficient of the trend term. The latter can be solved using the least squares method.
Based on this, the final signal x ( i ) can be extracted using EMD-LS:
x ( i ) = x ( i ) ( M ( i ) w ( i ) )
In turn, for the signal x ( i ) , the MFDFA method is applied to carry out the feature extraction [18], i.e., the signal can be expressed as a q fluctuation function of order.
F q ( s ) = a s h ( q )
where s is the length of the equal subinterval divided by the cumulative deviation of x ( i ) , a is a constant, and h ( q ) is the generalized Hurst exponent. Its value is the gradient of the slope obtained by fitting the least squares method F q ( s ) to the scale s . When the multiplicative fractal process is carried out when the value h ( q ) varies with q it may be described as a multifractal process.
According to the Legendre transform, the generalized Hurst index h ( q ) is related to the mass index τ ( q ) , singularity index α , and multifractal spectrum f ( α ) in the multifractal as follows:
τ ( q ) = q h ( q ) 1
α = h ( q ) + q d h ( q ) d q
f ( α ) = q [ α h ( q ) ] + 1

2.2. D-S Evidence Theory

D-S evidence is a theory built on a non-empty set in which the basic idea is to divide the accrued evidence into a series of mutually exclusive propositions and use the identification framework Θ to signify them as a set. If the function m : 2 Θ [ 0 , 1 ] and satisfies the following equation:
m ( ϕ ) = 0 ;   A Θ m ( A ) = 1
Then, m can be determined to be the basic trust assignment function of Θ , where ϕ is the empty set, and for A Θ , m ( A ) denotes the degree of trust in the proposition A , then the trust function can be expressed as:
B e l ( A ) = B A m ( B )
Under the same framework as defined by Θ , B e l 1 , B e l 2 , , B e l n is the trust function of n propositions, which can obtain its corresponding basic trust allocation function m 1 , m 2 , , m n according to the BP neural network. Then, the principle of maximum affiliation can be used to obtain the decision result of m ( A ) under Θ as below:
m ( A j ) = m a x { m ( A 1 ) , m ( A 2 ) , , m ( A n ) }
where m ( A j ) ( j = 1 , 2 , , n ) is the maximum value of m , and if j = 1 , this proposition A 1 is the final decision result in the framework Θ .
In order to determine the decision results more accurately, it is necessary to select more reasonable values for the basic trust distribution function. Using the same BP neural network to calculate the probability values between true and other various types of propositions, the matrix C is obtained:
C = ( M 11 M 1 n M n 1 M n n )
The subscripts in the above matrix’s rows represent a class of real propositions within the framework Θ , while the subscripts in the columns represent the status of each proposition generated by the BP neural network after classification and recognition. Each value { M 11 , M 22 , , M n n } is the probability that each proposition can be correctly classified by the network.
Therefore, the matrix C can reflect the neural network’s ability to classify each proposition, calculate the local ( M j ( j = 1 , 2 , , n ) ) and global ( γ ) trust of the neural network’s classifications, and reconstruct the basic trust allocation function m j ( j = 1 , 2 , , n ) . M j , γ , and m j have the following relationships:
M j = M j j / j = 1 n M j j
γ = j = 1 n M j j / n
{ p j = M j m j / j = 1 n M j m j m ( A 1 , A 2 , , A n , θ ) = ( γ p 1 , γ p 2 , , γ p j , 1 γ )
where m ( θ ) denotes the uncertainty of the neural network classification.
Taking m ( A 1 , A 2 , , A n , θ ) of e evidence sources, and generating a new function m ( A ) according to Dempster’s combination rule [20]. This can be written as below:
m ( A ) = A i = A 1 i e m i ( A i ) 1 A i = ϕ 1 i e m i ( A i )
The combined basic trust allocation function is generated according to Equation (17), and Equation (12) can be used to then incorporate the results of e evidence sources.

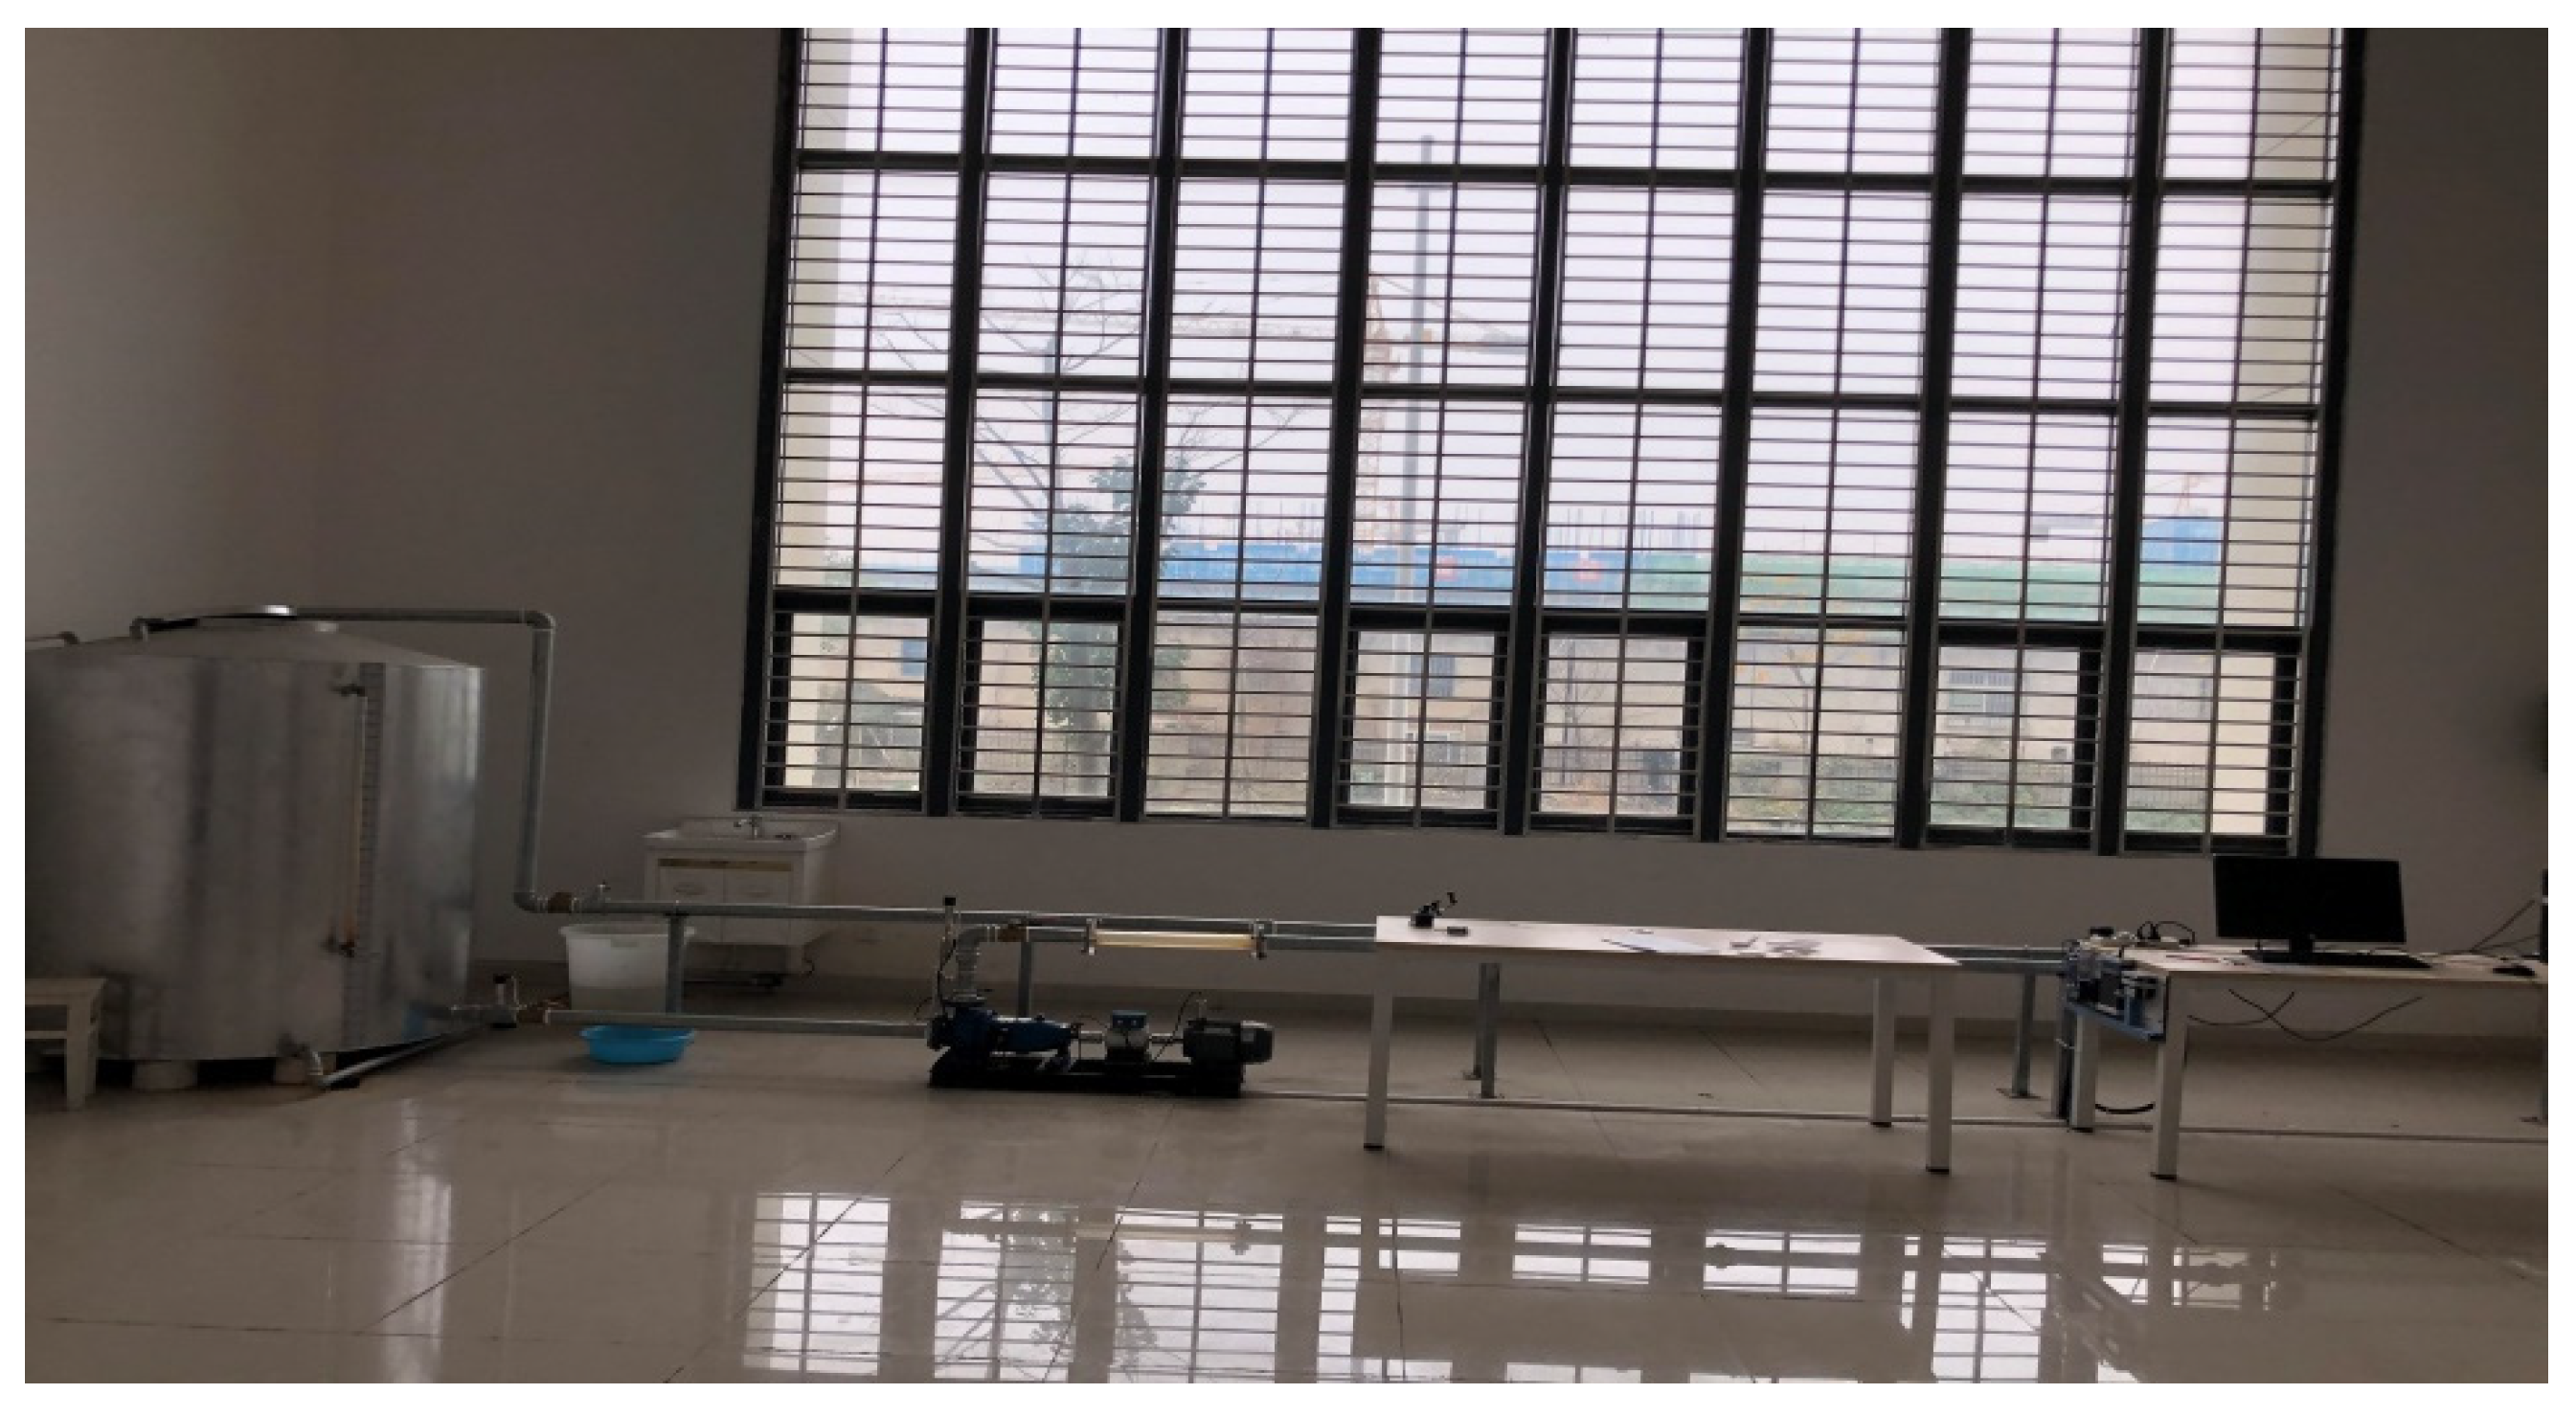
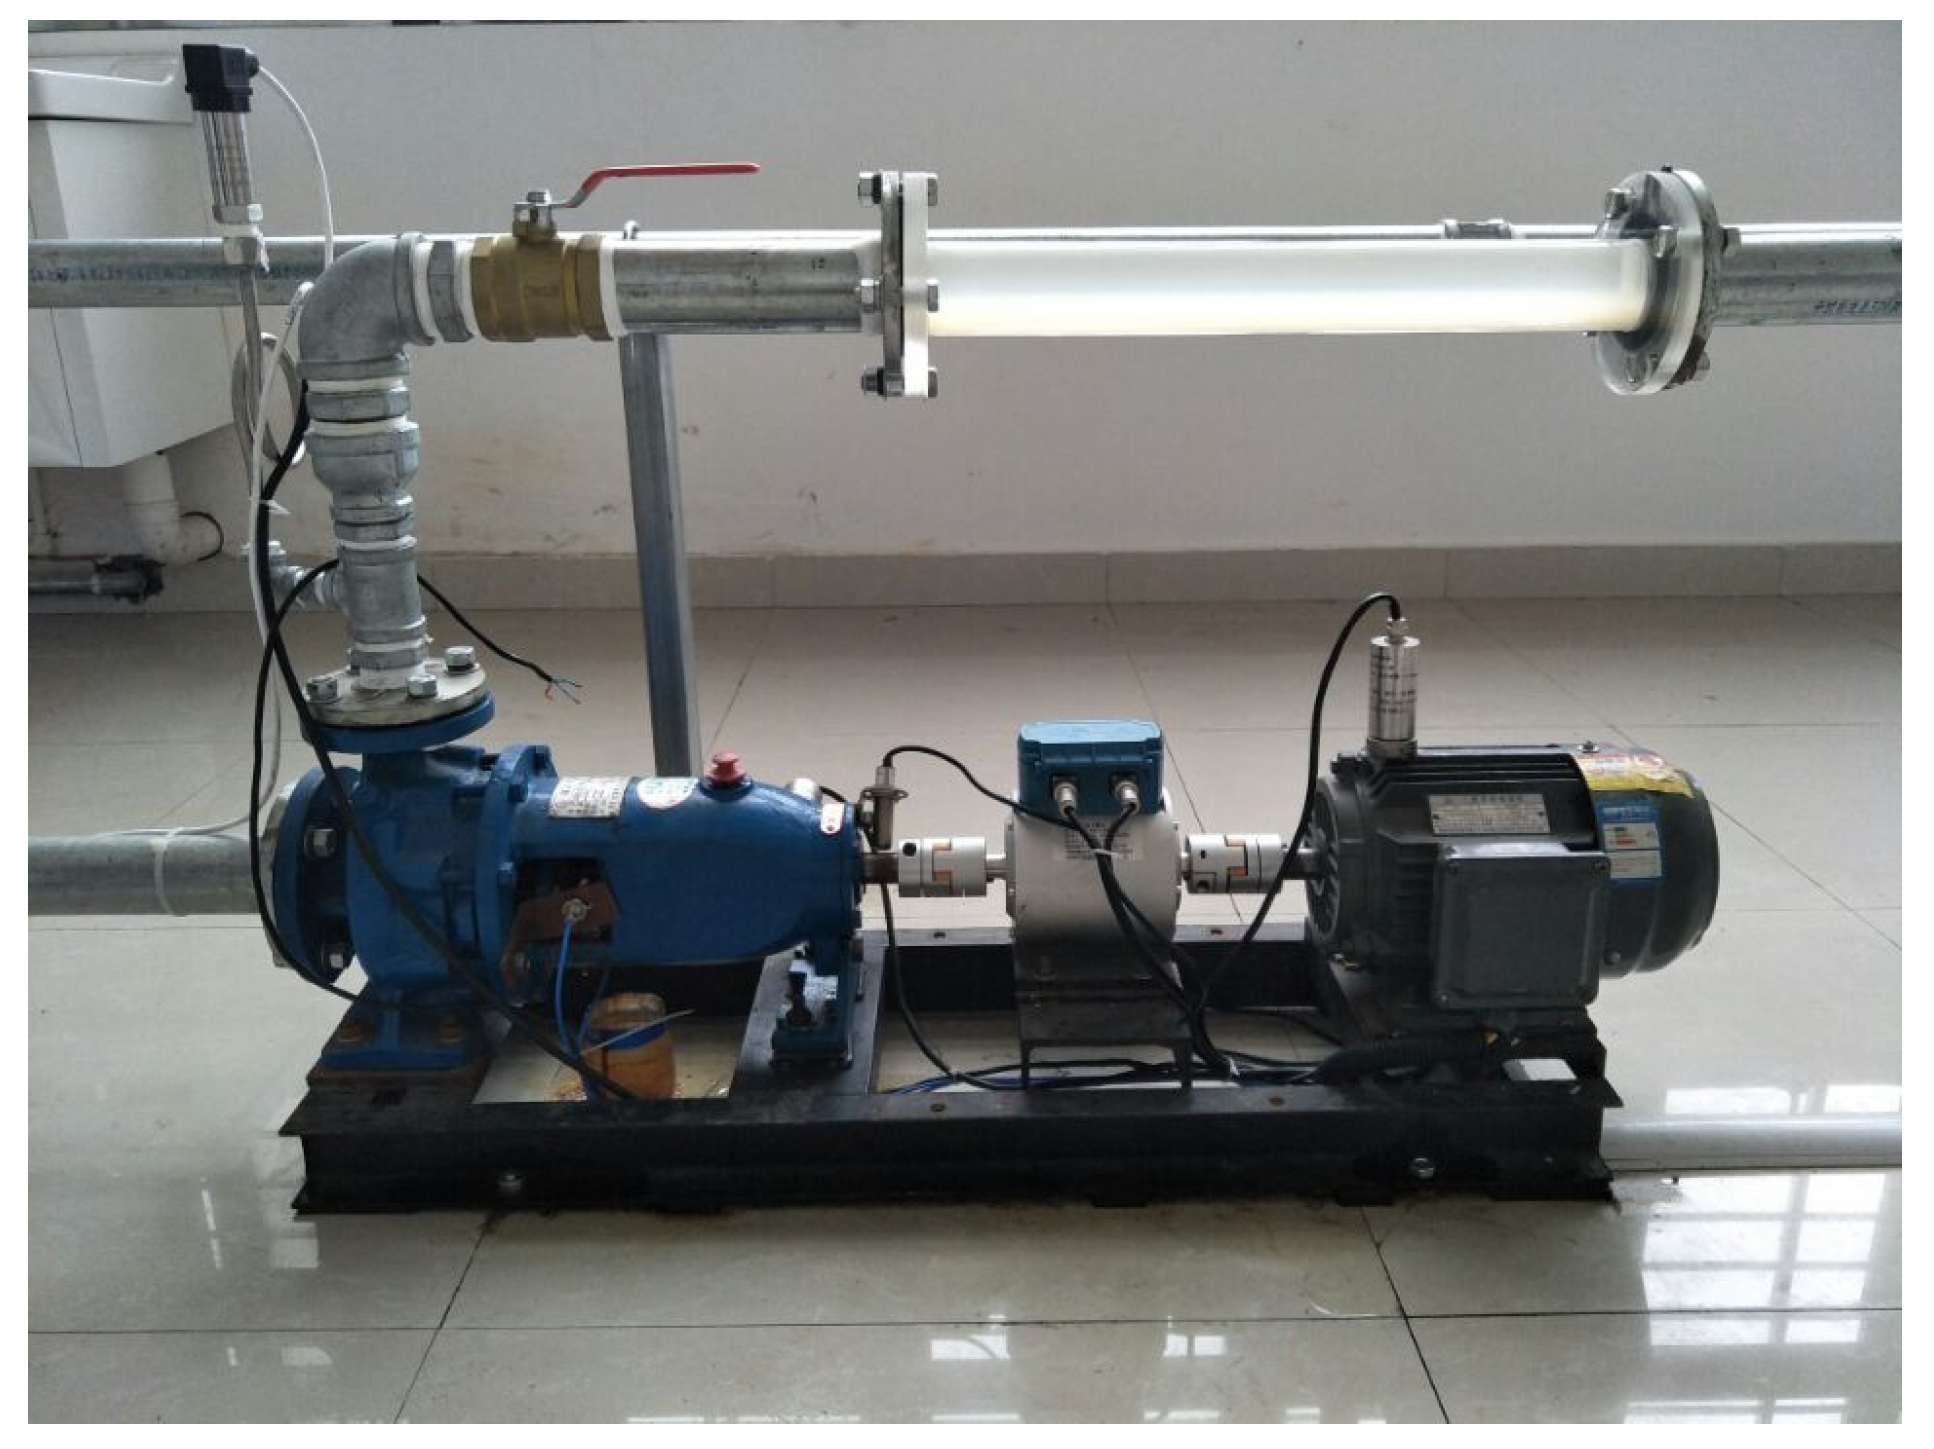
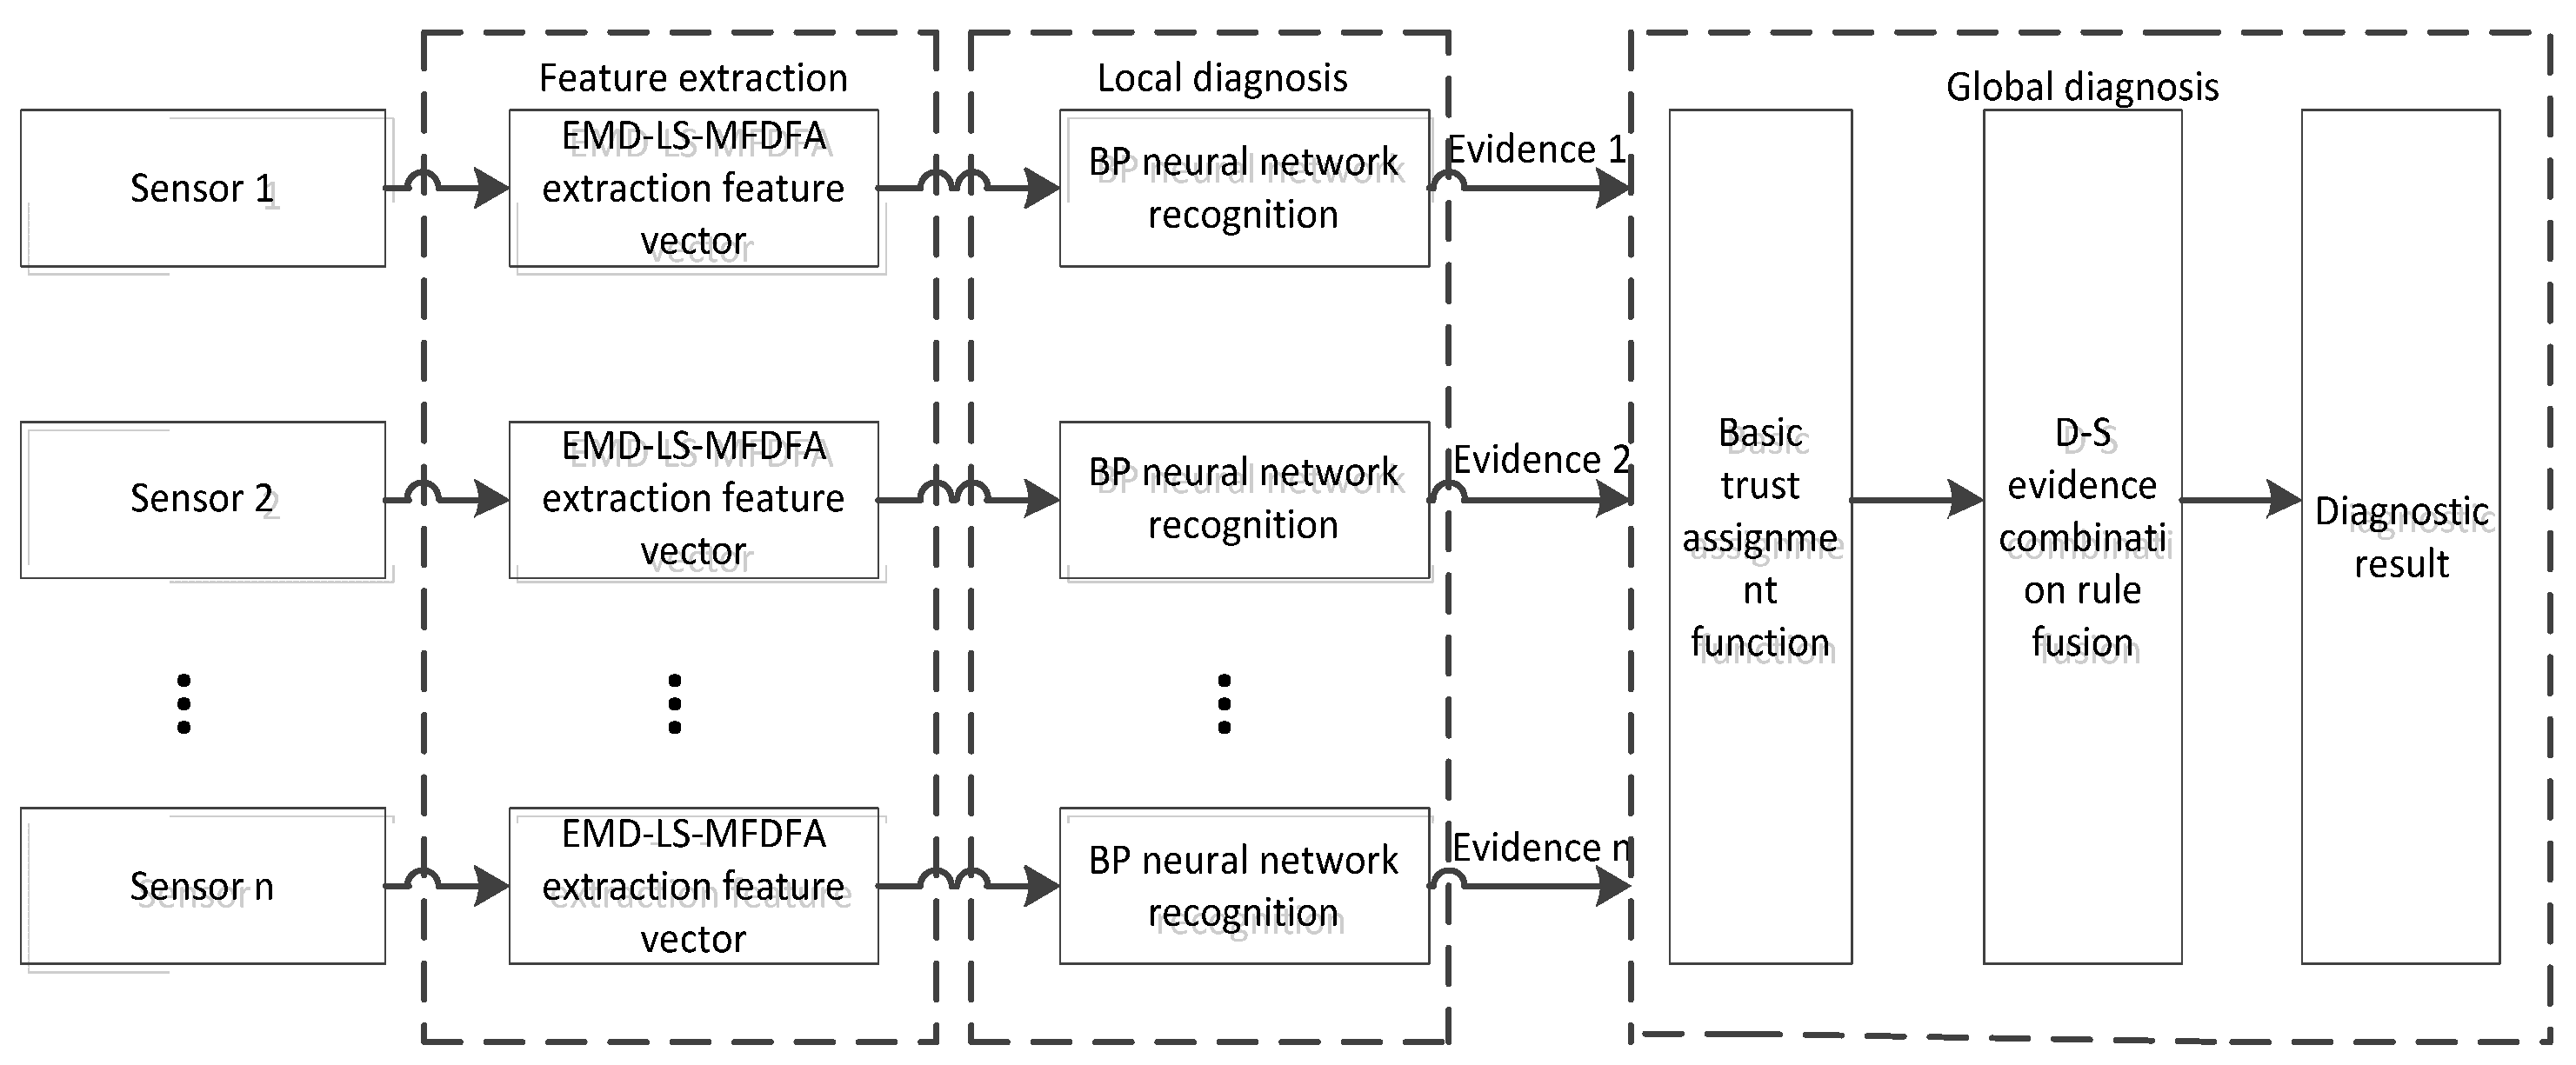
3. Test Device and Multi-Sensor Fault Diagnosis Model

The centrifugal pump test platform is mainly composed of hardware equipment and data acquisition subsystem, and its field test device is shown in Figure 1. The hardware equipment of the test device is mainly composed of a centrifugal circulating water pump with model IS50-32-125, a three-phase asynchronous motor of 1.5 KW, a vacuum pump and a water storage tank with a volume of 7 m3, so the device is connected to a three-phase asynchronous motor through the centrifugal pump torque meter, and then connected to the water storage tank through the pipeline to form a circulating water pump device. A vibration sensor was arranged vertically in the pump and motor casings, a torque sensor between the pump and motor themselves, and an oscillation sensor on the pump shaft +X, and the measurement point arrangement is shown in Figure 2. The rated speed of the centrifugal pump was 3000 r / min , with designed flow rate is 23.89 m 3 / h , hydraulic head at 11.2 m , and a rotational frequency of 50 Hz .
This test adjusts the inlet pressure by adjusting the vacuum pump pumping, simulates the cavitation phenomenon under different inlet pressures and through the loosening of the preload between the anchor bolt and the base, a total of four sets of operating conditions (i.e., normal operation, slight cavitation, severe cavitation, and loose bolts of the centrifugal pump) were designed. Moreover, four signals, for the centrifugal pump vibration, torque, motor vibration, and pump shaft +X oscillation, were obtained through the PXI-4472B dynamic signal acquisition instrument under these different operating conditions. These were then processed using the improved MFDFA to extract the multiple fractal spectrum feature parameters of each signal, i.e., Δ f , α 0 , Δ α , α min and α max . Subsequently, the feature vector [ Δ f , α 0 , Δ α , α min , α max ] was then combined with BP neural network, and the multi-sensor fault diagnosis was carried out based on the D-S evidence theory. The centrifugal pump fault diagnosis model with multi-sensor information is shown in Figure 3.

4. Test Analysis

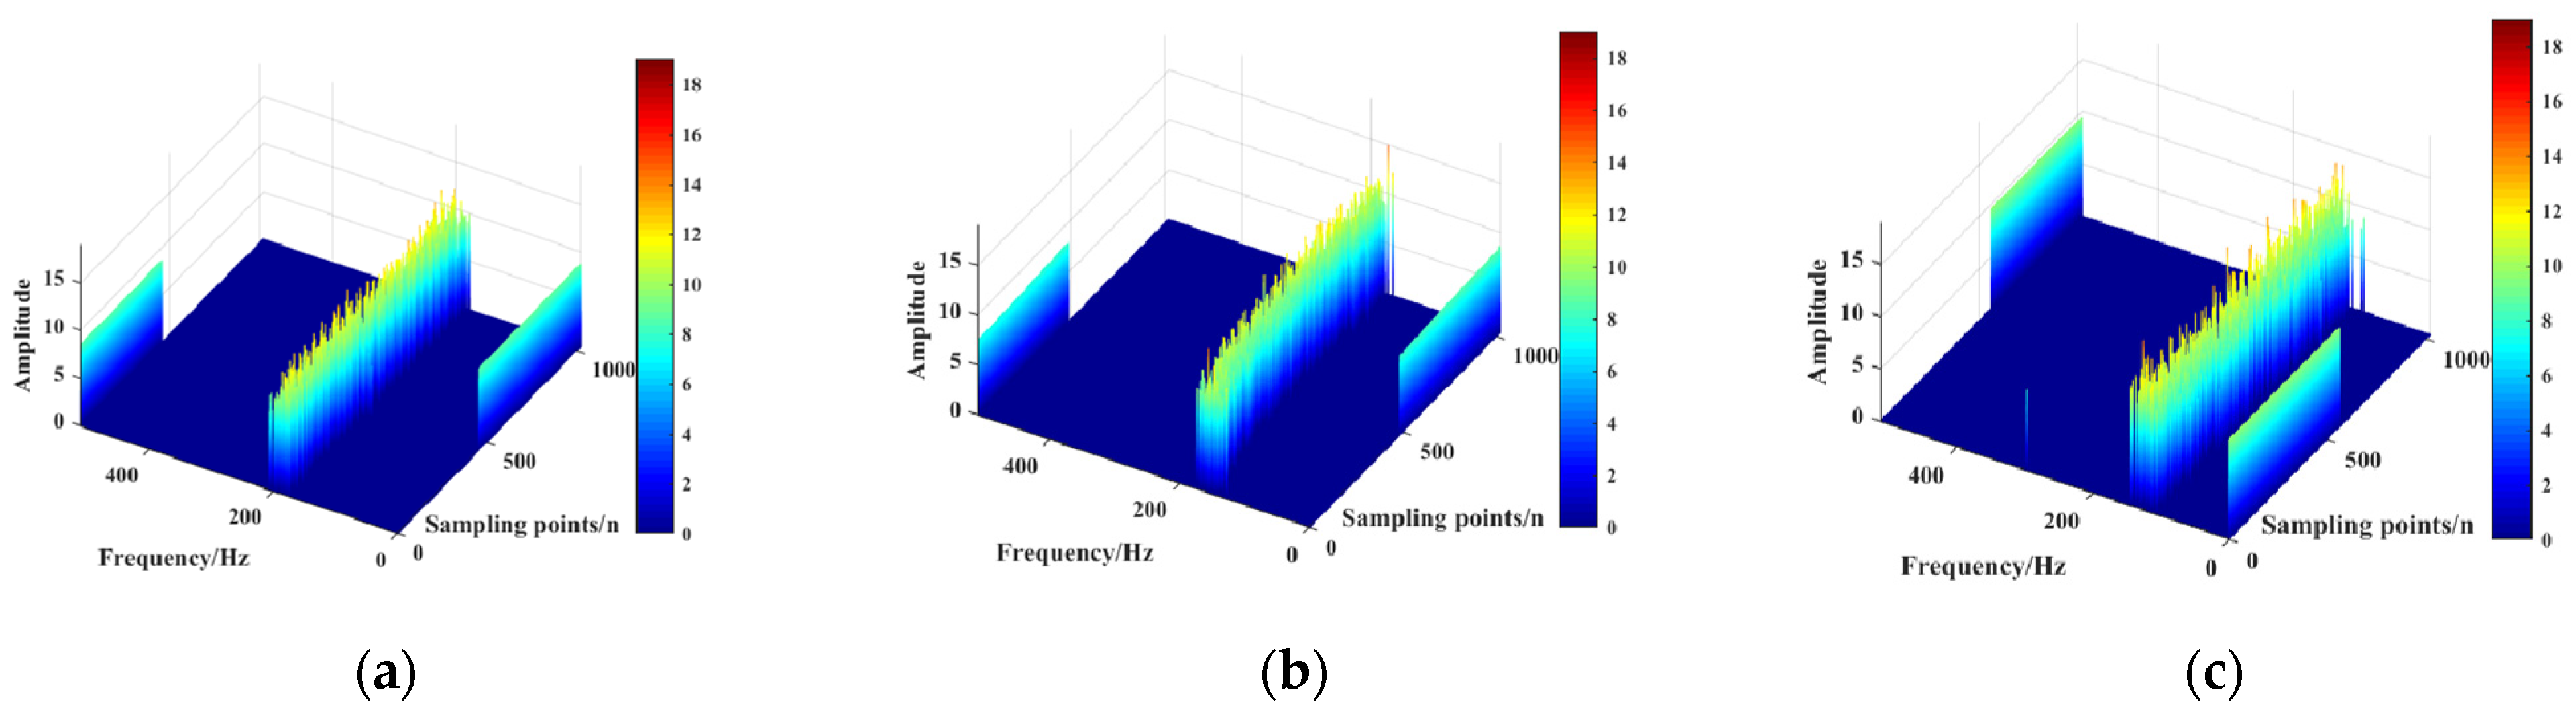
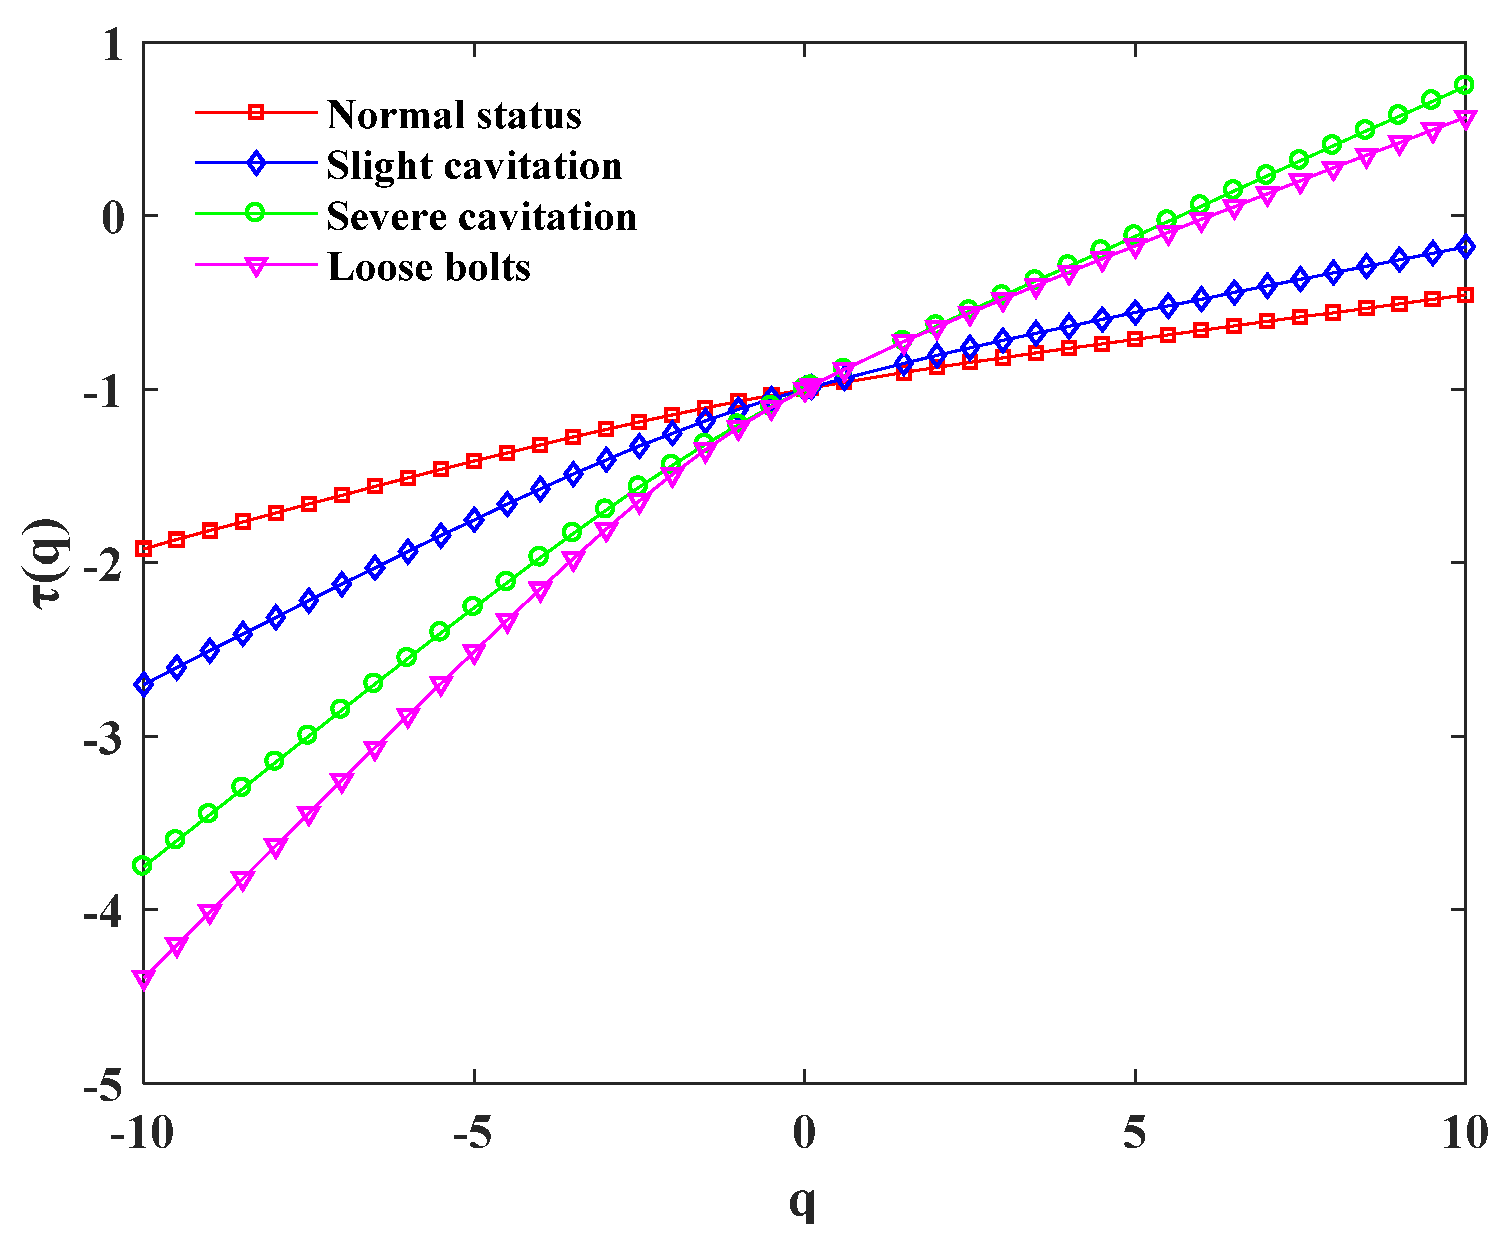
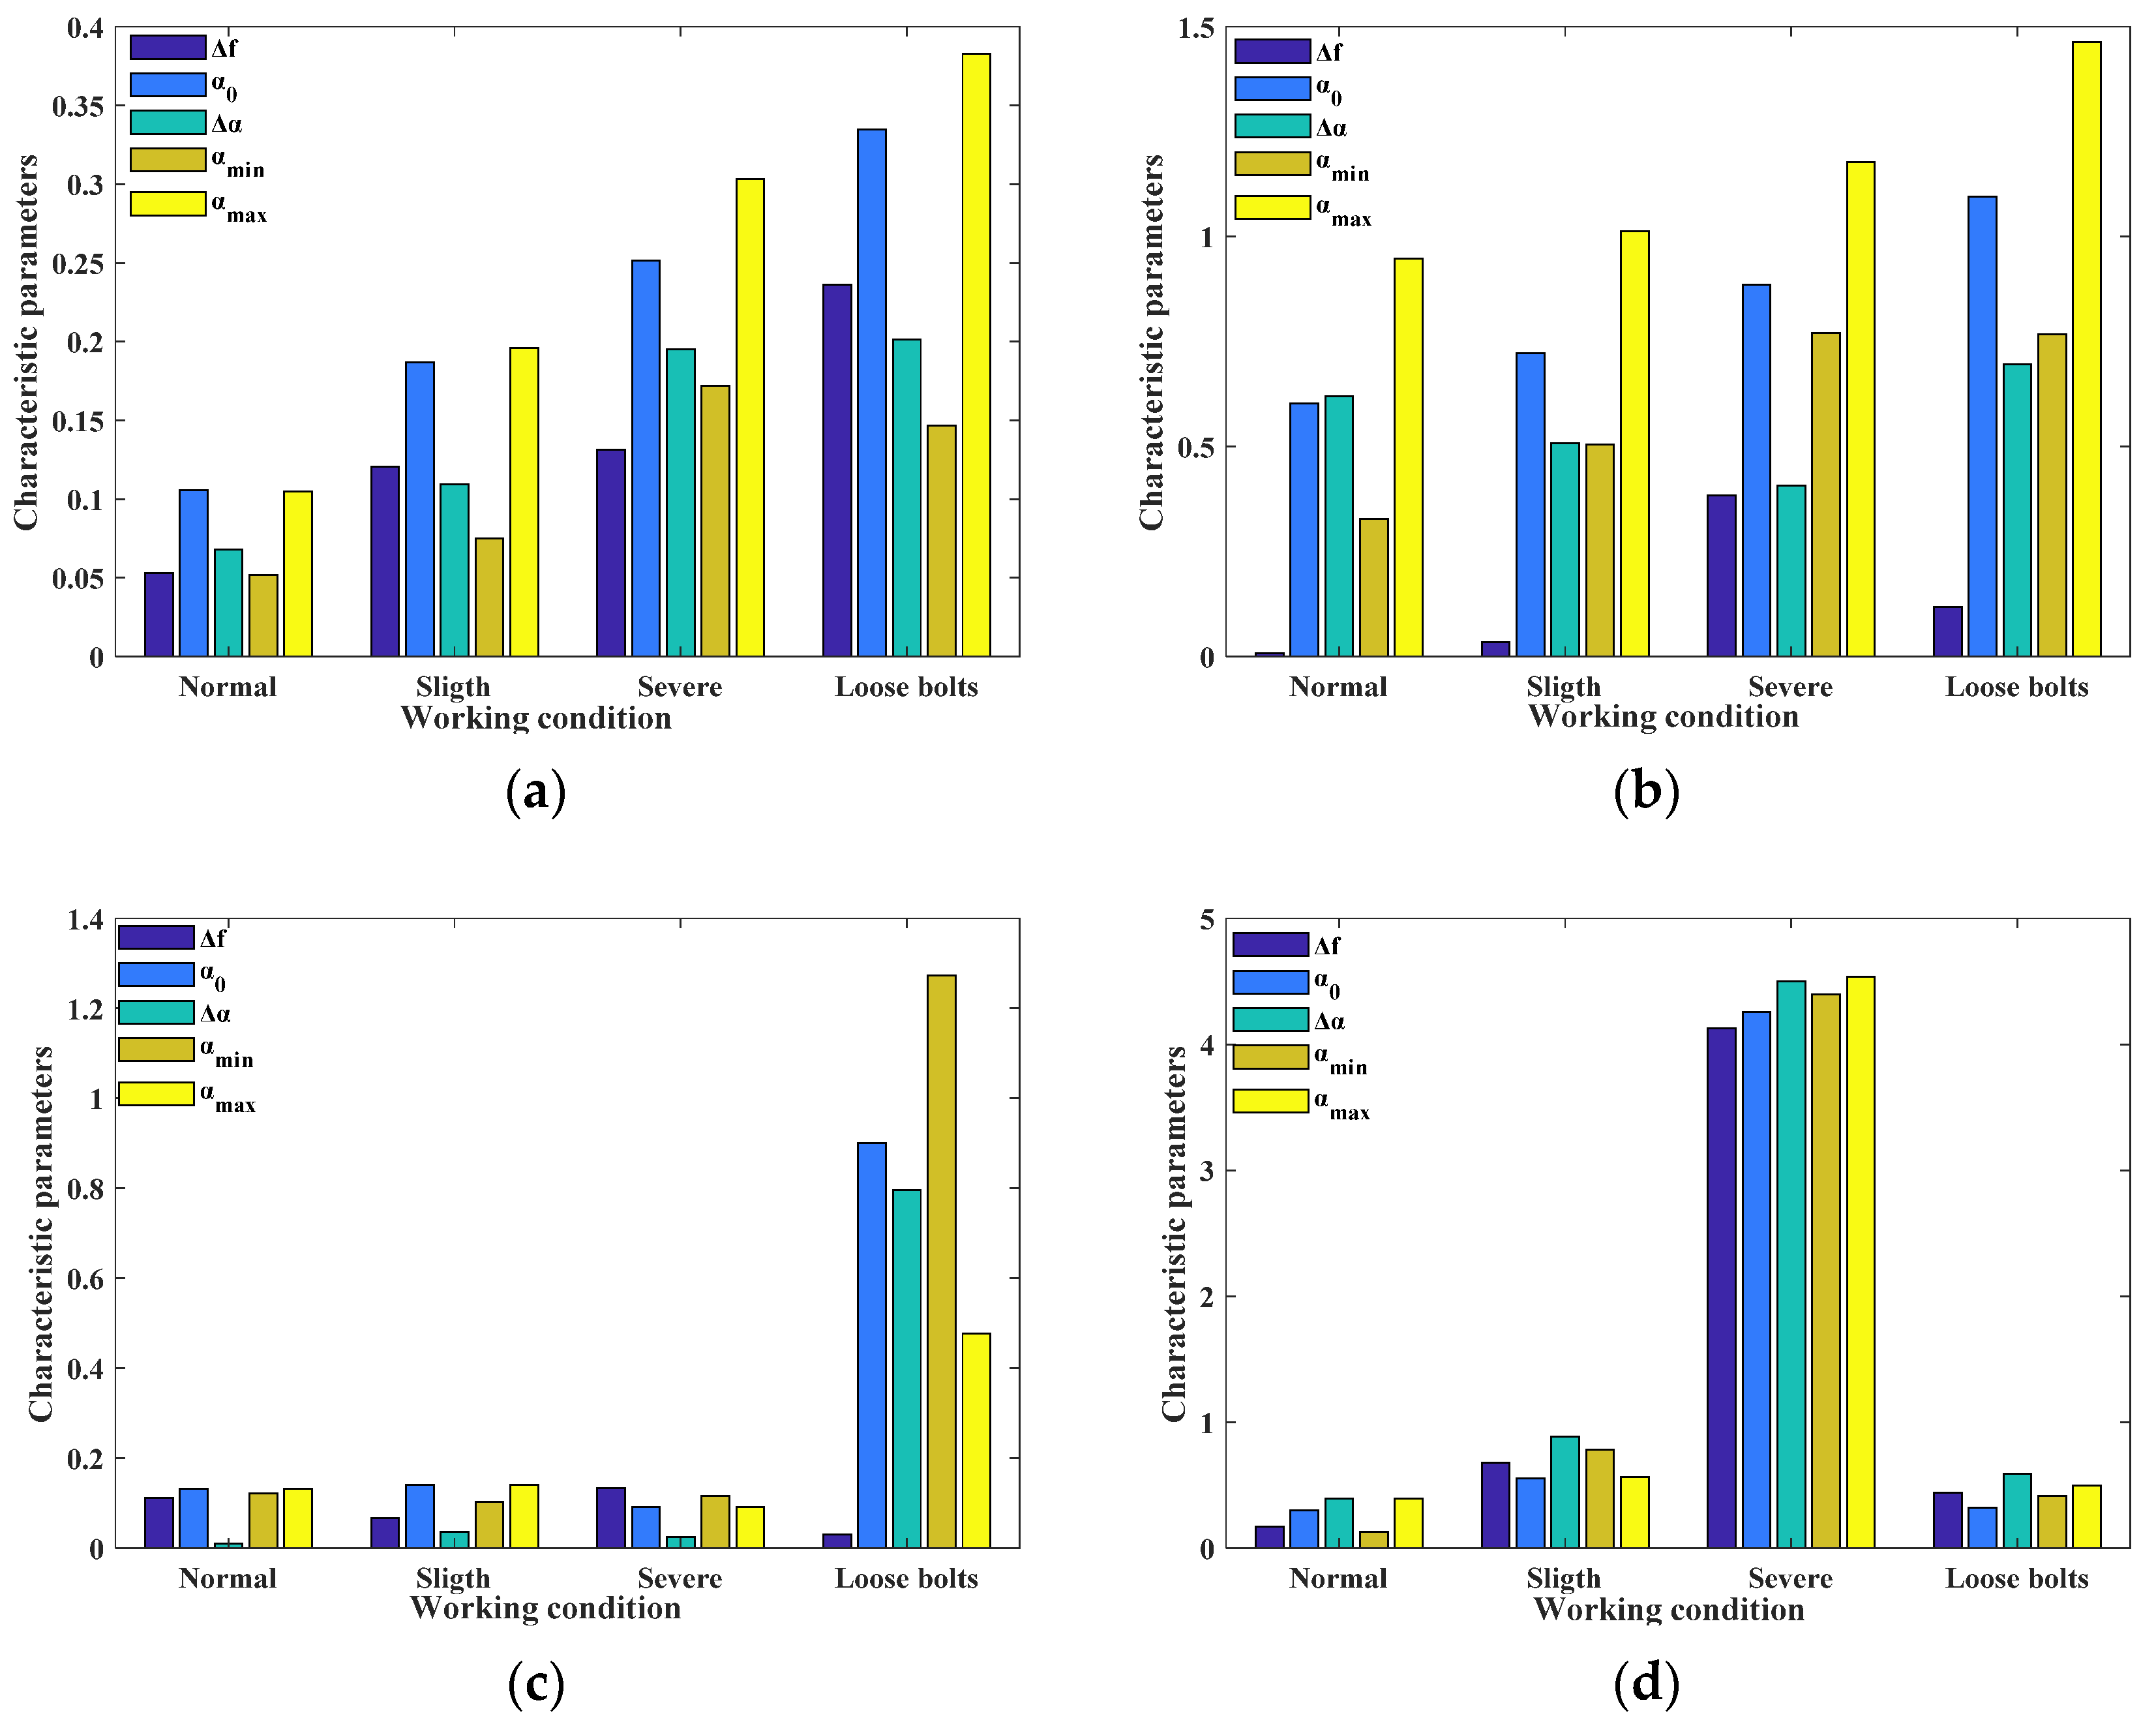
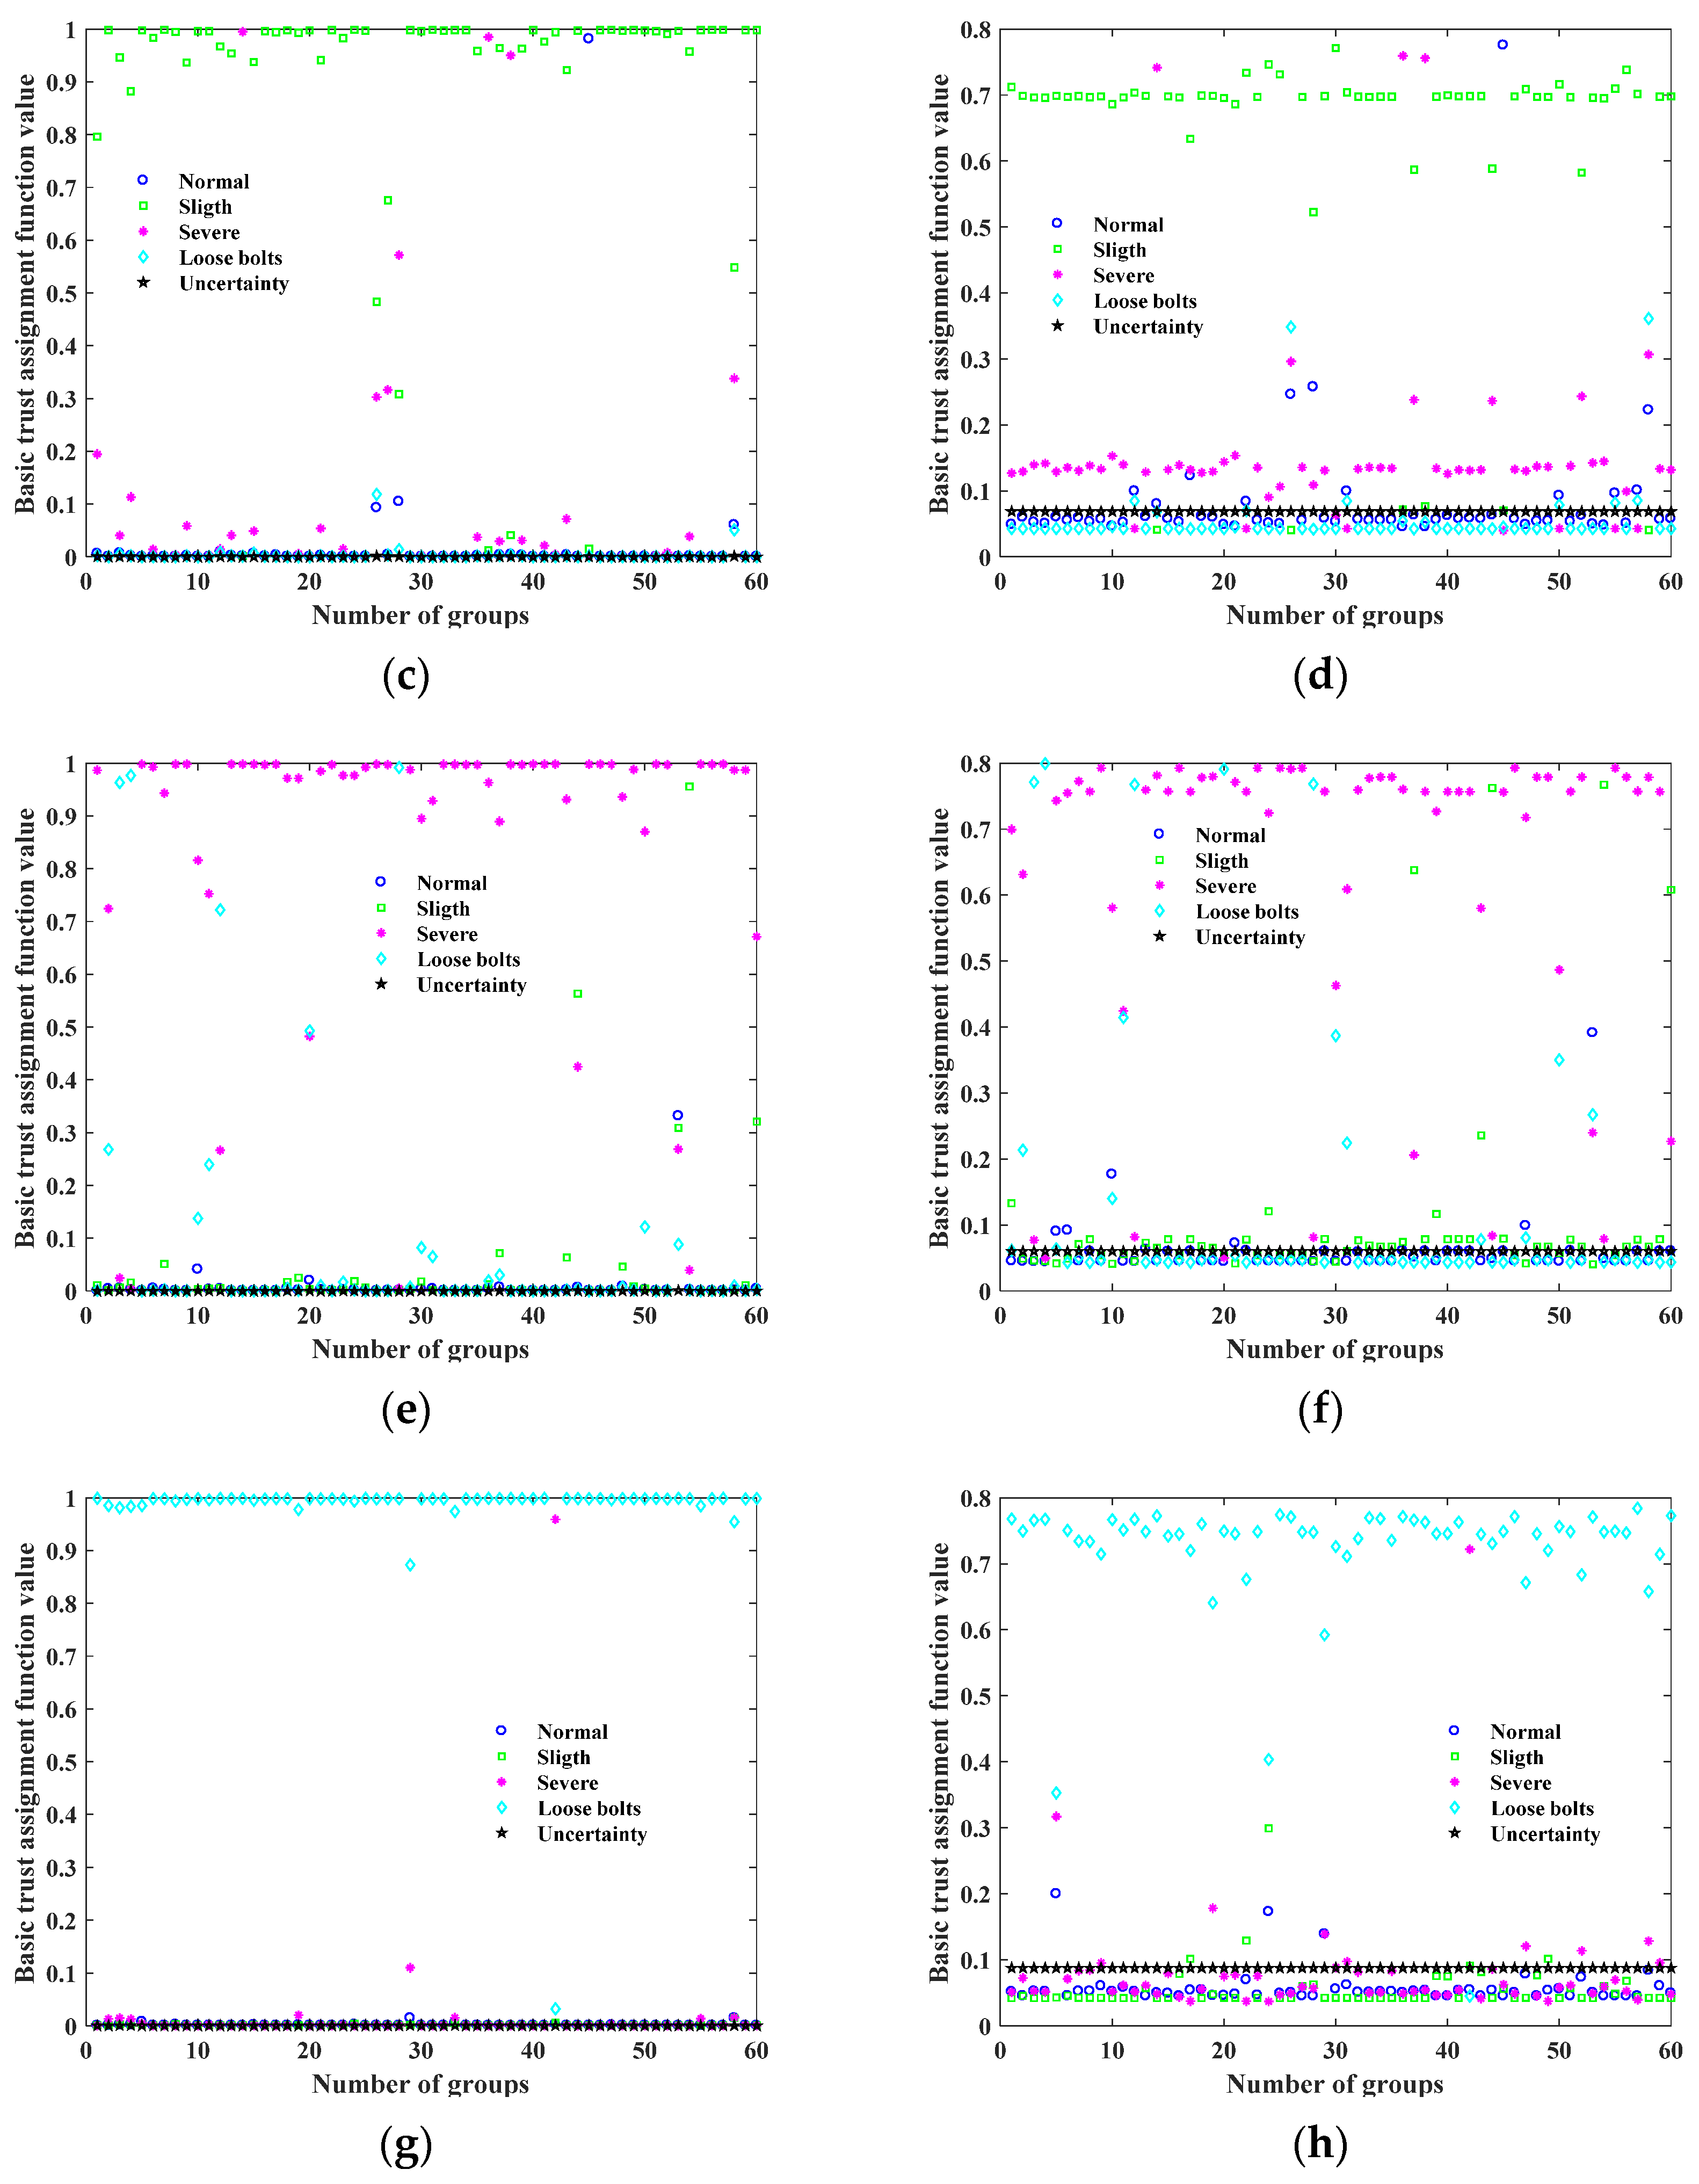
4.1. Analysis of Fault Characteristic Data

Through the above test, the signals of different working conditions of the centrifugal pump are obtained, and then the classical time–frequency analysis method HHT and the improved MFDFA are used to extract the features, and the characteristic values reflect the fault information, and the test data analysis process is shown in Figure 4.
Taking the vibration signal from the centrifugal pump as an example, the data of slight cavitation, severe cavitation, and loose foot bolts were selected and analyzed with respect to their time and frequency using HHT, as shown in Figure 5. Due to the different intrinsic dynamics and mechanisms, different fault signals have different frequency ranges and as well as energy distributions. From the time–frequency diagrams of Figure 5a,b, it can be seen that although slight cavitation and severe cavitation can be distinguished by signal frequency to some extent after HHT transformation and there is a partial difference in energy value, there is no particularly obvious overall difference in energy value between them. Moreover, from Figure 5c, it can be seen the signal frequency deviation by the loose foot bolt fault from that of severe cavitation is insignificant. Because of the phenomenon of modal mixing in HHT itself, which resulted in poor differentiation, it can be stated to be unconducive to the accurate diagnosis of faults.
To improve on this, the improved MFDFA method was applied to each condition of the centrifugal pump vibration, torque, motor vibration, and oscillation signals. The data length was set as 1024, the parameter s taken from 4~256 (steps of 8), and the value of q was selected from the range-10~10 (steps of 0.5). The resulting distributions of the multiple fractal spectral features Δ f , α 0 , Δ α , α min and α max extracted by the improved MFDFA method are shown in Figure 6.
Figure 6 shows the relationship between the quality index τ ( q ) of vibration signals of four kinds of centrifugal pumps and the order q of wave function. When the centrifugal pump was in a normal state, the nonlinear relationship between the quality index τ ( q ) and q was poor. While when the centrifugal pump was in a cavitation state or the anchor bolts became loose, there was an obvious turning point and a very distinct nonlinear relationship between the quality index τ ( q ) and q , highlighting the multifractal characteristics of each state of the centrifugal pump. The multifractal characteristics of all fault states were stronger than those of the normal state, while the multifractal characteristics under looseness of anchor bolts were stronger than those of the cavitation state. There were also prominent differences among multifractal characteristics under different cavitation degrees. Therefore, EMD-LS-MFDFA method can directly distinguish the running states of the centrifugal pump.
Figure 7a shows the distribution of the eigenvalues of the multifractal spectrum of the pump vibration signal in four different states. Therein, it can be observed the eigenparameter values of slight cavitation, severe cavitation, and loose foot bolt are larger than the normal state values. Moreover, except for the value of α min for severe cavitation which is larger than that of the loose bolt state, the eigenparameter values of the remaining loose bolt states are larger than the state values of different cavitation degrees, indicating the multifractal characteristics caused by loose foot bolt are the most obvious. A typical trend of the multifractal characteristics of cavitation increasing with increasing severity can be seen. Figure 7b shows the distribution of the eigenvalues of the torque signal, whose signal characteristics are similar to those of the pump vibration signal. The distribution of the eigenvalues of the motor vibration signal can be seen in Figure 7c, where the signal characteristics of the loose foot bolt are much larger than those of the other states. Figure 7d shown is the distribution of the eigenvalues of the oscillation signal, though contrary to the above, the signal characteristics of severe cavitation and slight cavitation are much larger than those of the other states. In addition, the multiple fractal spectra feature parameters Δ f , α 0 , Δ α , α min , and α max were sensitive to the signal to different degrees. In general, α 0 and α max present with an improvement in distinguishing the pump operation state. Figure 6 demonstrates the improved MFDFA method is able to extract the multifractal spectrum feature parameters Δ f , α 0 , Δ α , α min , and α max , which are very sensitive to the changes of the fault state, while avoiding any loss of the embedded fault information of each signal. Thus, the different operating conditions’ feature parameters for the four types of sensors can better constitute the feature vector for the BP neural network preliminary fault diagnosis, obtain the basic trust distribution function of the operating conditions, and apply the D-S evidence theory based on a multi-sensor fault diagnosis.
In summary, it can be seen that the classical feature extraction method is not ideal for distinguishing different fault signals of complex centrifugal pumps, and there will be discriminant errors. However, the improved MFDFA can integrate multiple characteristic parameters of the multi-fractal spectrum to distinguish different working conditions, and the results show that the effect is good.

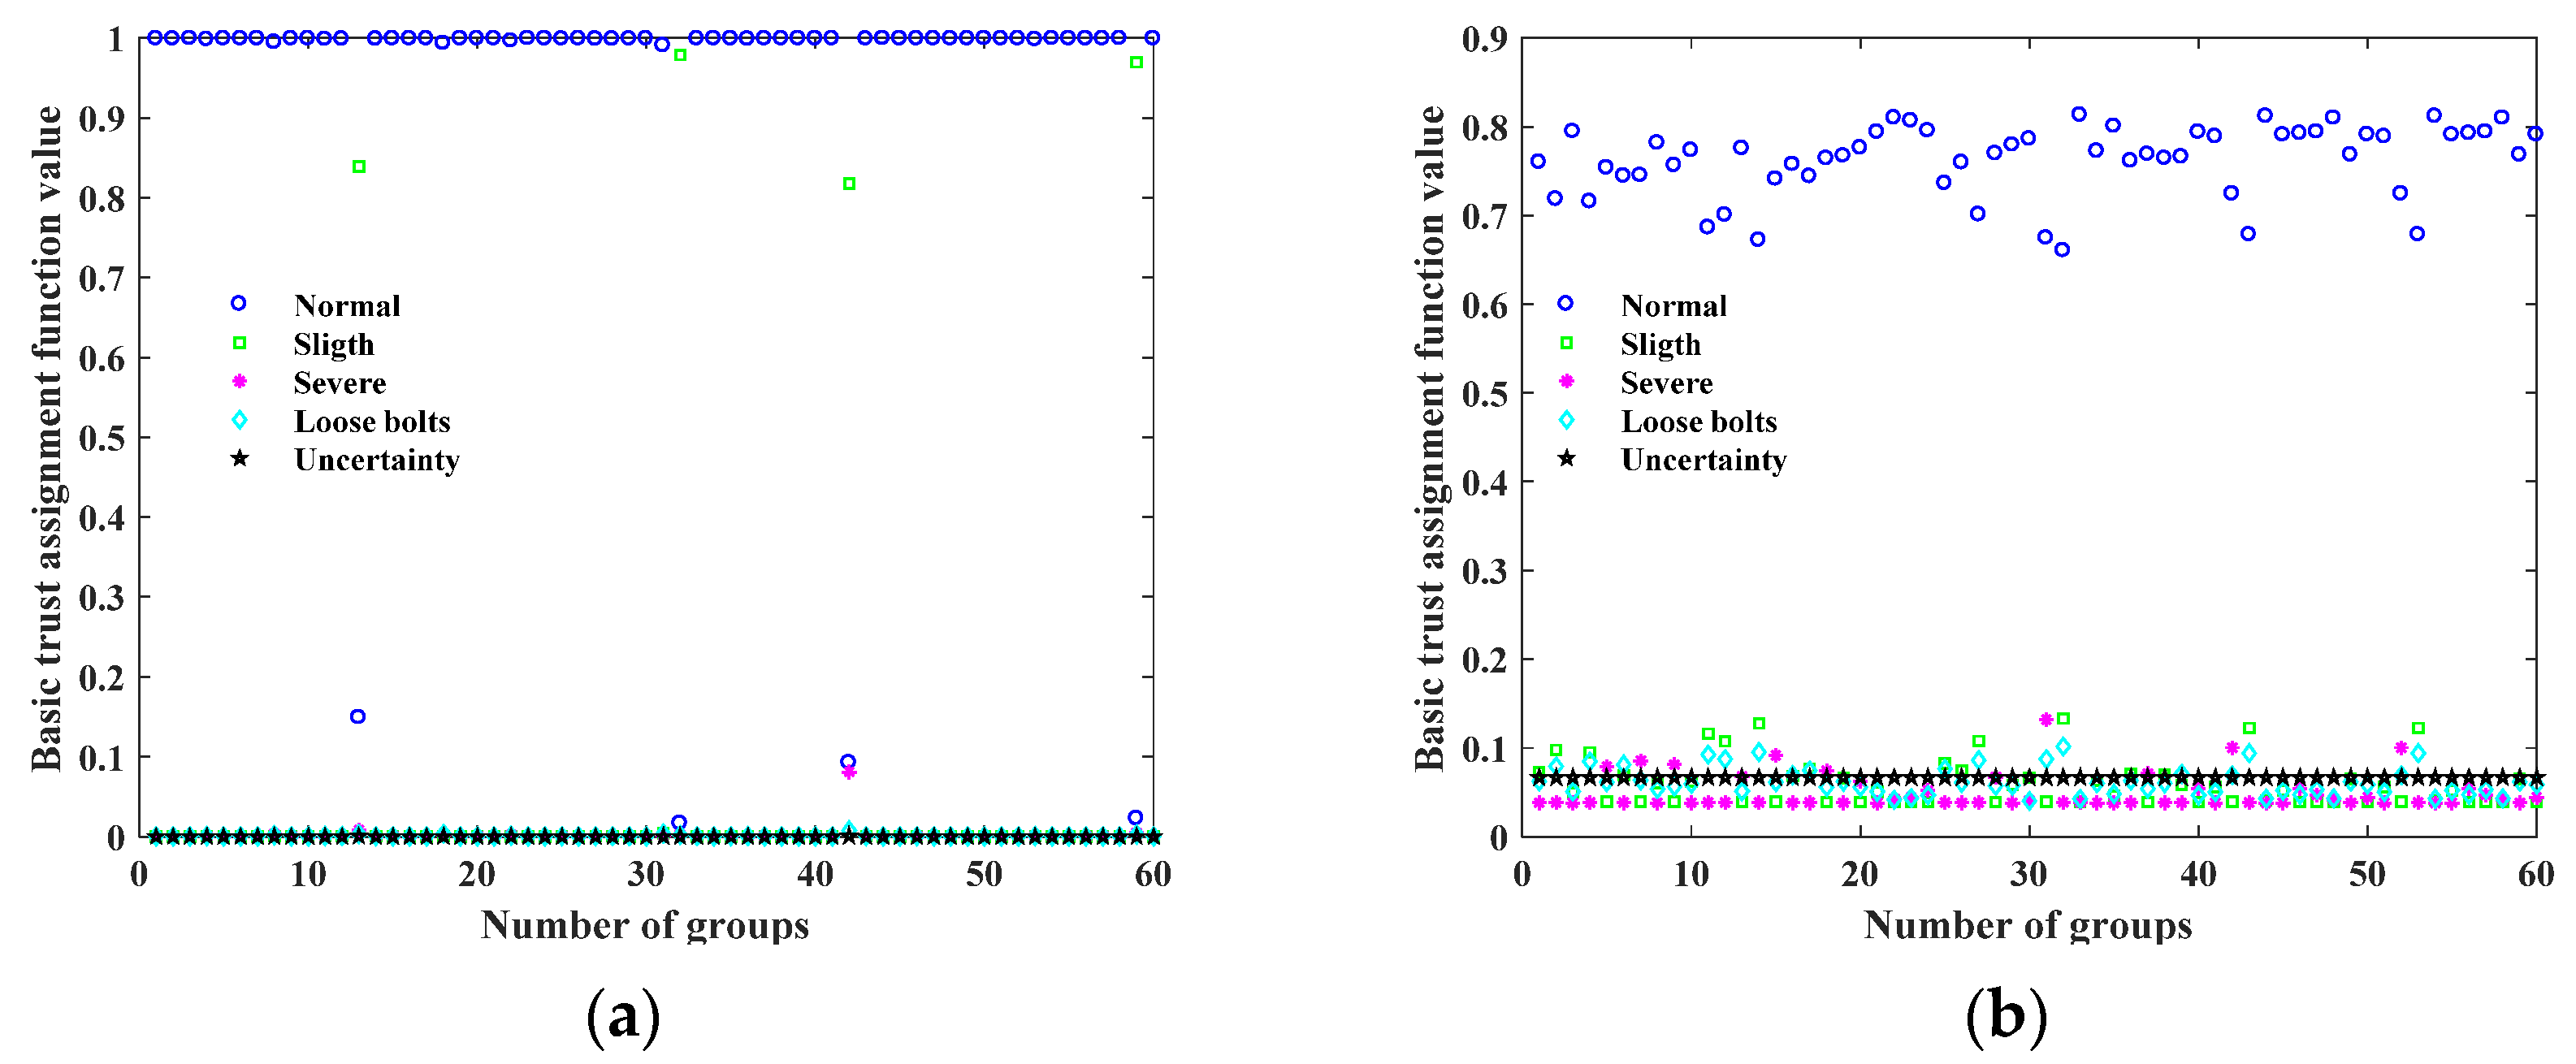
4.2. D-S Fusion Fault Diagnosis

As per the above discussion, in order to select a reasonable basic trust distribution function to realize the fault diagnosis of a multi-sensor centrifugal pump using D-S evidence theory, each group of sensor data is subjected to BP neural network fault identification. The data from the four sensors are collected and sorted into 120 groups for each of the four operating conditions. Subsequently, the Δ f , α 0 , Δ α , α min , and α max of each group of sensor signals are extracted by the improved MFDFA method to form a feature vector, of which 60 feature vectors are randomly selected as the training data for the neural network’s 3-layer structure, while the remaining 60 are used as diagnostic data. According to the number of feature parameters, the quantity of output conditions, and the empirical formula of the implicit layer [21], the number of nodes of the input, output, and implicit layers are taken as 5, 4, and 11, respectively. Thus, the network structure is constructed as 5 × 11 × 4, resulting in the diagnosis results of each group of sensors as shown in Table 1.
As can be seen from Table 1, of the normal and faulty data of each group of sensors to be diagnosed by BP neural network fault recognition, the centrifugal pump vibration sensor for the normal state reached a recognition rate of 100%, while that for the severe cavitation state was 84.17%, while the highest and lowest recognition rates of the torque, motor, and oscillation sensors corresponded to the working conditions, though they were more different in the case of the centrifugal pump vibration sensor. The lowest recognition rate of the oscillation sensor was 83.33% for slight cavitation, which can show the improved MFDFA method extracted feature parameters combined with the BP neural network can better classify the different working conditions of centrifugal pump.
To further improve the accuracy of fault diagnosis, multi-sensor fusion diagnosis supplemented with D-S evidence theory was carried out. Another 60 feature vectors were selected and input to the BP neural network. The neural network had already been trained to obtain the basic trust assignment function for each condition. Then, the network’s local and global trustworthiness were obtained according to Table 1 (as shown in Table 2), and the data in Table 2 were used as a priori information to reassign the basic trust assignment function for each condition according to Equation (16), and the Dempster combination rule [20] was adopted for the fusion, and the fault diagnosis results of fusion of multiple sensors and each single sensor as per D-S evidence theory were obtained according to the principle of maximum affiliation [22].
Displayed in Figure 8 is the basic trust distribution function for each working condition based on the D-S evidence fusion multi-sensor and single-sensor approach for the data to be diagnosed. Here, it can be seen that compared to diagnoses derived from single sensor data, the value of basic trust distribution function obtained by a multi-sensor system under different working conditions fluctuates more smoothly and has better stability. Moreover, when the real working conditions are determined according to the principle of maximum affiliation, the incidence of misjudgment is lower, with a correct rate of diagnosis reaching 92.5%. Compared to the diagnostic rates of single sensor systems derived from the centrifugal pump vibration, torque, motor vibration, and oscillation sensors, the accuracy increased by 3.33%, 2.08%, 2.50%, and 7.50%, respectively. Comprehensive analysis shows if multiple sensor data sets are fused with D-S diagnosis, the uncertainty of the single sensor method can be reduced and interactions between various sensors can be eliminated, which can effectively improve the reliability of centrifugal pump fault diagnosis.

5. Conclusions

In this paper, we proposed combining an improved MFDFA with BP neural network under multi-sensor data based on the D-S evidence theory and applying it to centrifugal pump fault diagnosis, and subsequently resulted in the following conclusions after investigation.
The improved MFDFA can effectively extract the multiple fractal spectrum feature parameters Δ f , α 0 , Δ α , α min , and α max and use them as the centrifugal pump fault feature vectors, overcoming the difficulties of the traditional signal analytical method to accurately extract the fault features, in which α 0 and α max have better differentiation for the pump operation status.
After applying this method, the correct diagnosis rate of centrifugal pump faults reached 92.5%, with improvements of 3.33%, 2.08%, 2.50%, and 7.50% over the rates demonstrated by single sensor systems focused on the pump vibration, torque, motor vibration, and oscillation sensors, respectively. The method effectively avoids the defects typical of single sensor systems containing single fault information and poor accuracy, thereby improving our ability to make reliable diagnoses. This validates the use of this novel method as a stable fault diagnosis model to provide a meaningful reference for fault diagnosis research.

Author Contributions

Conceptualization, X.L.; methodology, X.L.; software, Y.L. (Yuanxing Luo); validation, Y.L. (Yuanxing Luo), F.D. and Y.L. (Yan Li); formal analysis, Y.L. (Yuanxing Luo); investigation, Y.L. (Yan Li); resources, F.D.; data curation, Y.L. (Yuanxing Luo); writing—original draft preparation, X.L.; writing—review and editing, Y.L. (Yuanxing Luo); visualization, Y.L. (Yan Li); supervision, F.D.; project administration, X.L.; funding acquisition, X.L. All authors have read and agreed to the published version of the manuscript.

Funding

This paper is supported by the Jiangxi Education Department Science Foundation of China (GJJ170988) and the National Natural Science Foundation of China (No. 51969017).

Conflicts of Interest

The authors declare no conflict of interest.

References

  1. Jiang, W.; Xie, C.H.; Zhuang, M.Y.; Shou, Y.H.; Tang, Y.C. Sensor data fusion with Z-numbers and its application in fault diagnosis. Sensors 2016, 16, 1509. [Google Scholar] [CrossRef] [PubMed]
  2. Morsy, M.E.; Abouel-Seoud, A.; Rabeih, E.A. Gearbox damage diagnosis using wavelet transform technique. Acoust. Vib. 2011, 16, 173–179. [Google Scholar]
  3. Huang, M.; Liu, Z. Research on mechanical fault prediction method based on multifeature fusion of vibration sensing data. Sensors 2019, 20, 6. [Google Scholar] [CrossRef] [PubMed] [Green Version]
  4. Pei, J.F.; Yan, A.; Peng, J.; Zhao, J.X. Fault diagnosis of reciprocating pump based on acoustic signal Mfdfa and SFLA-SVM Algorithms. Mach. Des. Manuf. 2020, 26, 199–203, 207. [Google Scholar]
  5. Kantelhardt, J.W.; Zschiegner, S.A.; Koscielny, B.E.; Havlin, S.; Bunde, A.; Stanley, H.E. Multifractal detrended fluctuation analysis of nonstationary time series. Phys. A Stat. Mech. Appl. 2002, 316, 87–114. [Google Scholar] [CrossRef] [Green Version]
  6. Su, Z.Q.; Wang, F.L.; Xiao, H.; Yu, H.; Dong, S.J. A fault diagnosis model based on singular value manifold features optimized SVMs and multi-sensor information fusion. Meas. Sci. Technol. 2020, 31, 095002. [Google Scholar] [CrossRef]
  7. Li, Y.; Chen, J.; Ye, F.; Liu, D. The improvement of DS evidence theory and its application in IR/MMW target recognition. Sensors 2016, 16, 1903792. [Google Scholar] [CrossRef] [Green Version]
  8. Yu, K.; Tan, J.W.; Li, S. Rolling bearing fault diagnosis research based on multi-sensor information fusion. Instrum. Tech. Sens. 2016, 45, 97–102. [Google Scholar]
  9. Mcdonald, G.L.; Zhao, Q.; Zuo, M.J. Maximum correlated Kurtosis deconvolution and application on gear tooth chip fault detection. Mech. Syst. Signal Process. 2012, 33, 237–255. [Google Scholar] [CrossRef]
  10. Ye, F.; Chen, J.; Yi, B.L. Improvement of DS evidence theory for multi-sensor conflicting information. Symmetry 2017, 9, 69. [Google Scholar] [CrossRef] [Green Version]
  11. Kracik, J.; Lavicka, H. Fluctuation analysis of high frequency electric power load in the Czech Republic. Phys. A Stat. Mech. Appl. 2016, 462, 951–961. [Google Scholar] [CrossRef] [Green Version]
  12. Xi, C.P.; Zhang, S.N. Comparison analysis of fractal spectrum algorithm of multifractal falling trend analysis method and moving average method. Acta Phys. Sin. 2015, 64, 335–348. [Google Scholar]
  13. Martínez, J.L.M.; Segovia, D.I.; Rodriguez, I.Q.; Horta, R.F.A.; Sosa, G.G. A modified multifractal detrended fluctuation analysis (MFDFA) approach for multifractal analysis of precipitation. Phys. A Stat. Mech. Appl. 2021, 565, 125611. [Google Scholar] [CrossRef]
  14. Chatterjee, S.; Pratiher, S.; Bose, R. Multifractal detrended fluctuation analysis based novel feature extraction technique for automated detection of focal and non-focal electro-encephalogram signals. IET Sci. Meas. Technol. 2017, 11, 1014–1021. [Google Scholar] [CrossRef]
  15. Huang, D.Z.; Gong, R.X.; Gong, S. Prediction of wind power by chaos and BP artificial neural networks approach based on genetic algorithm. Electr. Eng. Technol. 2015, 10, 41–46. [Google Scholar] [CrossRef] [Green Version]
  16. Dong, Z.; Zhang, X.; Modified, D.-S. Evidential theory in hydraulic system fault diagnosis. J. Taiyuan Univ. Sci. Technol. 2011, 11, 98–102. [Google Scholar]
  17. Jiang, Z.; Wu, Y.; Li, J. Application of EMD and 1.5-dimensional spectrum in fault feature extraction of rolling bearing. J. Eng. 2019, 2019, 8843–8847. [Google Scholar] [CrossRef]
  18. Yang, D.; Zhang, C.; Liu, Y. Multifractal characteristic analysis of near-fault earthquake ground motions. Soil Dyn. Earthq. Eng. 2015, 72, 12–23. [Google Scholar] [CrossRef]
  19. Long, Y.; Xie, Q.M.; Zhong, M.S.; Lu, L.; Li, X.-H. Research on trend removing methods in preprocessing analysis of blasting vibration monitoring signals. Eng. Mech. 2012, 29, 63–68. [Google Scholar]
  20. Tang, Y.; Zhou, D.; He, Z. An improved belief entropy based uncertainty management approach for sensor data fusion. J. Distrib. Sens. Netw. 2017, 13. [Google Scholar] [CrossRef]
  21. Sun, W.; Chen, J.; Li, J. Decision tree and PCA-based fault diagnosis of rotating machinery. Mech. Syst. Signal Process. 2007, 21, 1300–1317. [Google Scholar] [CrossRef]
  22. Ouyang, N.; Liu, Z.; Kang, H.Y. A method of distributed decision fusion based on SVM and D-S evidence theory. In Proceedings of the International Conference on Visual Information Engineering, Xi’an, China, 29 July–1 August 2008. [Google Scholar]
Figure 1. Laboratory centrifugal circulating water pump device.
Applsci 12 04976 g001
Figure 2. Centrifugal pump test device.
Applsci 12 04976 g002
Figure 3. Fault diagnosis model.
Applsci 12 04976 g003
Figure 4. Analysis flow chart.
Applsci 12 04976 g004
Figure 5. HHT time–frequency diagram of centrifugal pump vibration signal under (a) slight cavitation, (b)severe cavitation, and (c) loose foot.
Applsci 12 04976 g005
Figure 6. Quality index of vibration signal of centrifugal pump.
Applsci 12 04976 g006
Figure 7. Characteristic parameters of 4 centrifugal pump fault state under (a) pump vibration signal, (b) torque signal, (c) motor vibration signal, (d) swing signal.
Applsci 12 04976 g007
Figure 8. Analysis of recognition accuracy under (a) normal state by D-S evidence, (b) normal state by pump vibration signal, (c) slight cavitation by D-S evidence, (d) slight cavitation by torque signal, (e) severe cavitation by D-S evidence, (f) severe cavitation by motor vibration signal, (g) loose foot bolts by D-S evidence, and (h) loose foot bolts by D-S swing signal.
Applsci 12 04976 g008aApplsci 12 04976 g008b
Table 1. Preliminary diagnosis results of BP neural network.
SignalNormal StateSlight CavitationSevere CavitationLoose Foot Bolts
Pump vibration1.00000.00000.00000.0000
0.00000.93330.06670.0000
0.00000.09170.84170.0667
0.00000.00000.04170.9583
Torque0.95830.03330.00000.0083
0.00830.93330.04170.0167
0.00000.06670.87500.0583
0.00000.00830.03330.9583
Motor vibration0.95000.04170.00830.0000
0.00830.94170.05000.0000
0.00830.05000.88330.0583
0.00000.00000.01670.9833
Swing0.95830.02500.01670.0000
0.00830.83330.15830.0000
0.00000.04170.86670.0917
0.00000.00000.00830.9917
Table 2. Classification credibility of BP neural network.
SignalLocal CredibilityGlobal Credibility
Normal StateSlight CavitationSevere CavitationLoose Foot Bolts
Pump vibration1.00000.99140.98280.99140.9333
Torque0.91060.89600.91130.92590.9313
Motor vibration0.88600.92110.92170.82540.9396
Swing0.93500.92000.94400.91540.9125
Publisher’s Note: MDPI stays neutral with regard to jurisdictional claims in published maps and institutional affiliations.

