
Identification of Anemia and Its Severity Level in a Peripheral Blood Smear Using 3-Tier Deep Neural Network

 , ,
, ,
Abstract
1. Introduction
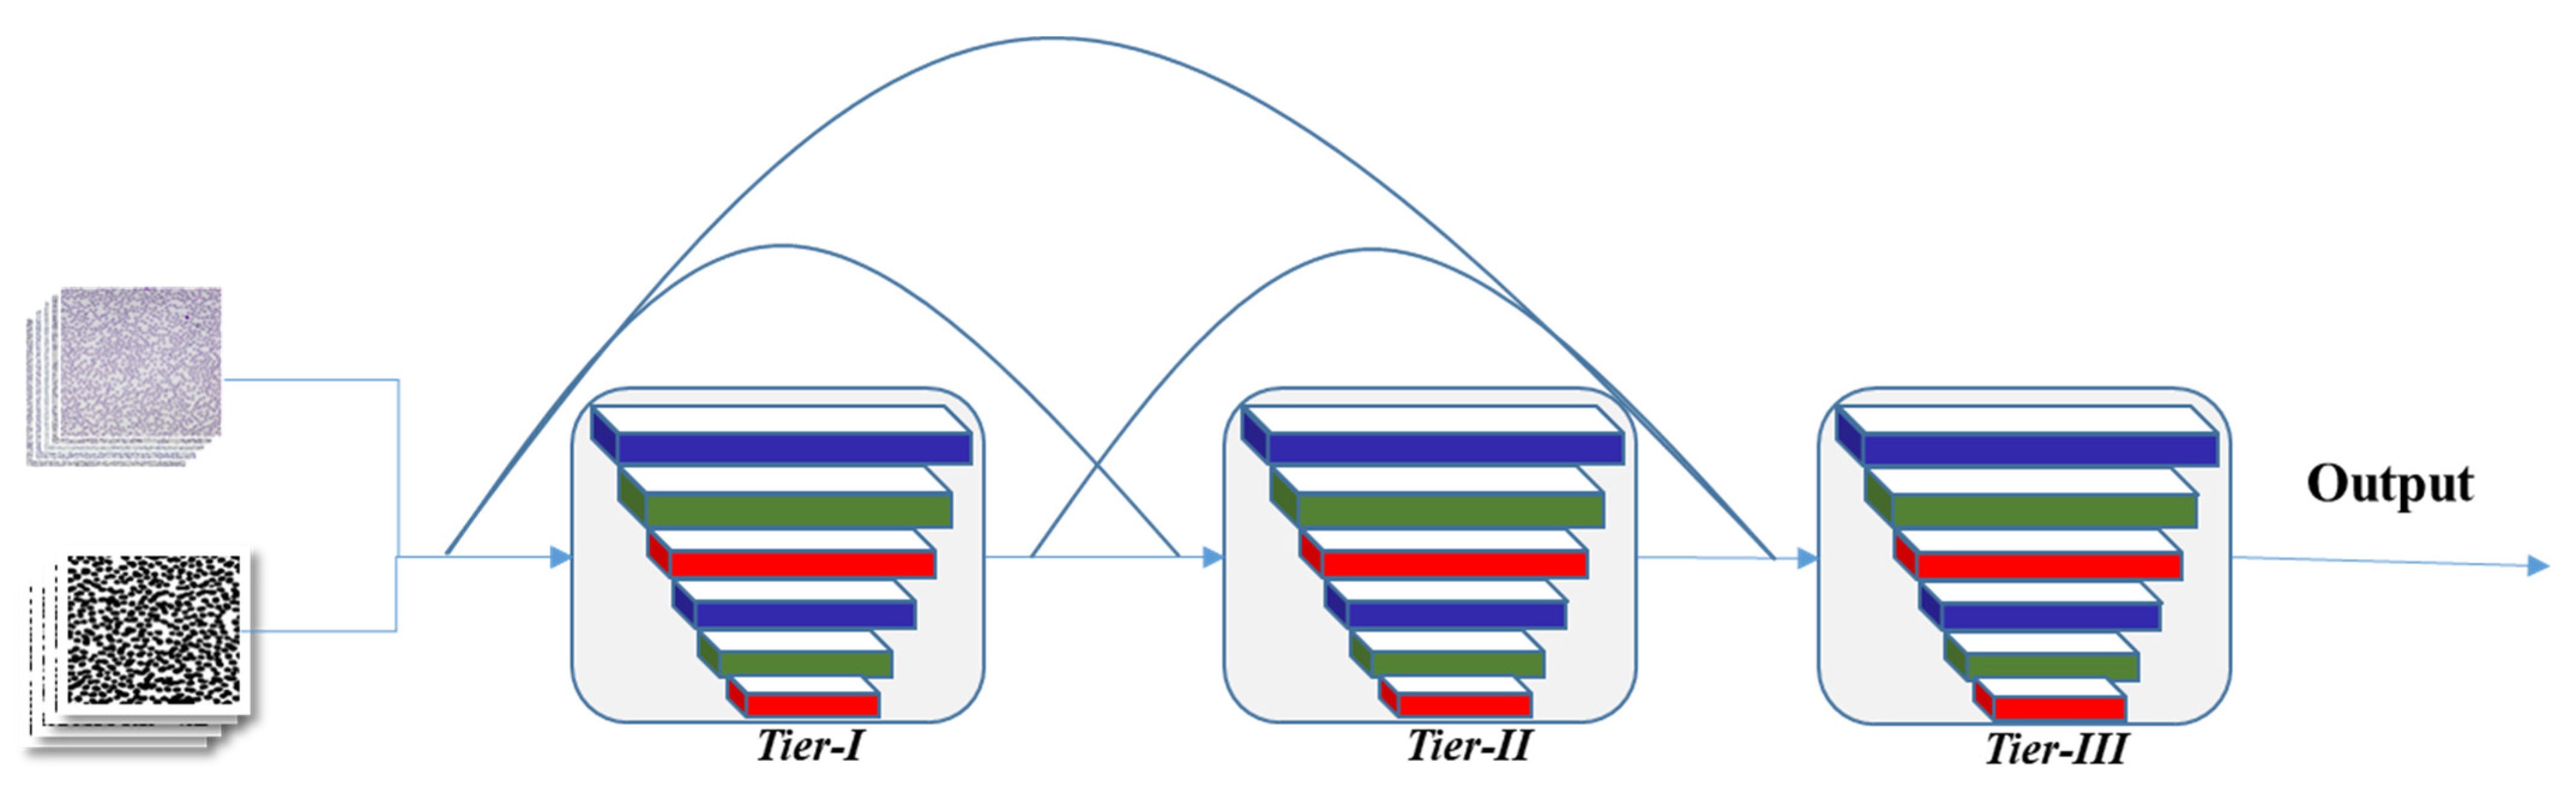
- A CNN-based three-Tier deep convolutional fused neural network (3-TierDCFNet) architecture that performs two-stage classification of RBC images.
- Module-I classifies the input image into two classes, i.e., healthy and anemic images. Module-II detects anemic image severity levels and classifies them into mild or chronic.
- Module-II of 3-TierDCFNet also provides accurate detection of overlapped structures of anemic RBCs.
- We have developed a standalone RBC microscopic image dataset along with manually segmented ground truth images of both healthy and Anemic-RBCs under the supervision of a hematologist/pathologist for cross-match analysis.
2. Related Work
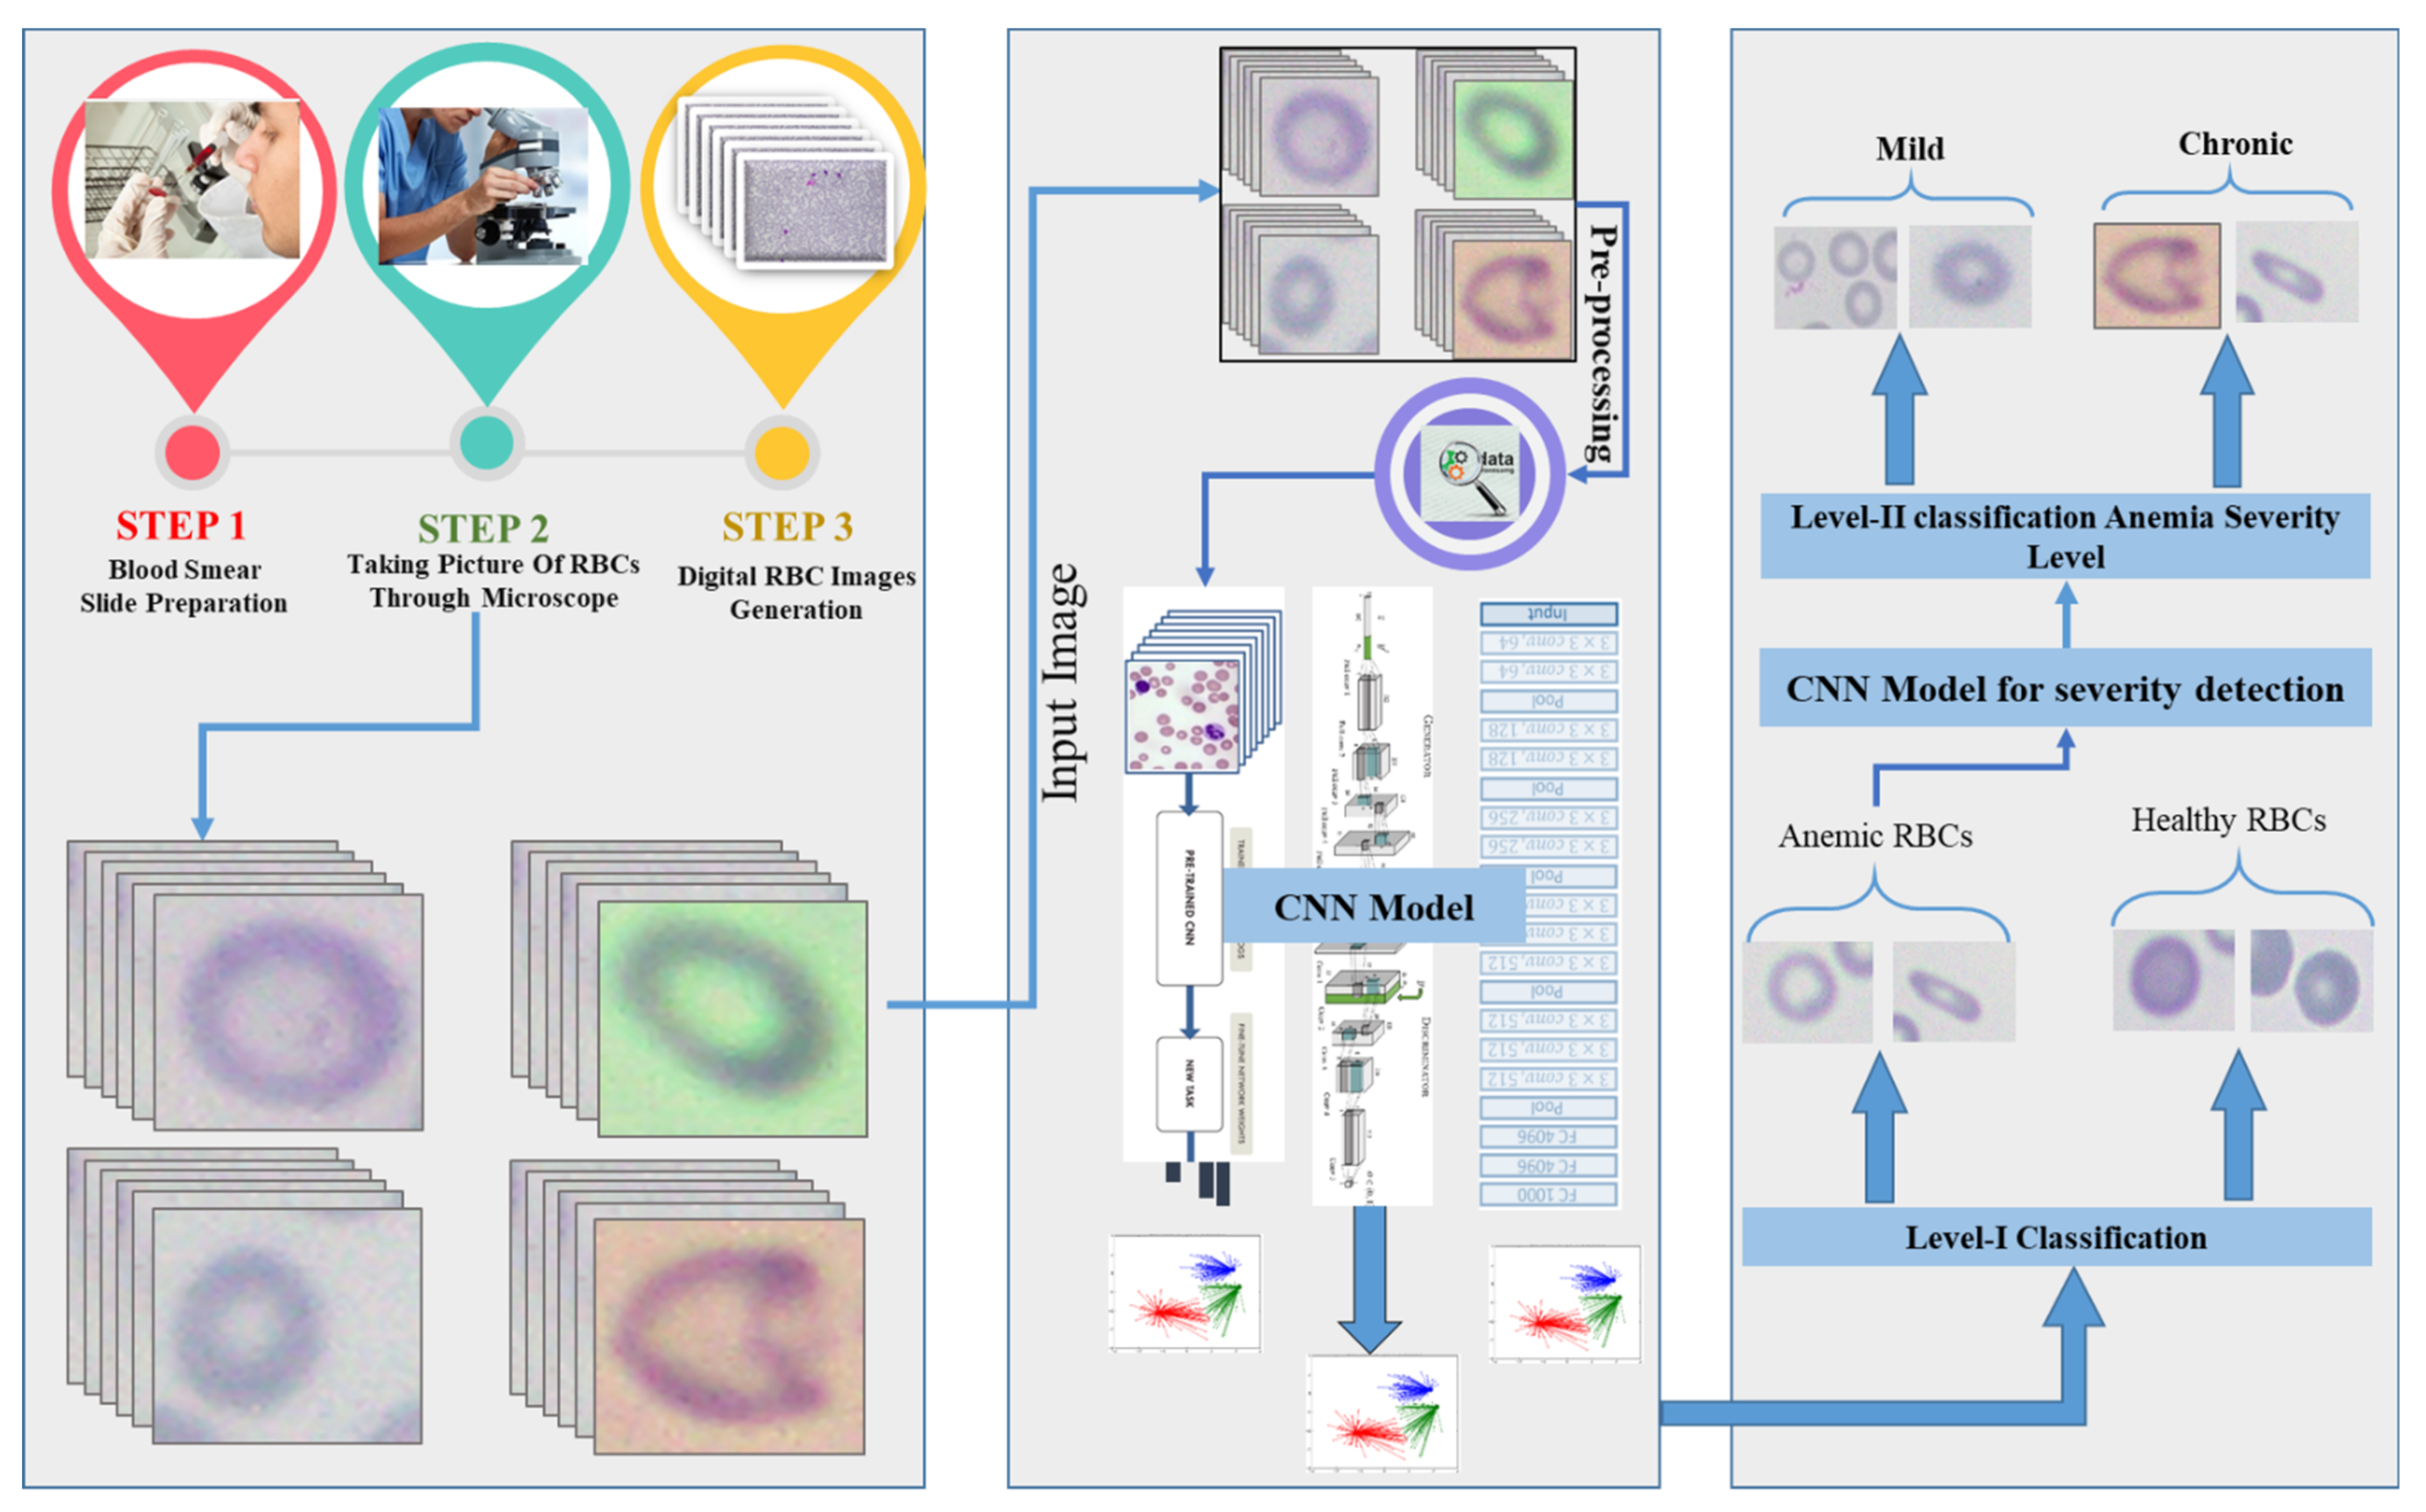
3. Methodology
- Image collection
- Pre-processing
- Dataset arrangement
- Proposed CNN model architecture
- Loss function
3.1. Image Collection
Dataset Preparation
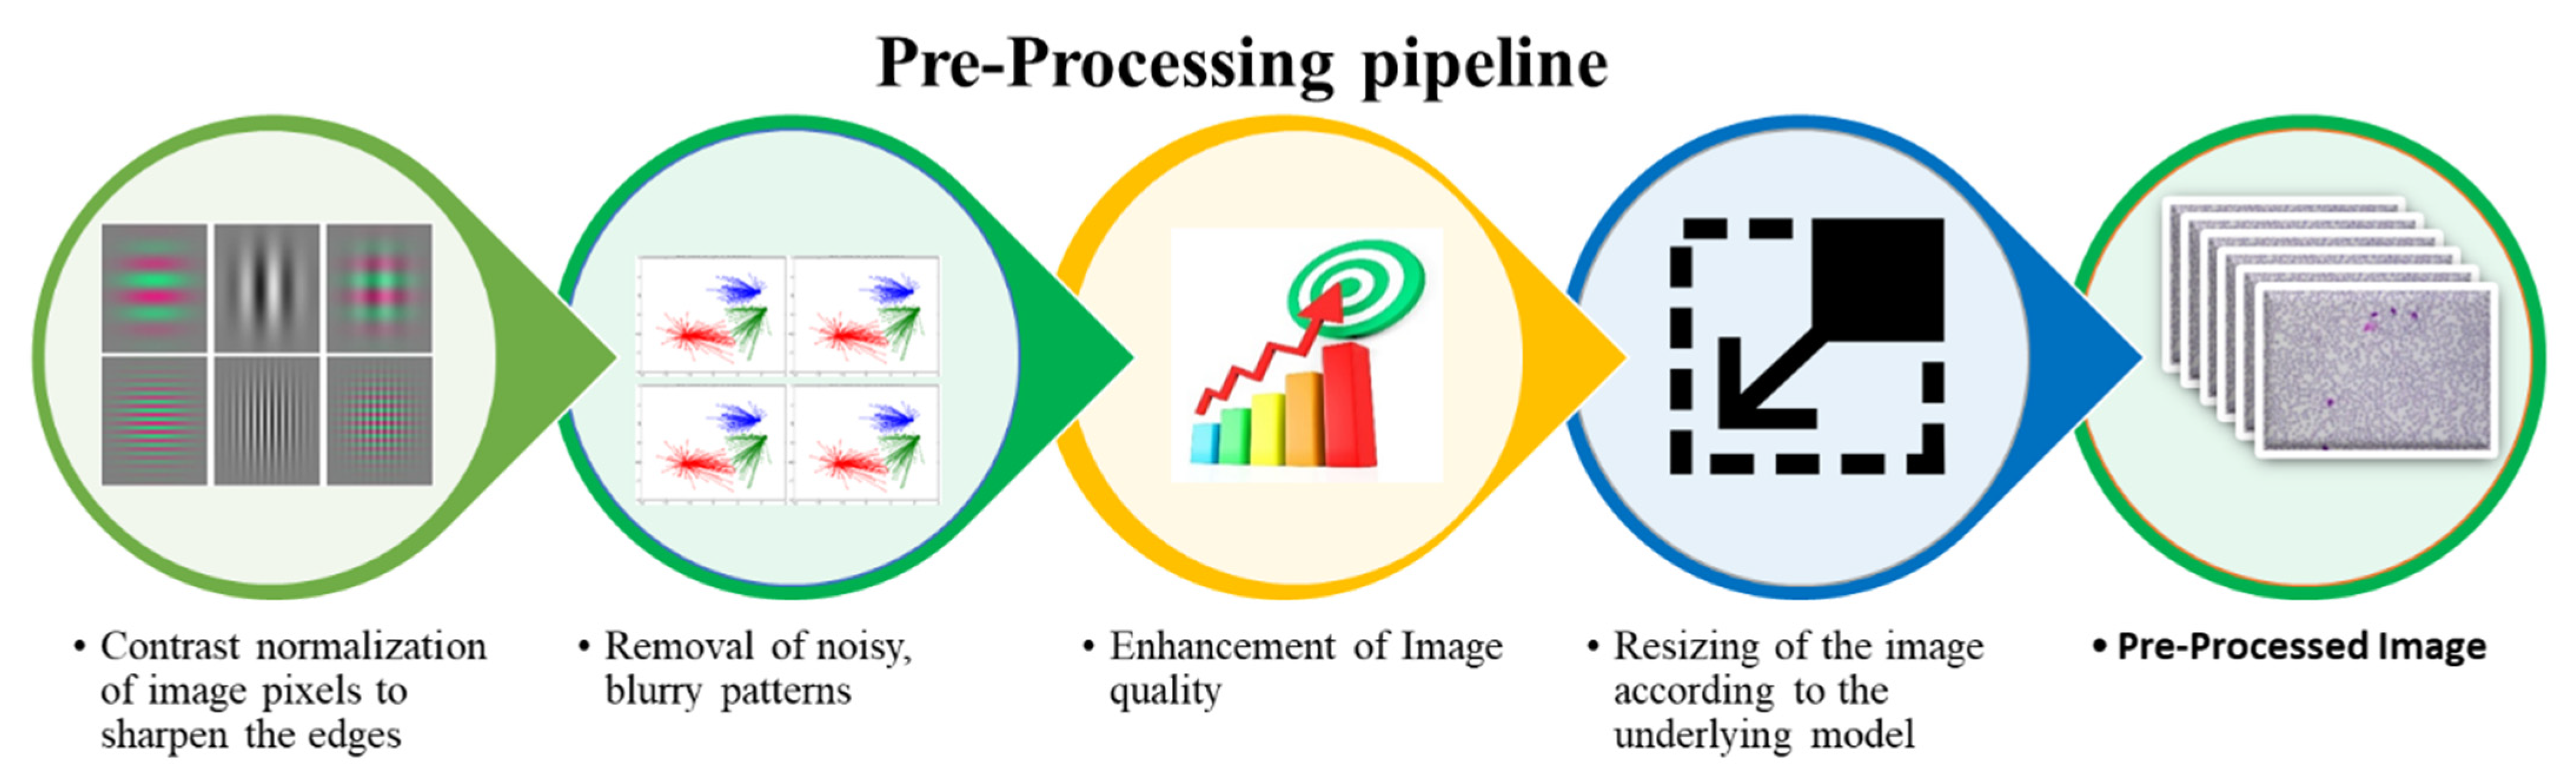
3.2. Pre-Processing
- Rescaling of image pixels to sharpen the edges for the separation of the region of interest (ROI) from the background
- Removal of noisy, blurry patterns and detection of RBCs edges
- Enhancement of image quality
- Resizing of the input image according to the underlying model
3.3. Dataset Arrangement
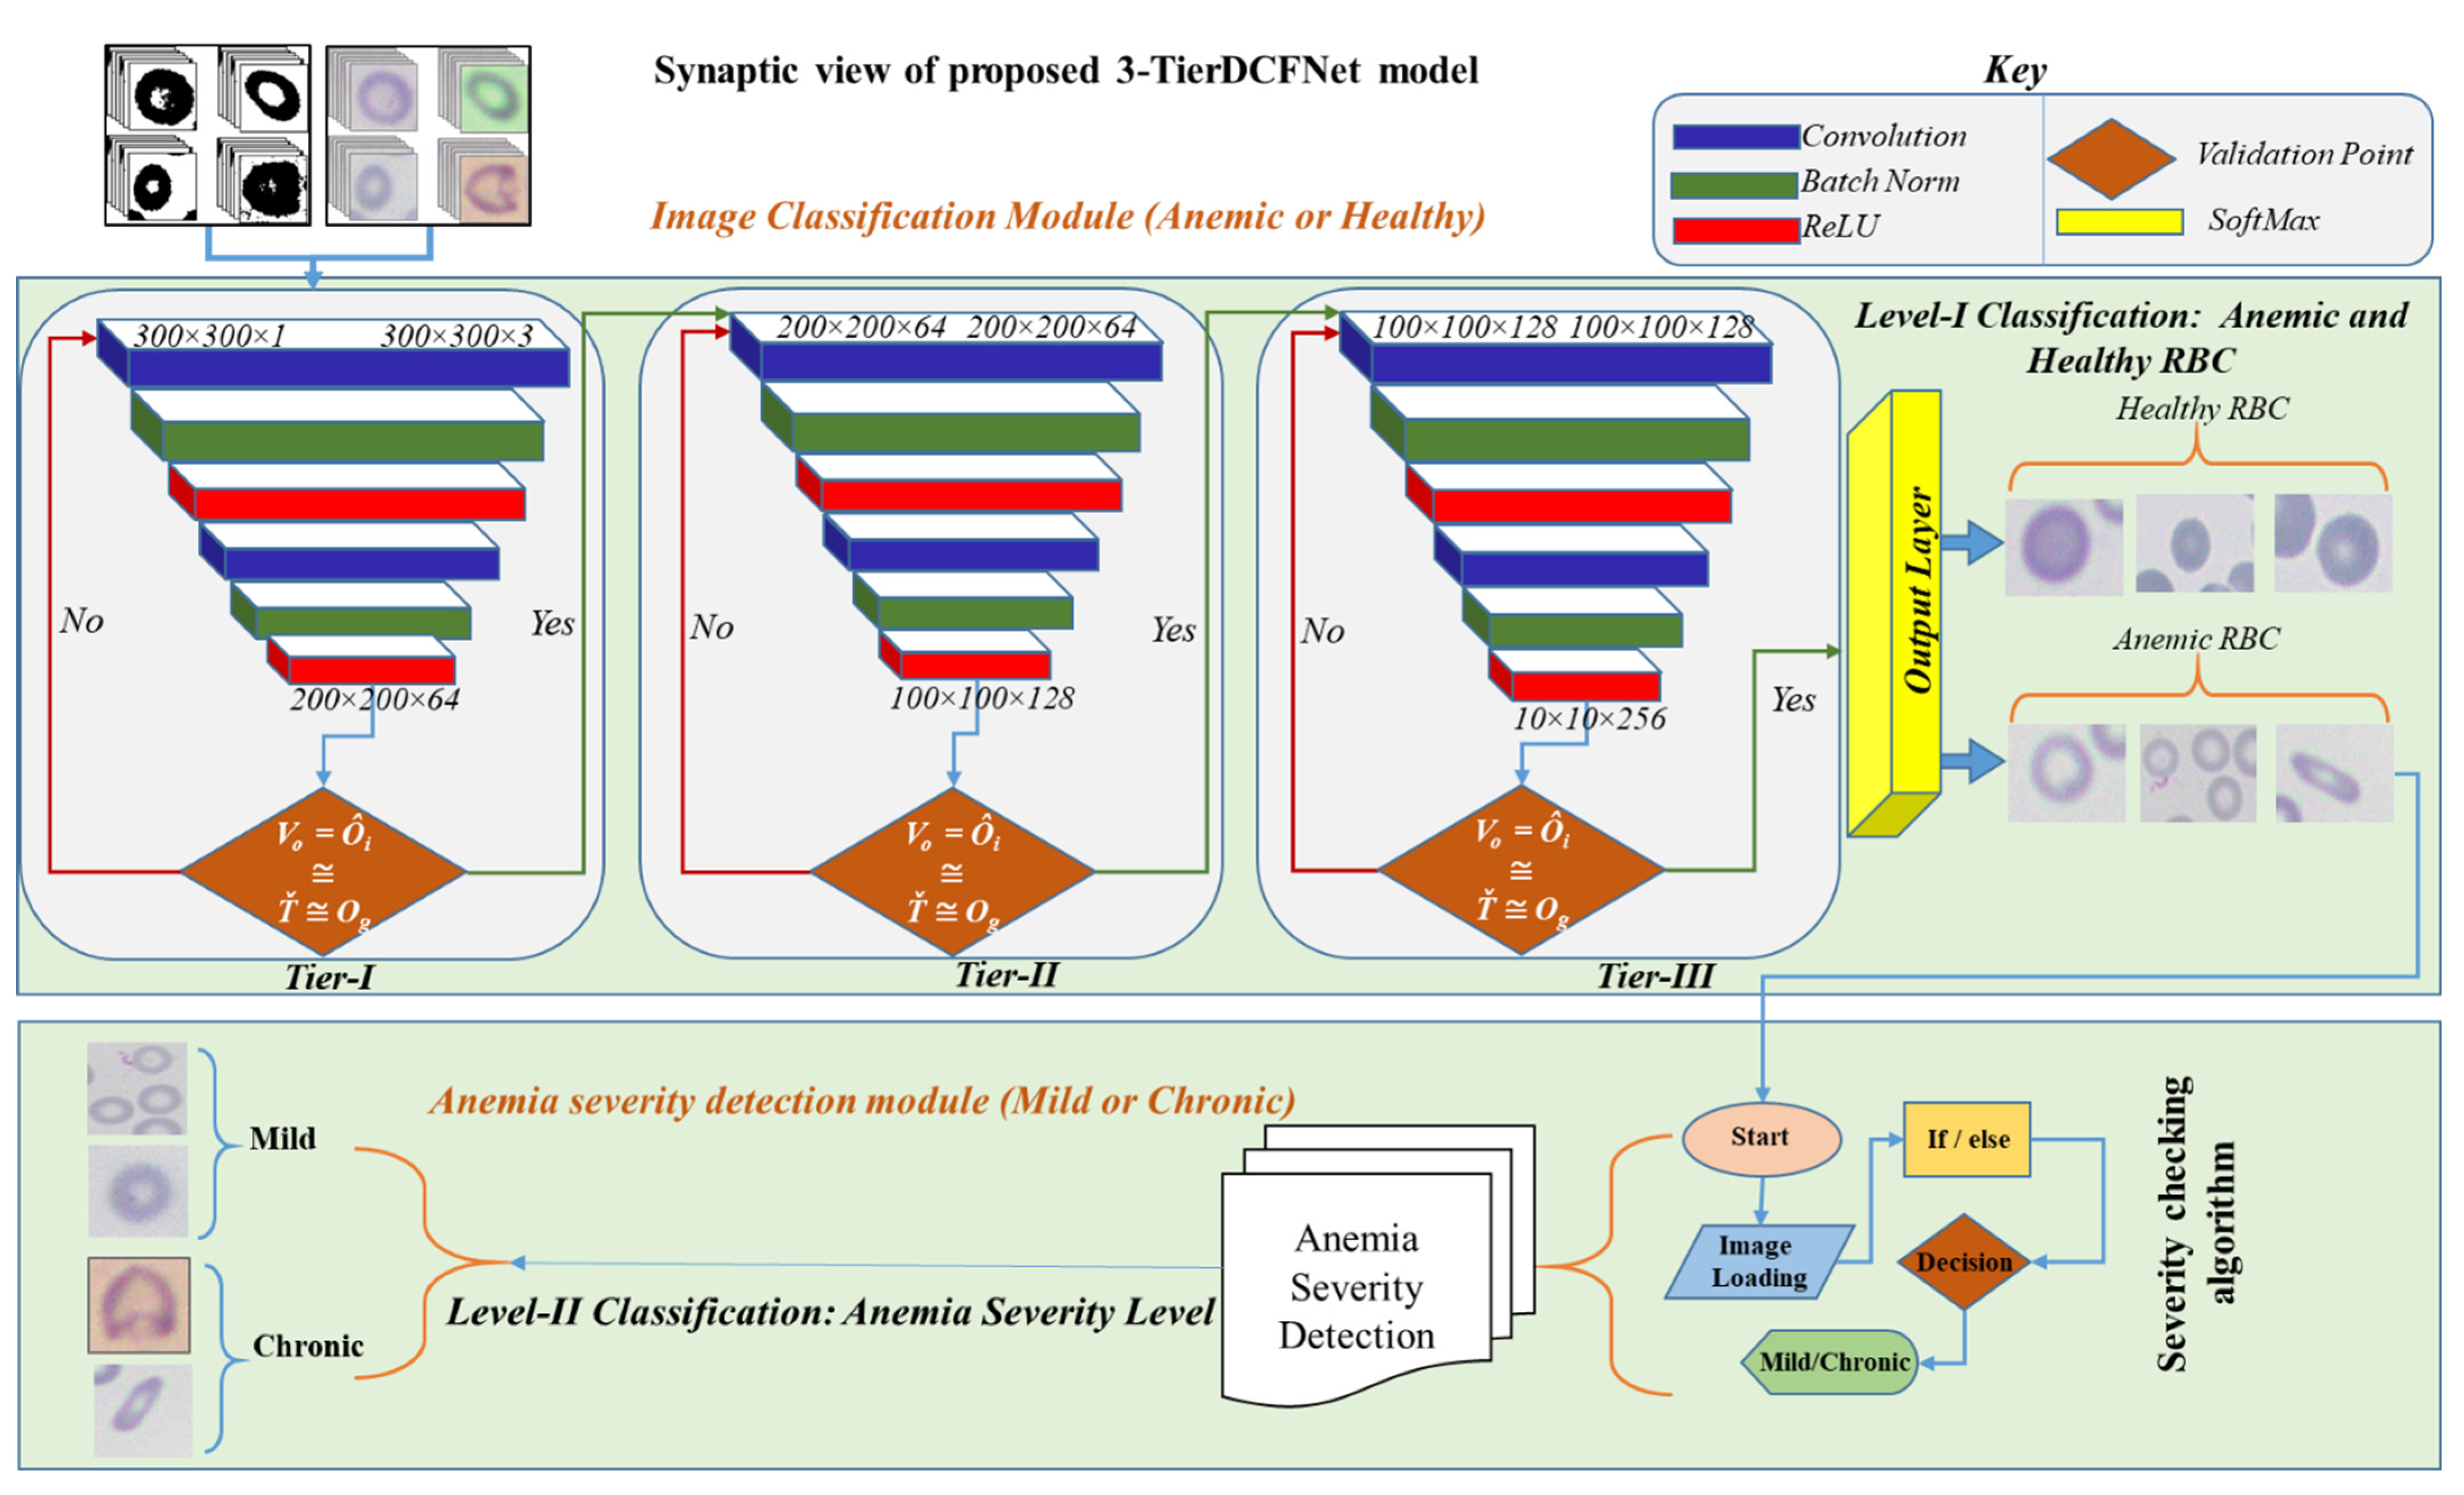
3.4. Proposed CNN Model Architecture
- The classification module (Anemic or Healthy)
- The anemia severity detection module (Mild/Chronic).
3.4.1. Classification Module (Anemic or Healthy)
3.4.2. Anemia Severity Detection Module
| Algorithm 1. Pseudocode representation of anemia Severity Detection algorithm |
| Start # RBC images will be loaded that are classified as anemic during Module-I classification Load Image: Var Size of cell (S) Var Roundness of cell (R) Var Central pallor size of cell (CP) Var Size Ratio (SR) Var Roundness Ratio (RR) Var Central pallor Ratio (CPR) Calculate: If Cell Size < 0.96 and Cell Size > 0.66 S = 1 − abs(0.8 − Cell Size) × SR Else S = 1 − abs(1.6 − Cell Size) × SR R = 1 − abs(38.5% − Cell Roundness) × RR CP = 1 − abs(0.405 − Cell Paller) × CPR # Morphological parameters checking for predicting disease severity level Mild = S + R +CP If (Mild > 50%) Image = “Mild” Else Image = “Chronic” End End Start The above algorithm is a detailed description of the severity detection technique. Initially, the images are loaded that are classified as anemic by 3-TierDCFNet. |
3.5. Loss Function
4. Results and Discussion
4.1. Training and Testing
4.2. Performance Eveluation Matrices
4.2.1. Accuracy
4.2.2. F1 Score
4.2.3. Specificity
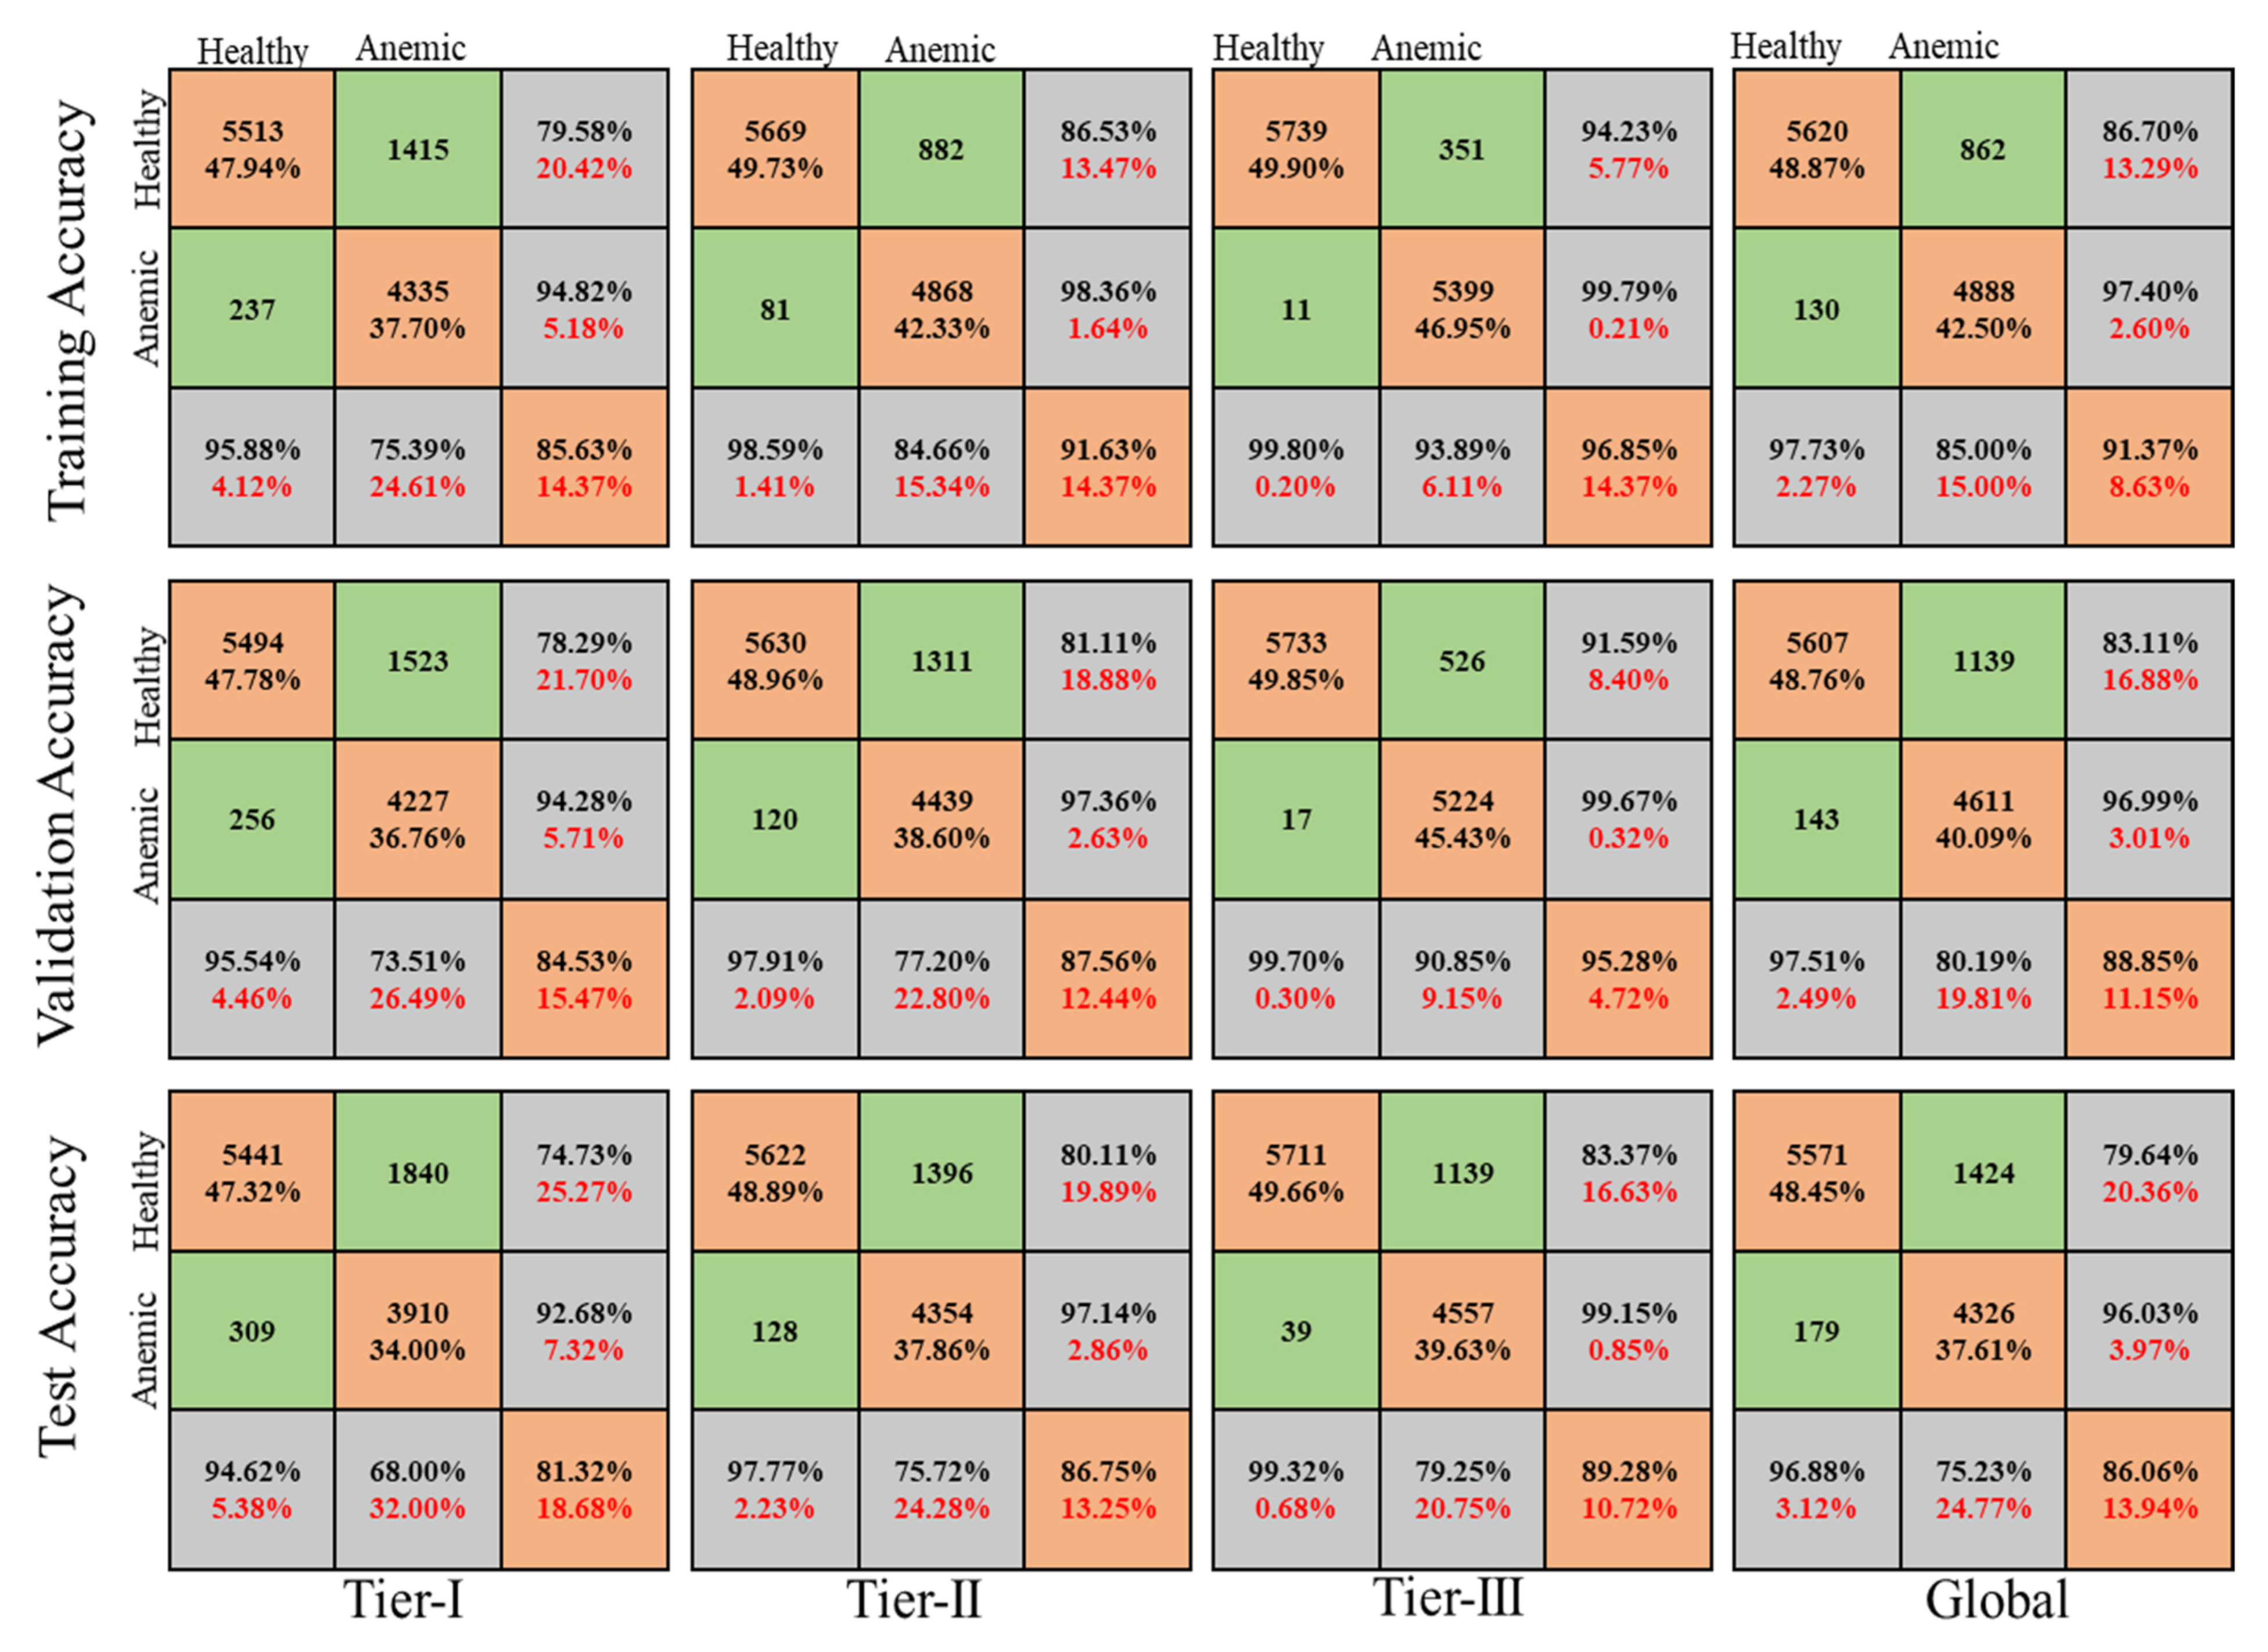
4.3. RBC Classification
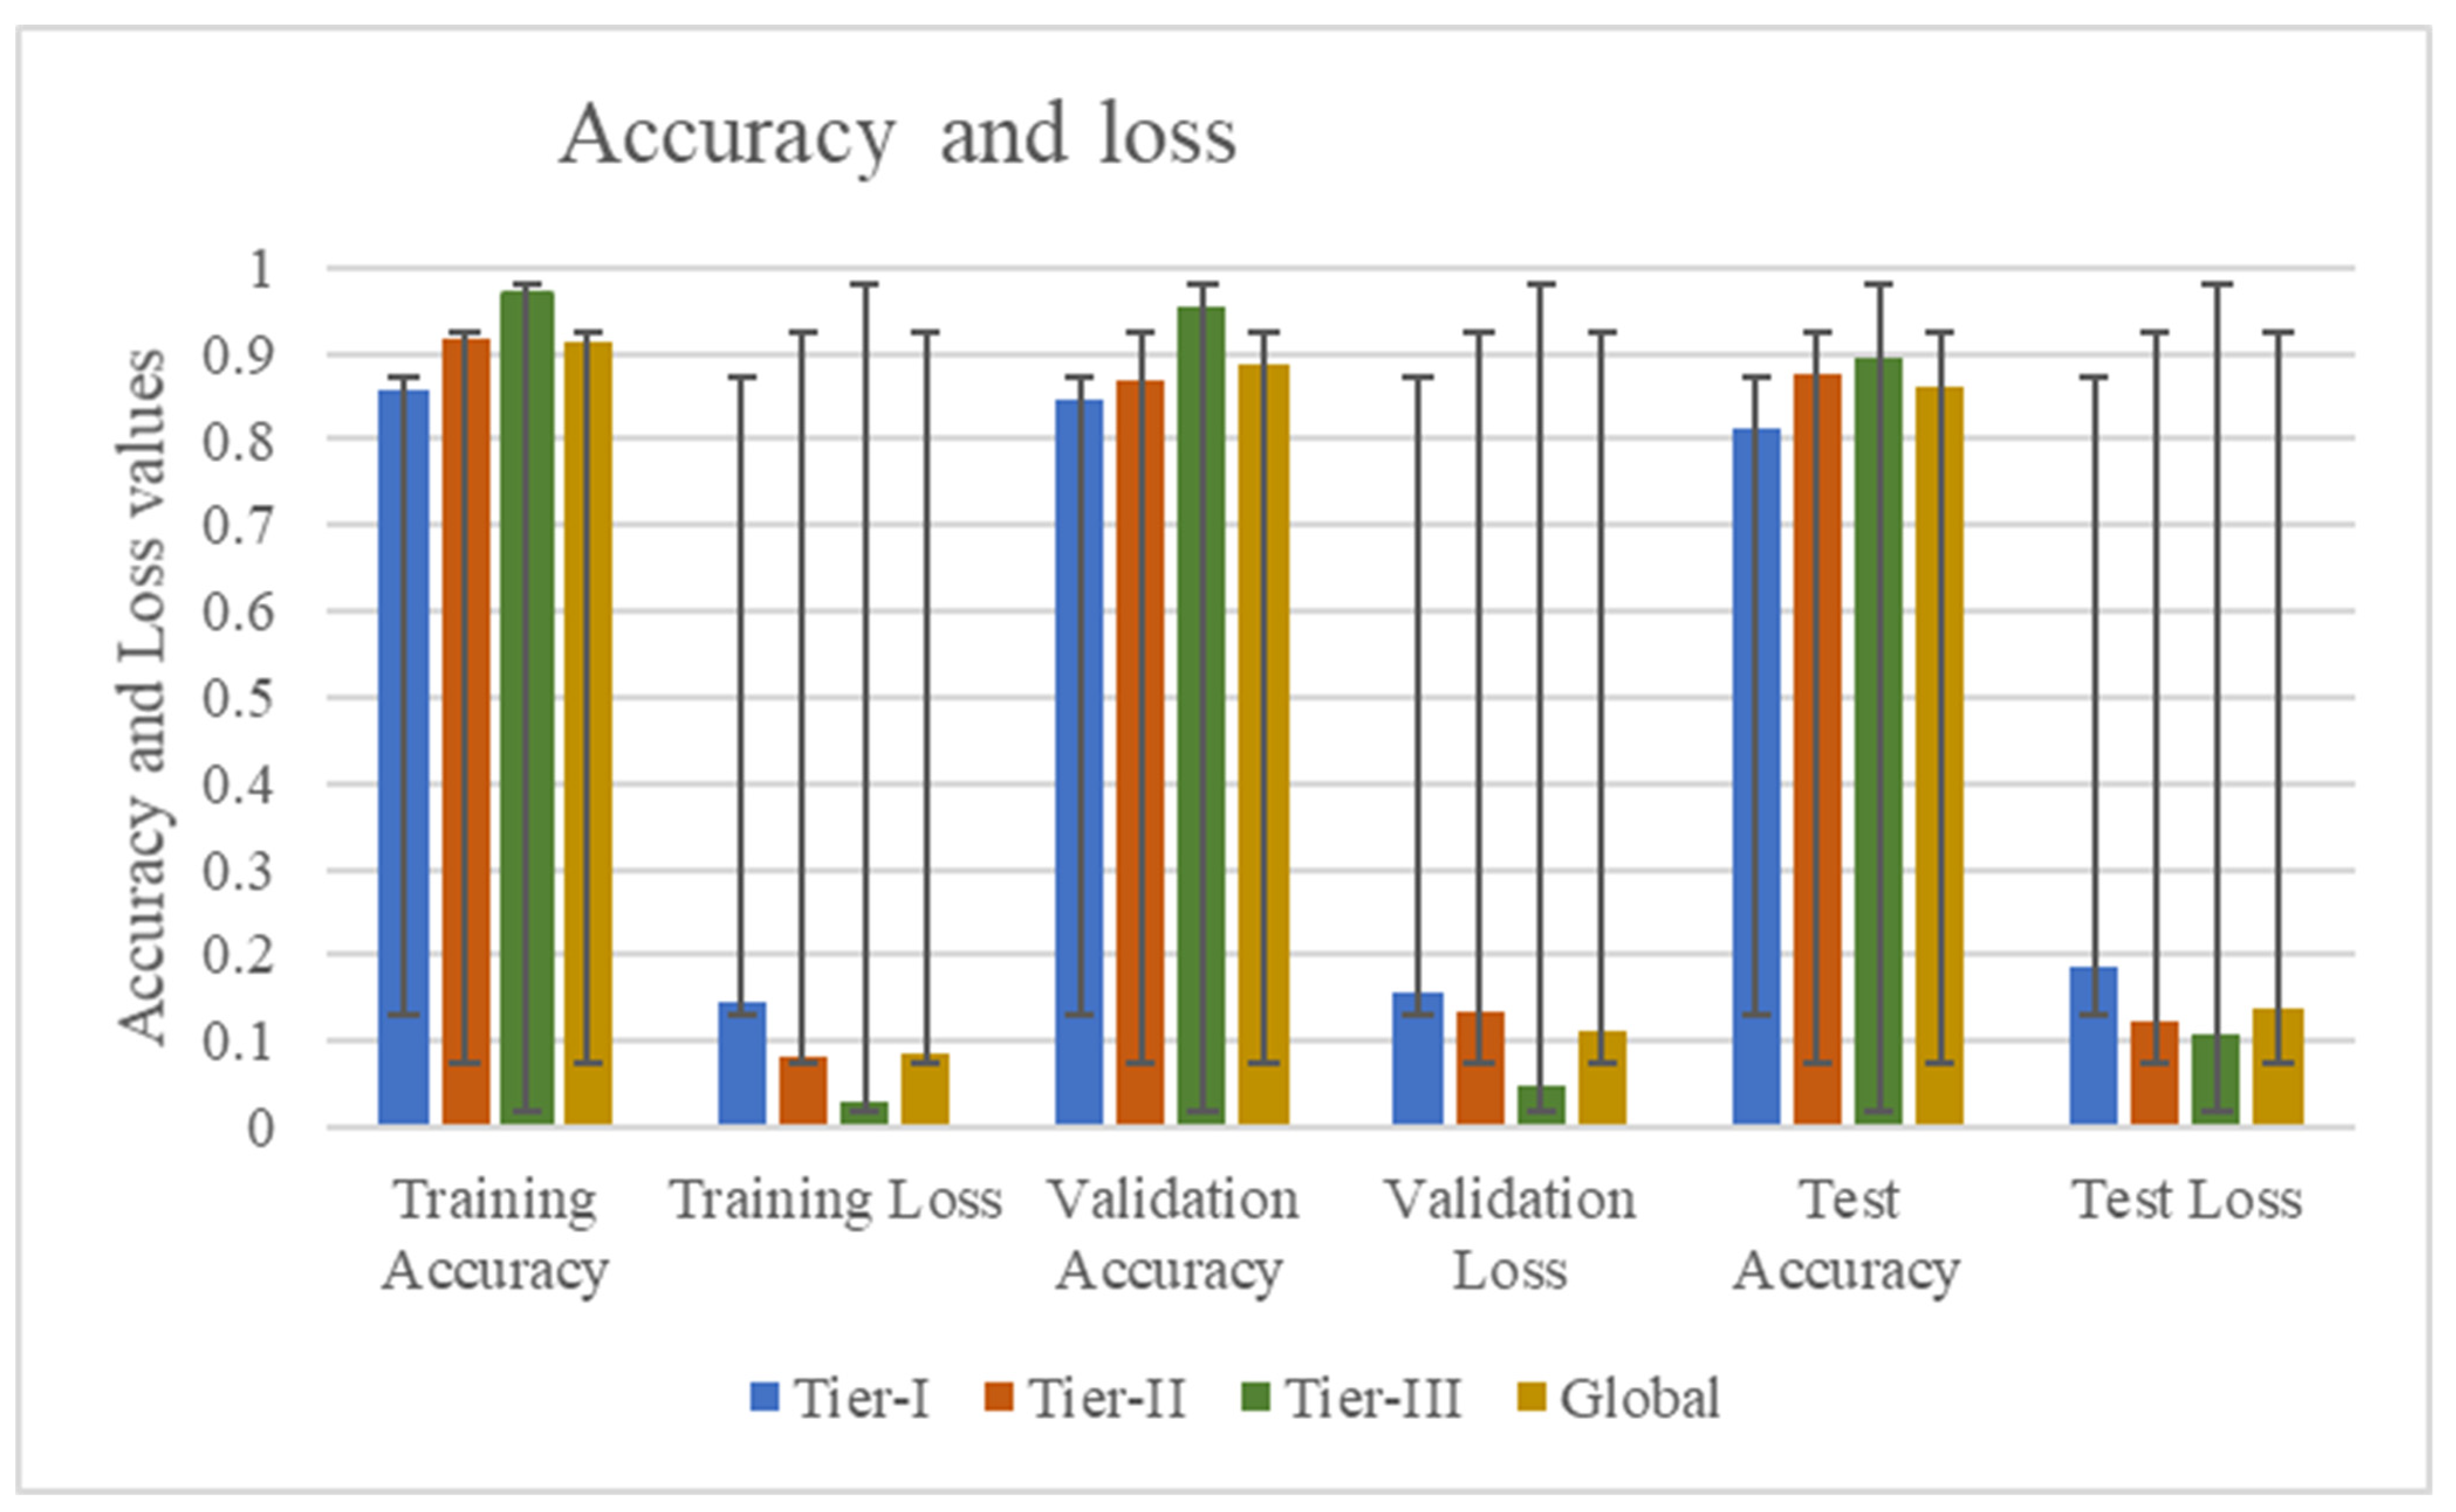
Accuracy and Loss Convergence
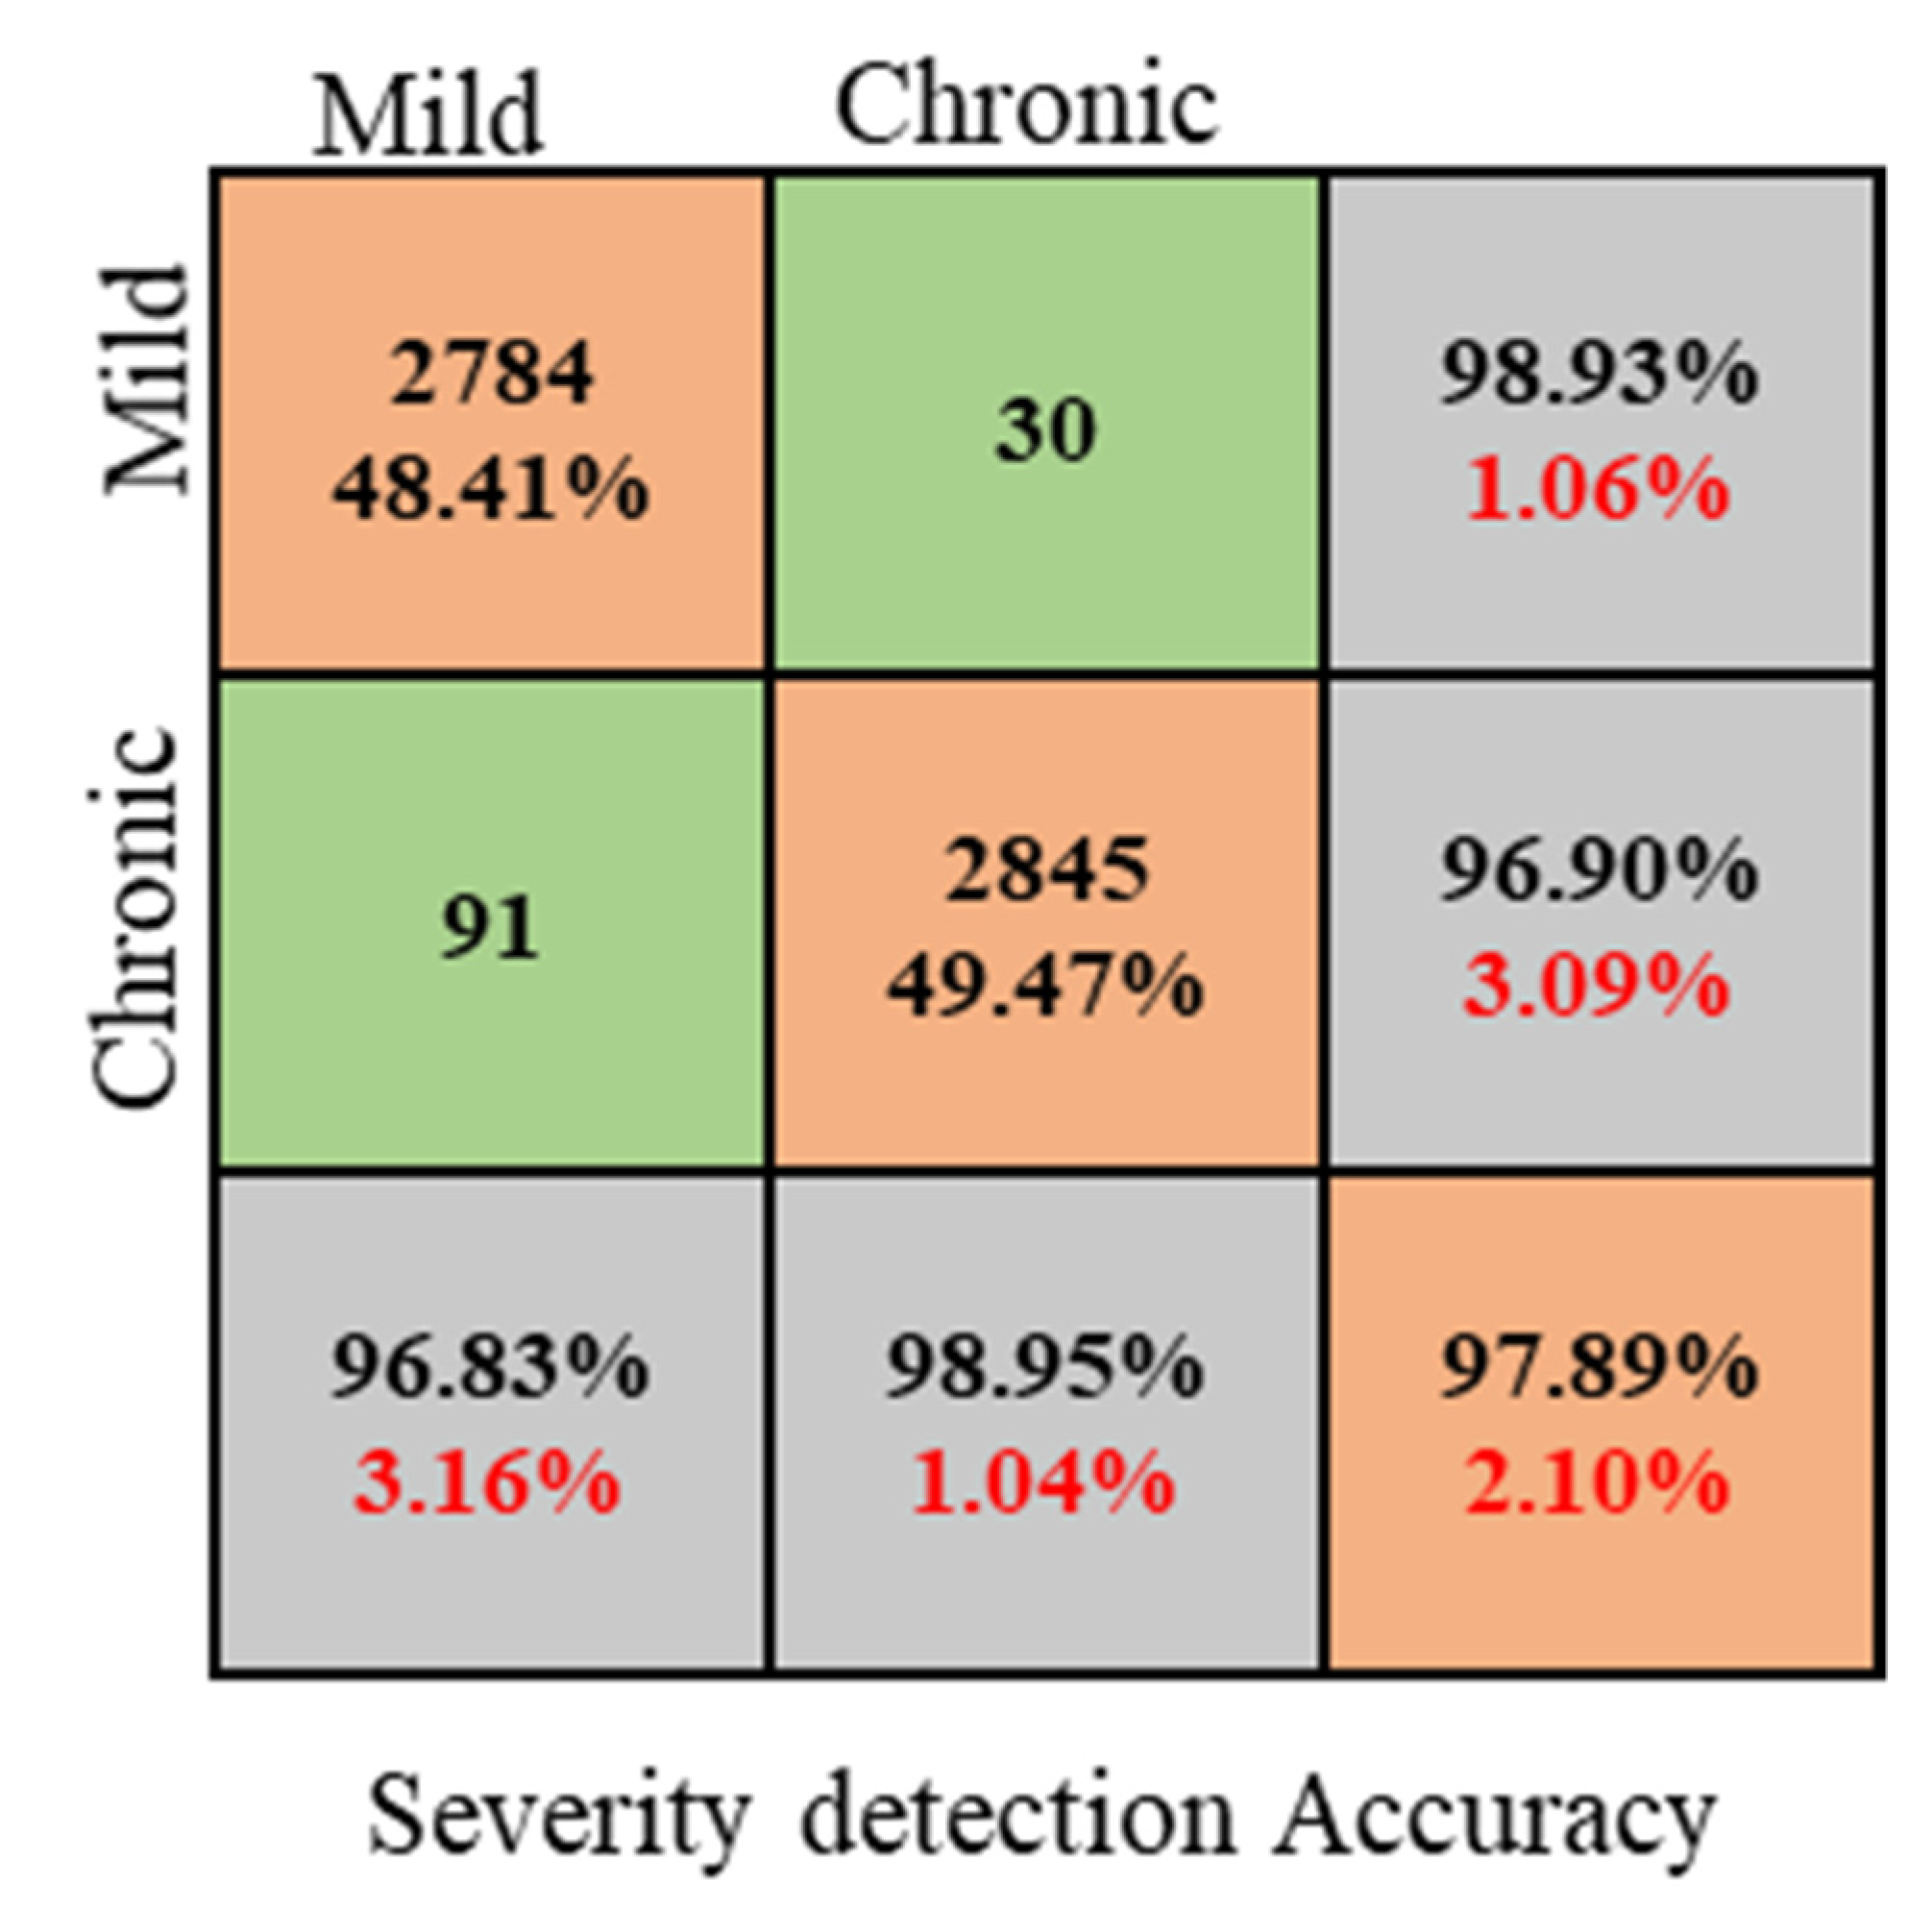
4.4. Anemia Severity Detection
4.5. Advantages of the Proposed Model
4.5.1. Impact of 3-Tier Densely Connected Architecture and Validation Function
4.5.2. Impact of anemia Severity Detection Module
- (1)
- Large number of images, i.e., 11,500.
- (2)
- Large number of RBC elements in each image, i.e., ~1500, and overall, ~750,000
- (3)
- In creating real-life scenarios, images are captured with heterogeneous lighting intensity.
- (4)
- Most of the RBC elements show an overlapped structure.
- (5)
- Due to the color differences, segmentation and classification become challenging.
5. Conclusions
6. Future Work
Author Contributions
Funding
Institutional Review Board Statement
Informed Consent Statement
Data Availability Statement
Acknowledgments
Conflicts of Interest
References
- Gebreweld, A.; Bekele, D.; Tsegaye, A. Hematological profile of pregnant women at St. Paul’s Hospital Millennium Medical College, Addis Ababa, Ethiopia. BMC Hematol. 2018, 18, 15. [Google Scholar] [CrossRef] [PubMed]
- Buttarello, M. Laboratory diagnosis of anemia: Are the old and new red cell parameters useful in classification and treatment, how? Int. J. Lab. Hematol. 2016, 38, 123–132. [Google Scholar] [CrossRef] [PubMed]
- WHO. The Global Prevalence of ANAEMIA in 2011; WHO: Geneva, Switzerland, 2011. [Google Scholar]
- Azam, B.; Rahman, S.U.; Irfan, M.; Awais, M.; AlShehri, O.M.; Saif, A.; Nahari, M.H.; Mahnashi, M.H. A Reliable Auto-Robust Analysis of Blood Smear Images for Classification of Microcytic Hypochromic Anemia Using Gray Level Matrices and Gabor Feature Bank. Entropy 2020, 22, 1040. [Google Scholar] [CrossRef] [PubMed]
- Chan, M.; WHO. Haemoglobin Concentrations for the Diagnosis of Anaemia and Assessment of Severity Geneva; WHO: Geneva, Switzerland, 2011; pp. 1–6. [Google Scholar]
- Nagao, T.; Hirokawa, M. Diagnosis and treatment of macrocytic anemias in adults. J. Gen. Fam. Med. 2017, 18, 200–204. [Google Scholar] [CrossRef] [PubMed]
- Vreugdenhil, G.; Baltus, C.A.M.; Van Eijk, H.G.; Swakk, A.J.G. Anaemia of chronic disease: Diagnostic significance of erythrocyte and serological parameters in iron deficient rhuematiod arthritis pateints. Rheumatology 1990, 29, 105–110. [Google Scholar] [CrossRef] [PubMed]
- Maakaron, E.J. Which Conditions Are Associated with Microcytic Hypochromic Anemia? Medscape. 2019. Available online: https://www.medscape.com/answers/198475-155078/which-conditions-are-associated-with-microcytic-hypochromic-anemia (accessed on 30 November 2021).
- Chaudhry, H.S.; Kasarla, M.R. Microcytic Hypochromic Anemia. StatPearls. 2021. Available online: https://www.ncbi.nlm.nih.gov/books/NBK470252/ (accessed on 30 November 2021).
- Siegel, R.; Naishadham, D.; Jemal, A. Cancer statistics, 2013. Cancer J. Clin. 2013, 63, 11–30. [Google Scholar] [CrossRef] [PubMed]
- Cao, A.; Galanello, R. Beta-thalassemia. Genet. Med. 2010, 5, 11. [Google Scholar] [CrossRef]
- Mishra, S.; Majhi, B.; Sa, P.K. Texture feature based classification on microscopic blood smear for acute lymphoblastic leukemia detection. Biomed. Signal Process. Control 2018, 47, 303–311. [Google Scholar] [CrossRef]
- Merino, A.; Puigví, L.; Boldú, L.; Alférez, S.; Rodellar, J. Optimizing morphology through blood cell image analysis. Int. J. Lab. Hematol. 2018, 40, 54–61. [Google Scholar] [CrossRef]
- Dg, D. Advantages and Disadvantages of Automated Hemotology Analyzer. Bioscience. 2017. Available online: https://www.bioscience.com.pk/topics/hemotology/item/810-advantages-and-disadvantages-of-automated-hemotology-analyzer (accessed on 19 April 2022).
- Flax, S.D. Why Do We Still Need to Evaluate Peripheral Blood Smears? AACC 2017. Available online: https://www.aacc.org/cln/articles/2017/june/why-do-we-still-need-to-evaluate-peripheral-blood-smears (accessed on 19 April 2022).
- Lippi, G.; Da Rin, G. Advantages and limitations of total laboratory automation: A personal overview. Clin. Chem. Lab. Med. (CCLM) 2019, 57, 802–811. [Google Scholar] [CrossRef]
- Das, D.K.; Maiti, A.K.; Chakraborty, C. Automated identification of normoblast cell from human peripheral blood smear images. J. Microsc. 2018, 269, 310–320. [Google Scholar] [CrossRef] [PubMed]
- Miao, H.; Xiao, C. Simultaneous Segmentation of Leukocyte and Erythrocyte in Microscopic Images Using a Marker-Controlled Watershed Algorithm. Comput. Math. Methods Med. 2018, 2018, 7235795. [Google Scholar] [CrossRef] [PubMed]
- Shahzad, M.; Umar, A.I.; Khan, M.A.; Shirazi, S.H.; Khan, Z.; Yousaf, W. Robust Method for Semantic Segmentation of Whole-Slide Blood Cell Microscopic Images. Comput. Math. Methods Med. 2020, 2020, 4015323. [Google Scholar] [CrossRef] [PubMed]
- Wang, Q.; Wang, J.; Zhou, M.; Li, Q.; Wen, Y.; Chu, J. A 3D attention networks for classification of white blood cells from microscopy hyperspectral images. Opt. Laser Technol. 2021, 139, 106931. [Google Scholar] [CrossRef]
- Shirazi, S.H.; Umar, A.I.; Naz, S.; Shirazi, S.F.; Razzak, M.I. A Novel Method For Scanning Electron Microscope Image Segmentation And Its Application To Blood Cell Analysis. J. Appl. Environ. Biol. Sci. 2016, 6, 139–144. Available online: https://www.textroad.com/pdf/JAEBS/J (accessed on 23 November 2021).
- Boldú, L.; Merino, A.; Acevedo, A.; Molina, A.; Rodellar, J. A deep learning model (ALNet) for the diagnosis of acute leukaemia lineage using peripheral blood cell images. Comput. Methods Programs Biomed. 2021, 202, 105999. [Google Scholar] [CrossRef]
- Shirazi, S.H.; Umar, A.I.; Haq, N.; Naz, S.; Razzak, M.I.; Zaib, A. Extreme learning machine based microscopic red blood cells classification. Clust. Comput. 2017, 21, 691–701. [Google Scholar] [CrossRef]
- Al-Hafiz, F.; Al-Megren, S.; Kurdi, H. Red blood cell segmentation by thresholding and Canny detector. Procedia Comput. Sci. 2018, 141, 327–334. [Google Scholar] [CrossRef]
- Rehman, A.; Abbas, N.; Saba, T.; Mahmood, T.; Kolivand, H. Rouleaux red blood cells splitting in microscopic thin blood smear images via local maxima, circles drawing, and mapping with original RBCs. Microsc. Res. Tech. 2018, 81, 737–744. [Google Scholar] [CrossRef]
- Tran, T.; Phuong, T.; Minh, L.B.; Lee, S.; Kwon, K. Blood cell count using Deep Learning Semantic Segmentation. Preprints 2019, 2019090075. [Google Scholar] [CrossRef]
- Chaudhary, A.H.; Ikhlaq, J.; Iftikhar, M.A.; Alvi, M. Blood Cell Counting and Segmentation Using Image Processing Techniques. In Applications of Intelligent Technologies in Healthcare; Springer: Cham, Switzerland, 2018; pp. 87–98. [Google Scholar] [CrossRef]
- Al-Qudah, R.; Suen, C.Y. Improving blood cells classification in peripheral blood smears using enhanced incremental training. Comput. Biol. Med. 2021, 131, 104265. [Google Scholar] [CrossRef]
- Long, F.; Peng, J.-J.; Song, W.; Xia, X.; Sang, J. BloodCaps: A capsule network based model for the multiclassification of human peripheral blood cells. Comput. Methods Programs Biomed. 2021, 202, 105972. [Google Scholar] [CrossRef] [PubMed]
- Abdulkarim, H.A.; Sudirman, R.; Razak, M.A.A. Normal and abnormal red blood cell recognition using image processing. Indones. J. Electr. Eng. Comput. Sci. 2019, 14, 96–100. [Google Scholar] [CrossRef]
- Liao, Z.; Zhang, Y.; Li, Z.; He, B.; Lang, X.; Liang, H.; Chen, J. Classification of red blood cell aggregation using empirical wavelet transform analysis of ultrasonic radiofrequency echo signals. Ultrasonics 2021, 114, 106419. [Google Scholar] [CrossRef] [PubMed]
- Yi, F.; Moon, I.; Javidi, B. Cell morphology-based classification of red blood cells using holographic imaging informatics. Biomed. Opt. Express 2016, 7, 2385–2399. [Google Scholar] [CrossRef]
- Divina, P.D.C.; Felices, J.P.T.; Hortinela, C.C.; Fausto, J.C.; Valiente, F.L.; Balbin, J.R. Classification of Red Blood Cell Morphology Using Image Processing and Support Vector Machine. In Proceedings of the 2020 10th International Conference on Biomedical Engineering and Technology, Tokyo, Japan, 15–18 September 2020; pp. 22–27. [Google Scholar] [CrossRef]
- Aggarwal, P.; Khatter, A.; Vyas, G. An Intensity Threshold based Image Segmentation of Malaria Infected Cells. In Proceedings of the 2nd International Conference on Computing Methodologies and Communication (ICCMC 2018), Erode, India, 15–16 February 2018; pp. 549–553. [Google Scholar] [CrossRef]
- Sarkar, S.; Sharma, R.; Shah, K. Malaria detection from RBC images using shallow Convolutional Neural Networks. arXiv Preprint 2010, arXiv:2010.11521. [Google Scholar]
- Molina, A.; Rodellar, J.; Boldú, L.; Acevedo, A.; Alférez, S.; Merino, A. Automatic identification of malaria and other red blood cell inclusions using convolutional neural networks. Comput. Biol. Med. 2021, 136, 104680. [Google Scholar] [CrossRef]
- Tyas, D.A.; Hartati, S.; Harjoko, A.; Ratnaningsih, T. Morphological, Texture, and Color Feature Analysis for Erythrocyte Classification in Thalassemia Cases. IEEE Access 2020, 8, 69849–69860. [Google Scholar] [CrossRef]
- Maity, M.; Sarkar, P.; Chakraborty, C. Computer-assisted approach to anemic erythrocyte classification using blood pathological information. In Proceedings of the, 2012 Third International Conference on Emerging Applications of Information Technology, Kolkata, India, 30 November–1 December 2012; pp. 116–121. [Google Scholar] [CrossRef]
- Alico, J.N.; Ouattara, S.; Clement, A. A New Strategy for the Morphological and Colorimetric Recognition of Erythrocytes for the Diagnosis of Forms of Anemia based on Microscopic Color Images of Blood Smears. Int. J. Adv. Comput. Sci. Appl. 2020, 11, 488–497. [Google Scholar] [CrossRef]
- Purwar, S.; Tripathi, R.K.; Ranjan, R.; Saxena, R. Detection of microcytic hypochromia using cbc and blood film features extracted from convolution neural network by different classifiers. Multimed. Tools Appl. 2020, 79, 4573–4595. [Google Scholar] [CrossRef]
- Hasani, M.; Hanani, A. Automated Diagnosis of Iron Deficiency Anemia and Thalassemia by Data Mining Techniques. Int. J. Comput. Sci. Netw. Secur. 2017, 17, 326–331. [Google Scholar]
- Meena, K.; Tayal, D.K.; Gupta, V.; Fatima, A. Using classification techniques for statistical analysis of Anemia. Artif. Intell. Med. 2019, 94, 138–152. [Google Scholar] [CrossRef] [PubMed]
- Anemia Selection in Pregnant Women by using Random prediction (Rp) Classification Algorithm. Int. J. Recent Technol. Eng. 2019, 8, 2623–2630. [CrossRef]
- Abdullah, M.; Al-Asmari, S. Anemia types prediction based on data mining classification algorithms. In Communication, Management and Information Technology; CRC Press: Boca Raton, FL, USA, 2017; pp. 615–621. [Google Scholar]
- Amin, M.N.; Habib, A. Comparison of Different Classification Techniques Using WEKA for Hematological Data. Am. J. Eng. Res. 2015, 4, 55–61. [Google Scholar]
- Sanap, S.A.; Nagori, M.; Kshirsagar, V. Classification of Anemia Using Data Mining Techniques BT-Swarm, Evolutionary, and Memetic Computing. In Proceedings of the International Conference on Swarm, Evolutionary, and Memetic Computing, Visakhapatnam, India, 19–21 December 2011; pp. 113–121. [Google Scholar]
- Acharya, V.; Kumar, P. Identification and red blood cell classification using computer aided system to diagnose blood disorders. In Proceedings of the 2017 International Conference on Advances in Computing, Communications and Informatics, Udupi, India, 13–16 September 2017; pp. 2098–2104. [Google Scholar] [CrossRef]
- Medeiros, M.N. Blood Smear Database. Available online: http://www.hematologyatlas.com/principalpage.htm (accessed on 8 December 2021).
- Stanford Medicine Images. Available online: http://hematopathology.stanford.edu/ (accessed on 8 December 2021).
- Xu, M.; Papageorgiou, D.P.; Abidi, S.Z.; Dao, M.; Zhao, H.; Karniadakis, G.E. A deep convolutional neural network for classification of red blood cells in sickle cell anemia. PLOS Comput. Biol. 2017, 13, e1005746. [Google Scholar] [CrossRef]
- Yıldız, T.K.; Yurtay, N.; Öneç, B. Classifying anemia types using artificial learning methods. Eng. Sci. Technol. Int. J. 2021, 24, 50–70. [Google Scholar] [CrossRef]
- Mohammed, M.S.; Ahmad, A.A.; Sari, M. Analysis of Anemia Using Data Mining Techniques with Risk Factors Specification. In Proceedings of the 2020 International Conference for Emerging Technology (INCET), Belgaum, India, 5–7 June 2020; pp. 1–5. [Google Scholar] [CrossRef]
- Sow, B.; Mukhtar, H.; Ahmad, H.F.; Suguri, H. Assessing the relative importance of social determinants of health in malaria and anemia classification based on machine learning techniques. Inform. Health Soc. Care 2020, 45, 229–241. [Google Scholar] [CrossRef]
- Jaiswal, M.; Siddiqui, T.J. Machine Learning Algorithms for Anemia Disease Prediction: Select Machine Learning Algorithms for Anemia disease Prediction. In Recent Trends in Communication, Computing, and Electronics; Springer: Singapore, 2019. [Google Scholar] [CrossRef]
- Akter, F.; Hossin, A.; Daiyan, G.M.; Hossain, M. Classification of Hematological Data Using Data Mining Technique to Predict Diseases. J. Comput. Commun. 2018, 6, 76–83. [Google Scholar] [CrossRef]
- Alsheref, F.; Hassan, W. Blood Diseases Detection using Classical Machine Learning Algorithms. Int. J. Adv. Comput. Sci. Appl. 2019, 10, 77–81. [Google Scholar] [CrossRef]
- Mullen, K.T.; Kim, Y.J.; Gheiratmand, M. Contrast normalization in colour vision: The effect of luminance contrast on colour contrast detection. Sci. Rep. 2014, 4, 7350. [Google Scholar] [CrossRef]
- Ranjbaran, A.; Abu Hassan, A.H.; Jafarpour, M.; Ranjbaran, B. A Laplacian based image filtering using switching noise detector. SpringerPlus 2015, 4, 119. [Google Scholar] [CrossRef] [PubMed][Green Version]
- Litjens, G.; Kooi, T.; Bejnordi, B.E.; Setio, A.A.A.; Ciompi, F.; Ghafoorian, M.; van der Laak, J.A.W.M.; van Ginneken, B.; Sánchez, C.I. A survey on deep learning in medical image analysis. Med. Image Anal. 2017, 42, 60–88. [Google Scholar] [CrossRef] [PubMed]
- Simonyan, K.; Zisserman, A. Very Deep Convolutional Networks for Large-Scale Image Recognition. arXiv Preprint 2014, arXiv:1409.1556. [Google Scholar]
- He, K.; Zhang, X.; Ren, S.; Sun, J. Deep residual learning for image recognition. In Proceedings of the 2016 IEEE Conference on Computer Vision and Pattern Recognition (CVPR), Las Vegas, NV, USA, 27–30 June 2016; pp. 770–778. [Google Scholar] [CrossRef]
- Yang, Y.; Zhong, Z.; Shen, T.; Lin, Z. Convolutional Neural Networks with Alternately Updated Clique. In Proceedings of the IEEE Conference on Computer Vision and Pattern Recognition, Salt Lake City, UT, USA, 18–23 June 2018; pp. 2413–2422. [Google Scholar] [CrossRef]
- Xie, S.; Girshick, R.; Dollár, P.; Tu, Z.; He, K. Aggregated Residual Transformations for Deep Neural Networks. In Proceedings of the IEEE Conference on Computer Vision and Pattern Recognition (CVPR), Honolulu, HI, USA, 21–26 July 2017; pp. 5987–5995. [Google Scholar] [CrossRef]
- Huang, G.; Liu, Z.; Van Der Maaten, L.; Weinberger, K.Q. Densely connected convolutional networks. In Proceedings of the 2017 IEEE Conference on Computer Vision and Pattern Recognition, Honolulu, HI, USA, 21–26 July 2017; pp. 2261–2269. [Google Scholar] [CrossRef]
- Firdaus-Nawi, M.; Noraini, O.; Sabri, M.Y.; Siti-Zahrah, A.; Zamri-Saad, M.; Latifah, H. DeepLabv3+_Encoder-Decoder with Atrous Separable Convolution for Semantic Image Segmentation. Pertanika J. Trop. Agric. Sci. 2011, 34, 137–143. [Google Scholar]
- Szegedy, C.; Liu, W.; Jia, Y.; Sermanet, P.; Reed, S.; Anguelov, D.; Erhan, D.; Vanhoucke, V.; Rabinovich, A. Going Deeper with Convolutions. In Proceedings of the IEEE conference on computer vision and pattern recognition, Boston, MA, USA, 7–12 June 2015; pp: 1–9. [Google Scholar]
- Szegedy, C.; Ioffe, S.; Vanhoucke, V.; Alemi, A.A. Inception-v4, inception-ResNet and the impact of residual connections on learning. In Proceedings of the 31st AAAI Conference on Artificial Intelligence, San Francisco, CA, USA, 4–9 February 2017; pp. 4278–4284. [Google Scholar]
- Zoph, B.; Vasudevan, V.; Shlens, J.; Le, Q.V. Learning Transferable Architectures for Scalable Image Recognition. In Proceedings of the 2018 IEEE/CVF Conference on Computer Vision and Pattern Recognition Workshops, Salt Lake City, UT, USA, 18–22 June 2018; pp. 8697–8710. [Google Scholar] [CrossRef]
- Zhang, X.; Zhou, X.; Lin, M.; Sun, J. ShuffleNet: An Extremely Efficient Convolutional Neural Network for Mobile Devices. In Proceedings of the IEEE Computer Society Conference on Computer Vision and Pattern Recognition, Salt Lake City, UT, USA, 18–23 June 2018; pp. 6848–6856. [Google Scholar] [CrossRef]
- Paszke, A.; Chaurasia, A.; Kim, S.; Culurciello, E. ENet: A Deep Neural Network Architecture for Real-Time Semantic Segmentation. 2016, pp. 1–10. Available online: http://arxiv.org/abs/1606.02147 (accessed on 16 July 2021).
- Elizondo-Leal, J.C.; Parra-González, E.F.; Ramírez-Torres, J.G. The Exact Euclidean Distance Transform: A New Algorithm for Universal Path Planning. Int. J. Adv. Robot. Syst. 2013, 10, 266. [Google Scholar] [CrossRef]
- De Boer, P.T.; Kroese, D.P.; Mannor, S.; Rubinstein, R.Y. A tutorial on the cross-entropy method. Ann Oper Res. 2005, 134, 19–67. [Google Scholar] [CrossRef]
- Kubat, M. An Introduction to Machine Learning; Springer International Publishing; 2017. Available online: https://link.springer.com/book/10.1007/978-3-319-63913-0 (accessed on 28 March 2022). [CrossRef]
- Kate, V.; Shukla, P. A 3 Tier CNN model with deep discriminative feature extraction for discovering malignant growth in multi-scale histopathology images. Inform. Med. Unlocked 2021, 24, 100616. [Google Scholar] [CrossRef]
- Wang, W.; Li, Y.; Zou, T.; Wang, X.; You, J.; Luo, Y. A Novel Image Classification Approach via Dense-MobileNet Models. Mob. Inf. Syst. 2020, 2020, 7602384. [Google Scholar] [CrossRef]
- Labati, R.D.; Piuri, V.; Scotti, F. All-IDB : The Acute Lymphoblastic Leukemia Image Database for Image Processing. In Proceedings of the 2011 18th IEEE international conference on image processing, Brussels, Belgium, 11–14 September 2011; pp. 2089–2092. [Google Scholar]
- Sarrafzadeh, O.; Rabbani, H.; Talebi, A.; Banaem, H.U. Selection of the best features for leukocytes classification in blood smear microscopic images. In Medical Imaging 2014: Digital Pathology; SPIE: Bellingham, WA, USA, 2014; pp. 159–166. [Google Scholar] [CrossRef]
- Mohamed, M.; Far, B.; Guaily, A. An efficient technique for white blood cells nuclei automatic segmentation. In Proceedings of the 2012 IEEE International Conference on Systems, Man, and Cybernetics, Seoul, Korea, 14–17 October 2012; pp. 220–225. [Google Scholar] [CrossRef]
- Mohamed, M.M.A.; Far, B. A Fast Technique for White Blood Cells Nuclei Automatic Segmentation Based on Gram-Schmidt Orthogonalization. In Proceedings of the 2012 IEEE 24th International Conference on Tools with Artificial Intelligence, Athens, Greece, 7–9 November 2012; Volume 1, pp. 947–952. [Google Scholar] [CrossRef]
- Ljosa, V.; Sokolnicki, K.L.; Carpenter, A.E. Annotated high-throughput microscopy image sets for validation. Nat. Methods 2012, 9, 637. [Google Scholar] [CrossRef]


| S # | Paper | Project Aim | Database/ Dataset | Methods | Targeted Features | Performance Evaluation |
|---|---|---|---|---|---|---|
| 1 | [41] | Diagnosis of (1) iron deficiency anemia, (2) α-thalassemia trait and (3) β-thalassemia trait | 793 individuals 184 IDA 200 healthy 203 β-thalassemia 206 α-thalassemia | Weka Software | CBC | Accuracy = 96.343% Mean absolute error = 0.0183% |
| Hybrid vote algorithm | ||||||
| J48, IBK and Naïve Bayes algorithms | ||||||
| 2 | [42] | Statistical analysis of anemia | NFHS-4 | Decision tree | Hemoglobin level | Accuracy with only hemoglobin = 97.35% Accuracy for mother-child relation DT = 44% |
| Association rule | ||||||
| 3 | [43] | Feature selection and computational time for anemia prediction | Dataset with 2120 samples and 19 features | Median vector feature selection | Median Vector Feature Selection | Algorithm accuracy 98%. |
| RandomPrediction (Rp) algorithm | ||||||
| 4 | [52] | Analysis of Anemia Using Data Mining Techniques with Risk Factors Specification | 539 anemic patients | Weka Software | CBC, MCV, MCH | Accuracy = 86.1% |
| Naïve Bayes, Bayesian Network | ||||||
| Logistic regression, Multilayer Perceptron | ||||||
| 5 | [53] | Social determinants of health in anemia classification | 6935 instances with 986 variables. | KNN, RF, ANN, SVM | Correlation, Gradient boosting, recursive feature selection | Evaluate the performance of different classification algorithms |
| 6 | [54] | anemia disease prediction using CBC test results | 200 test samples with seven attributes. | NB, RF, DT algorithm | CBC | Evaluate the performance of different classification algorithms |
| 7 | [55] | Hematological data classification | 425 samples | RF | CBC | Evaluate the performance of different classification algorithms |
| Multilayer Perceptron | ||||||
| 8 | [56] | Blood diseases detection | 668 records | RF, KNN, SVM, DT | Not mentioned | Evaluate the performance of different classification algorithms |
| 9 | [47] | anemia diagnosis by RBC classification | 1000 images manually collected | K-Medoids algorithm, Modified Watershed algorithm | Area, Perimeter, Diameter, Shape, geometric | Accuracy |
| [50] | Classification of RBCs in sickle cell anemia | 7000 single RBCs | CNN model | Geometric transformations | Accuracy, Mean evaluation accuracy | |
| [51] | Classifying anemia types | 1663 samples | Support Vector Machines, Naïve Bayes, and Ensemble Decision Tree | HGB and MCV | Classification Error, Area Under Curve, Precision, Recall, and F1-score |
| Image Type | Healthy Images | Anemic Images | Total Healthy + Anemic | Original + Segmented | ||
|---|---|---|---|---|---|---|
| Mild | Chronic | |||||
| Original Images | 5750 | 2875 | 2875 | 11,500 | ||
| Manual Segmented Images | 5750 | 2875 | 2875 | 11,500 | 23,000 | |
| Training Images | Original | 4025 | 2012 | 2013 | 8050 | |
| Segmented | 4025 | 2012 | 2013 | 8050 | 11,500 | |
| Validation Images | Original | 575 | 287 | 288 | 1150 | |
| Segmented | 575 | 287 | 288 | 1150 | 2300 | |
| Test Images | Original | 1150 | 575 | 575 | 2300 | |
| Segmented | 1150 | 575 | 575 | 2300 | 4600 | |
| Total RBC Elements | Original | 375,000 | 187,500 | 187,500 | ~750,000 | |
| Segmented | 375,000 | 187,500 | 187,500 | ~750,000 | 1,500,000 | |
| Cell Type | Healthy | Mild Stage | Chronic Stage | |||
|---|---|---|---|---|---|---|
| Parameter | Original Diameter | After magnification | Original diameter | After magnification | Original diameter | After magnification |
| RBC size | 7.5 μm | 1.2 cm | <6–4 μm Or >9–11 μm | <0.96–0.66 cm Or >1.44–1.76 cm | <4μm Or >11 μm | <0.66 cm Or > 1.76 cm |
| RBC Shape | Rounded | 25–50% change in roundness | >50% change in roundness | |||
| Central white pallor size | 1.87 μm | 0.3 cm | <3–2 μm Or >4.5–5.5 μm | <0.48–0.33 cm Or >0.72–0.88 cm | <2.92 μm Or >8.25 μm | <0.33 cm Or > 1.76 cm |
| Accuracy | Tier-I | Tier-II | Tier-III | Global | |
|---|---|---|---|---|---|
| Training | Accuracy | 0.8563 | 0.9163 | 0.9685 | 0.9137 |
| Loss | 0.1437 | 0.0837 | 0.0315 | 0.0863 | |
| Validation | Accuracy | 0.8453 | 0.8756 | 0.9528 | 0.8885 |
| Loss | 0.1547 | 0.1244 | 0.0472 | 0.1115 | |
| Test | Accuracy | 0.8132 | 0.8675 | 0.8929 | 0.8606 |
| Loss | 0.1868 | 0.1325 | 0.1071 | 0.1394 | |
| Recall | 0.9349 | 0.9598 | 0.9596 | 0.9895 | |
| F1-Score | 0.9257 | 0.9562 | 0.9587 | 0.9812 | |
| Specificity | 0.9165 | 0.9436 | 0.9634 | 0.9726 | |
| Classes | Accuracy (%) | Recall (%) | F1-Score (%) | Specificity (%) |
|---|---|---|---|---|
| Mild | 96.82 | 95.96 | 96.89 | 95.96 |
| Chronic | 98.94 | 96.83 | 97.49 | 96.61 |
Publisher’s Note: MDPI stays neutral with regard to jurisdictional claims in published maps and institutional affiliations. |
© 2022 by the authors. Licensee MDPI, Basel, Switzerland. This article is an open access article distributed under the terms and conditions of the Creative Commons Attribution (CC BY) license (https://creativecommons.org/licenses/by/4.0/).
Share and Cite
Shahzad, M.; Umar, A.I.; Shirazi, S.H.; Khan, Z.; Khan, A.; Assam, M.; Mohamed, A.; Attia, E.-A. Identification of Anemia and Its Severity Level in a Peripheral Blood Smear Using 3-Tier Deep Neural Network. Appl. Sci. 2022, 12, 5030. https://doi.org/10.3390/app12105030
Shahzad M, Umar AI, Shirazi SH, Khan Z, Khan A, Assam M, Mohamed A, Attia E-A. Identification of Anemia and Its Severity Level in a Peripheral Blood Smear Using 3-Tier Deep Neural Network. Applied Sciences. 2022; 12(10):5030. https://doi.org/10.3390/app12105030
Chicago/Turabian StyleShahzad, Muhammad, Arif Iqbal Umar, Syed Hamad Shirazi, Zakir Khan, Asfandyar Khan, Muhammad Assam, Abdullah Mohamed, and El-Awady Attia. 2022. "Identification of Anemia and Its Severity Level in a Peripheral Blood Smear Using 3-Tier Deep Neural Network" Applied Sciences 12, no. 10: 5030. https://doi.org/10.3390/app12105030
APA StyleShahzad, M., Umar, A. I., Shirazi, S. H., Khan, Z., Khan, A., Assam, M., Mohamed, A., & Attia, E.-A. (2022). Identification of Anemia and Its Severity Level in a Peripheral Blood Smear Using 3-Tier Deep Neural Network. Applied Sciences, 12(10), 5030. https://doi.org/10.3390/app12105030