
Optimization of Bead Morphology for GMAW-Based Wire-Arc Additive Manufacturing of 2.25 Cr-1.0 Mo Steel Using Metal-Cored Wires

 ,
, 
 , , ,
, , ,  and
and 
Abstract
:1. Introduction
2. Materials and Methods
2.1. Experimental Plan and Setup
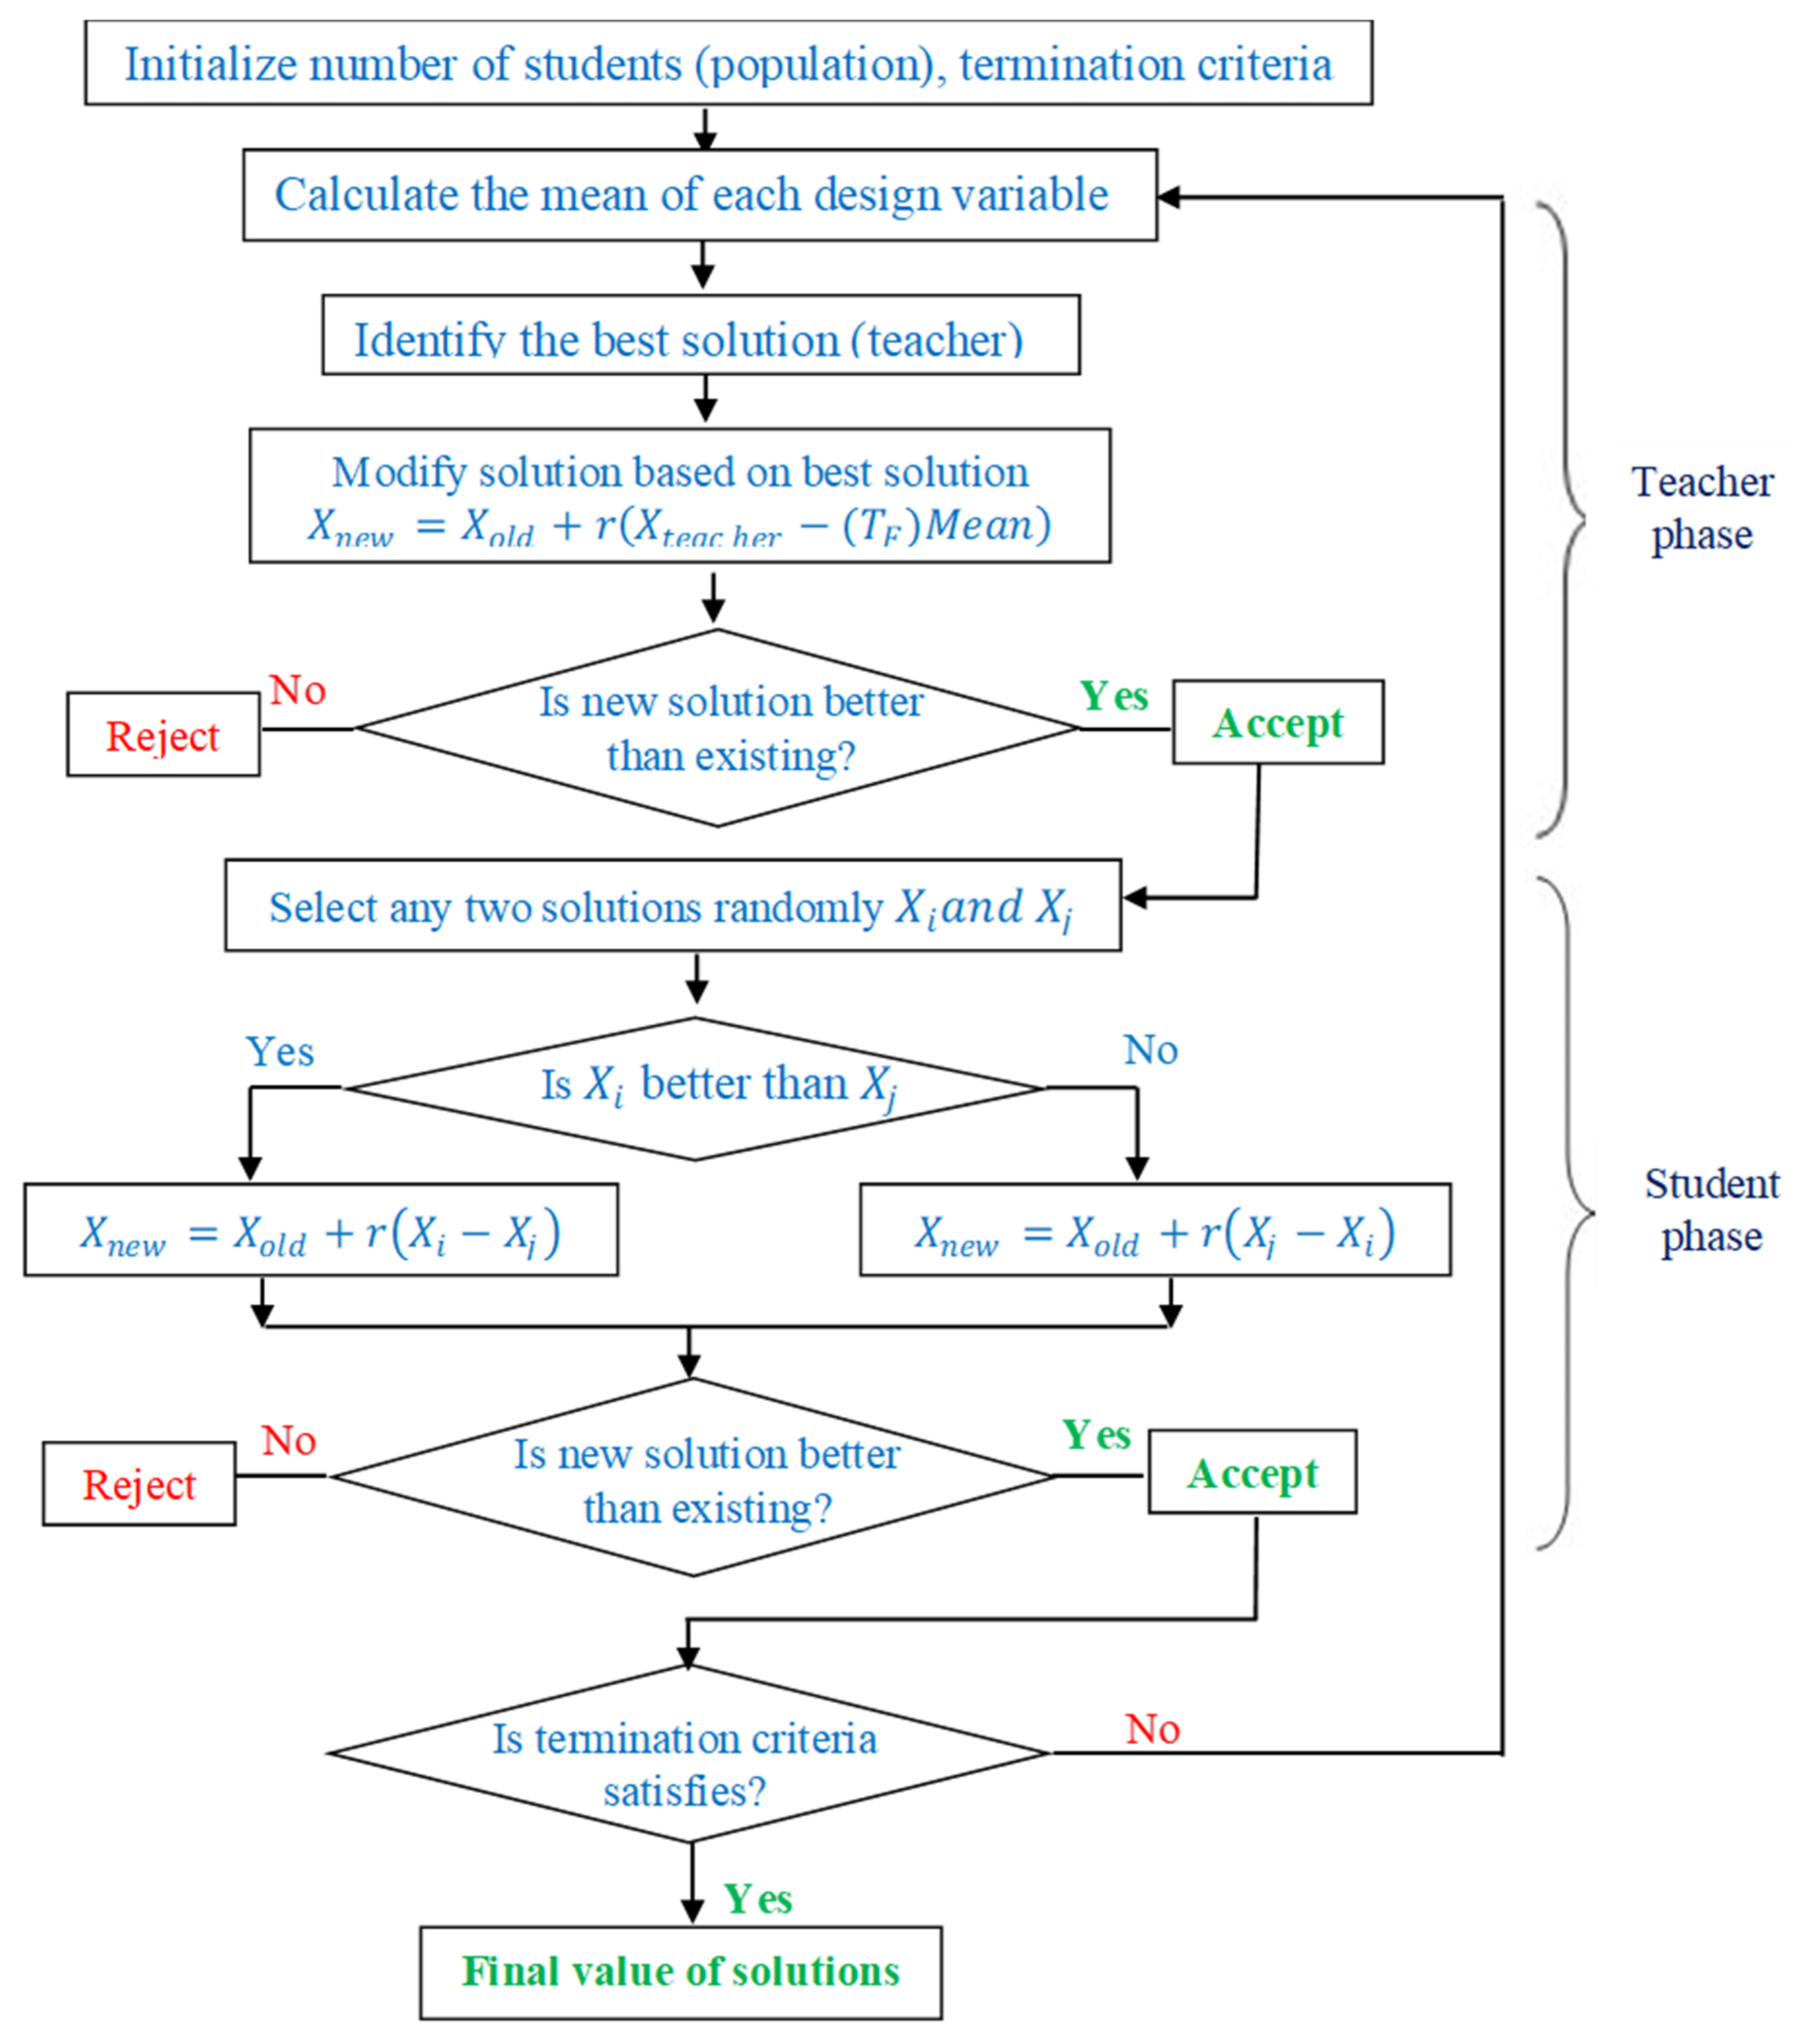
2.2. TLBO Algorithm
3. Results and Discussions
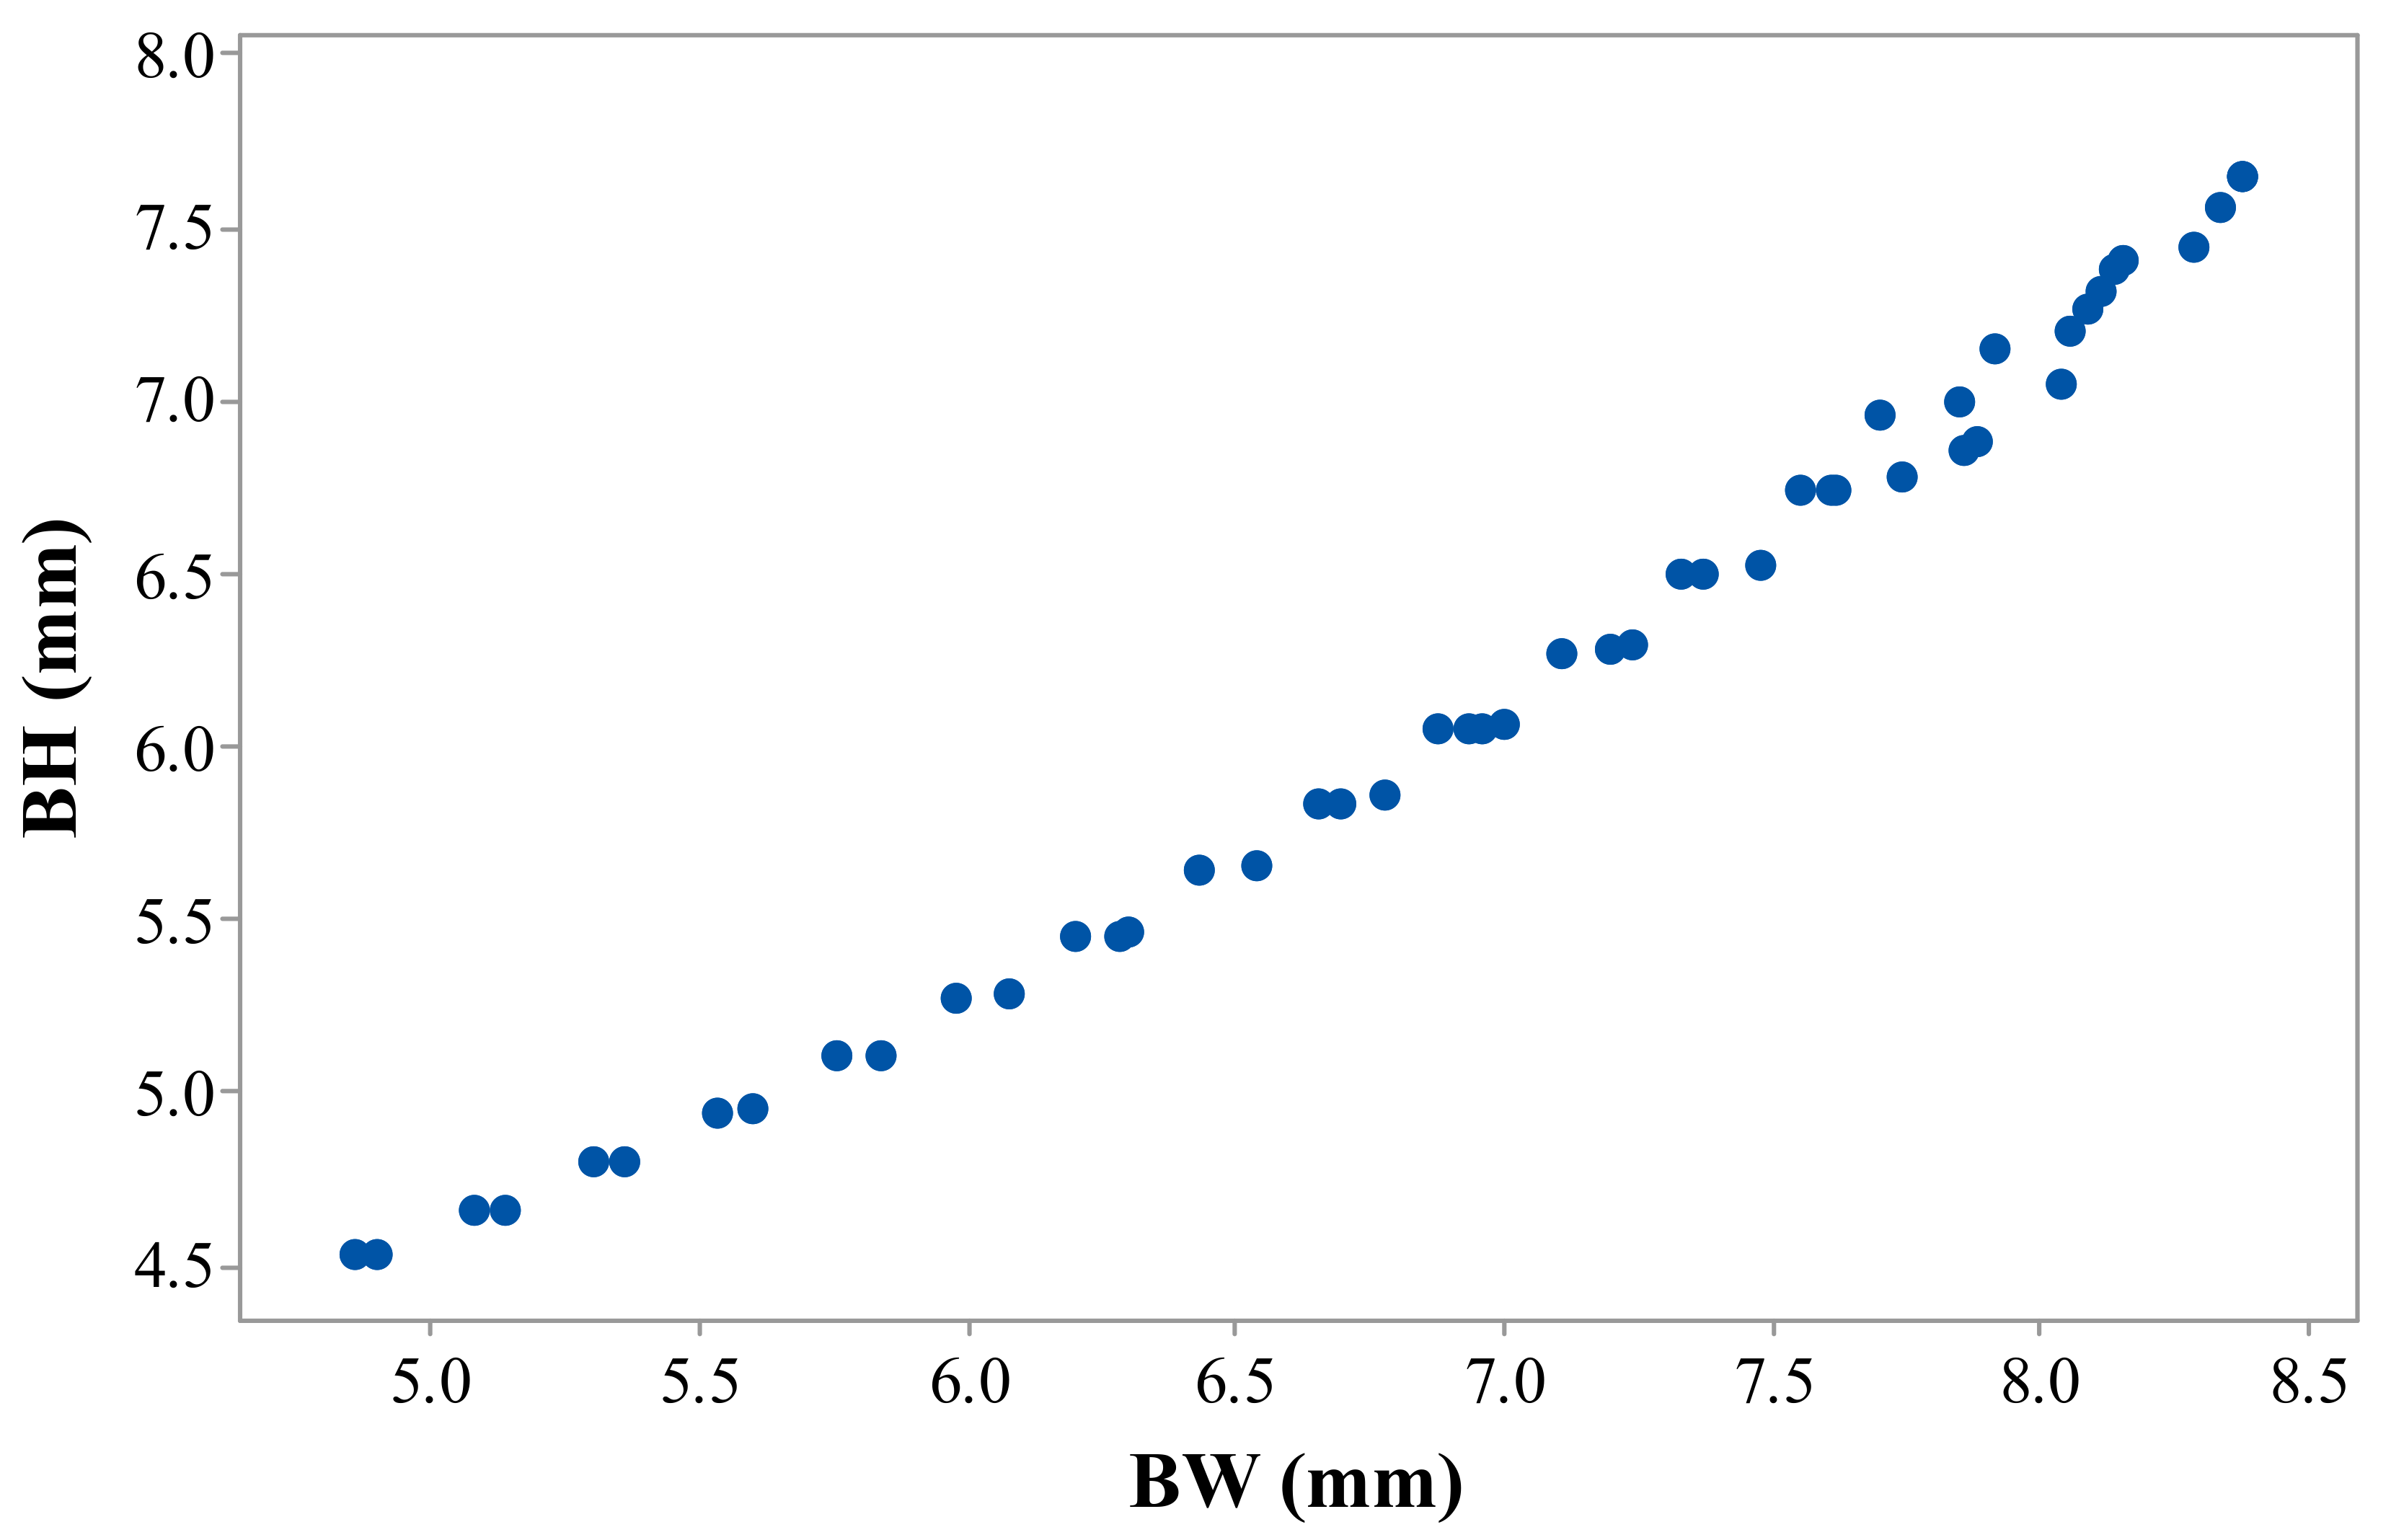
3.1. Mathematical Modelling and Analysis of Variance for BW and BH
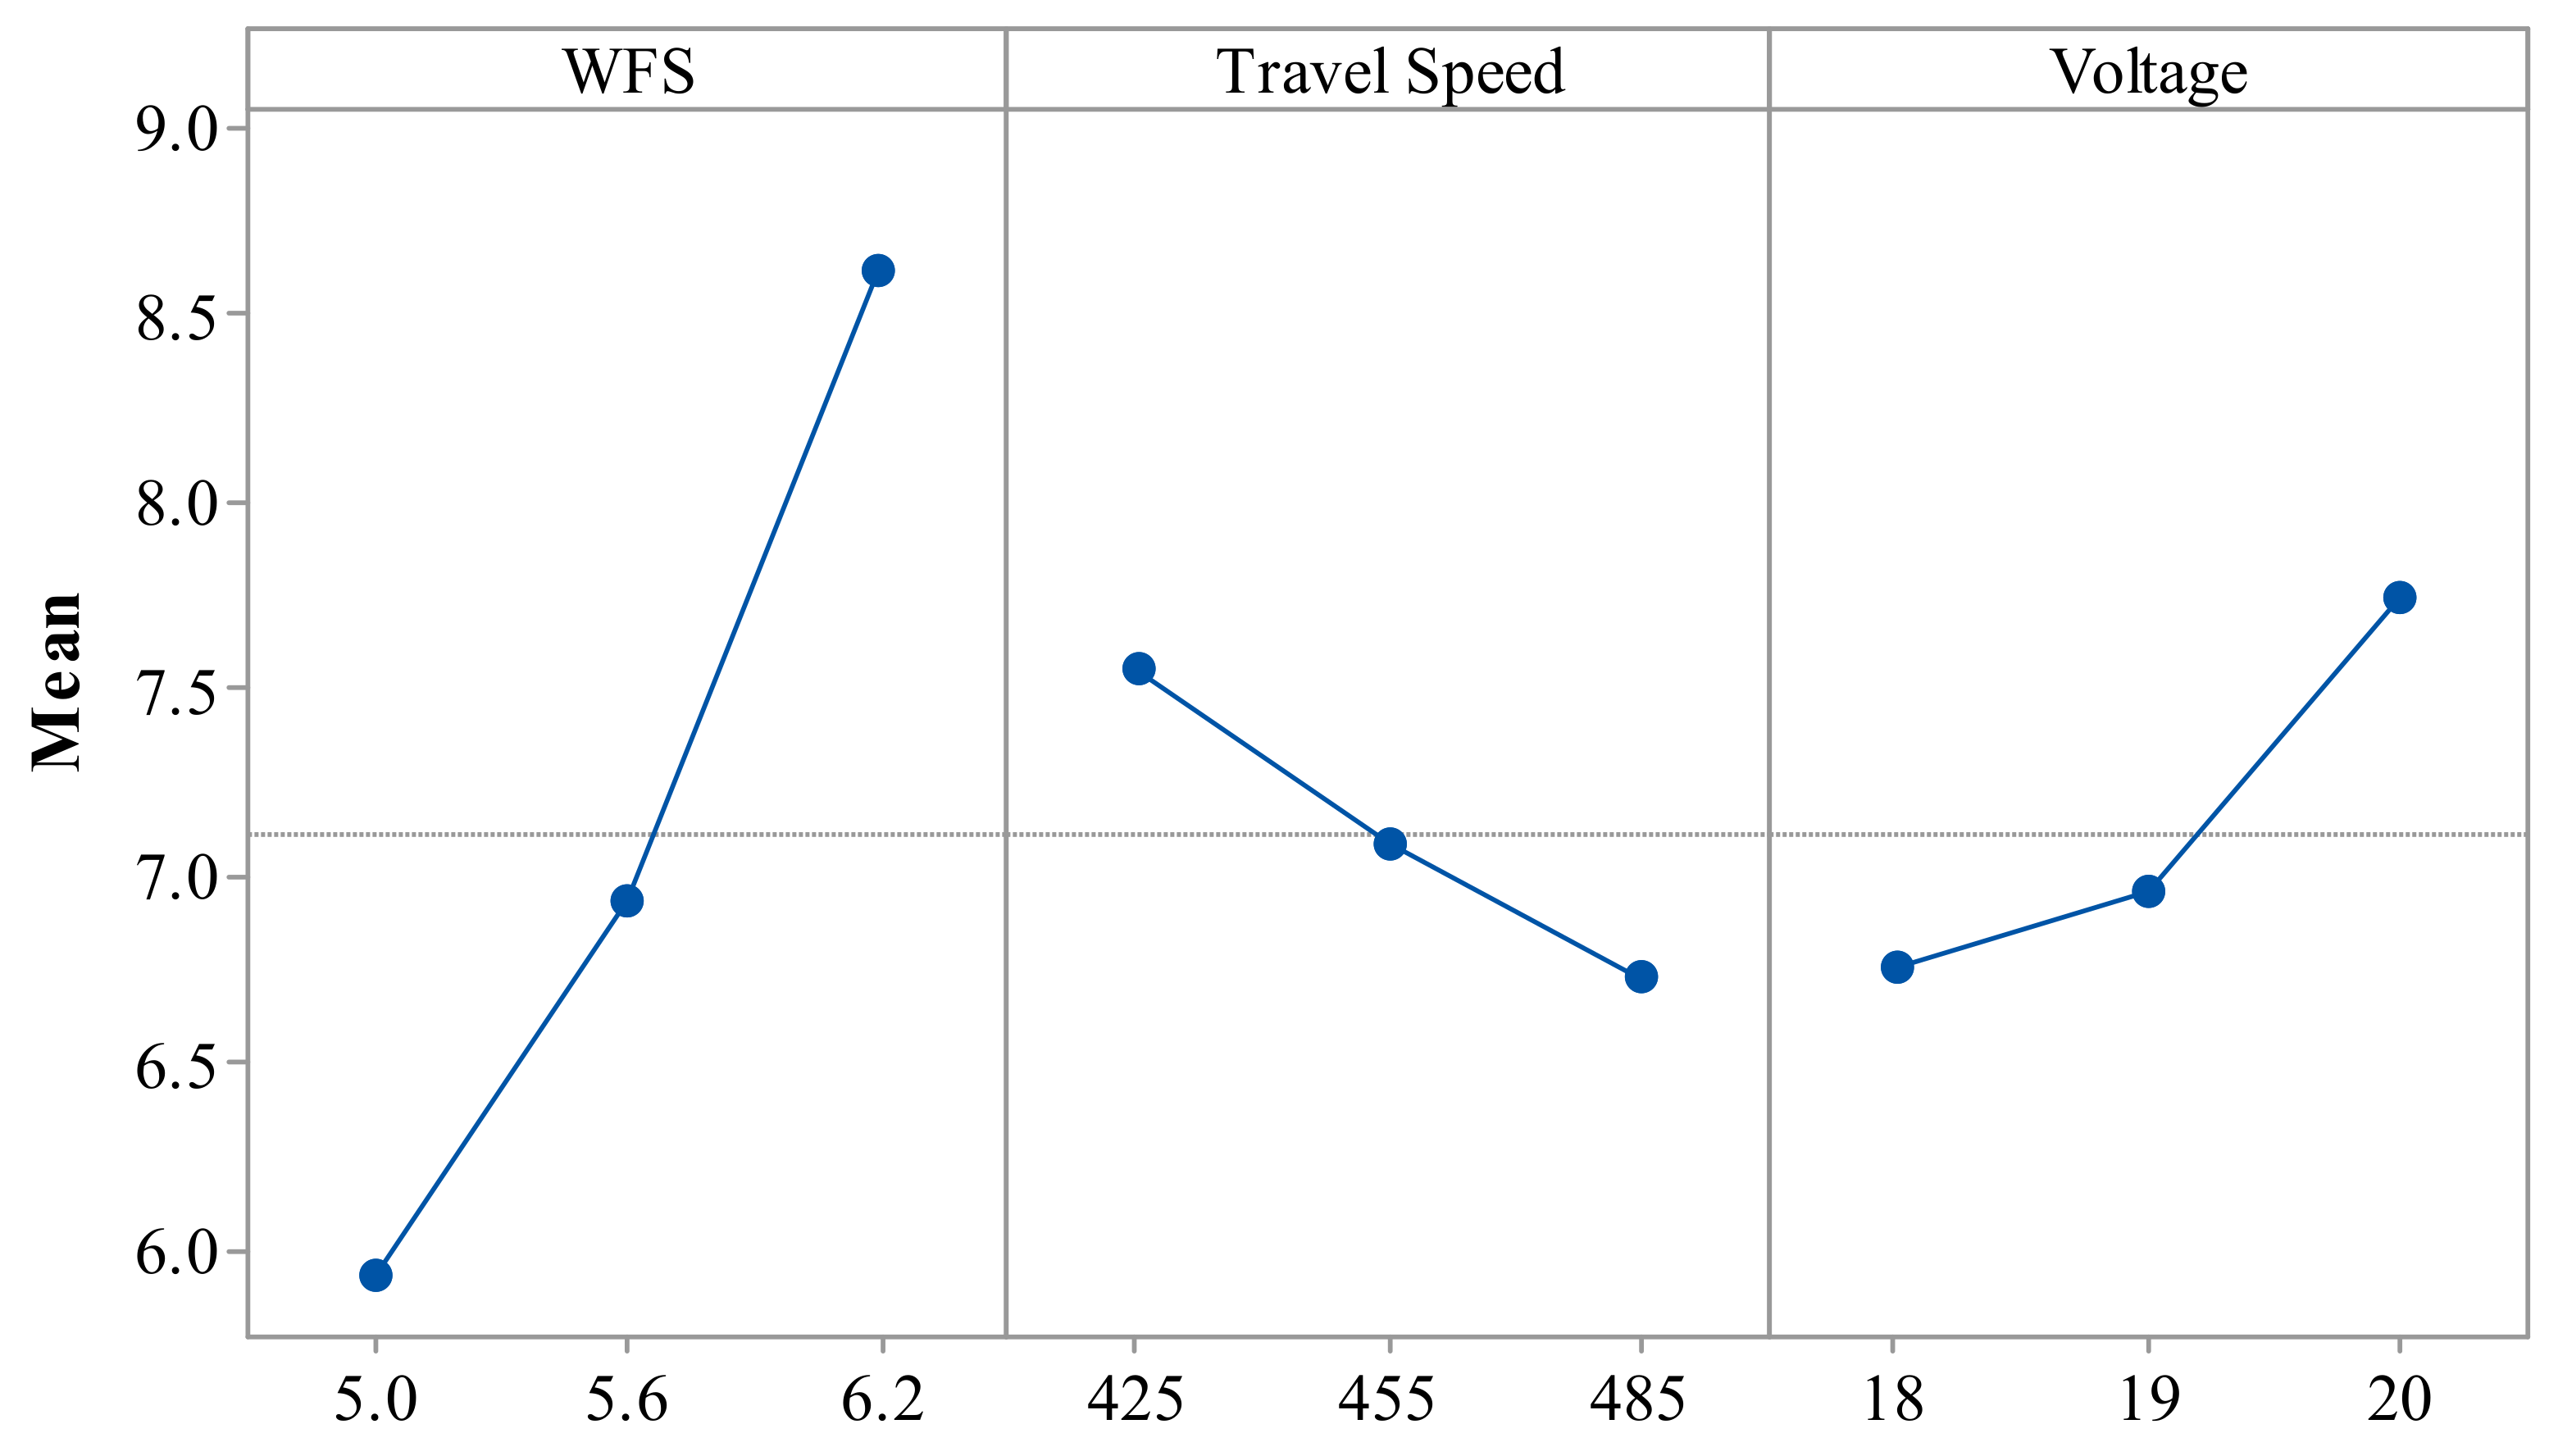
3.2. Main Effect Plots for BW and BH
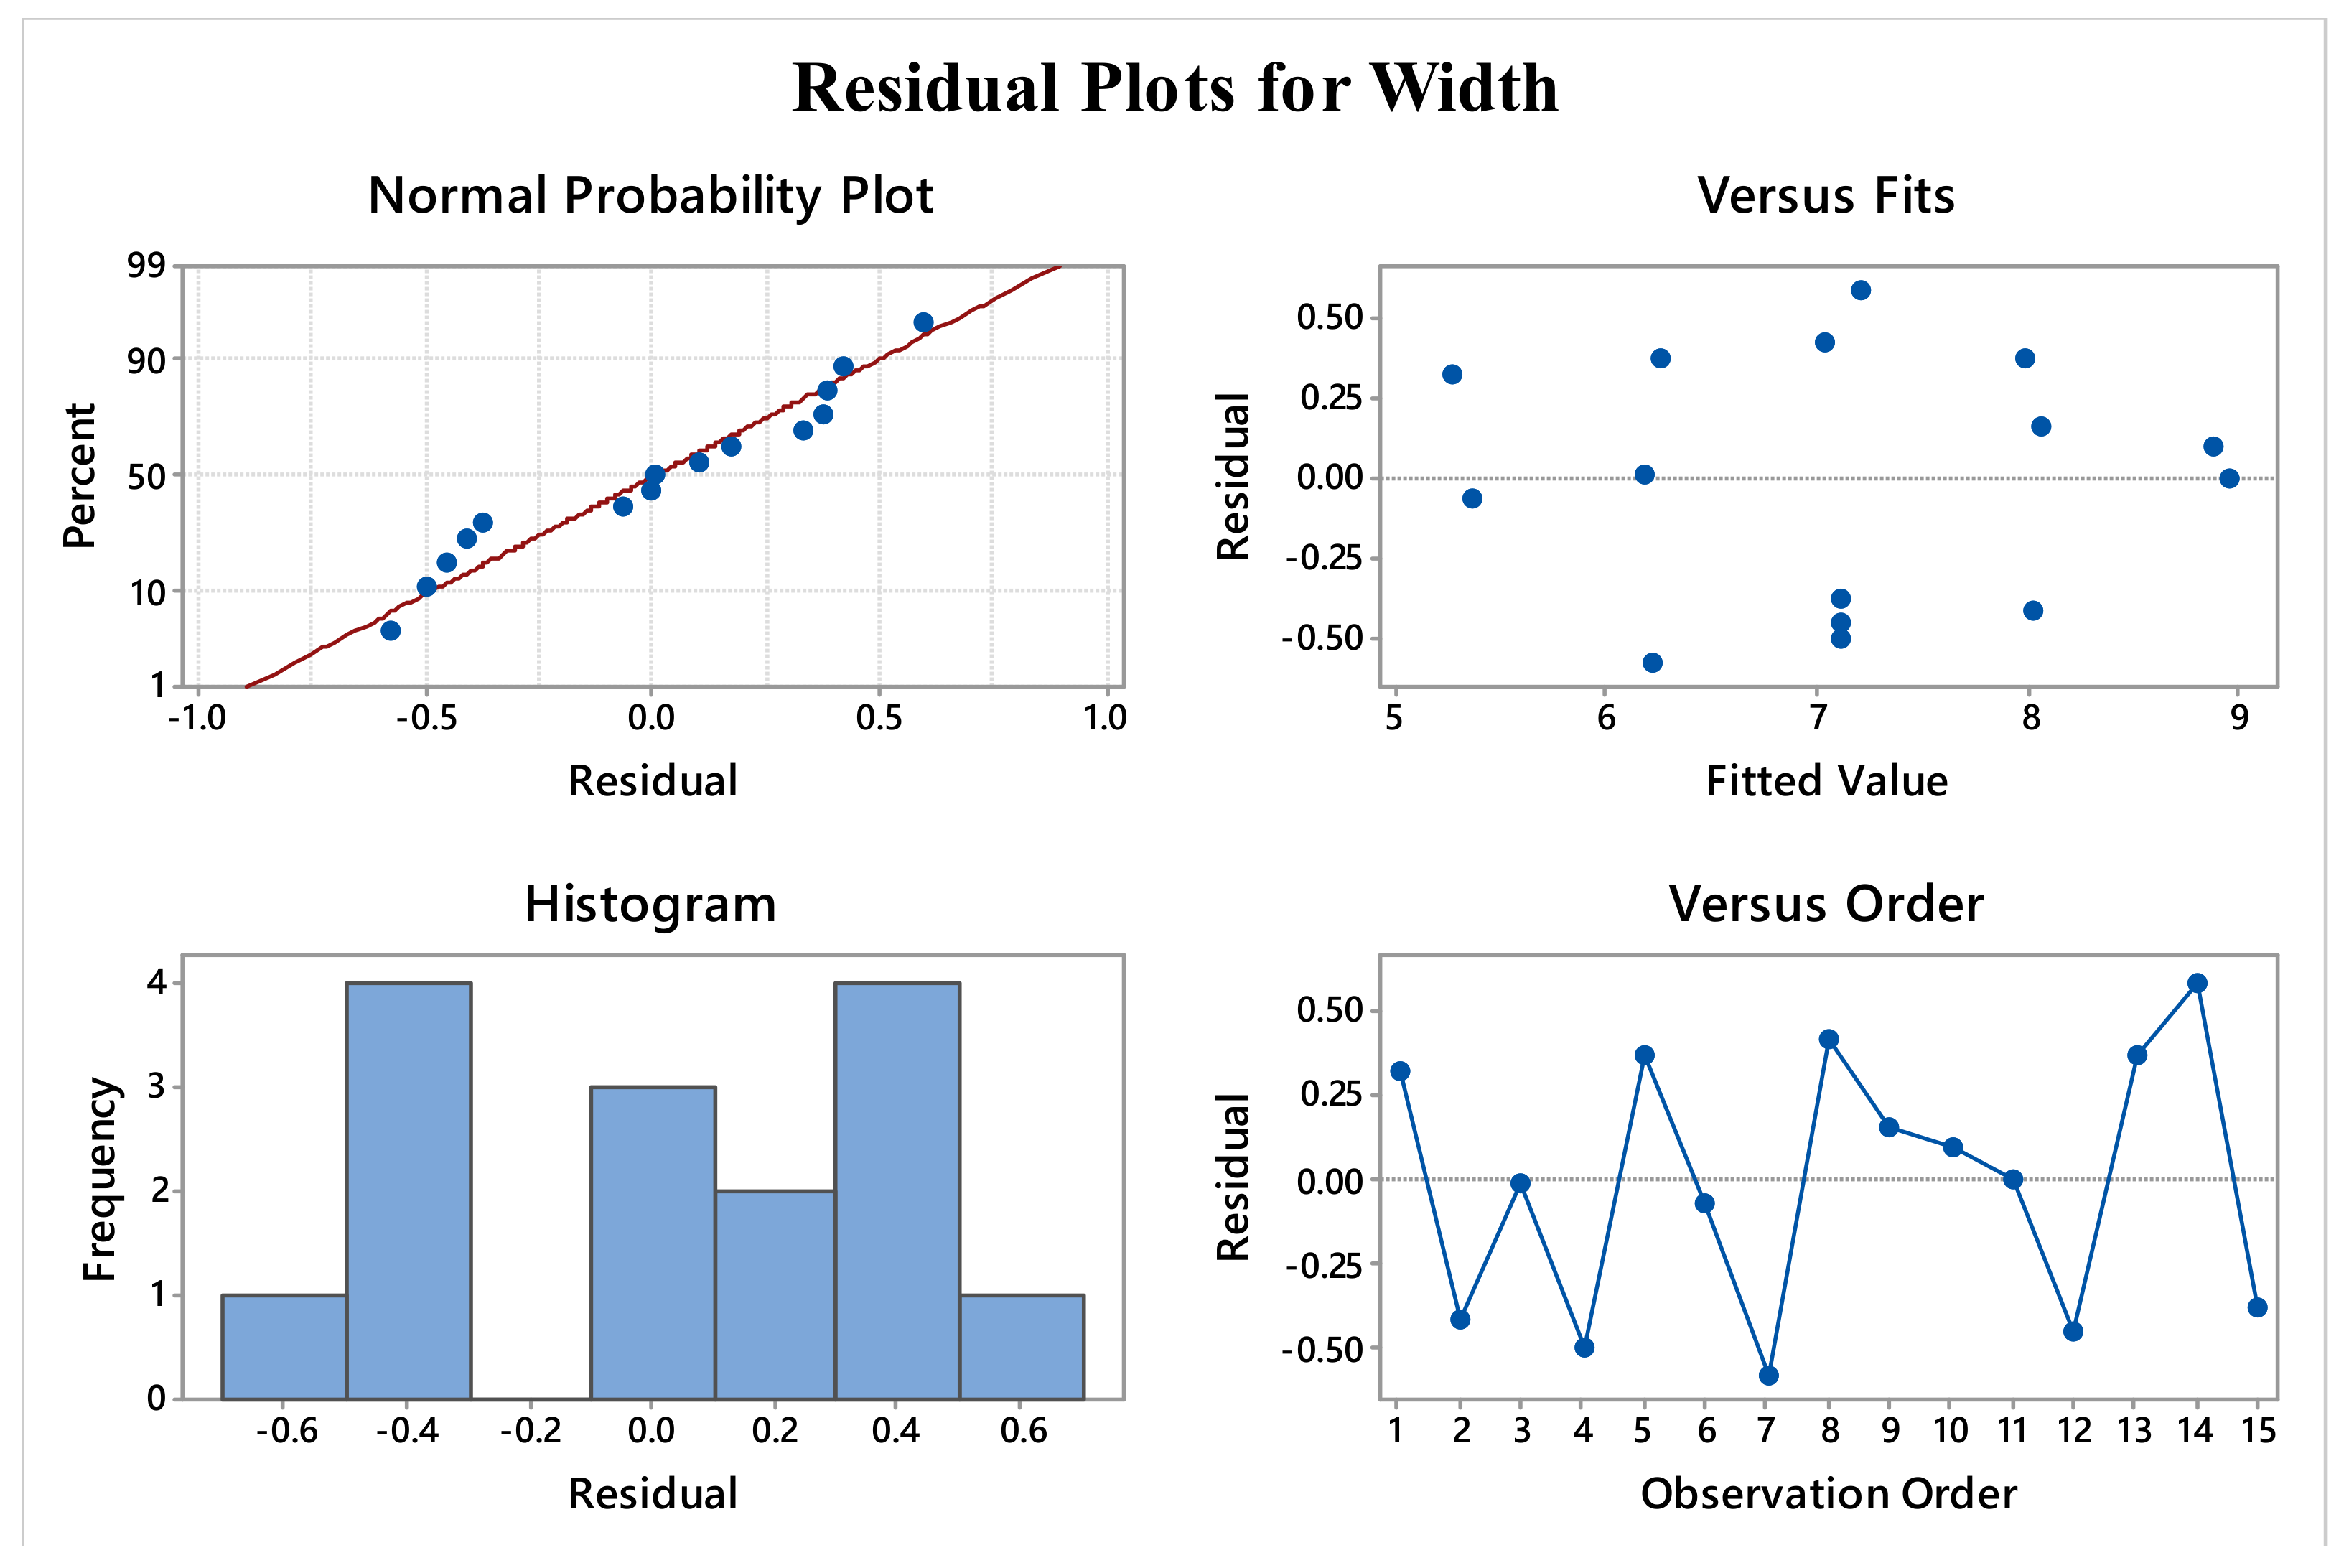
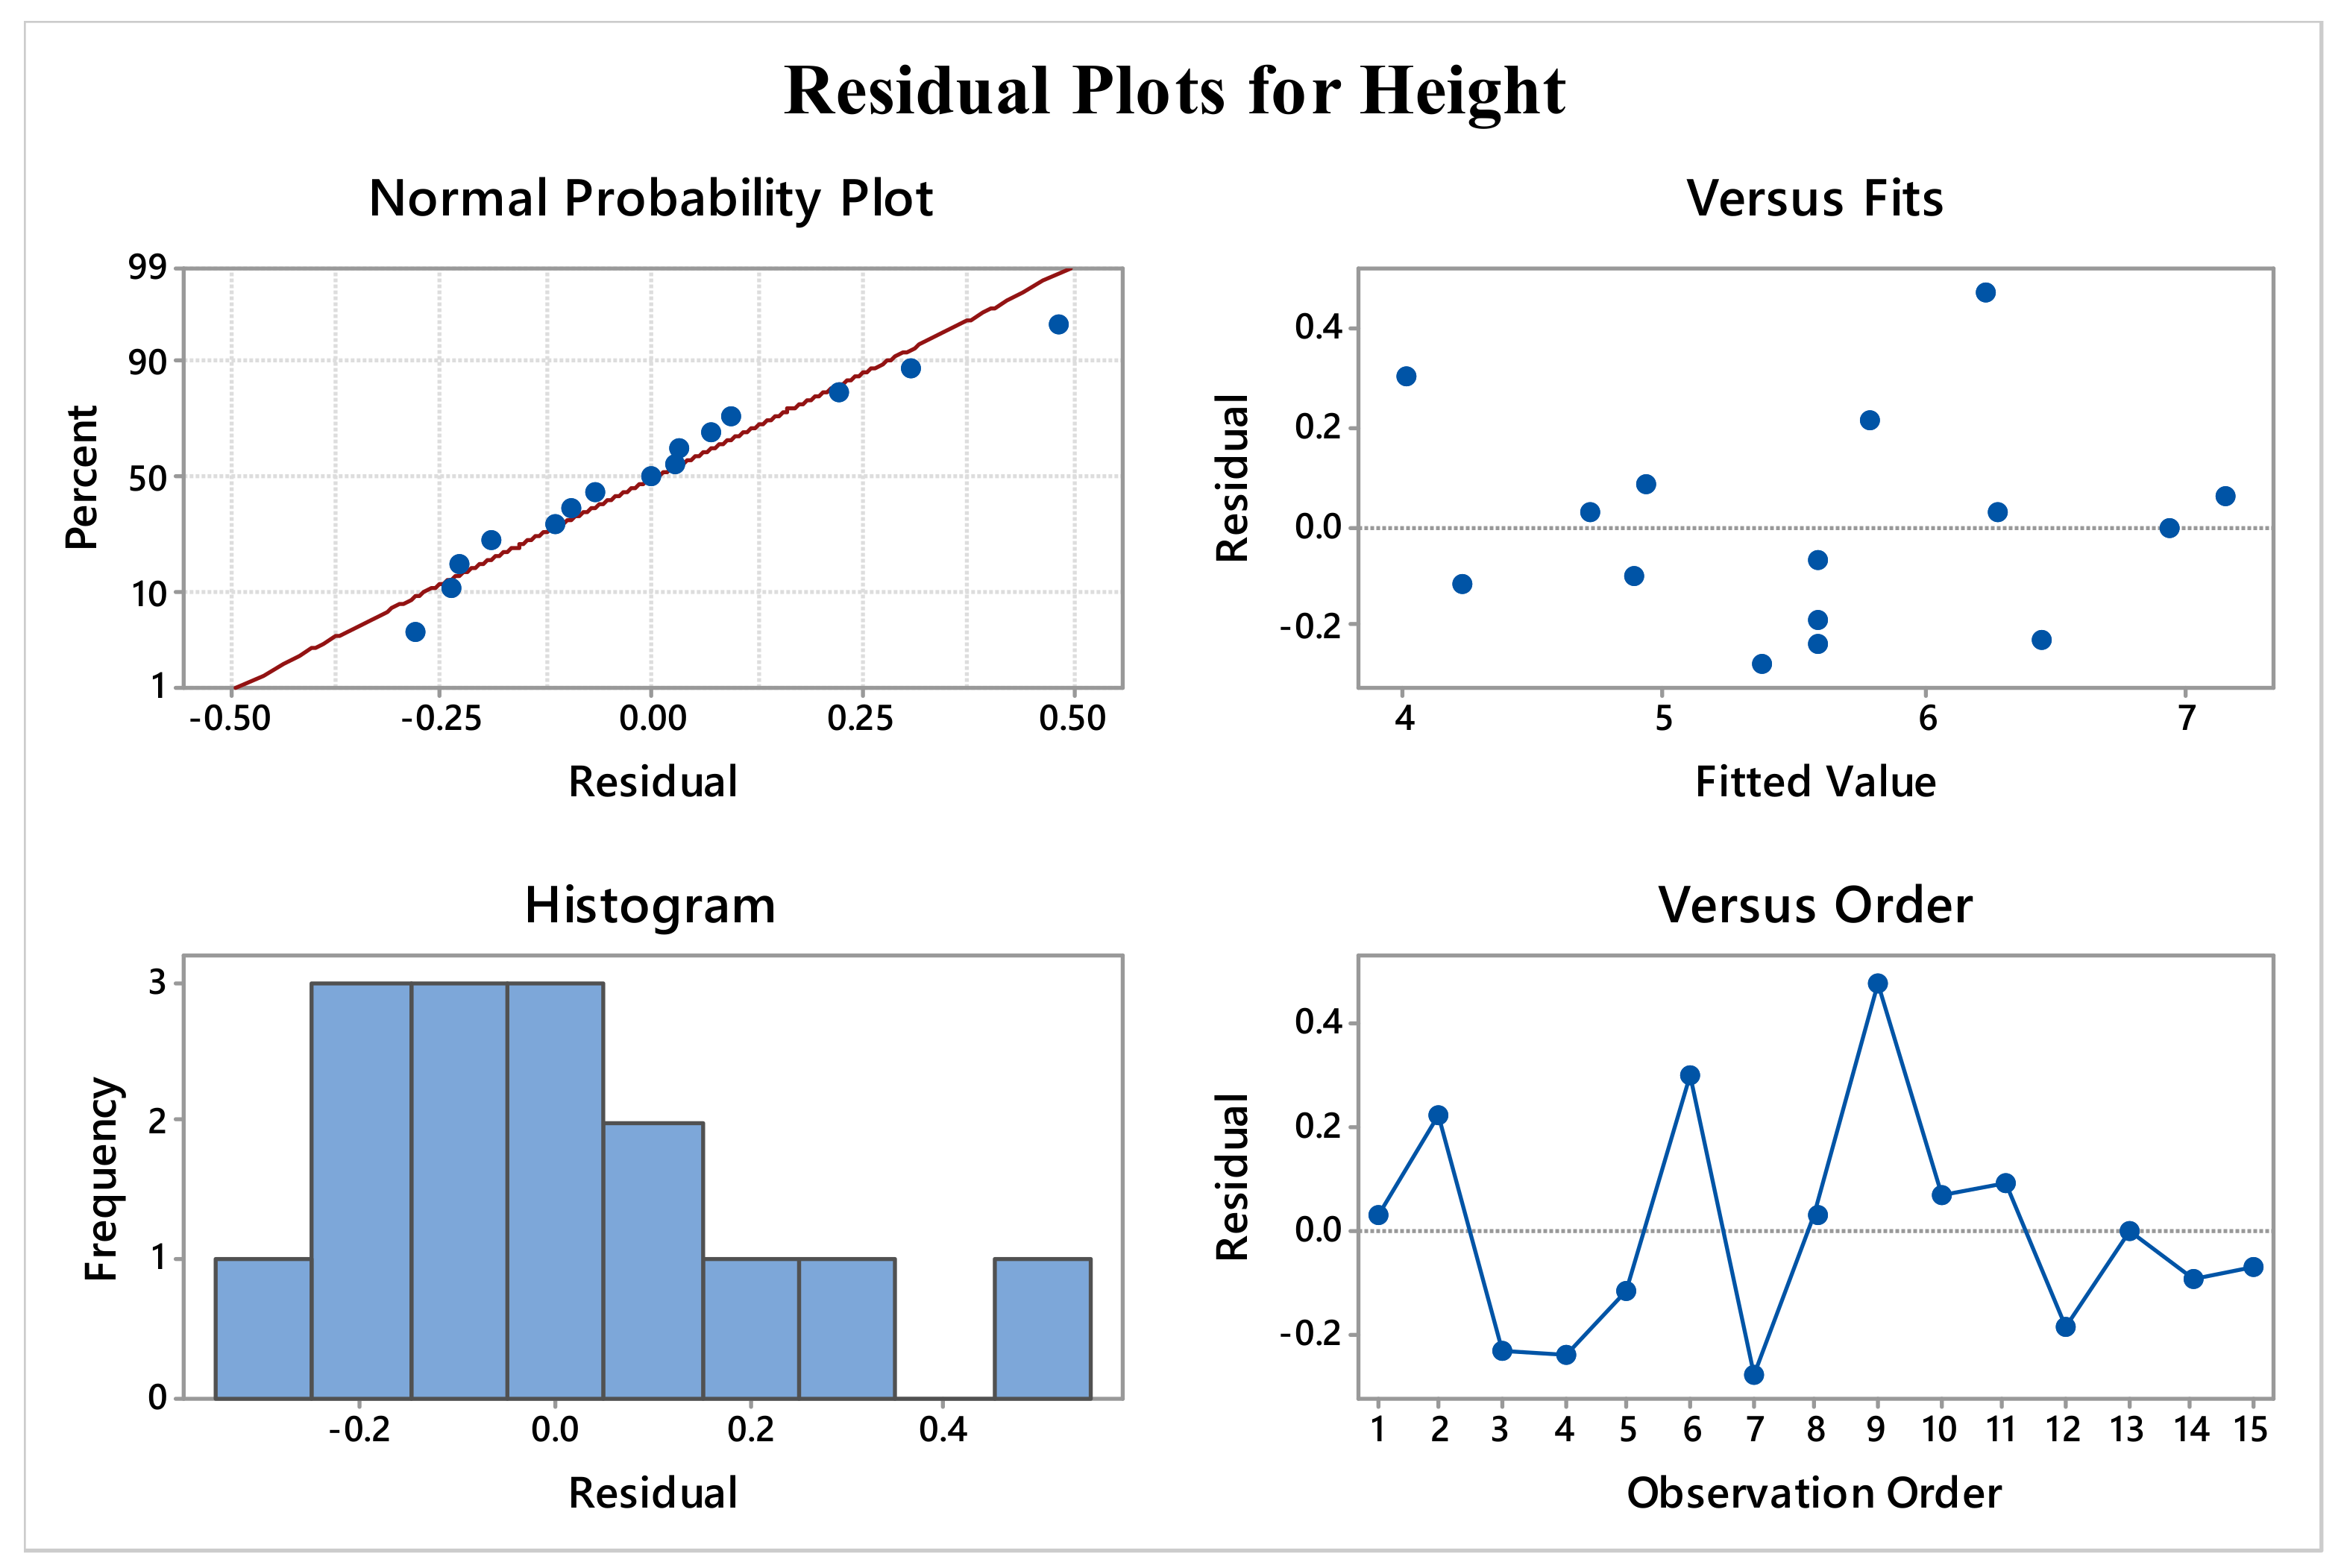
3.3. Residual Plots for BW and BH
3.4. Optimization Using TLBO Algorithm
4. Conclusions
- ANOVA was employed for statistical analysis. For BW, the regression model term, along with the linear, square, and interaction terms, was found to be significant, while the regression model term and a linear model had a significant impact on deciding the BH response. Multivariable correlations were developed through machining variables for selected responses of BW and BH. A normal probability plot yielded a good statistical analysis for ANOVA and a better future outcome of the proposed model.
- The non-significance of lack-of-fit for both BW and BH indicated that the obtained regression equations are adequate and reliable for the prediction of future values of BW and BH. The negligible deviance between R2 and Adj. R2 values for both BH and BW showed the fitness of the model for the present data and the prediction of new observations.
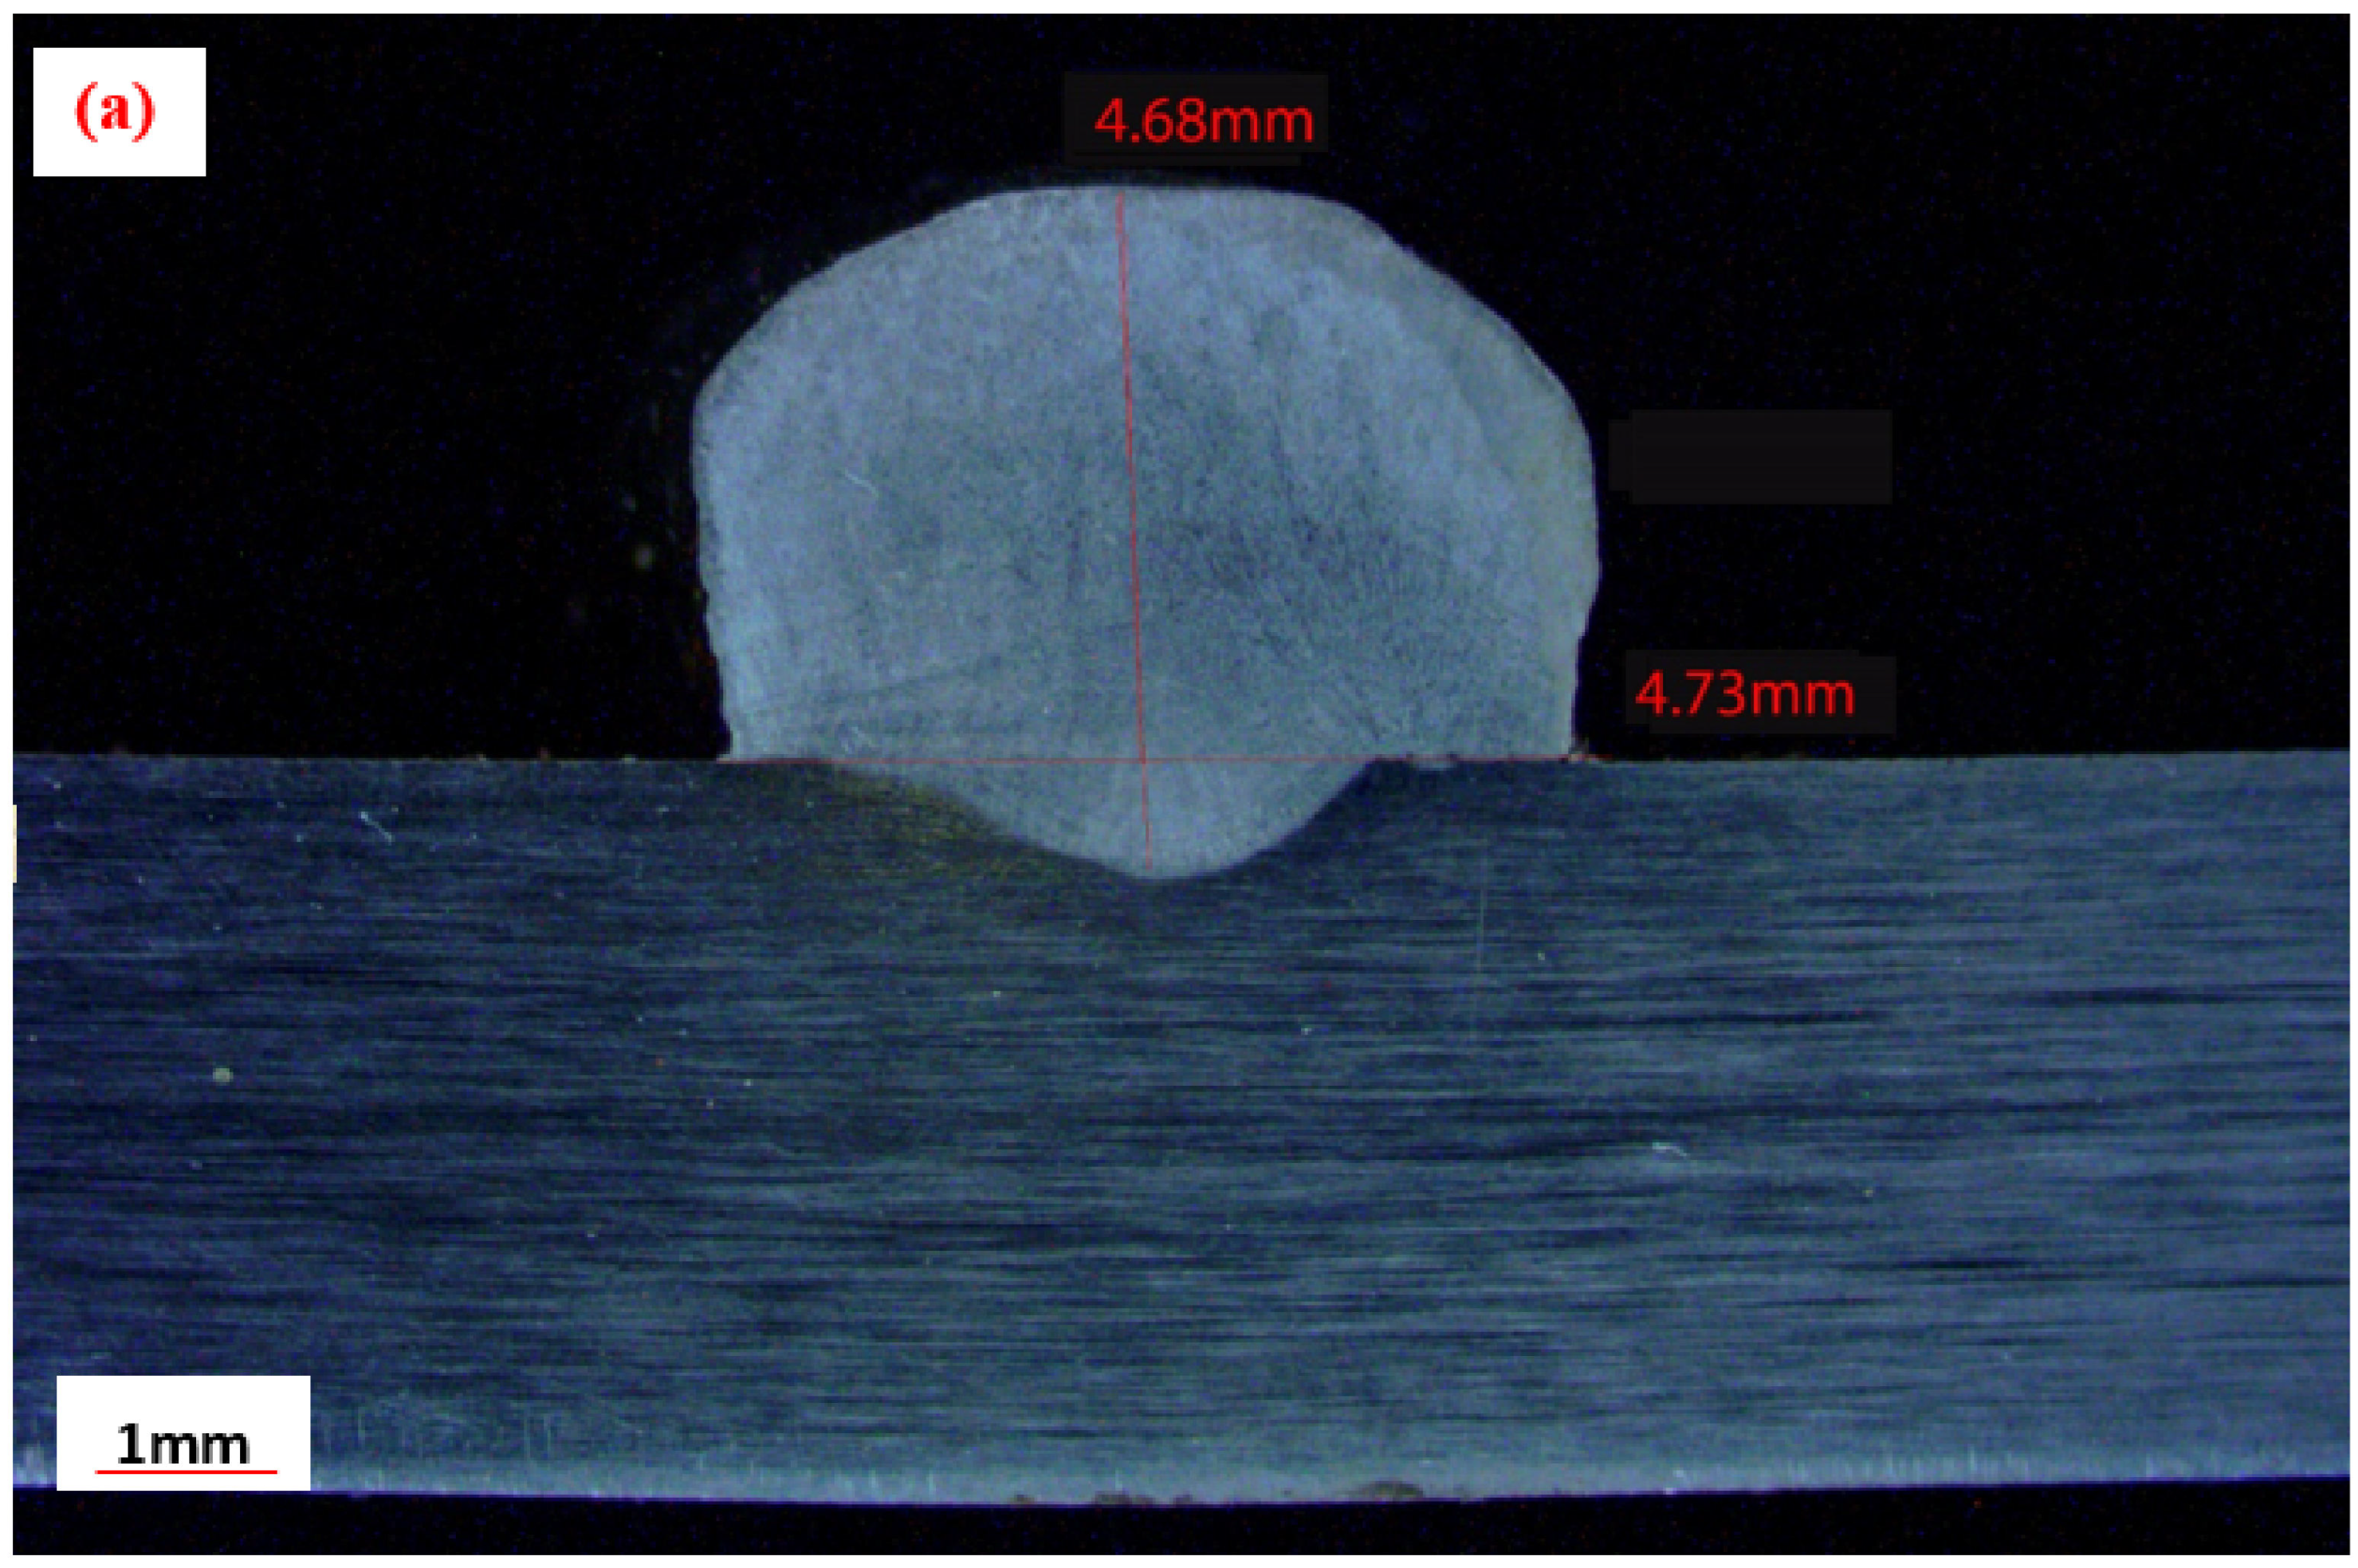
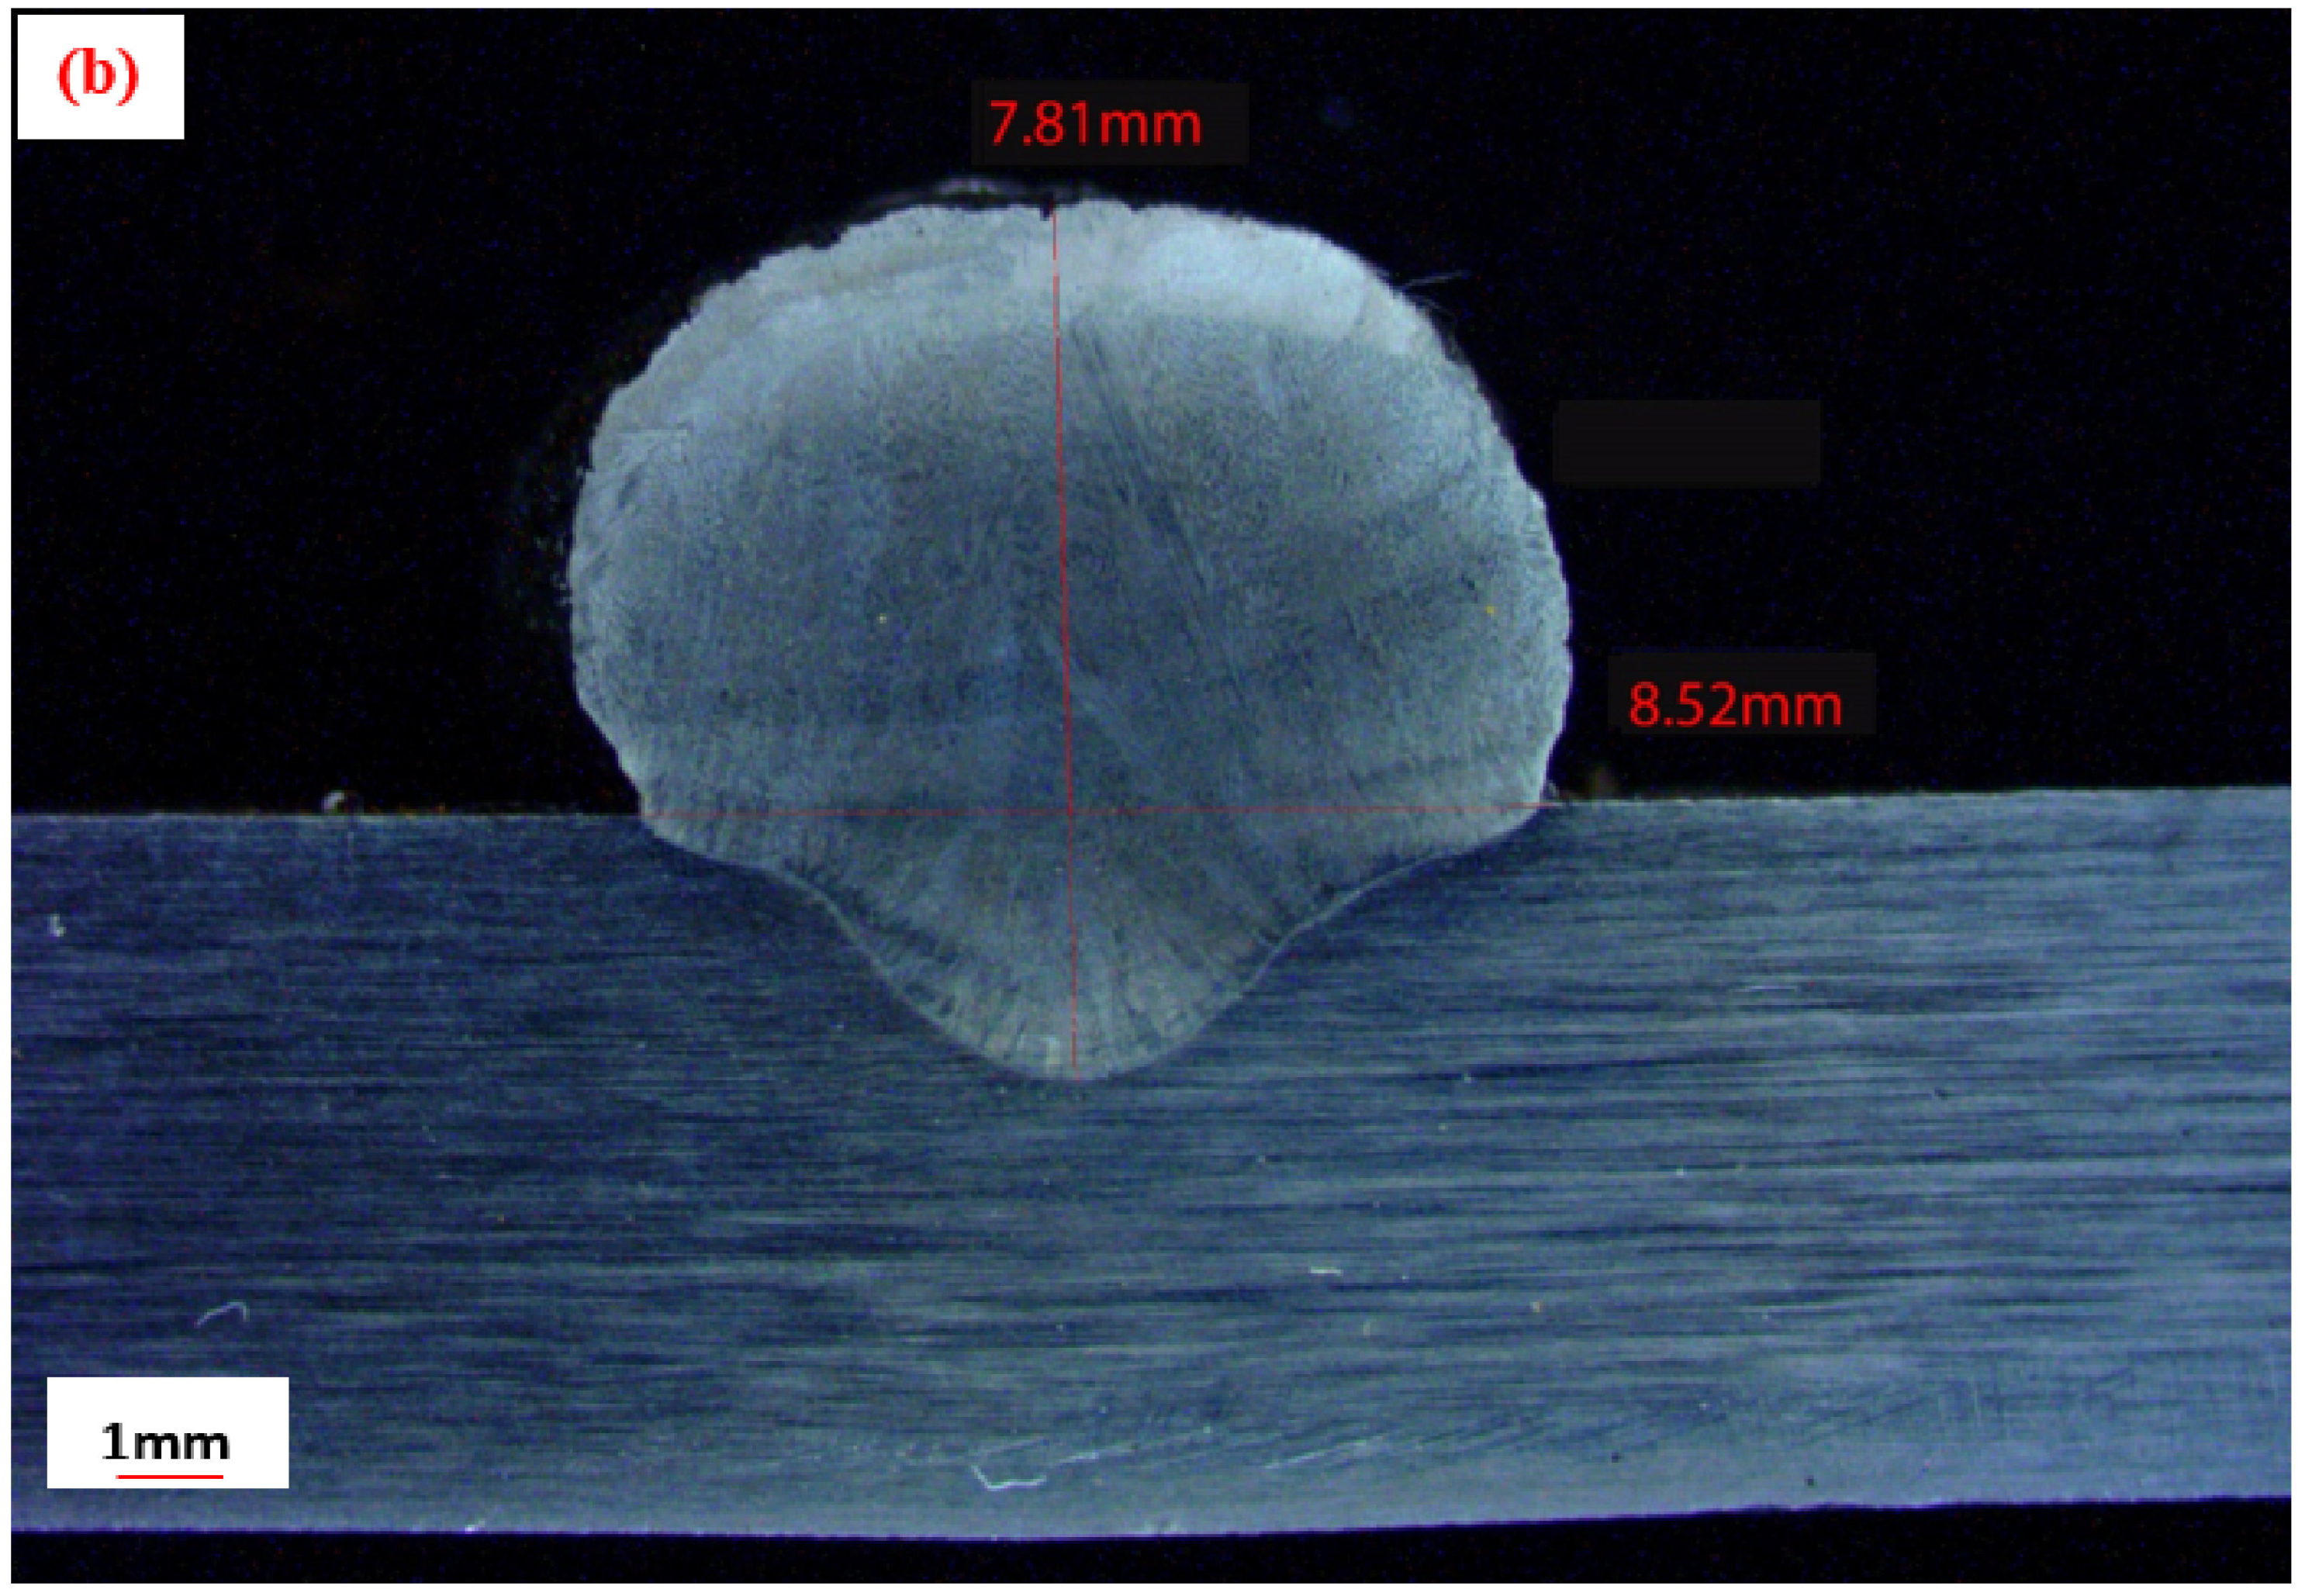
- The single-objective optimization results showed a maximum BH of 7.81 mm, and a minimum BW of 4.73 mm. Pareto fronts provided a trade-off between two competing objectives, and the operator has the option of selecting the appropriate Pareto point, depending on the specified values of BW, and BH.
- The comparison of the predicted and experimental values for the responses showed an acceptable error. This revealed the ability and suitability of the TLBO algorithm for the evaluation of required bead geometries using the GMAW-based WAAM process.
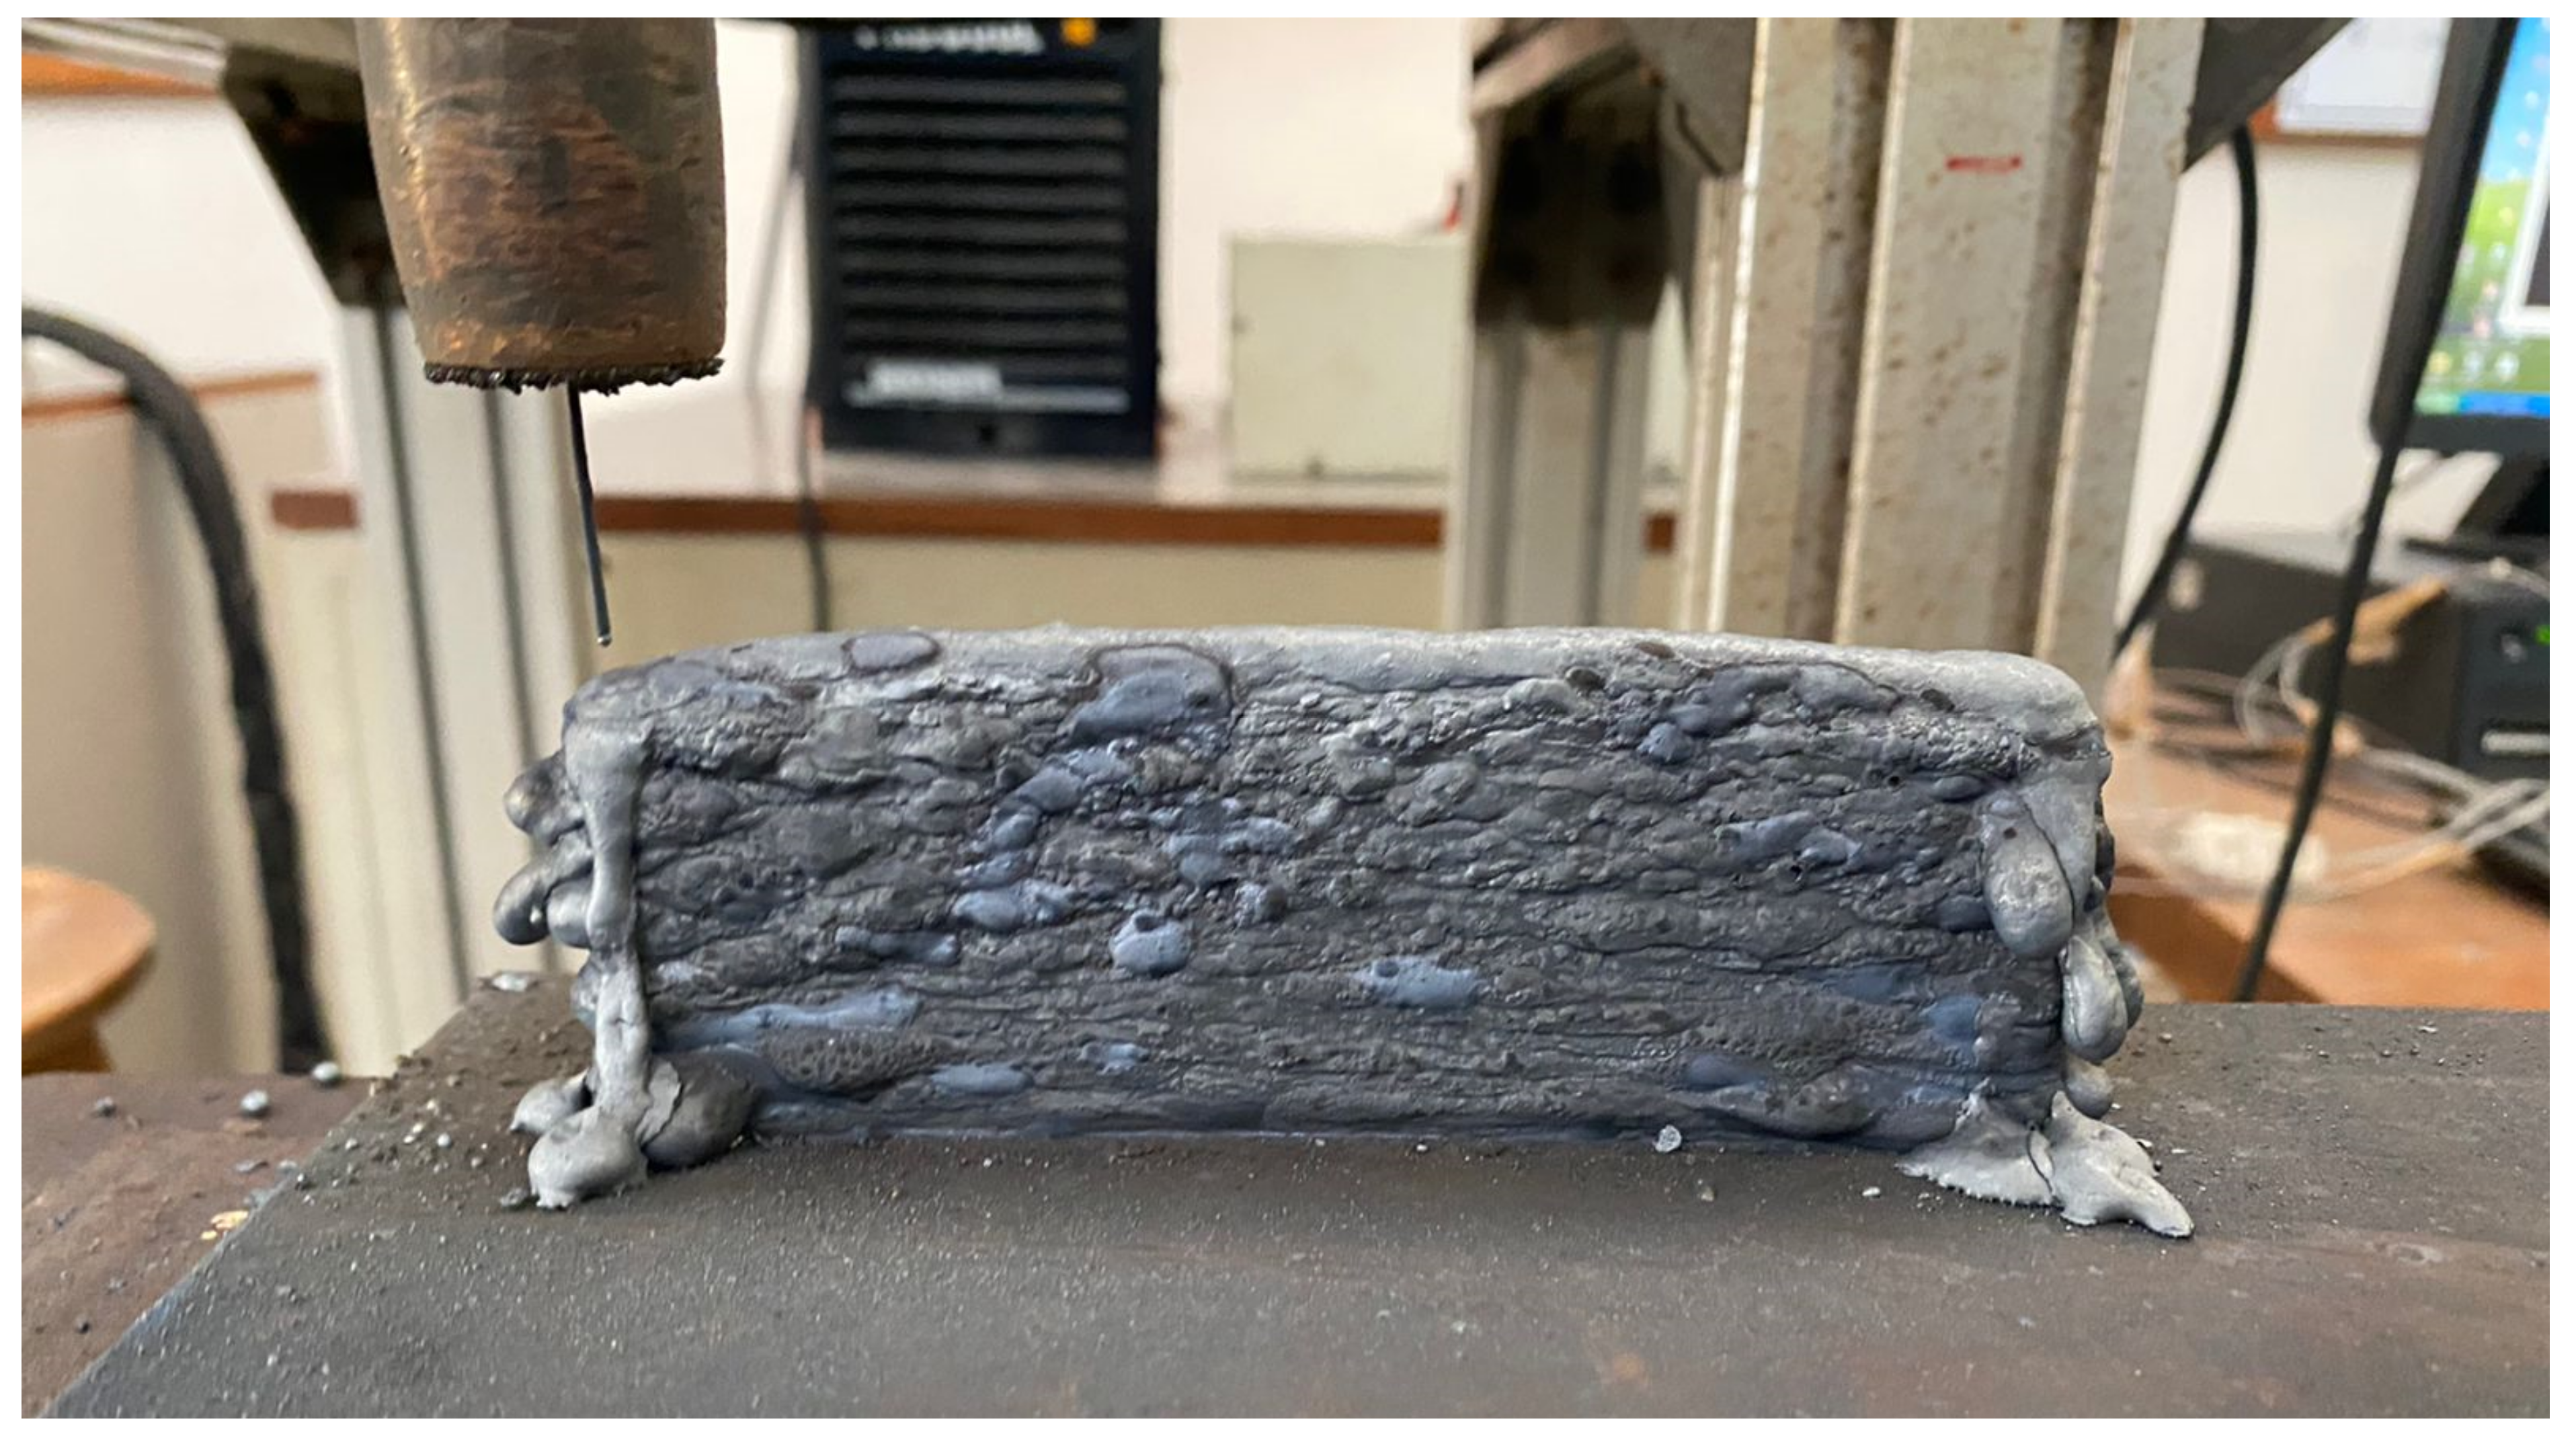
- A multi-layer structure free from any disbonding was successfully manufactured at the optimized variables. Based on the obtained results, the authors suggest that the optimum parametric settings would be beneficial for the deposition of layer-by-layer weld beads for the additive manufacturing of components.
Author Contributions
Funding
Institutional Review Board Statement
Informed Consent Statement
Data Availability Statement
Acknowledgments
Conflicts of Interest
References
- Rosli, N.A.; Alkahari, M.R.; bin Abdollah, M.F.; Maidin, S.; Ramli, F.R.; Herawan, S.G. Review on effect of heat input for wire arc additive manufacturing process. J. Mater. Res. Technol. 2021, 11, 2127–2145. [Google Scholar] [CrossRef]
- Kumar, A.; Maji, K. Selection of process parameters for near-net shape deposition in wire arc additive manufacturing by genetic algorithm. J. Mater. Eng. Perform. 2020, 29, 3334–3352. [Google Scholar] [CrossRef]
- Tomaz, I.d.V.; Colaço, F.H.G.; Sarfraz, S.; Pimenov, D.Y.; Gupta, M.K.; Pintaude, G. Investigations on quality characteristics in gas tungsten arc welding process using artificial neural network integrated with genetic algorithm. Int. J. Adv. Manuf. Technol. 2021, 113, 3569–3583. [Google Scholar] [CrossRef]
- Lee, S.H. Optimization of cold metal transfer-based wire arc additive manufacturing processes using gaussian process regression. Metals 2020, 10, 461. [Google Scholar] [CrossRef] [Green Version]
- Li, J.Z.; Alkahari, M.R.; Rosli, N.A.B.; Hasan, R.; Sudin, M.N.; Ramli, F.R. Review of wire arc additive manufacturing for 3D metal printing. Int. J. Autom. Technol. 2019, 13, 346–353. [Google Scholar] [CrossRef]
- Szost, B.A.; Terzi, S.; Martina, F.; Boisselier, D.; Prytuliak, A.; Pirling, T.; Hofmann, M.; Jarvis, D.J. A comparative study of additive manufacturing techniques: Residual stress and microstructural analysis of CLAD and WAAM printed Ti–6Al–4V components. Mater. Des. 2016, 89, 559–567. [Google Scholar] [CrossRef] [Green Version]
- Paskual, A.; Álvarez, P.; Suárez, A. Study on arc welding processes for high deposition rate additive manufacturing. Procedia CIRP 2018, 68, 358–362. [Google Scholar]
- Zhang, C.; Li, Y.; Gao, M.; Zeng, X. Wire arc additive manufacturing of Al-6Mg alloy using variable polarity cold metal transfer arc as power source. Mater. Sci. Eng. A 2018, 711, 415–423. [Google Scholar] [CrossRef]
- Ríos, S.; Colegrove, P.A.; Williams, S.W. Metal transfer modes in plasma Wire+ Arc additive manufacture. J. Mater. Process. Technol. 2019, 264, 45–54. [Google Scholar] [CrossRef]
- Busachi, A.; Erkoyuncu, J.; Colegrove, P.; Martina, F.; Ding, J. Designing a WAAM based manufacturing system for defence applications. Procedia CIRP 2015, 37, 48–53. [Google Scholar] [CrossRef] [Green Version]
- Lockett, H.; Ding, J.; Williams, S.; Martina, F. Design for Wire+ Arc Additive Manufacture: Design rules and build orientation selection. J. Eng. Des. 2017, 28, 568–598. [Google Scholar] [CrossRef] [Green Version]
- Yuan, L.; Ding, D.; Pan, Z.; Yu, Z.; Wu, B.; van Duin, S.; Li, H.; Li, W. Application of multidirectional robotic wire arc additive manufacturing process for the fabrication of complex metallic parts. IEEE Trans. Ind. Inform. 2019, 16, 454–464. [Google Scholar] [CrossRef]
- Srivastava, S.; Garg, R. Process parameter optimization of gas metal arc welding on IS: 2062 mild steel using response surface methodology. J. Manuf. Process. 2017, 25, 296–305. [Google Scholar] [CrossRef]
- Haden, C.; Zeng, G.; Carter III, F.; Ruhl, C.; Krick, B.; Harlow, D. Wire and arc additive manufactured steel: Tensile and wear properties. Addit. Manuf. 2017, 16, 115–123. [Google Scholar] [CrossRef]
- Das, S.; Vora, J.J.; Patel, V.; Li, W.; Andersson, J.; Pimenov, D.Y.; Giasin, K.; Wojciechowski, S. Experimental Investigation on welding of 2.25 Cr-1.0 Mo steel with Regulated Metal Deposition and GMAW technique incorporating metal-cored wires. J. Mater. Res. Technol. 2021, 15, 1007–1016. [Google Scholar] [CrossRef]
- Das, S.; Vora, J.; Patel, V.; Anderrson, J.; Pimenov, D.Y.; Giasin, K. Elucidating the Effect of Step Cooling Heat Treatment on the Properties of 2.25 Cr–1.0 Mo Steel Welded with a Combination of GMAW Techniques Incorporating Metal-Cored Wires. Materials 2021, 14, 6033. [Google Scholar] [CrossRef]
- Buscemi, C.; Jack, B.; Skogsberg, J.; Erwin, W. Temper embrittlement in 2-1/4 Cr-1 Mo steels after 75,000-hour isothermal aging. J. Eng. Mater. Technol. 1991, 113, 329–335. [Google Scholar] [CrossRef]
- Rubio-Ramirez, C.; Giarollo, D.F.; Mazzaferro, J.E.; Mazzaferro, C.P. Prediction of angular distortion due GMAW process of thin-sheets Hardox 450® steel by numerical model and artificial neural network. J. Manuf. Process. 2021, 68, 1202–1213. [Google Scholar] [CrossRef]
- Yang, K.; Wang, F.; Duan, D.; Zhang, T.; Luo, C.; Cressault, Y.; Yu, Z.; Yang, L.; Li, H. Experimental Investigation of Integrated Circular Triple-Wire Pulse GMAW of Q960E High-Strength Steel for Construction Machinery. Materials 2021, 14, 375. [Google Scholar] [CrossRef]
- Zhang, X.-Y.; Zha, X.-Q.; Gao, L.-Q.; Hei, P.-H.; Ren, Y.-F. Influence of Shielding Gas on Microstructure and Properties of GMAW DSS2205 Welded Joints. Materials 2021, 14, 2671. [Google Scholar] [CrossRef]
- Mičian, M.; Winczek, J.; Gucwa, M.; Koňár, R.; Málek, M.; Postawa, P. Investigation of Welds and Heat Affected Zones in Weld Surfacing Steel Plates Taking into Account the Bead Sequence. Materials 2020, 13, 5666. [Google Scholar] [CrossRef]
- Prajapati, P.; Badheka, V.J.; Mehta, K.P. Hybridization of filler wire in multi-pass gas metal arc welding of SA516 Gr70 carbon steel. Mater. Manuf. Process. 2018, 33, 315–322. [Google Scholar] [CrossRef]
- Czupryński, A. Comparison of properties of hardfaced layers made by a metal-core-covered tubular electrode with a special chemical composition. Materials 2020, 13, 5445. [Google Scholar] [CrossRef] [PubMed]
- Hu, Z.; Qin, X.; Li, Y.; Ni, M. Welding parameters prediction for arbitrary layer height in robotic wire and arc additive manufacturing. J. Mech. Sci. Technol. 2020, 34, 1683–1695. [Google Scholar] [CrossRef]
- Wang, L.; Xue, J.; Wang, Q. Correlation between arc mode, microstructure, and mechanical properties during wire arc additive manufacturing of 316L stainless steel. Mater. Sci. Eng. A 2019, 751, 183–190. [Google Scholar] [CrossRef]
- Wahsh, L.; ElShater, A.; Mansour, A.; Hamdy, F.; Turky, M.; Azzam, M.; Salem, H. Parameter selection for wire arc additive manufacturing (WAAM) process. Mater. Sci. Technol. 2018, 78–85. [Google Scholar]
- Kumar, V.; Mandal, A.; Das, A.K.; Kumar, S. Parametric study and characterization of wire arc additive manufactured steel structures. Int. J. Adv. Manuf. Technol. 2021, 115, 1723–1733. [Google Scholar] [CrossRef]
- Patel, V.K.; Savsani, V.J. A multi-objective improved teaching–learning based optimization algorithm (MO-ITLBO). Inf. Sci. 2016, 357, 182–200. [Google Scholar] [CrossRef]
- Vora, J.; Chaudhari, R.; Patel, C.; Pimenov, D.Y.; Patel, V.K.; Giasin, K.; Sharma, S. Experimental Investigations and Pareto Optimization of Fiber Laser Cutting Process of Ti6Al4V. Metals 2021, 11, 1461. [Google Scholar] [CrossRef]
- Chaudhari, R.; Vora, J.J.; Prabu, S.; Palani, I.; Patel, V.K.; Parikh, D. Pareto optimization of WEDM process parameters for machining a NiTi shape memory alloy using a combined approach of RSM and heat transfer search algorithm. Adv. Manuf. 2021, 9, 64–80. [Google Scholar] [CrossRef]
- Vora, J.; Patel, V.K.; Srinivasan, S.; Chaudhari, R.; Pimenov, D.Y.; Giasin, K.; Sharma, S. Optimization of activated tungsten inert gas welding process parameters using heat transfer search algorithm: With experimental validation using case studies. Metals 2021, 11, 981. [Google Scholar] [CrossRef]
- Pan, Z.; Ding, D.; Wu, B.; Cuiuri, D.; Li, H.; Norrish, J. Arc welding processes for additive manufacturing: A review. In Transactions on Intelligent Welding Manufacturing; Springer: Singapore, 2018; pp. 3–24. [Google Scholar] [CrossRef]
- Wu, B.; Pan, Z.; Ding, D.; Cuiuri, D.; Li, H.; Xu, J.; Norrish, J. A review of the wire arc additive manufacturing of metals: Properties, defects and quality improvement. J. Manuf. Process. 2018, 35, 127–139. [Google Scholar] [CrossRef]
- Thakur, P.; Chapgaon, A. A review on effects of GTAW process parameters on weld. IJRASET 2016, 4, 136–140. [Google Scholar]
- Mistry, P.J. Effect of process parameters on bead geometry and shape relationship of gas metal arc weldments. Int. J. Adv. Res. Mech. Eng. Technol. 2016, 2, 24–27. [Google Scholar]
- Xu, W.; Lin, S.; Fan, C.; Yang, C. Prediction and optimization of weld bead geometry in oscillating arc narrow gap all-position GMA welding. Int. J. Adv. Manuf. Technol. 2015, 79, 183–196. [Google Scholar] [CrossRef]
- Fuse, K.; Chaudhari, R.; Vora, J.; Patel, V.K.; de Lacalle, L.N.L. Multi-Response Optimization of Abrasive Waterjet Machining of Ti6Al4V Using Integrated Approach of Utilized Heat Transfer Search Algorithm and RSM. Materials 2021, 14, 7746. [Google Scholar] [CrossRef]


| Grade | Cr | Mn | Mo | C | Si | S | Fe |
|---|---|---|---|---|---|---|---|
| 1.25 Cr-0.5 Mo | 1.1–1.5 | 0.4–0.66 | 0.45–0.65 | 0.05–0.17 | 0.50–0.80 | 0.025 | Balance |
| Metal-cored wire | 1.25 | 0.78 | 0.47 | 0.07 | 0.42 | Balance |
| Parameter | Values |
|---|---|
| Travel speed, S (mm/min) | 425; 455; 485 |
| Voltage, V (V) | 19; 20; 21 |
| Wire feed speed, WFS (m/min) | 4; 5; 6 |
| Length of bead, (mm) | 90 |
| Gas flow rate, (L/min) | 15 |
| Arc length, (mm) | 3 |
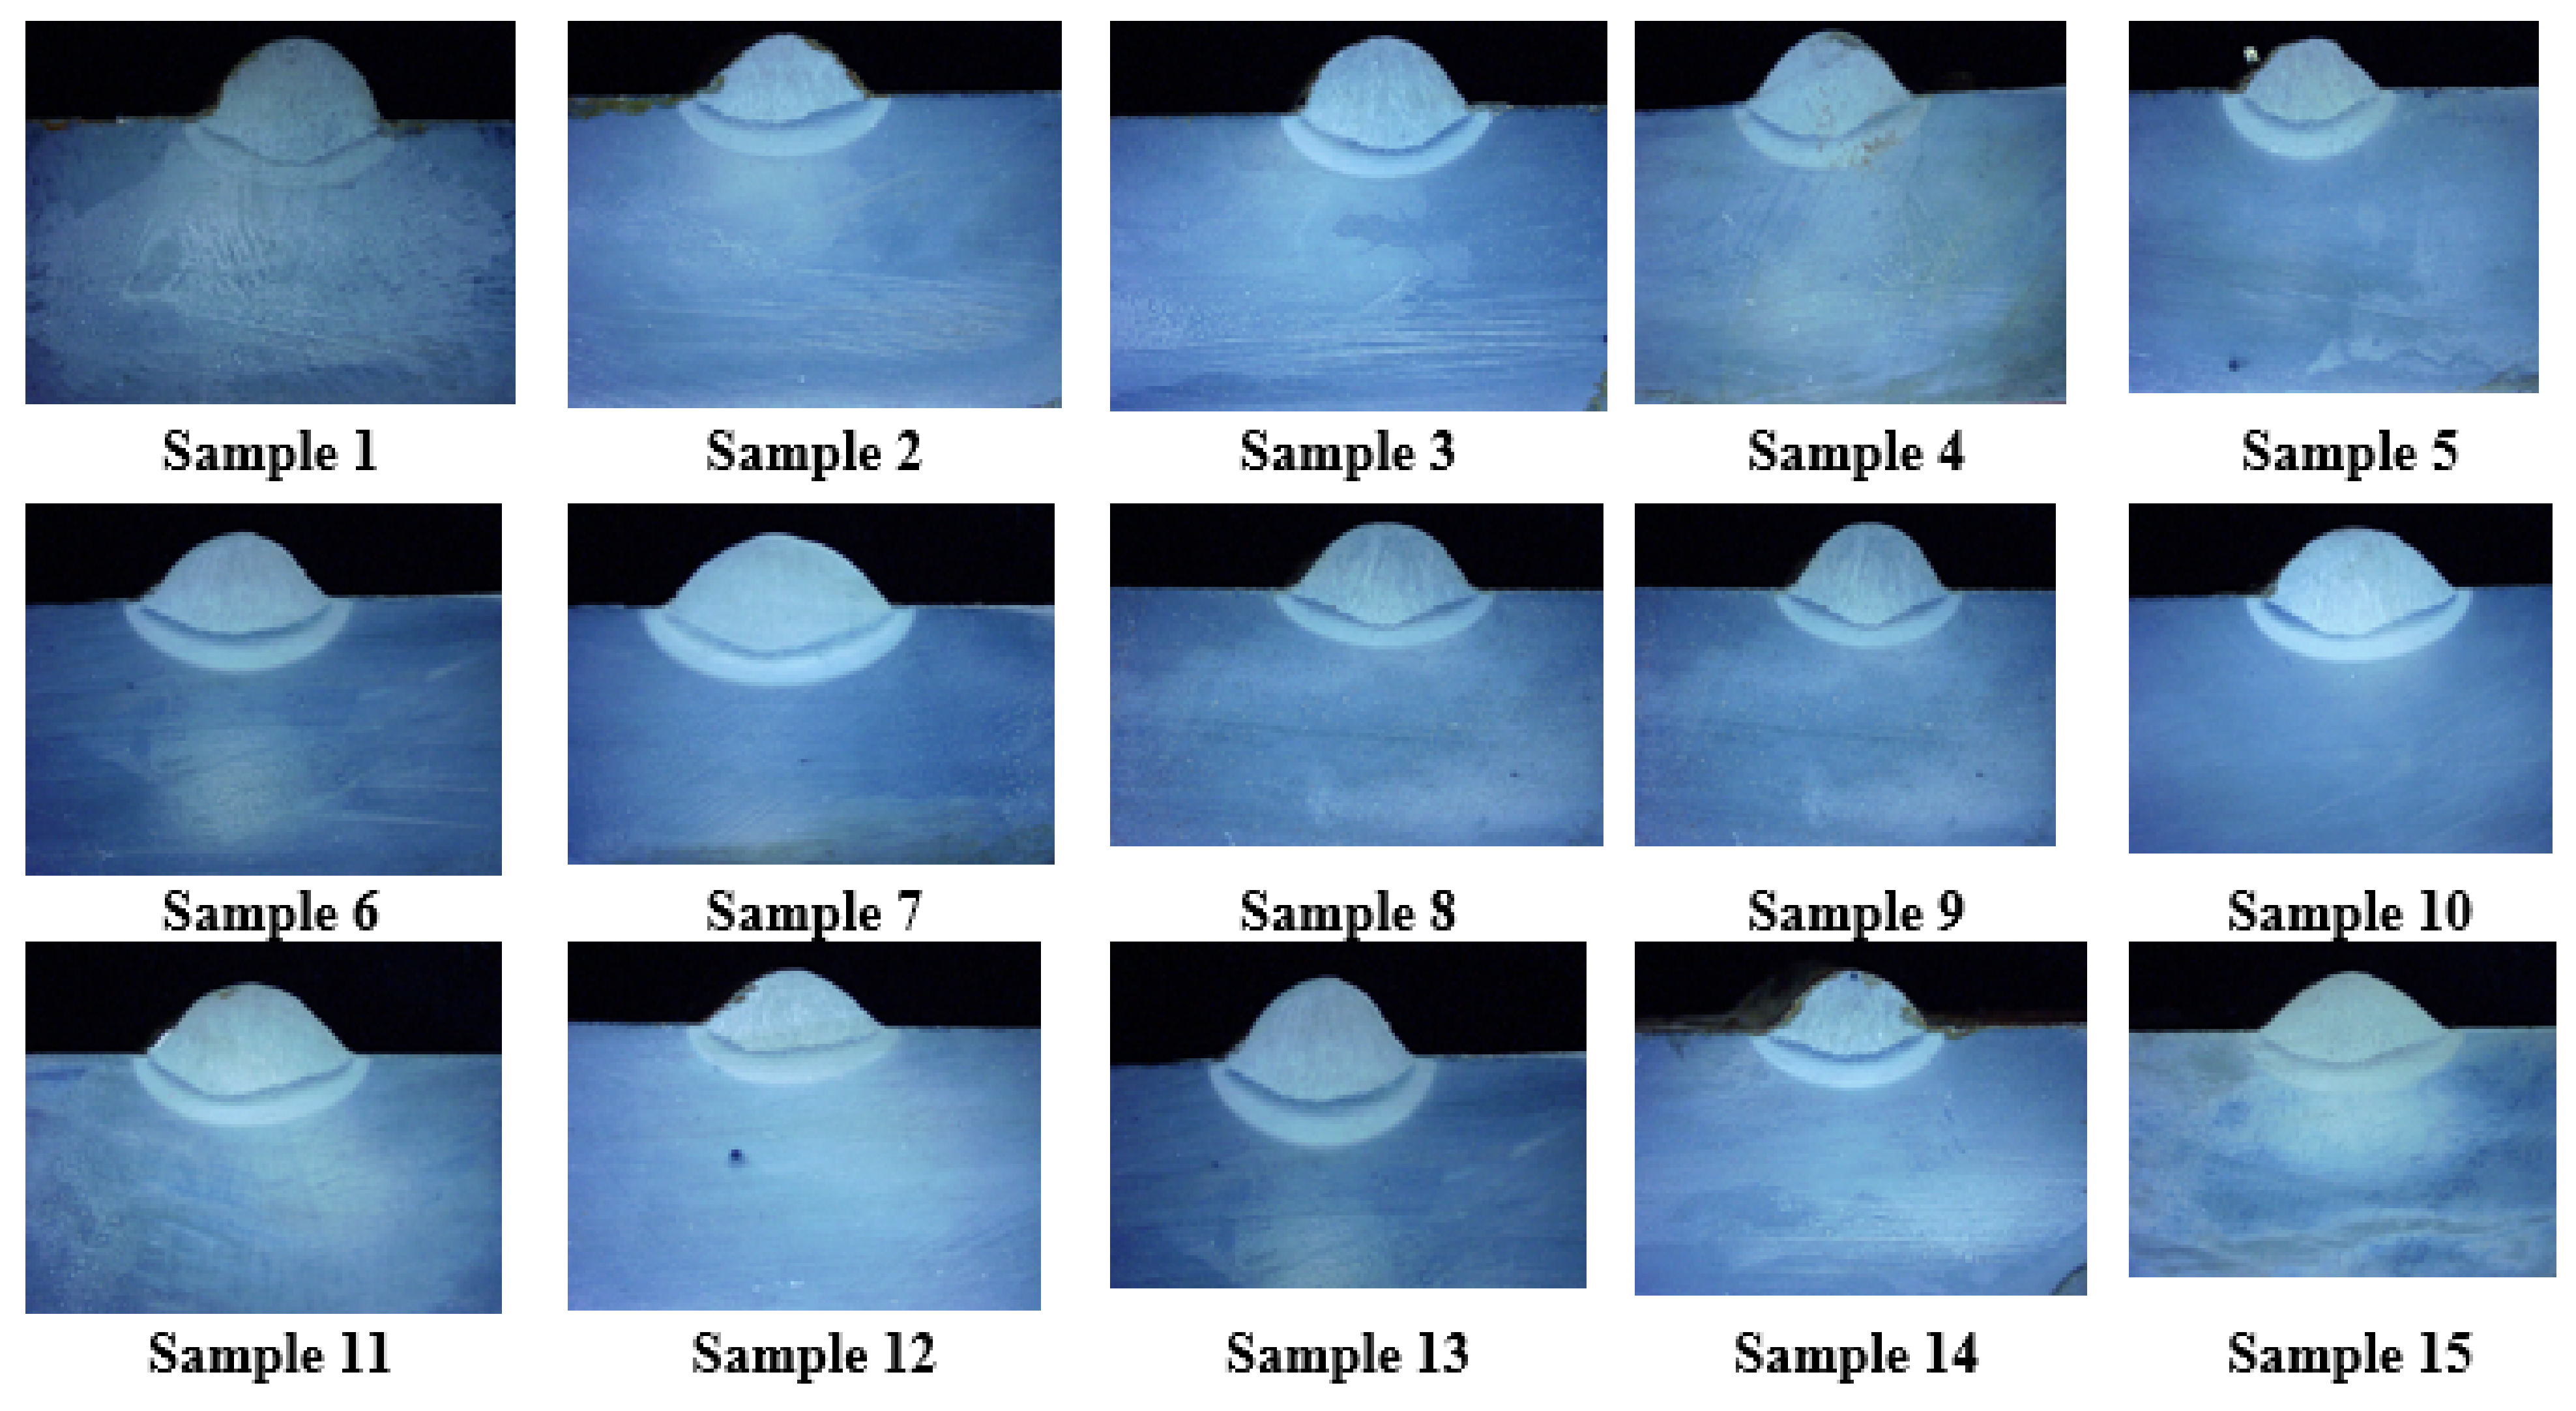
| Std. Order | Run Order | WFS (m/min) | Travel Speed (mm/min) | Voltage (V) | BW (mm) | BH (mm) |
|---|---|---|---|---|---|---|
| 15 | 1 | 5.0 | 455 | 18 | 5.61 | 4.75 |
| 10 | 2 | 5.6 | 425 | 20 | 7.61 | 6.01 |
| 16 | 3 | 6.2 | 455 | 20 | 8.95 | 6.21 |
| 27 | 4 | 5.6 | 455 | 19 | 6.62 | 5.34 |
| 9 | 5 | 5.0 | 455 | 20 | 6.63 | 4.11 |
| 20 | 6 | 5.0 | 485 | 19 | 5.29 | 4.32 |
| 24 | 7 | 5.6 | 485 | 18 | 5.63 | 5.09 |
| 17 | 8 | 5.6 | 425 | 18 | 7.46 | 6.31 |
| 23 | 9 | 6.2 | 485 | 19 | 8.22 | 6.71 |
| 13 | 10 | 6.2 | 425 | 19 | 8.98 | 7.21 |
| 5 | 11 | 5.0 | 425 | 19 | 6.18 | 5.02 |
| 26 | 12 | 5.6 | 455 | 19 | 6.66 | 5.39 |
| 8 | 13 | 6.2 | 455 | 18 | 8.35 | 6.93 |
| 6 | 14 | 5.6 | 485 | 20 | 7.78 | 4.78 |
| 12 | 15 | 5.6 | 455 | 19 | 6.74 | 5.51 |
| Source | DF | SS | MS | F | P | Significance |
|---|---|---|---|---|---|---|
| (a) BW | ||||||
| Regression | 9 | 19.8027 | 2.2003 | 93.24 | 0.000 | Significant |
| Linear | 3 | 17.8605 | 5.9535 | 252.29 | 0.000 | Significant |
| Square | 3 | 0.8874 | 0.2958 | 12.54 | 0.009 | Significant |
| Interaction | 3 | 1.0548 | 0.3516 | 14.90 | 0.006 | Significant |
| Error | 5 | 0.1180 | 0.0236 | |||
| Lack of fit | 3 | 0.1107 | 0.0369 | 10.11 | 0.091 | Non-significant |
| Pure error | 2 | 0.0073 | 0.0037 | |||
| Total | 14 | 19.9207 | ||||
| (b) BH | ||||||
| Regression | 9 | 12.3086 | 1.3676 | 23.41 | 0.000 | Significant |
| Linear | 3 | 11.9629 | 3.9876 | 68.25 | 0.000 | Significant |
| Square | 3 | 0.3341 | 0.1113 | 1.91 | 0.241 | Non-Significant |
| Interaction | 3 | 0.0116 | 0.0038 | 0.07 | 0.975 | Non-Significant |
| Error | 5 | 0.2921 | 0.0584 | |||
| Lack of fit | 3 | 0.2769 | 0.0922 | 12.09 | 0.077 | Non-significant |
| Pure error | 2 | 0.0153 | 0.0076 | |||
| Total | 14 | 12.6007 | ||||
| Optimization Type | Process Parameters | Responses | |||
|---|---|---|---|---|---|
| WFS | Travel Speed | Voltage | BW | BH | |
| Minimization of BW | 5 | 485 | 18 | 4.85 | 4.53 |
| Maximization of BH | 6.2 | 425 | 18 | 8.37 | 7.65 |
| Predicted Values | Experimental Values | % Deviation | ||||
|---|---|---|---|---|---|---|
| BW | BH | BW | BH | BW | BH | |
| Validation trial 1 | 4.85 | 4.53 | 4.73 | 4.68 | 2.53 | 3.21 |
| Validation trial 2 | 8.37 | 7.65 | 8.52 | 7.81 | 1.76 | 2.05 |
| Sr. No. | WFS (m/min) | Travel Speed (mm/min) | Voltage (V) | BW (mm) | BH (mm) |
|---|---|---|---|---|---|
| 1 | 6.2 | 425 | 18 | 7.65 | 8.37 |
| 2 | 5 | 485 | 18 | 4.53 | 4.85 |
| 3 | 6.2 | 471 | 18 | 6.78 | 7.74 |
| 4 | 6.1 | 474 | 18 | 6.53 | 7.47 |
| 5 | 6 | 485 | 18 | 6.27 | 7.10 |
| 6 | 5.5 | 478 | 18 | 5.28 | 6.07 |
| 7 | 5.5 | 485 | 18 | 5.27 | 5.97 |
| 8 | 6.2 | 463 | 18 | 6.86 | 7.85 |
| 9 | 5.6 | 485 | 18 | 5.45 | 6.20 |
| 10 | 5.9 | 425 | 18 | 6.95 | 7.70 |
| 11 | 6.2 | 485 | 18 | 6.74 | 7.55 |
| 12 | 6 | 475 | 18 | 6.29 | 7.24 |
| 13 | 5.9 | 476 | 18 | 6.07 | 7.00 |
| 14 | 5.4 | 479 | 18 | 5.11 | 5.83 |
| 15 | 6.1 | 485 | 18 | 6.50 | 7.32 |
| 16 | 5.4 | 485 | 18 | 5.10 | 5.75 |
| 17 | 5.9 | 485 | 18 | 6.05 | 6.87 |
| 18 | 5.3 | 480 | 18 | 4.95 | 5.59 |
| 19 | 6.1 | 482 | 18 | 6.50 | 7.36 |
| 20 | 5.3 | 485 | 18 | 4.94 | 5.52 |
| 21 | 5.8 | 485 | 18 | 5.84 | 6.65 |
| 22 | 6.1 | 432 | 18 | 7.21 | 8.06 |
| 23 | 6.2 | 461 | 18 | 6.88 | 7.88 |
| 24 | 5.8 | 476 | 18 | 5.86 | 6.78 |
| 25 | 5.7 | 477 | 18 | 5.66 | 6.54 |
| 26 | 5.7 | 485 | 18 | 5.64 | 6.43 |
| 27 | 6 | 478 | 18 | 6.28 | 7.20 |
| 28 | 5.2 | 481 | 18 | 4.80 | 5.36 |
| 29 | 5.2 | 485 | 18 | 4.80 | 5.30 |
| 30 | 5.1 | 481 | 18 | 4.66 | 5.13 |
| 31 | 5.1 | 485 | 18 | 4.66 | 5.08 |
| 32 | 5.6 | 478 | 18 | 5.46 | 6.30 |
| 33 | 6 | 431 | 18 | 7.01 | 7.85 |
| 34 | 5 | 482 | 18 | 4.53 | 4.90 |
| 35 | 6 | 426 | 18 | 7.15 | 7.92 |
| 36 | 6.2 | 428 | 18 | 7.56 | 8.34 |
| 37 | 6.1 | 428 | 18 | 7.32 | 8.11 |
| 38 | 6.2 | 450 | 18 | 7.05 | 8.04 |
| 39 | 6.1 | 430 | 18 | 7.26 | 8.09 |
| 40 | 6.2 | 480 | 18 | 6.75 | 7.62 |
| 41 | 6.1 | 425 | 18 | 7.41 | 8.15 |
| 42 | 6.2 | 432 | 18 | 7.45 | 8.28 |
| 43 | 5.6 | 479 | 18 | 5.46 | 6.29 |
| 44 | 6.1 | 426 | 18 | 7.38 | 8.14 |
| 45 | 5.9 | 481 | 18 | 6.06 | 6.93 |
| 46 | 5.8 | 482 | 18 | 5.84 | 6.70 |
| 47 | 6.2 | 481 | 18 | 6.75 | 7.61 |
| 48 | 5.9 | 479 | 18 | 6.06 | 6.96 |
Publisher’s Note: MDPI stays neutral with regard to jurisdictional claims in published maps and institutional affiliations. |
© 2022 by the authors. Licensee MDPI, Basel, Switzerland. This article is an open access article distributed under the terms and conditions of the Creative Commons Attribution (CC BY) license (https://creativecommons.org/licenses/by/4.0/).
Share and Cite
Vora, J.; Parikh, N.; Chaudhari, R.; Patel, V.K.; Paramar, H.; Pimenov, D.Y.; Giasin, K. Optimization of Bead Morphology for GMAW-Based Wire-Arc Additive Manufacturing of 2.25 Cr-1.0 Mo Steel Using Metal-Cored Wires. Appl. Sci. 2022, 12, 5060. https://doi.org/10.3390/app12105060
Vora J, Parikh N, Chaudhari R, Patel VK, Paramar H, Pimenov DY, Giasin K. Optimization of Bead Morphology for GMAW-Based Wire-Arc Additive Manufacturing of 2.25 Cr-1.0 Mo Steel Using Metal-Cored Wires. Applied Sciences. 2022; 12(10):5060. https://doi.org/10.3390/app12105060
Chicago/Turabian StyleVora, Jay, Nipun Parikh, Rakesh Chaudhari, Vivek K. Patel, Heet Paramar, Danil Yurievich Pimenov, and Khaled Giasin. 2022. "Optimization of Bead Morphology for GMAW-Based Wire-Arc Additive Manufacturing of 2.25 Cr-1.0 Mo Steel Using Metal-Cored Wires" Applied Sciences 12, no. 10: 5060. https://doi.org/10.3390/app12105060
APA StyleVora, J., Parikh, N., Chaudhari, R., Patel, V. K., Paramar, H., Pimenov, D. Y., & Giasin, K. (2022). Optimization of Bead Morphology for GMAW-Based Wire-Arc Additive Manufacturing of 2.25 Cr-1.0 Mo Steel Using Metal-Cored Wires. Applied Sciences, 12(10), 5060. https://doi.org/10.3390/app12105060