3.1. Raw Materials Characterization
The chemical composition of BFA and PLC, expressed in terms of oxides, is shown in
Table 2. The main components of BFA are CaO (32.3 wt.%), SiO
2 (21.8 wt.%), K
2O (9.28 wt.%) and Al
2O
3 (8.74 wt.%), which are in accordance with the results reported by other authors [
10,
19,
20]. However, the characteristics of BFA may vary with the properties of the biomass used as fuel and the operating conditions [
10]. In the case of PLC, the five main constituents are CaO (73.1 wt.%), SiO
2 (13.0 wt.), SO
3 (4.02 wt.%), Fe
2O
3 (2.94 wt.%) and Al
2O
3 (2.78 wt.%) which are in the usual concentrations reported for commercial PLC [
19]. BFA has an LOI value of 10.48 wt.%.
The chemical composition of the ash, namely the CaO content, is extremely important for its potential self-hardening. According to EN197-1:2011 [
21], a hydraulic binder is defined as a material that, when mixed with water, sets and hardens, and can maintain its strength and stability even while submerged in water. In the same standard, it is also mentioned that for Portland cement clinker to be considered a hydraulic material, the CaO/SiO
2 ratio (by mass) should be higher than 2, while a granulated blast furnace slag possesses hydraulic properties when the (CaO + MgO)/SiO
2 ratio (by mass) surpasses 1.0. The actual BFA only complies with the last requirement (see
Table 2).
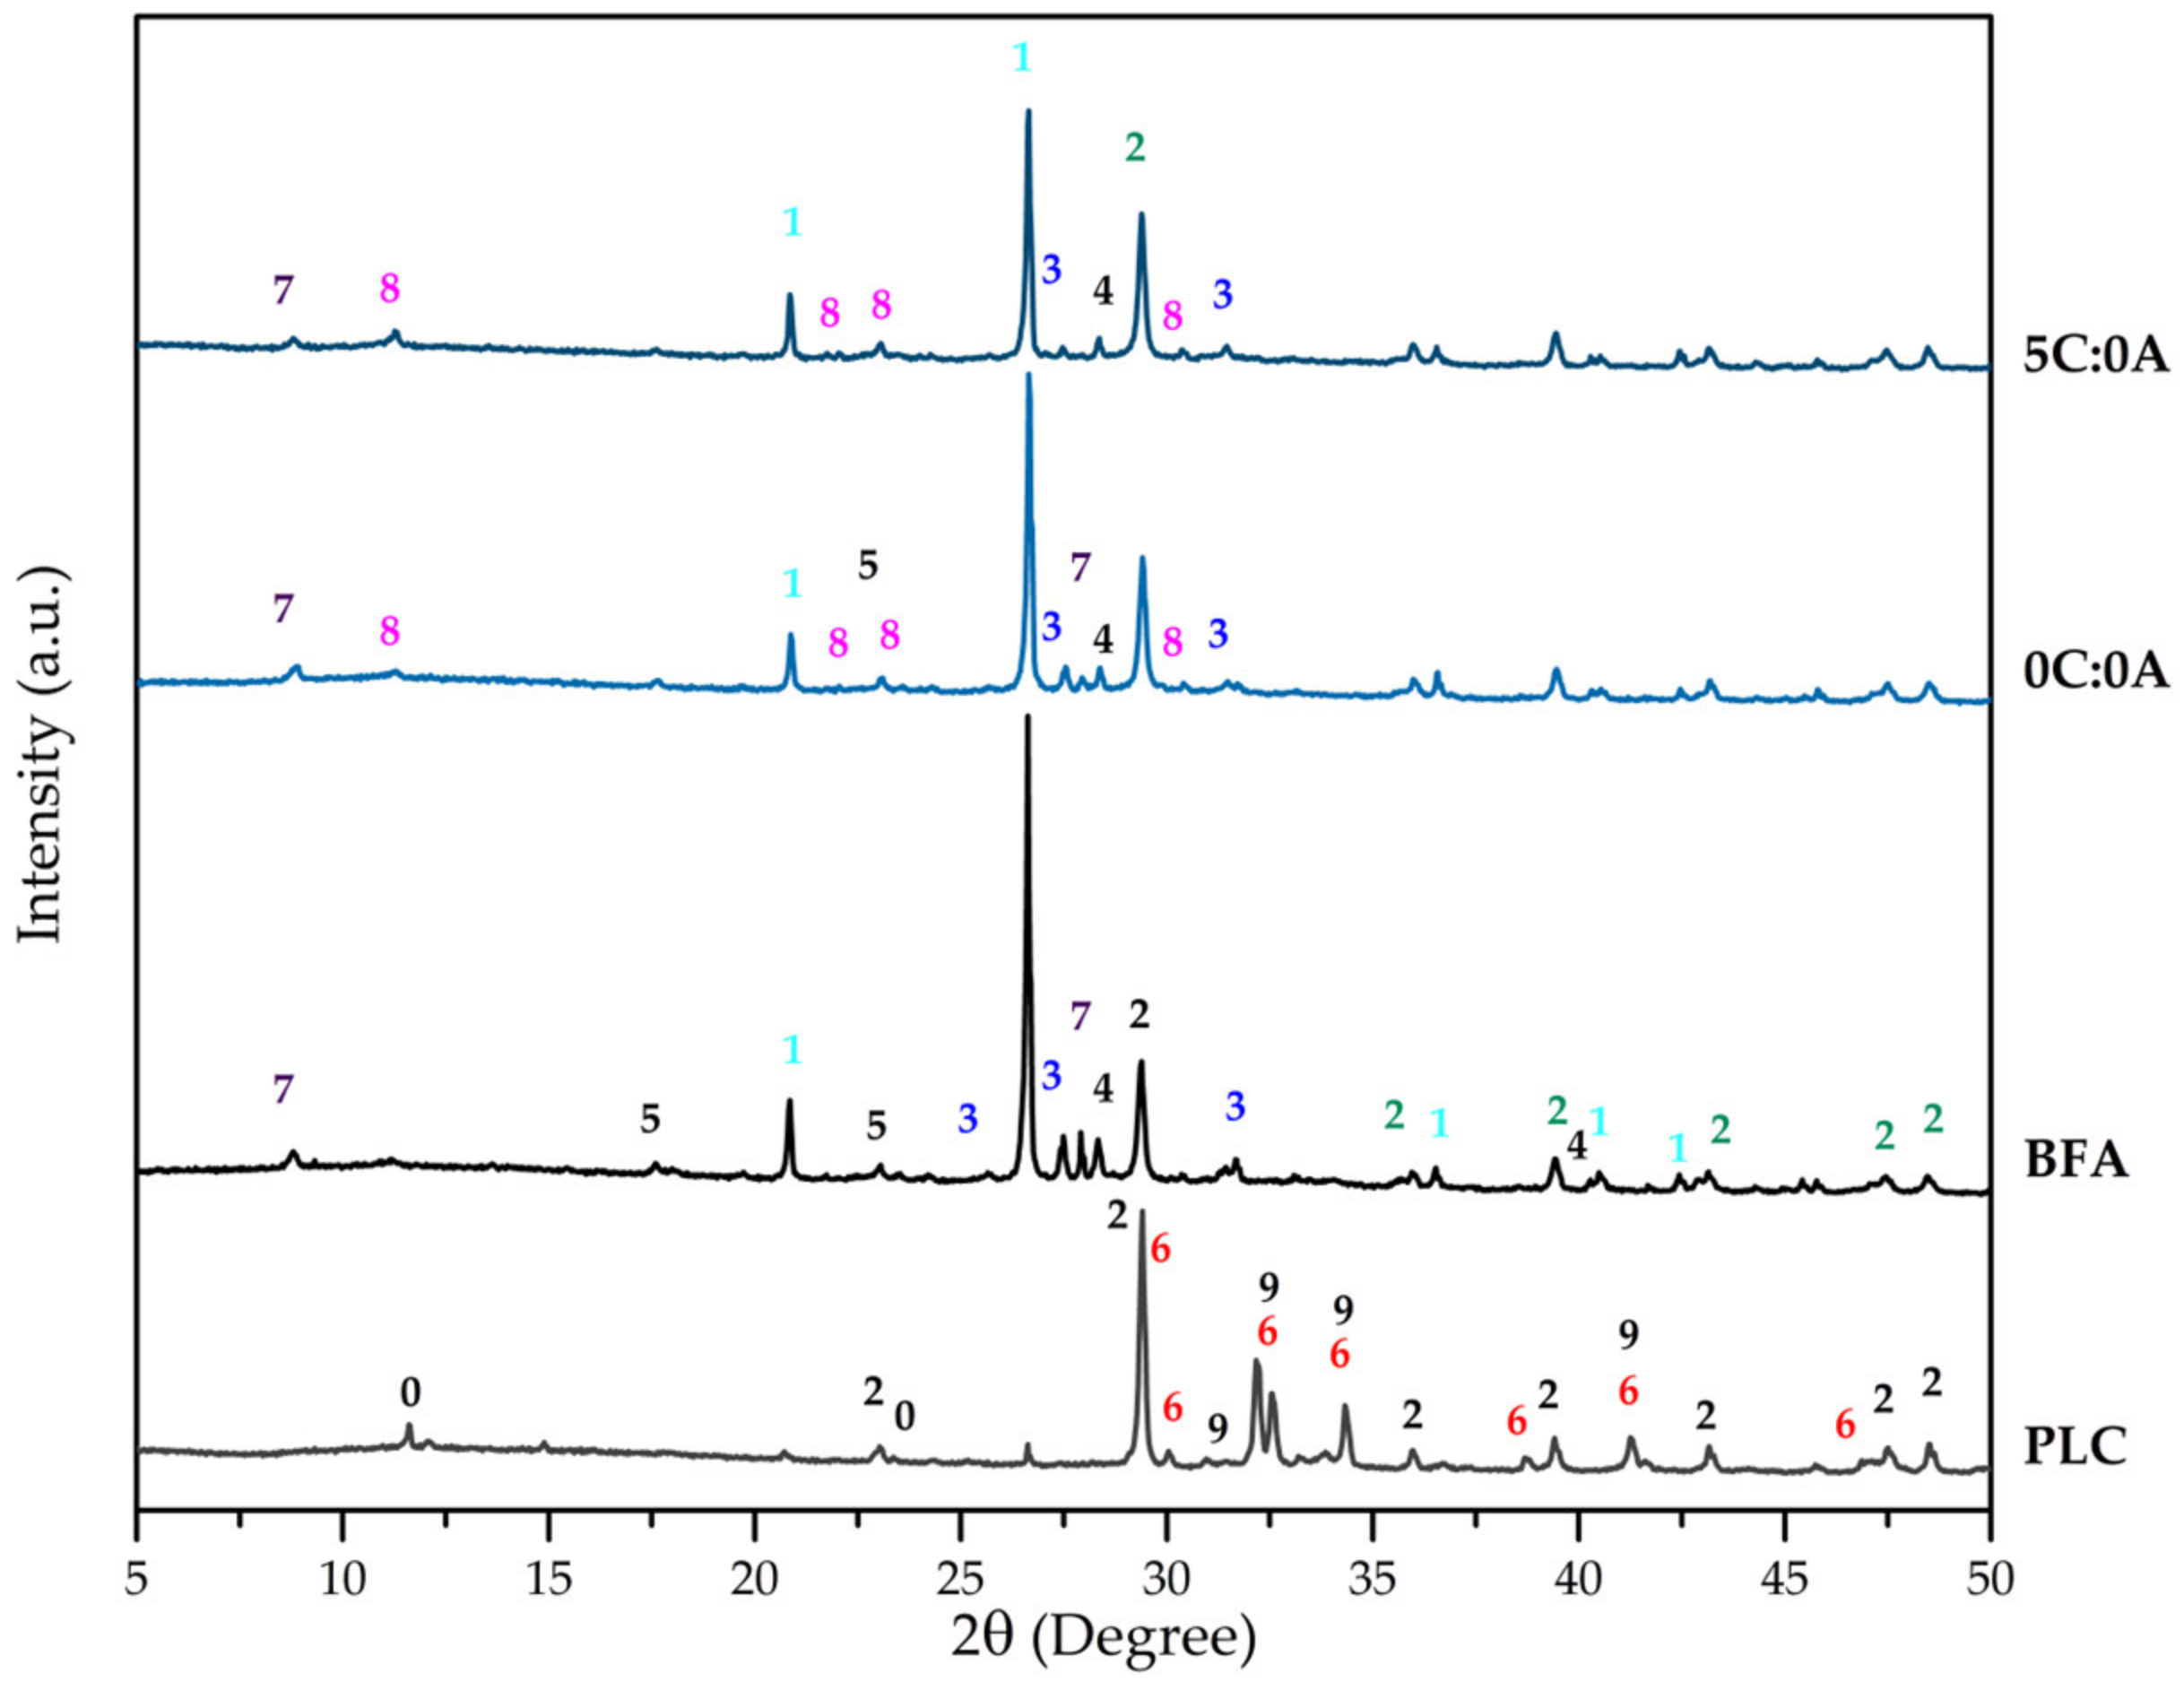
Figure 1 shows the XRD patterns of the PLC, BFA, and hardened samples (0C:0A and 5C:0A). The PLC has the expected crystalline phases: alite (C
3S-Ca
3SiO
5), belite (C
2S-Ca
2SiO
4), calcite (CaCO
3) and gypsum (CaSO
4.2H
2O). This is in agreement with that stated by EN 197:2011 [
21] since the PLC used in this work (type II/B-L) is composed of clinker (65 to 79 wt.%) and limestone (21 to 35 wt.%), and with the values expressed in terms of oxides obtained by XRF for CaO (73.06 wt.%) and SiO
2 (12.98 wt.%). The XRD pattern of BFA shows that it is mostly constituted by quartz (SiO
2), calcite (CaCO
3), microcline (KAlSi
3O
8), sylvite (KCl), calcium hydroxide (Ca(OH)
2), and muscovite (KAl
2(Si
3Al)O
10(OH)
2), thus, in agreement with the main components expressed in terms of oxides detected by XRF (SiO
2, CaO, K
2O Al
2O
3, and Cl). Quartz, calcite and microcline are the crystalline phases commonly found in BFA generated from fluidised bed combustion of forest biomass [
2,
4,
10,
11].
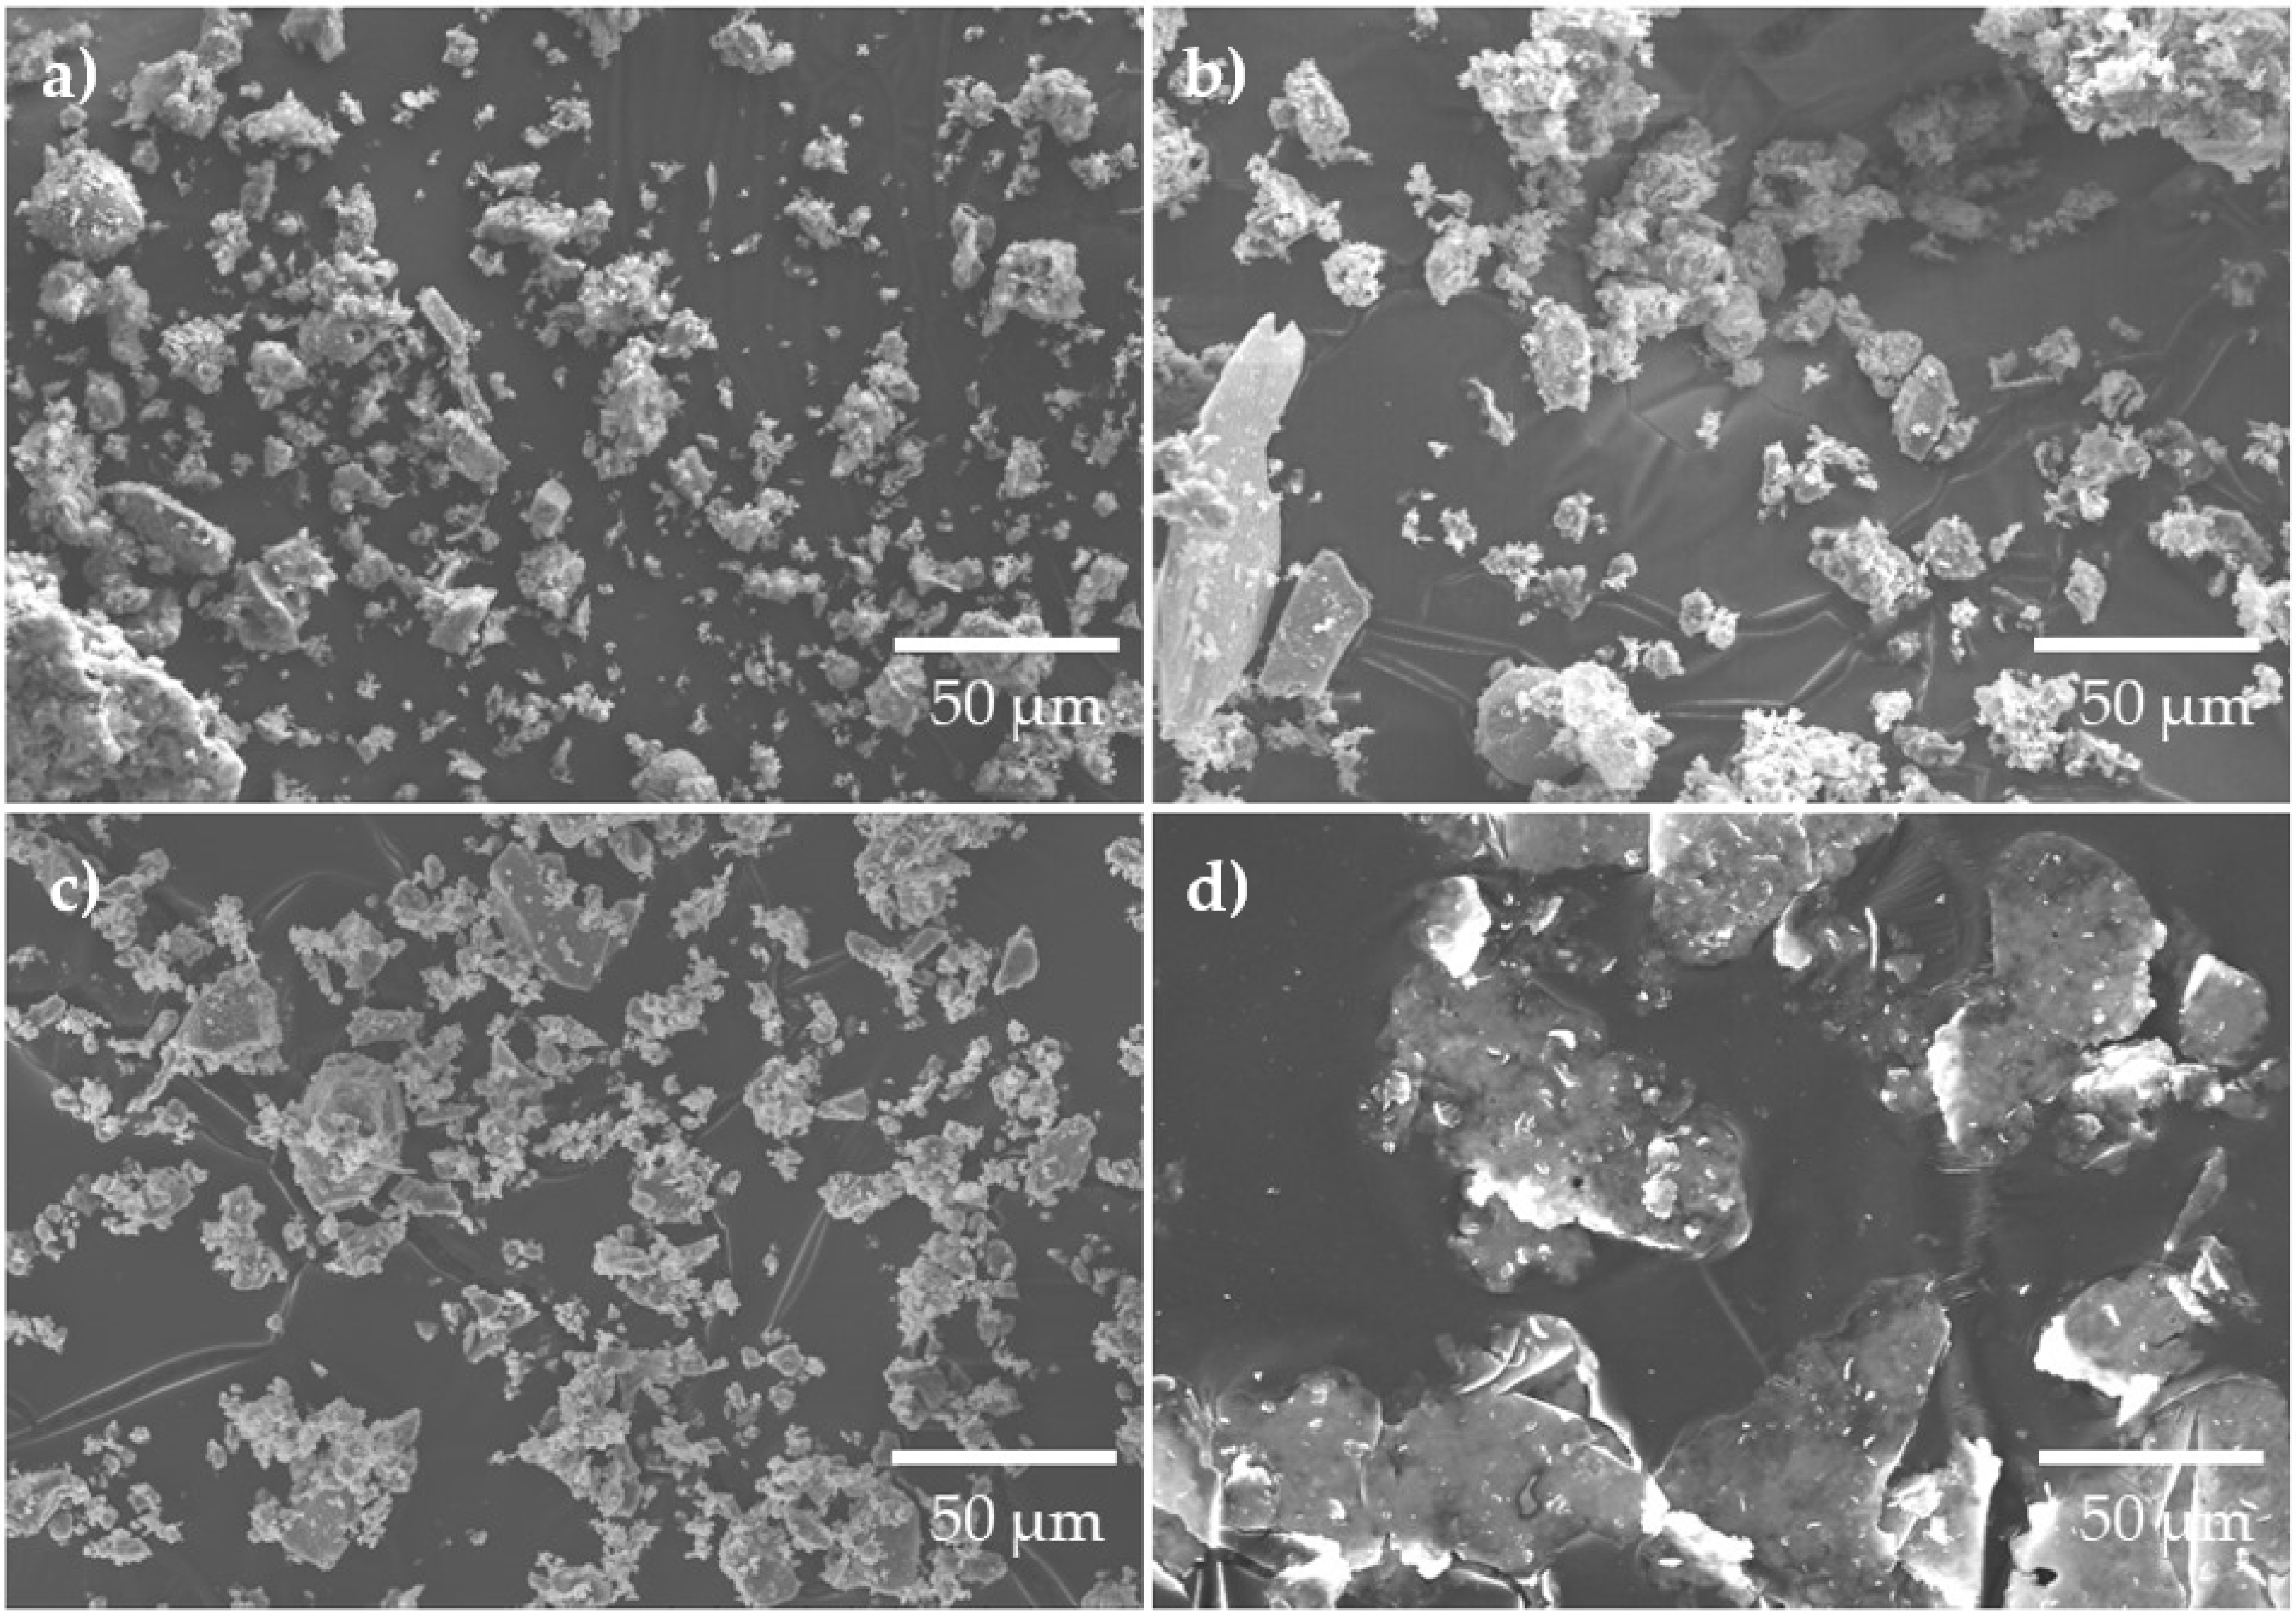
Figure 2a–d, shows SEM images illustrating the morphology of BFA, PLC and AP, respectively. BFA (
Figure 2a,b) and PLC (
Figure 2c) are composed of irregularly shaped particles with a broad particle size range, with BFA presenting some acicular-shaped particles. In both materials, it is possible to observe the presence of agglomerates, which are larger in BFA. The particle’s size distribution and shape, and the presence of large agglomerates play an important role in the compactness of the samples. The AP (
Figure 2d) has a lamellar shape and a coarser particle size when compared to BFA and PLC.
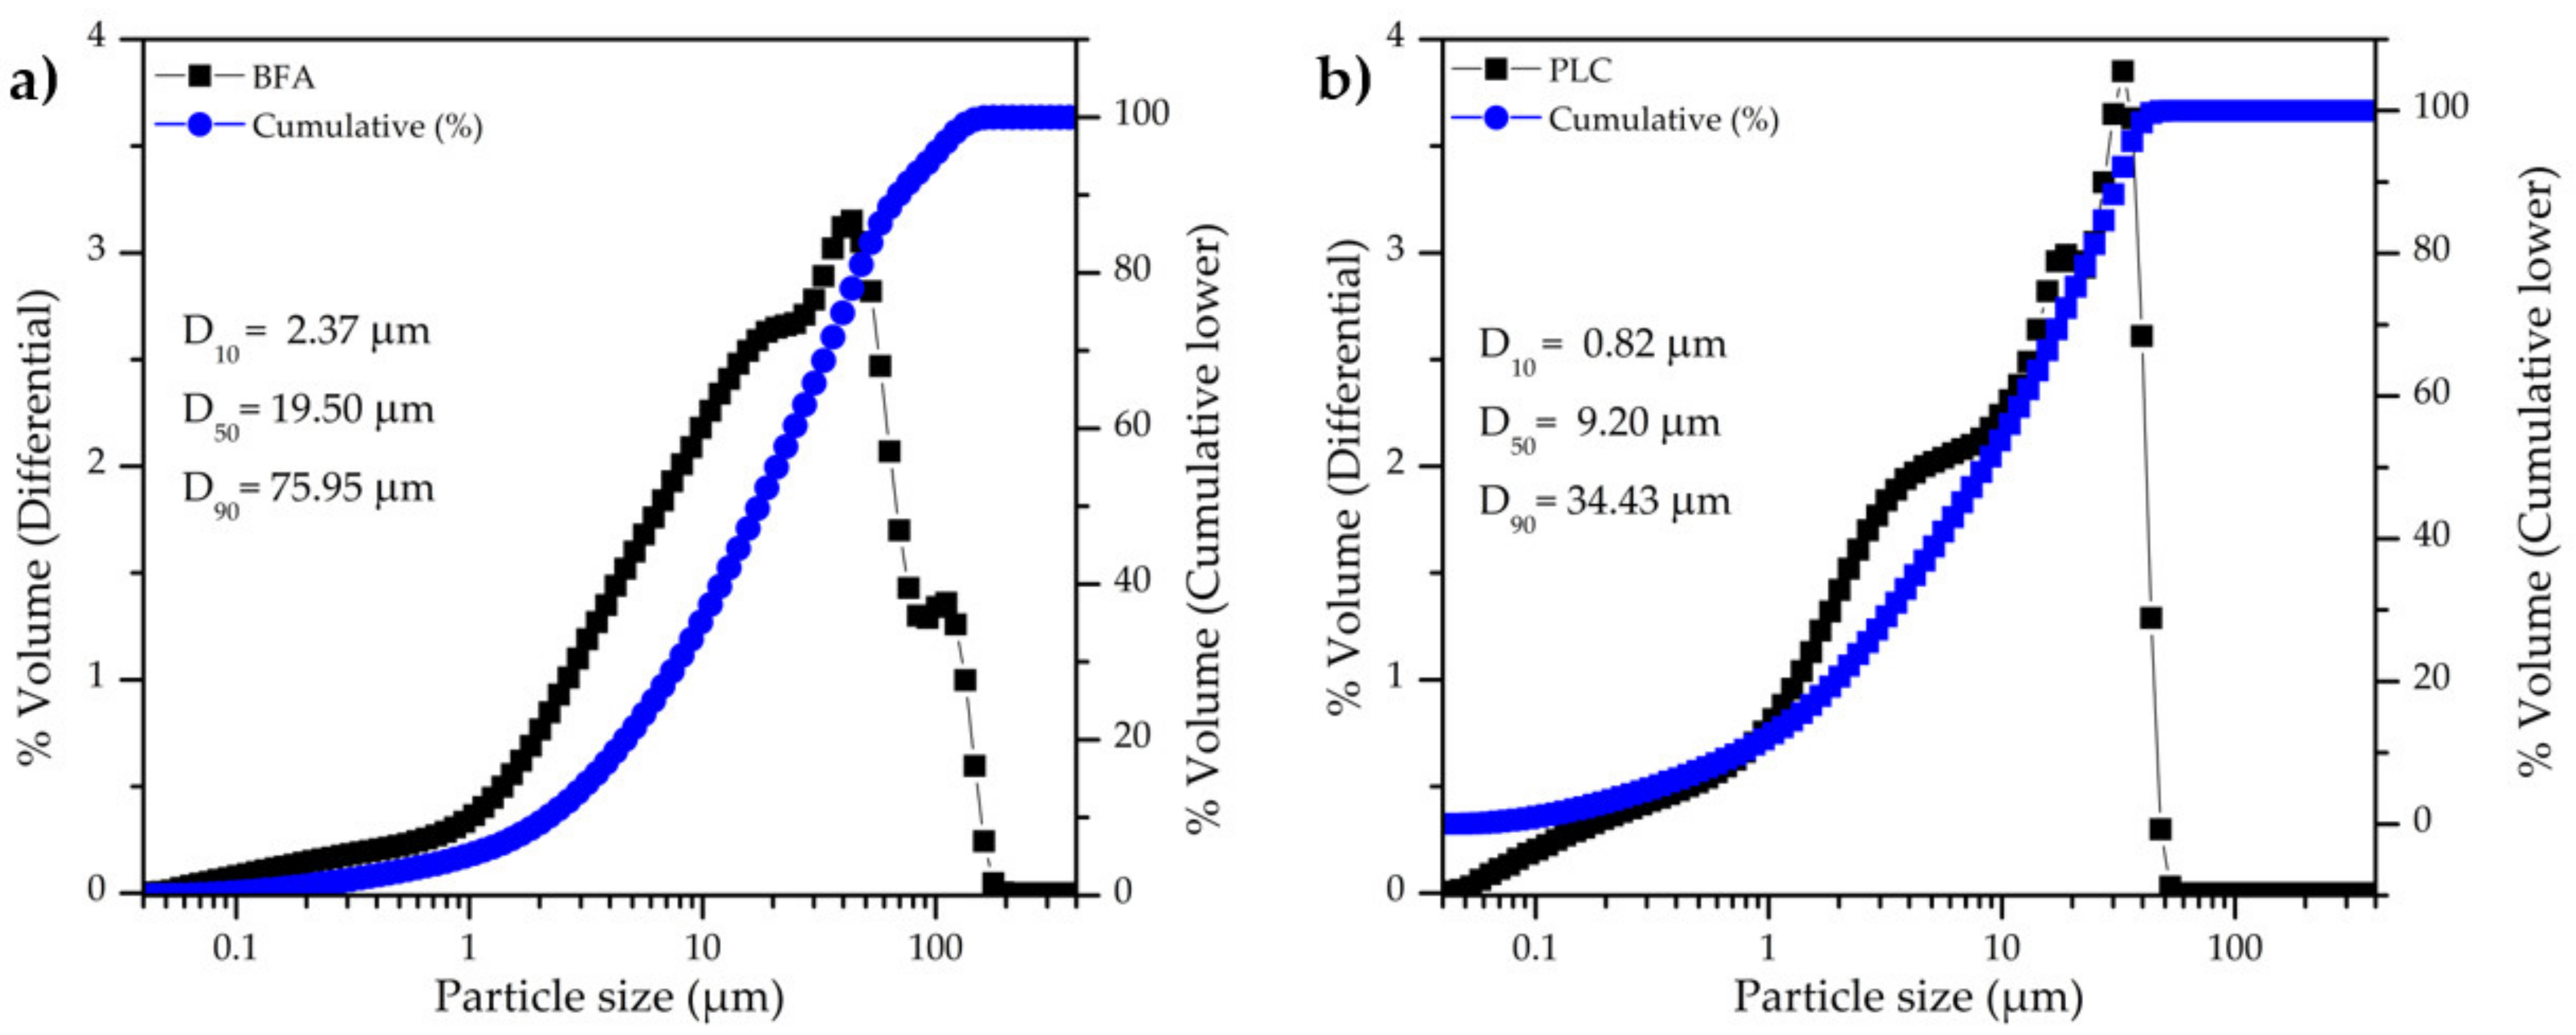
The particle size distribution of BFA and PLC is shown in
Figure 3a and 3b, respectively. PLC has a narrower particle size range than BFA and the particles are smaller, in line with SEM observations (
Figure 2). BFA has an average particle size of 30.91 µm and D
50 = 19.05 µm, while the PLC has an average particle size of 13.73 µm and D
50 = 9.20 µm. The specific surface area (SSA) of BFA and PLC is 3.24 m
2/g and 1.91 m
2/g, respectively, a result that was not expected taking into consideration the particle size distribution (
Figure 3). The higher irregular surface shape and some porosity of BFA particles might explain its higher SSA. The true density of BFA and PLC was found to be 2.57 g/cm
3 and 3.01 g/cm
3, respectively.
3.2. Monoliths Characterization
The monoliths were characterized for mineralogical composition, density, porosity (total and open), compressive strength and microstructure after 14 days of curing.
The crystalline phases that promote self-hardening and mechanical strength development are related to the reaction of water with the initial phases present in BFA and PLC. The XRD patterns of 0C:0A and 5C:0A hardened samples (
Figure 1) reveal the presence of the crystalline phases already detected in BFA and a new phase—hydrocalumite (Ca
4Al
2(OH)
12(Cl,CO
3,OH)
2·4H
2O). When qualitatively comparing the BFA diffractogram with that of the hardened samples (0C:0A and 5C:0A), it is possible to observe that the intensity of the peaks assigned to quartz (1), calcite (2), microcline (3), sylvite (4) and muscovite (7) decrease. In addition, hydrated aluminosilicate or calcium-rich phases could have also been formed but have a low degree of crystallinity or are present with a concentration below the detection limit.
When comparing the diffractograms of the 5C:0A and 0C:0A samples (
Figure 1), it is observed that the intensity of the peaks assigned to quartz (1), microcline (3) and sylvite (4) decreased significantly. The muscovite peak (7) disappears and the intensity of the peaks of calcite and hydrocalumite increases. This is due to the reaction of PLC (5 wt.% added) with water, which releases calcium hydroxide (Ca(OH)
2) into the medium, which may have favoured the formation of a higher quantity of hydrocalumite. Calcite was brought to the system by the PLC addition.
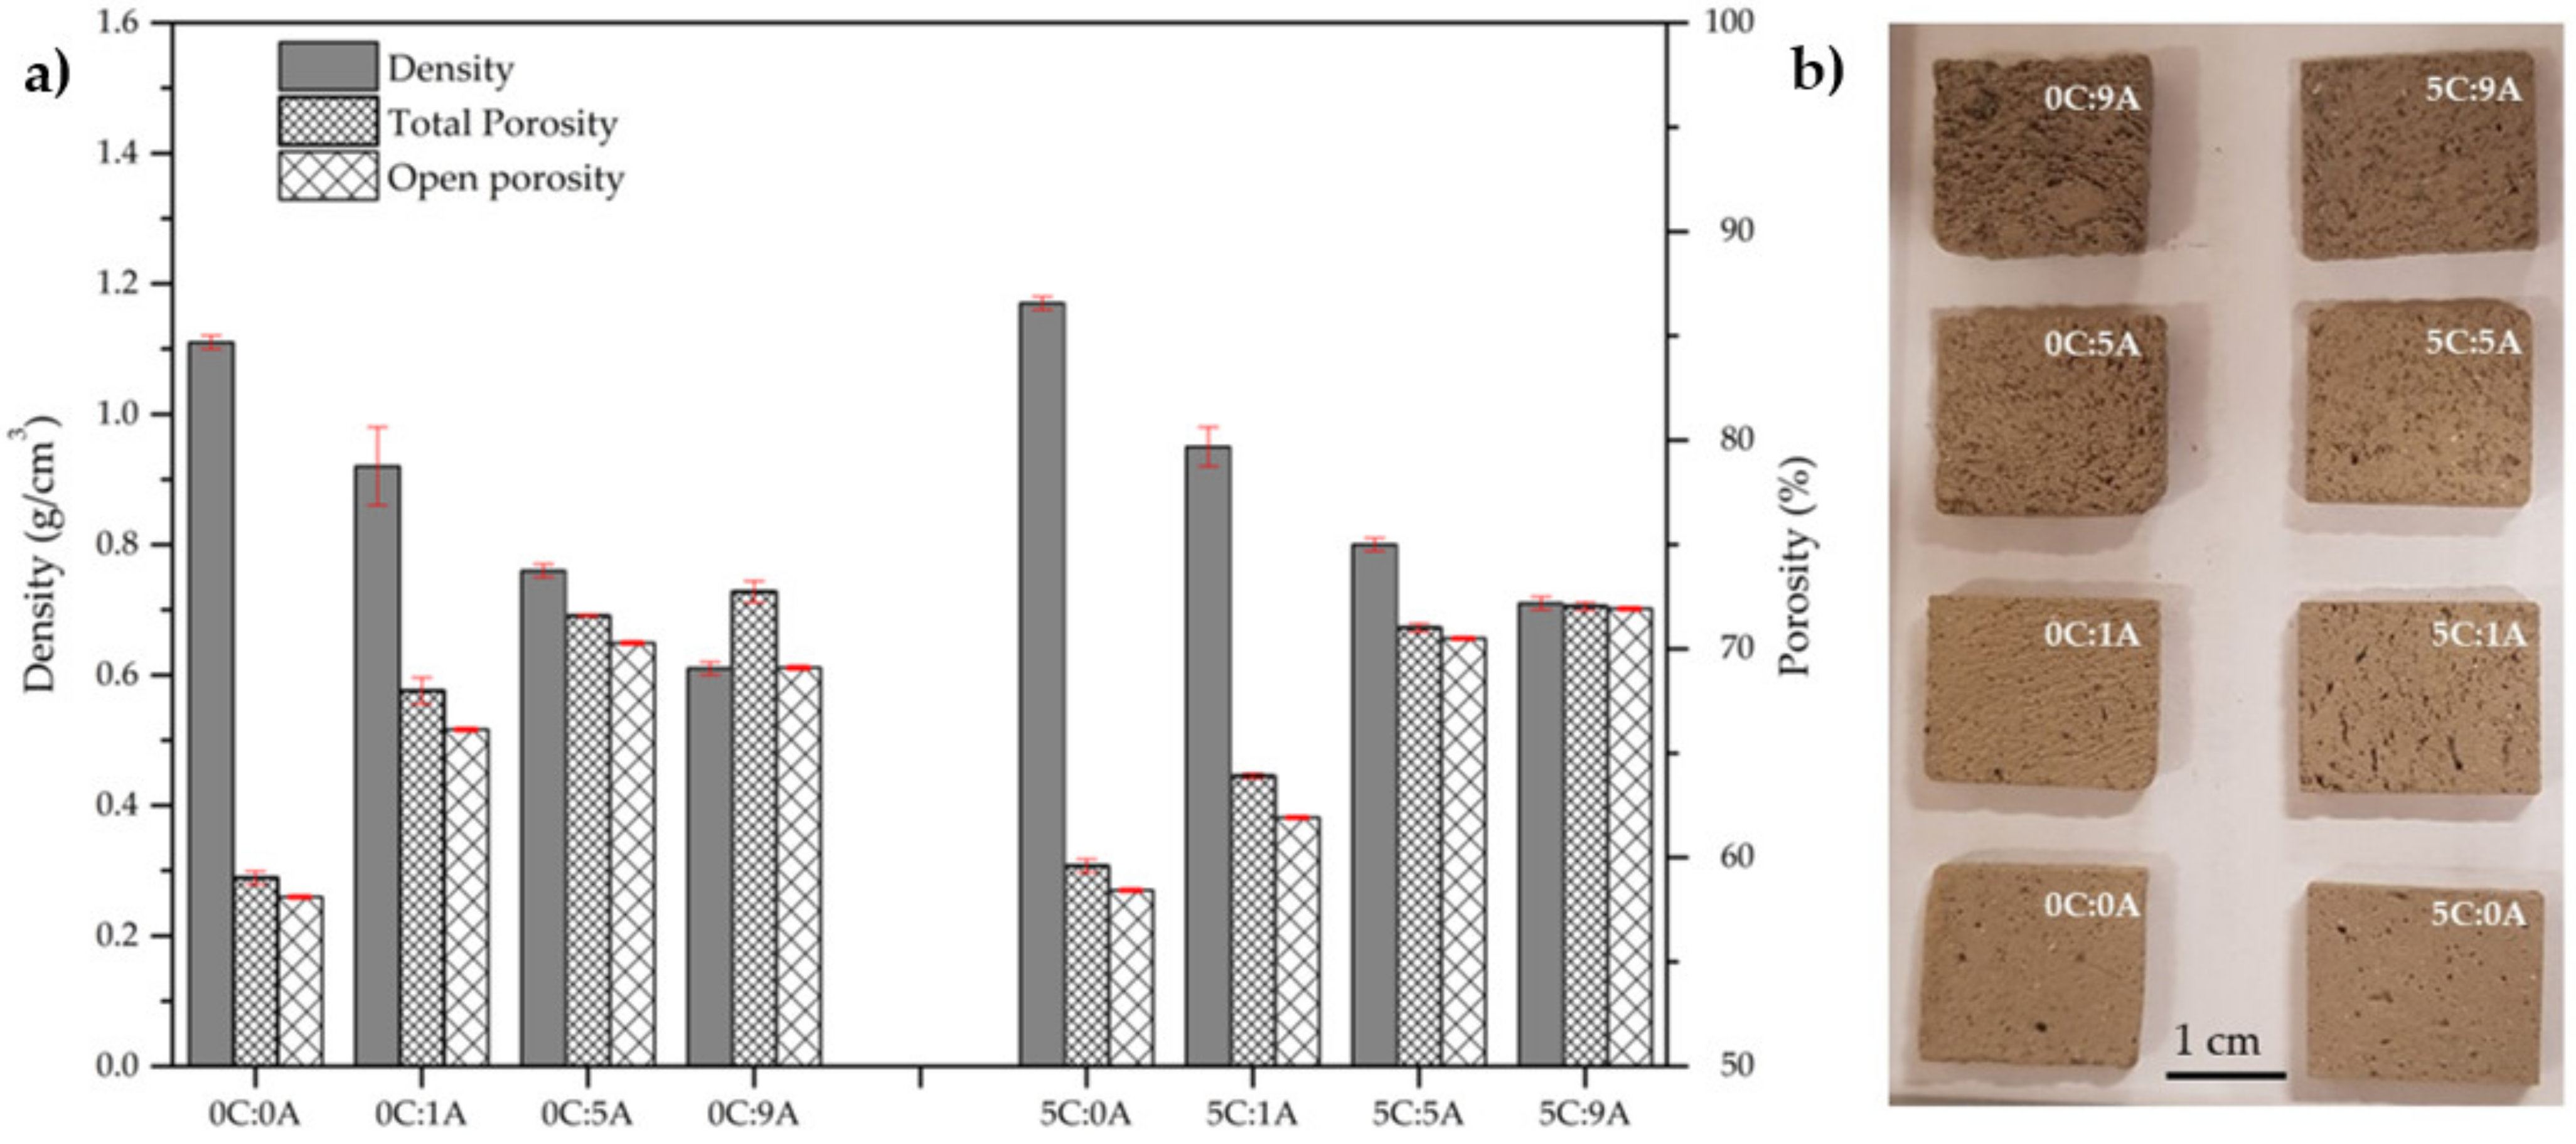
Figure 4a presents the influence of PLC and AP content on the density and porosity (total and open) of the cured samples. A photograph of the parallelepiped samples used in the MB adsorption tests is patent in
Figure 4b.
The true density () of the samples without PLC and AP (0C:0A) and with PLC only (5C:0A) is similar, being 2.63 g/cm3 and 2.64 g/cm3, respectively. The density of the samples decreases as the AP content rises due to the increment of the total porosity. For the samples without PLC, the density varies between 1.11 g/cm3 (0C:0A sample) and 0.61 g/cm3 (0C:9A sample). The introduction of 5 wt.% PLC slightly increase the density of the samples (1.17 g/cm3 for 5C:0A and 0.71 g/cm3 for 5C:9A). This increment was expected due to PLC characteristics, namely, higher true density, smaller particle size and extended hardening reactions when compared with BFA.
Nevertheless, the samples without AP are already porous (≈58%) due to the poor compaction of the BFA particles (presence of acicular-shaped particles and large agglomerates) and the fact that the hydration/hardening reactions of BFA are not intense. As expected, the porosity increases (~13%) with the increment of the porogenic agent. The addition of 0.09 wt.% AP increases the total porosity from 59.0 to 72.7% (samples without PLC) and from 59.6 to 72.0% (samples with 5 wt.% of PLC). For the samples without PLC, the open porosity varies from 58.1 to 69.1% and, for the samples with PLC, it ranges from 58.4 to 71.9%. For all samples, the porosity is almost completely open, which is excellent for the target application (adsorption of toxic substances). Moreover, the open porosity of the samples, with or without PLC, is similar.
In
Figure 4b, it is possible to observe that the macroporosity of the samples increased with AP content. However, the samples without AP also present the same large pores resulting from air entrainment during the mixing process. Interestingly, 0C:9A is the sample that presented the higher difference between the total (72.7%) and the open porosity (69.1%). Macroscopically, looking at
Figure 4b, this sample seems to be the one with the largest pores, probably resulting from the coalescence of smaller ones. In sample 5C:9A, this effect is not as evident.
Figure 4b also shows that there is anisotropy in the size and the distribution of the pores in all the monoliths.
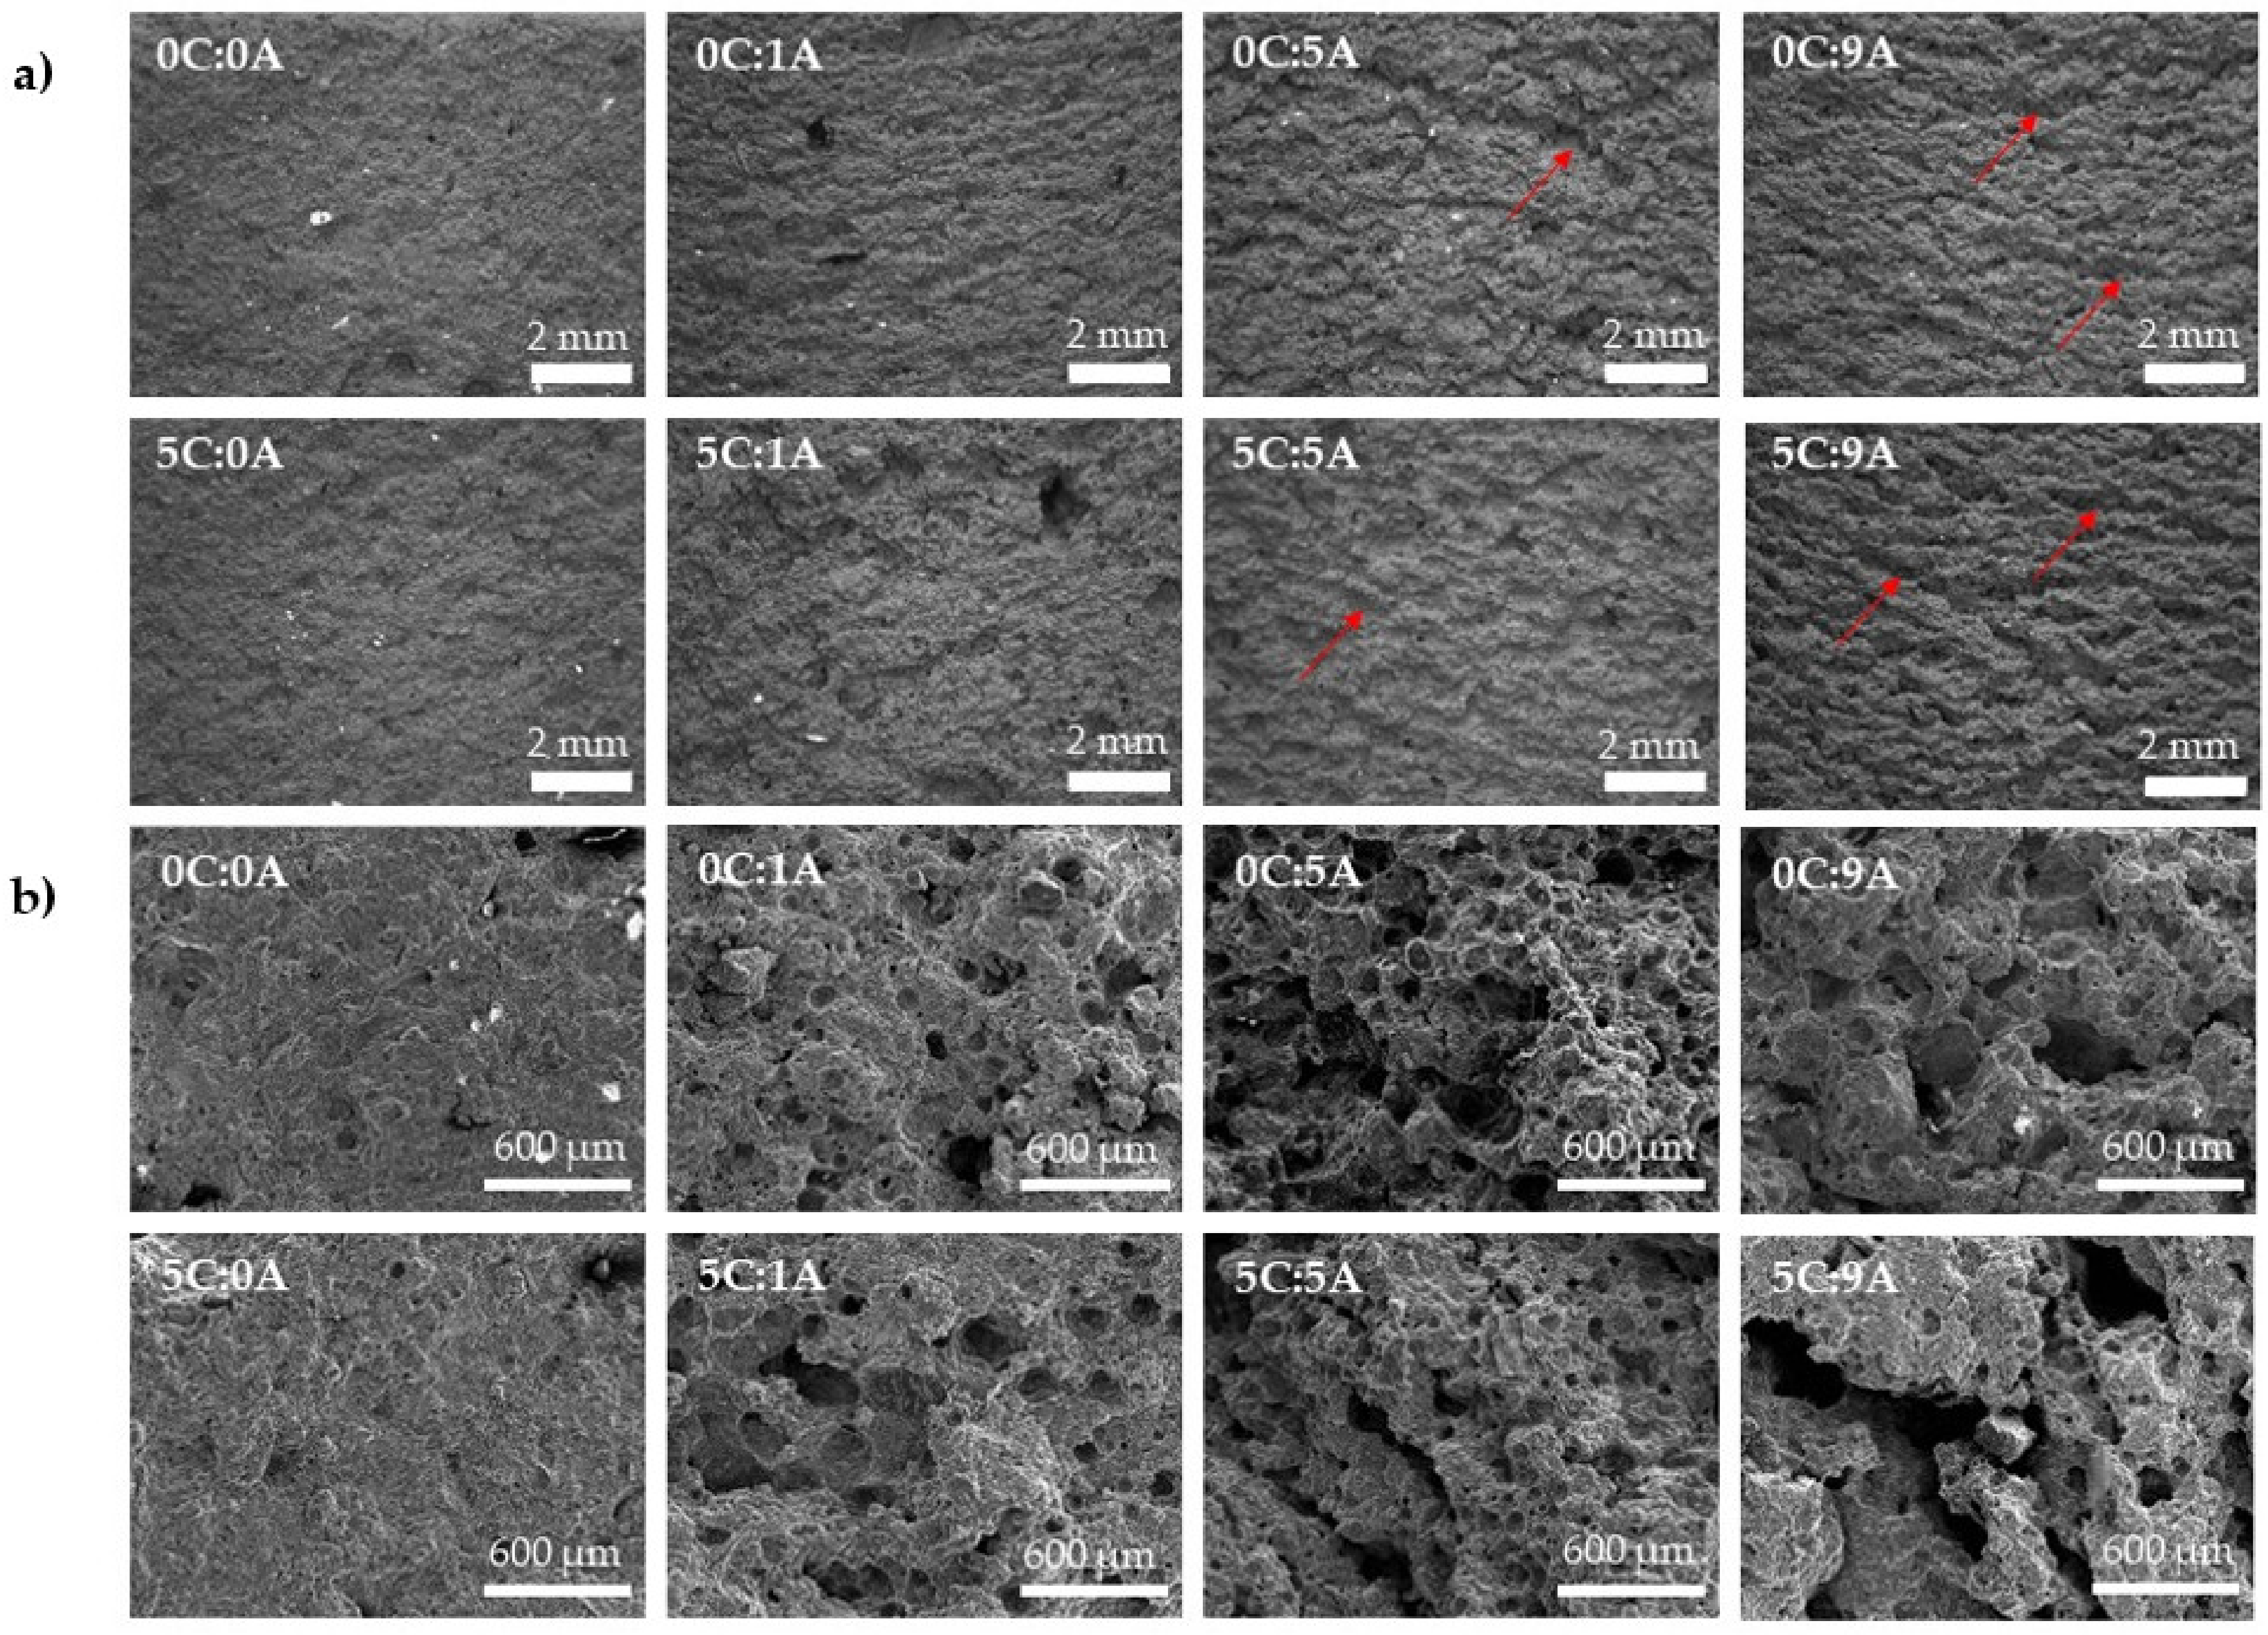
Figure 5 shows the microstructure of the prepared monoliths, obtained by optical (
Figure 5a) and SEM (
Figure 5b). In general, it is possible to observe that the porosity increases with the rise of AP content. The addition of PLC (5 wt.%) does not significantly change the mechanism of porosity generation. These observations agree with the values obtained for density and porosity (
Figure 4a).
In
Figure 5a, it is possible to observe, in the samples with AP, the presence of macroscopic channels consisting of interconnected pores. By increasing the AP content (from 0.01 to 0.09 wt.%), the channels tend to be deeper. The released H
2 bubbles Chemical reaction (1) are trapped inside the sample but, during the self-hardening process, they have time to coalesce to some extent, thus generating this type of microstructure. By SEM it is possible to observe the appearance of dispersed rounded pores in the samples with 0.01 wt.% of AP (0C:1A and 5C:1A). This is in line with the decrease in density and the increase in total porosity. However, when the AP content increases from 0.05 to 0.09 wt.%, a decrease in the number of dispersed round pores and the appearance of larger voids resulting from the coalescence/interconnection of smaller pores are observed.
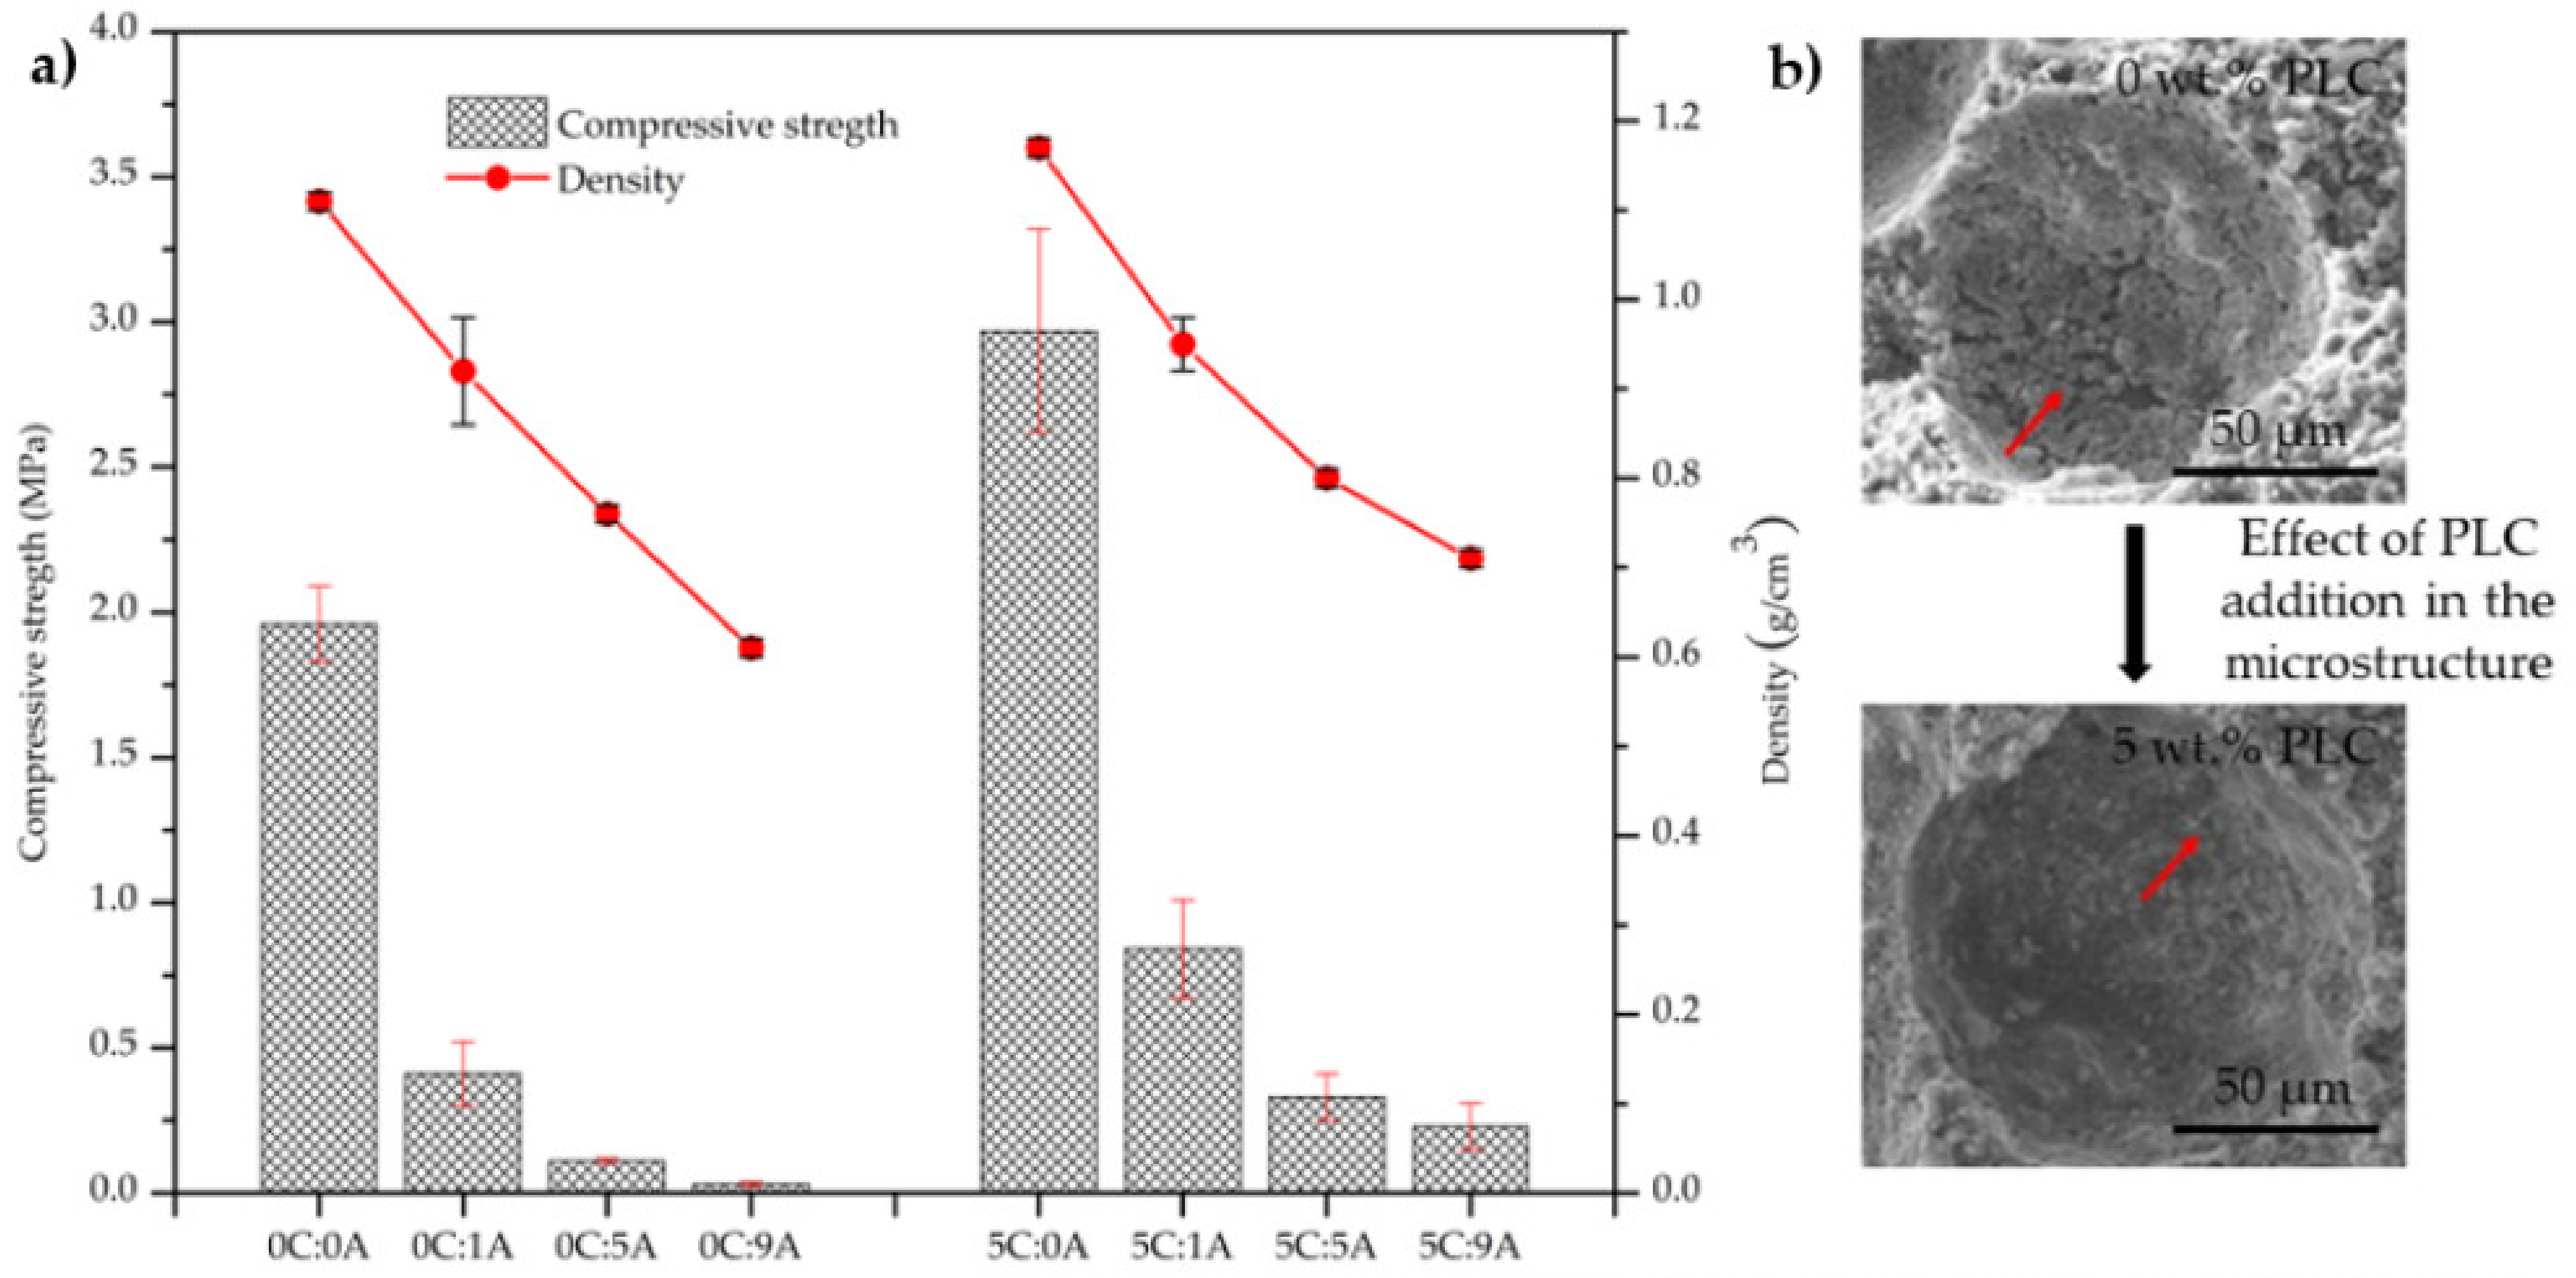
The influence of PLC and AP content on the monoliths’ compressive strength is presented in
Figure 6a, together with a scheme that exemplifies the PLC effect in the microstructure
Figure 6b. The increase in AP content (from 0 to 0.09 wt.%) promotes a decrease in the compressive strength of the samples (from 1.96 to 0.03 MPa in the compositions without PLC) and from 2.70 to 0.23 MPa in the compositions with 5 wt.% of PLC. This behaviour results from the increase in the porosity of the samples. For the same AP amount, the introduction of PLC leads to an increase in the mechanical strength of the samples that results from the better hydraulic characteristics of PLC, in comparison to BFA. PLC promotes stronger bonds between particles and the number of large voids, such as the one seen in
Figure 6b, decreased. Such voids tend to exhibit cracks in their inner wall, their occurrence being strongly attenuated by the presence of PLC. This also explains the mechanical resistance improvement in the samples with PLC.
The compressive strength of the sample without PLC and AP stays within the range of values reported by Illikainen et al. [
5] and Ohenoja et al. [
6] for self-hardened monoliths. However, the comparison between the results obtained here and in those works is only indicative since the preparation conditions are very different. In the two mentioned studies, the samples were kept for 28 days at room temperature in closed containers and in this study only 7 days, the water to total solids weight ratio (w/s) was higher (ranging from 0.48 to 1.50) and, although the used fly ash was also from a bubbling fluidised bed boiler, the burned fuel blends are different.


 ,
, 


