Article

Effects of Endurance Cycling on Mechanomyographic Median Power Frequency of the Vastus Lateralis

1
Department of Kinesiology, Applied Health, and Recreation, Oklahoma State University, Stillwater, OK 74075, USA
2
School of Exercise and Sport Science, University of Mary Hardin-Baylor, Belton, TX 76513, USA
3
Faculty of Kinesiology, University of Calgary, Calgary, AB T2N 1N4, Canada
4
Neuromuscular Research Laboratory, Department of Sports Medicine and Nutrition, University of Pittsburg, Pittsburgh, PA 15203, USA
5
Department of Chemical and Petroleum Engineering, The University of Kansas, Lawrence, KS 66045, USA
6
Department of Human Physiology, Gonzaga University, Spokane, WA 99258, USA
7
Neuromechanics Laboratory, Department of Health, Sport, and Exercise Sciences, The University of Kansas, Lawrence, KS 66045, USA
*
Author to whom correspondence should be addressed.
Appl. Sci. 2022, 12(10), 5213; https://doi.org/10.3390/app12105213
Submission received: 11 April 2022 / Revised: 12 May 2022 / Accepted: 19 May 2022 / Published: 21 May 2022
(This article belongs to the Section Applied Biosciences and Bioengineering)

Abstract

:
This study examined the effects of cycling training on mechanomyographic median power frequency (MMGMDF)–torque relationships of the vastus lateralis (VL). Ten males (Age ± SD; 20.20 ± 1.87 years) and 14 females (21.93 ± 5.33 years) performed isometric trapezoidal muscle actions with the knee extensors at 40% maximal voluntary contraction (MVC) before (PRE) and following 10 weeks of cycling training at the same absolute submaximal torque as pre-training (POSTABS). MMGMDF–torque relationships (increasing and decreasing segment) were log-transformed and b terms (slopes) were calculated. MMGMDF was averaged during steady torque. For POSTABS, the b terms for the females (0.133 ± 0.190) were greater than for the males (−0.083 ± 0.200; p = 0.013) and compared to PRE (0.008 ± 0.161; p = 0.036). At PRE, the b terms for the linearly increasing-muscle action (0.123 ± 0.192) were greater compared to the linearly decreasing-muscle action (−0.061 ± 0.188; p < 0.001), whereas no differences existed between muscle actions for POSTABS (p > 0.05). In conclusion, 10 weeks of cycling training resulted in different motor unit (MU) control strategies between sexes and altered MU control strategies between muscle actions for the VL during a moderate-intensity contraction.

1. Introduction

Surface mechanomyography (MMG) records low-frequency lateral oscillations produced from muscle fibers during a contraction [1]. These oscillations are believed to result from (1) the overall movement at the start of a muscle action, (2) ensuing oscillations at the resonant frequency of the active muscle, and (3) active fiber dimensional changes [1,2]. MMG represents the mechanical output of input excitation [3], and the frequency of the signal provides insight on the overall firing frequencies for the untetanized active motor units (MUs) [3,4,5,6,7].
Despite substantial interest regarding adaptations in neuromuscular behavior resulting from training, information regarding the effects of endurance cycling on MU firing frequencies is limited. Previously, Vila-Cha et al. [8] reported 6 weeks of primarily moderate-intensity continuous cycling (50–75% heart rate reserve [HRR]) significantly decreased MU firing frequencies of the vasti muscles and resulted in additional MU recruitment to complete a contraction at 30% of maximal strength for sedentary males. In addition, Trevino et al. [9] reported higher-threshold MUs of the VL exhibited a decrease in average firing frequencies following 5 weeks of vigorous-intensity continuous cycling training (70–75% HHR) in sedentary females during contractions with targeted torques at 40% of pre- and post-training strength. Conversely, Martinez-Valdes et al. [10] indicated firing frequencies of the VL were unchanged during various submaximal MVCs following 2 weeks of prolonged (90–120 min) cycling (~65% VO2PEAK) in males. Despite the MMG signal being a relatively inexpensive measurement tool that is easy to interpret and that requires minimal signal processing compared to advanced single MU techniques, only one study has utilized MMG to examine the possible adjustments in MU behavior of the VL as a result of cycling. Recently, our group [11] reported that 10 weeks of high-intensity (70–90% HRR) continuous cycling training significantly increased maximal aerobic capacity by ~15% yet significantly reduced knee extensor MVC by ~4% for sedentary males and females. Following training, MMG amplitude (MMGRMS)–torque relationships of the VL indicated increased MU recruitment was necessary to complete a linearly increasing muscle action to 70% of pre-training MVC, therefore suggesting MMG is sensitive to adjustments in MU activation strategies following short-term endurance training. However, it has yet to be investigated if short-term endurance training would alter MU deactivation strategies (linearly decreasing muscle action). In addition, although median power frequency (MDF) of the MMG signal may present information on MU firing rates [12], no study has examined possible changes in MMGMDF–torque relationships for the VL due to continuous cycling training. Furthermore, it is plausible that adjustments in MU behavior following endurance training differ between moderate- and high-intensity contractions, as the former would primarily result in the recruitment of MUs that possess type I fiber characteristics, whereas the latter would activate MUs that possess characteristics of both fiber types (I and II). Consequently, more research is necessary.
It is suggested that the MMG–torque relationship should be examined with a subject-to-subject comparison [13,14,15], as analyzing composite means may not obscure changes in the linearity of the individual patterns due to large inter-subject variability [6]. Thus, Herda et al. [5] suggested log-transforming the MMG–force relationships for each contraction and utilizing linear regression to calculate b terms (slopes) and investigate potential changes in the subject patterns. Further insight concerning the linearity of the original relationships is also provided by the 95% confidence intervals (CIs) calculated for the b terms [16], such as b terms with 95% CIs that include 1 indicate a linear relationship between MMGMDF and torque. Moreover, if the 95% CIs < 1, torque changes at a greater rate than MMGMDF. The b terms from MMGRMS–torque relationships recently have indicated alterations in MU behavior during a high-intensity contraction (70% MVC) following 10 weeks of cycling training [11]. However, it remains unknown if the b terms calculated from MMGMDF–torque relationships are sensitive to changes in MU behavior for the VL following endurance training. In addition, it is possible that different adjustments in MU behavior may occur during a moderate-intensity contraction in comparison to a high-intensity contraction.
Therefore, this study analyzed the effects of a 10-week, high-intensity (70–90% HRR) continuous cycling program on MMGMDF–torque relationships of the VL during a trapezoidal muscle action performed before and after training at 40% of pre-training MVC in sedentary males and females. MMGMDF provides qualitative information regarding MU firing rates [12]. Thus, a moderate intensity contraction was selected, as Trevino et al. [9] and Vila-Cha et al. [8] reported changes in MU firing frequencies for the VL after 5 and 6 weeks of endurance cycling, and MMGMPF recorded from the VL has differentiated between aerobically- and resistance-trained individuals [17] during contraction intensities ranging from 30–50% MVC, respectively. In addition, endurance cycling significantly increases the percentage of type I fibers [18], which possess lower twitch forces [19]. Therefore, investigating an absolute torque level with MMGMDF may elucidate if changes in MU control strategies are necessary to match a pre-training task [9,11].

2. Materials and Methods

2.1. Subjects

Ten healthy males (mean ± SD; age: 20.20 ± 1.87 years; height: 179.50 ± 4.95 cm; body mass: 77.50 ± 8.66 kg) and 14 healthy females (age: 21.93 ± 5.33 years; height: 163.93 ± 5.10 cm; body mass: 63.70 ± 12.97 kg) participated in this study. All participants reported they had not engaged in any organized exercise the 3 years before the study and had no present or previous injuries or neuromuscular diseases of the lower body. The university’s institutional review board approved this study. Proper consent was given by all subjects.

2.2. VO2MAX Testing

Participants completed testing on a Lode electrically braked cycle ergometer. Before testing, seat height was matched to the greater trochanter of the participant while standing. Participants mounted the bike and researchers confirmed a slight knee bend at the bottom of the pedaling motion. The feet of the participants were secured to the pedal with foot straps, and seat height was recorded and standardized between experimental sessions. After a 2-min warm-up at 25 W, resistance increased 25 W each minute. The researchers instructed participants to pedal at 70 rpm. When the rpm decreased below 60 (volitional fatigue), the test was ended. Three indicators defined by the American College of Sports Medicine had to be achieved for a valid test [20]. Polar FT7 Heart Rate Monitors measured heart rates. The target heart rates for training were based upon the maximal heart rate recorded during testing.
A metabolic measurement system (Parvo Medics TrueOne® 2400) was used to detect respiratory gases. Prior to testing, the metabolic cart was calibrated with standard gases and a calibration with a flow meter was performed. A mouthpiece and two-way rebreathing valve that was held in place with head gear (Hans Rudolph Inc., Shawnee, KS, USA) were used to collect respiratory gases. A nose clip was worn by participants to ascertain breathing only occurred through the mouth. After passing through a mixing chamber and heated pneuomotach, a sampling line was used to analyze O2 and CO2. Values were reported as VO2MAX.

2.3. Ultrasound Imaging

Subcutaneous fat (sFAT) over the VL was measured with a brightness mode (B-mode) ultrasound device that had a multi-frequency linear array probe. GE logiq e Logic View software was utilized for imaging the VL. All scans were recorded from the right leg halfway between the top patellar border and the anterior superior iliac spine. Before imaging, participants laid supine on a table for 10 min to allow fluid shifting in the leg. Settings were constant for all participants and the researchers avoided compressing the muscle with the probe during the scans. Liberal amounts of ultrasound gel were used to limit near-field artifacts and increase acoustic coupling. A pad was placed at 90° of the longitudinal axis for the VL to guarantee the probe was moved along the transverse plane. A single cross-sectional area image for the VL was captured with the panoramic function. ImageJ software (version 1.46r) was used to analyze all captured images. The straight-line function was utilized to scale all images from pixels to cm. sFAT was assessed as the interval from the superficial aponeurosis of the VL and the skin.

2.4. Isometric Strength Testing

Testing occurred on a dynamometer (Biodex System 3, Shirley, NY, USA) and participants were secured to the chair with belts across the upper torso, left thigh, and pelvis. The dynamometer input axis and the right femur lateral condyle were aligned per the Biodex user manual. To ensure consistency, the personal Biodex settings for each participant were recorded at pre-testing and replicated post-testing. Testing occurred on the right leg with knee flexion at 90° and strength was determined with the torque signal recorded from the Biodex.
For testing, subjects completed 3 MVCs of the knee extensors that were 3 s in length. Strong verbal encouragement was given and the greatest torque output represented maximal strength for the respective visit. After the MVCs, subjects completed the isometric trapezoidal muscle action. For baseline testing, the trapezoidal muscle action was performed at 40% of MVC (PRE), whereas following training, the isometric trapezoid was completed at the same targeted absolute torque as the pre-training 40% MVC (POSTABS). In both of the isometric trapezoids, there was a segment that increased to the targeted torque level at 10% MVC/s, a 12 s plateau, followed by a segment that decreased back to baseline at 10% MVC/s (Figure 1). Thus, both isometric trapezoids lasted 20 s. Torque output was presented to the subjects in real time with a computer screen and they were directed to trace the targeted template as closely as possible. If subjects were unable to trace the targeted torque, they were allowed a second attempt after five minutes of rest.

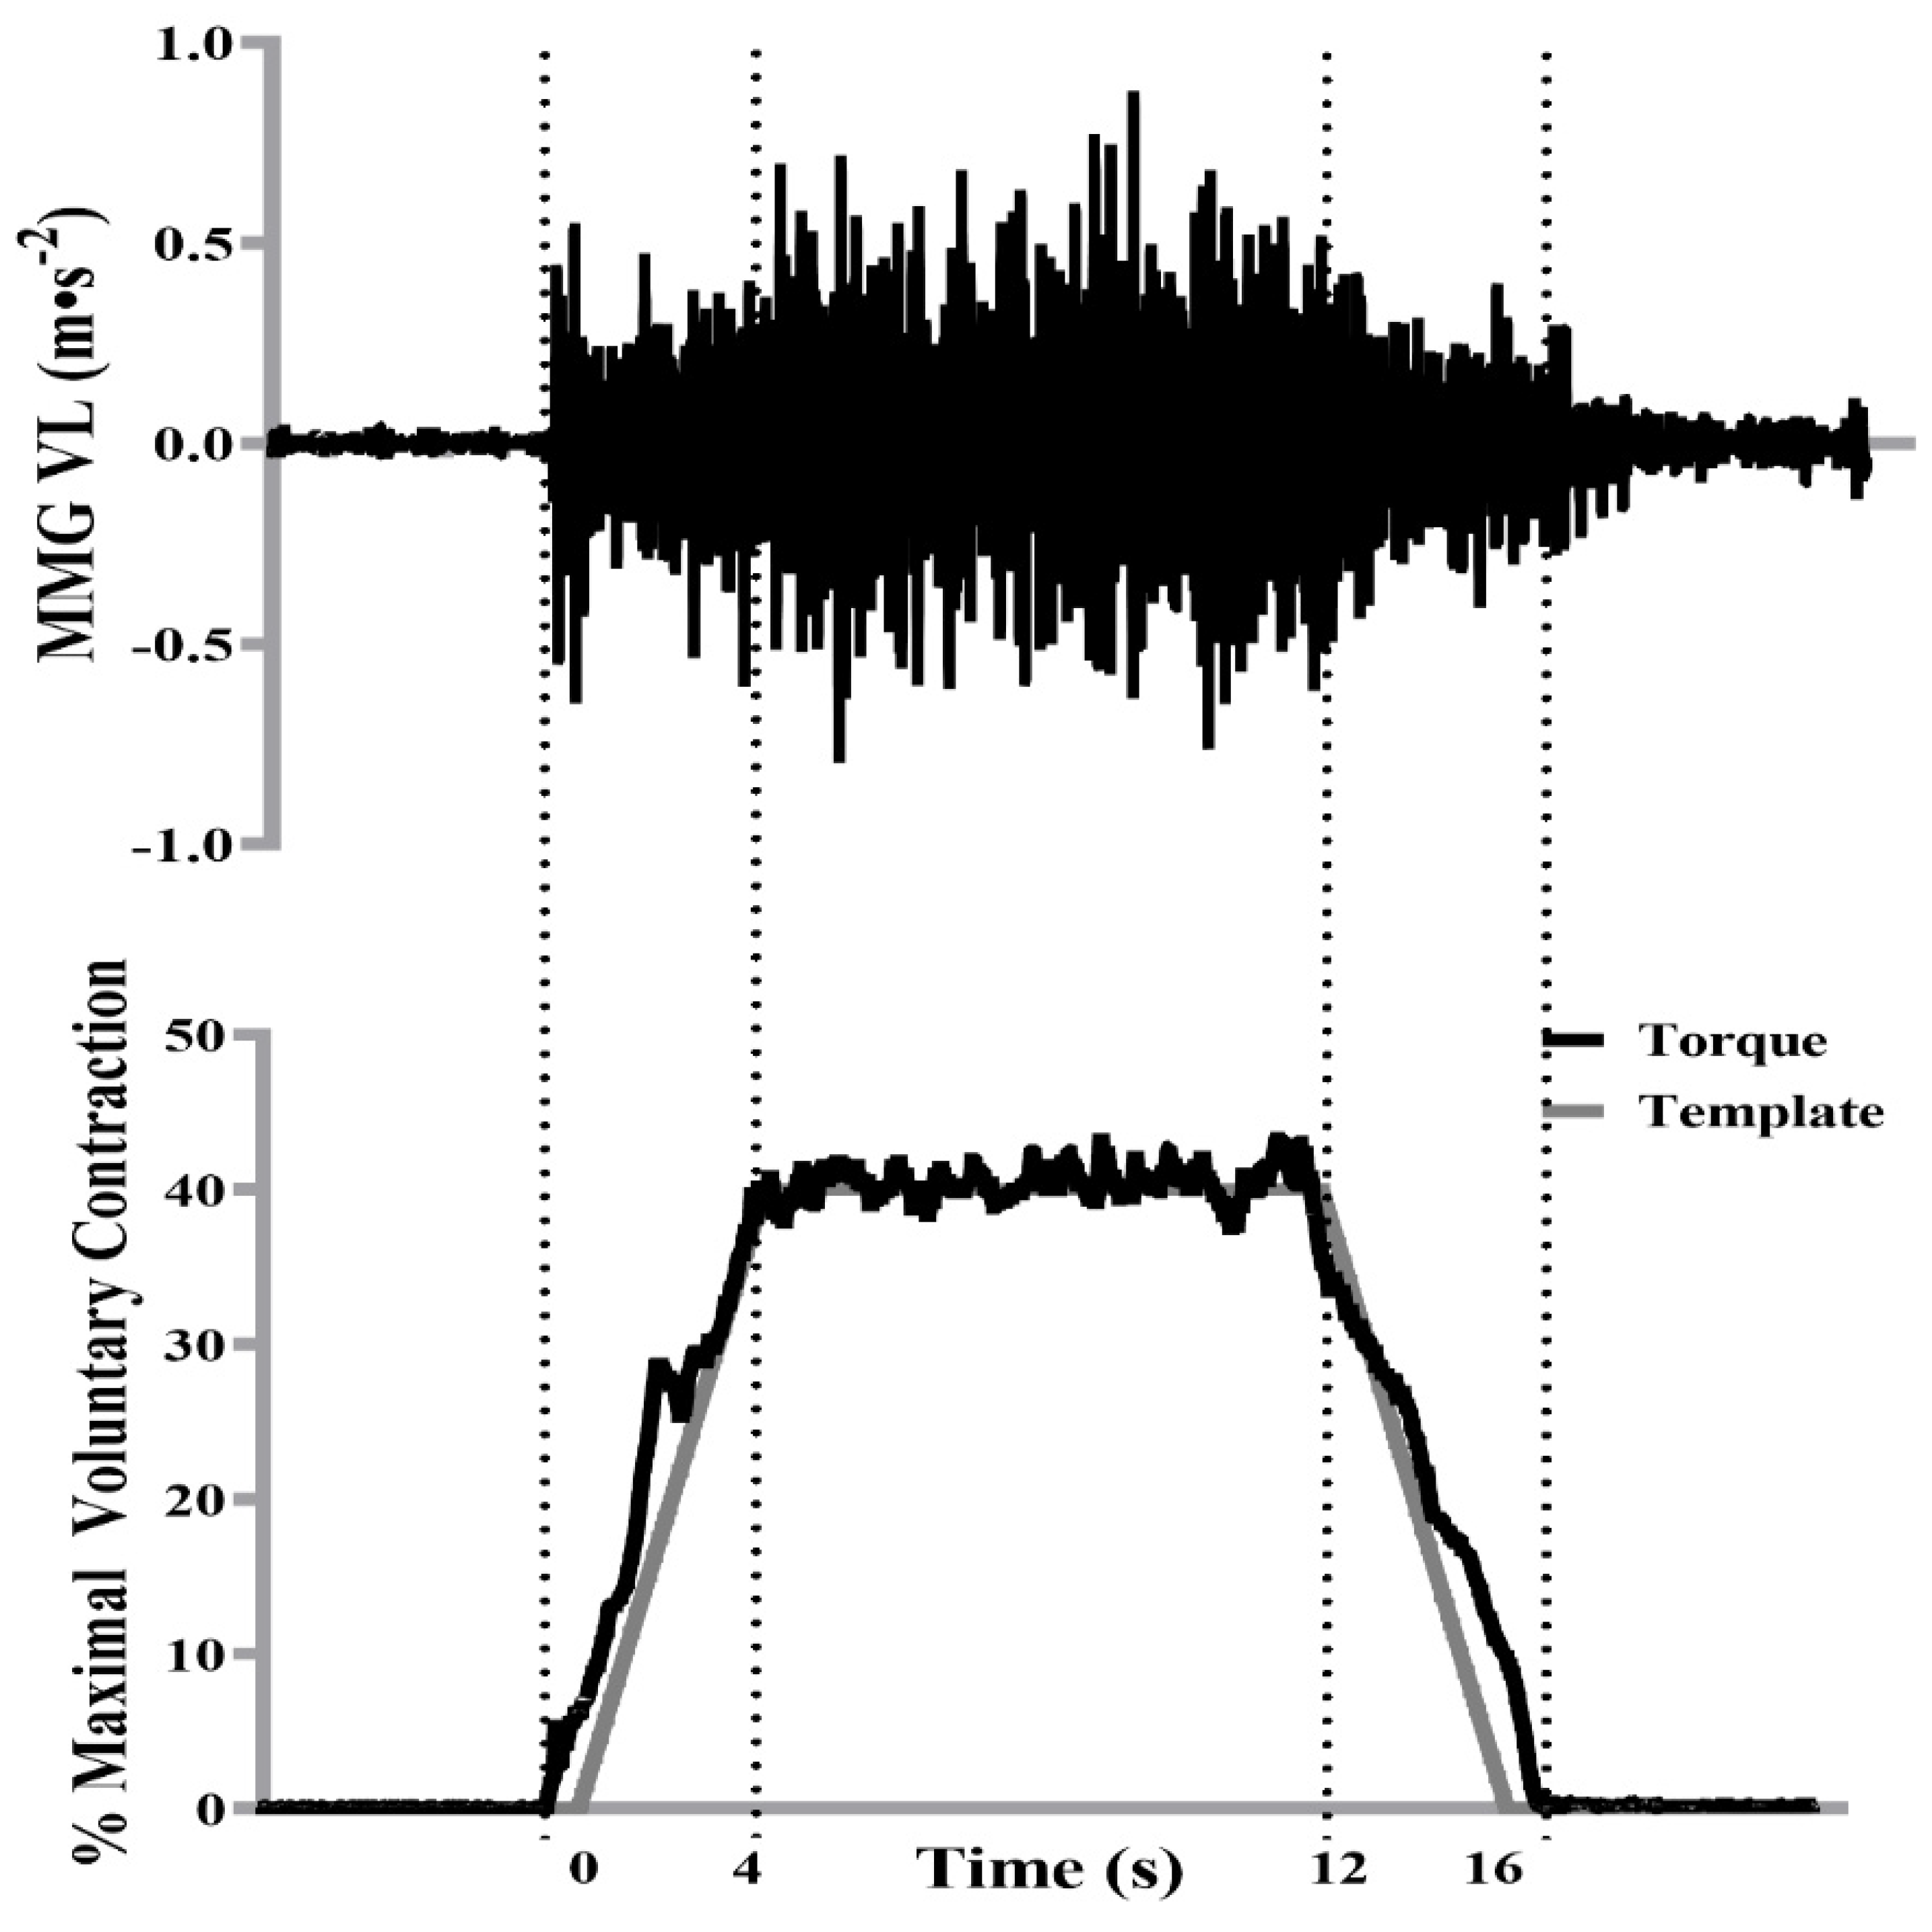
2.5. Mechanomyography and Signal Processing

MMG was measured from the VL with a model 352A24 active miniature accelerometer (PCB Piezotronics) during the trapezoidal contractions. The accelerometer was secured at halfway between the greater trochanter and the femur lateral condyle on the lateral/anterior portion of the VL. Before the MMG sensor was placed on the skin with double-sided tape, the area was shaved and the sensor location was marked with a felt tip pen. The accelerometer position was also measured to keep the location of the accelerometer consistent between pre- and post-testing. Participants remarked the location of the accelerometer when necessary during the duration of the study. The same researcher performed accelerometer placement and the measurements.
The torque (Nm) and MMG (m/s2) signals were recorded simultaneously by a National Instruments compact data acquisition system at 2 kHz (NI cDAQ-9174). MMG was bandpass filtered (fourth-order Butterworth) within 5–100 Hz. For the linearly increasing and decreasing segments of the trapezoidal contractions, successive, non-overlapping 0.25 s epochs were examined for torque and MMG. MMGMDF was analyzed during the 12 s steady torque segment by averaging each 0.25 s epoch value. Quarter-second epochs have been used [7] to minimize non-stationarity in MMG signals [21]. A Hamming window and discrete Fourier transform algorithm were utilized for processing each epoch. Signal frequency was calculated as median power frequency (MDF). All recorded signals were saved and analyzed offline with custom-written software (LabVIEW, version 18).

2.6. Continuous Cycle Training

All training was performed on Life Fitness Upright Bikes (Model CLSC). The 10-week program consisted of 4 cycling sessions a week, resulting in 40 total training sessions. Prescribed exercise intensities were in accordance with the higher recommendations of HRR and training heart rates were caclulated using the Karvonen method [22]. It is recommended that percent HRR be used to prescribe exercise intensities [23] for low fitness populations [24].
During weeks 1–3, subjects cycled at 70–75% of HRR for 30 min. For weeks 4–6, subjects trained 40 min at 75–80% HRR, whereas for weeks 7–10, training was 40 min at 80–90% HRR. Subjects were presented their heart rates in real-time with Polar FT7 Heart Rate Monitors. Research assistants supervised all training session and recorded heart rates in 3 min intervals to confirm participants were training at the prescribed intensity. Every subject completed all training sessions in their entirety.

2.7. Statistical Analysis

For the linear increasing and decreasing muscle actions (Figure 1), a natural log-transformation was applied to the MMGMDF and torque values. Slopes (b terms) were calculated for each subject via linear regressions performed on the log-transformed MMGMDF–torque relationships and were used for statistical comparisons [7,9,11,16,25,26]. Microsoft Excel® version 16 was used to calculate the b terms.
For the steady torque segment (Figure 1), MMGMDF was averaged across each 0.25 epoch for the entirety of the 12 s plateau.
A 3-way mixed factorial ANOVA (sex [males vs. females] × time [PRE vs. POSTABS] × segment [increase vs. decrease]) compared the b terms. A 2-way mixed factorial ANOVA (sex [males vs. females] × time [pre vs. POSTABS]) compared MMGMDF during the 12 s plateau. Six Pearson’s product-moment correlation coefficients were performed for examining potential relationships for sFAT and b terms during the linearly varying muscle actions and MMGMDF at steady torque before and after training. Independent and dependent samples t-tests were used for follow-up analyses when necessary. Alpha was p ≤ 0.05. Statistical tests were performed with SPSS 20.

3. Results

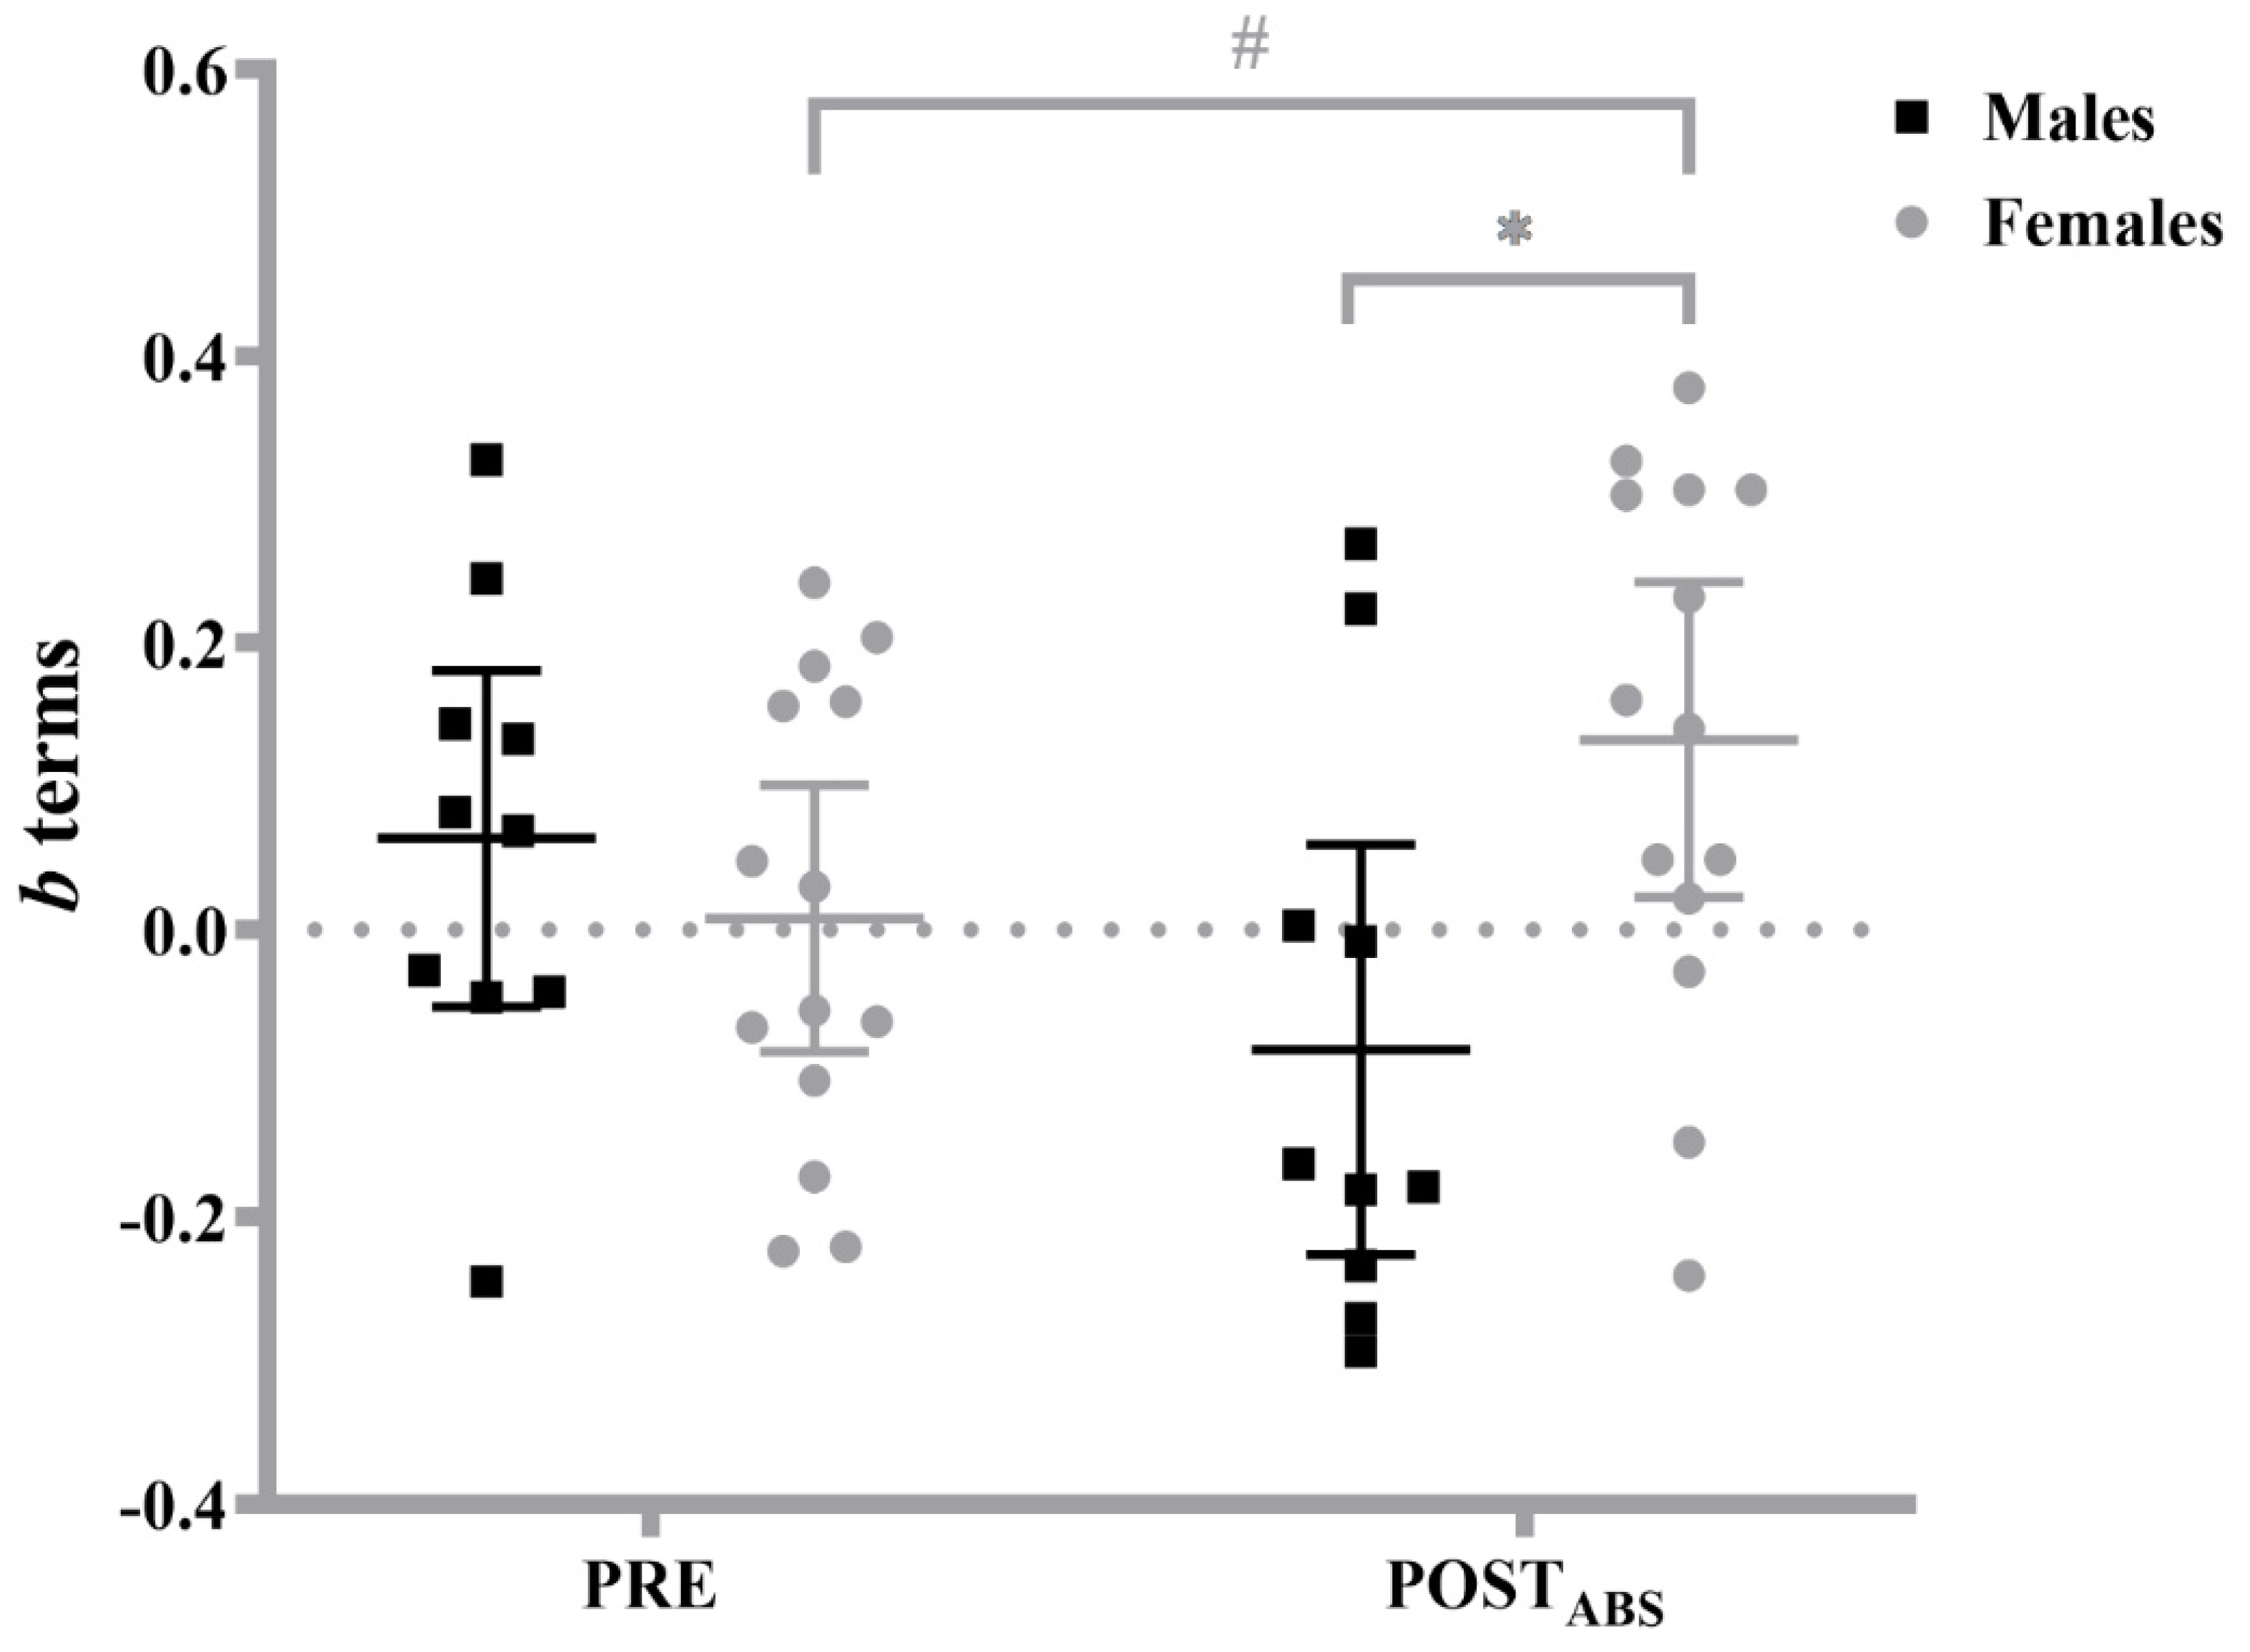
3.1. Log-Transformed MMGMDF–Torque Relationships

For b terms, there was no three-way interaction (time × segment × sex; p = 0.681) or two-way interaction for segment and sex (p = 0.385). There was a two-way interaction for sex and time (p = 0.010). The b terms for the females increased from PRE (0.008 ± 0.161) to POSTABS (0.133 ± 0.190; p = 0.036). Additionally, at POSTABS, the b terms for the females were greater than for males (−0.083 ± 0.200; p = 0.013) (Figure 2). There was a two-way interaction for time and segment (p = 0.034). At PRE, the b terms for the linear increase (0.123 ± 0.192) were greater compared to the linear decrease (−0.061 ± 0.188; p < 0.001) (Figure 3). No other differences were observed among time, segments, or sexes. The means, standard deviations, and 95% CIs of the b terms for contraction, segment, and sex can be found in Table 1. The MMGMDF–torque patterns from the linear increase and decrease for the males and females during the PRE and POSTABS torque levels are illustrated in Figure 4.

3.2. Steady Torque Segment

There was no two-way interaction for MMGMDF (time × sex; p = 0.378) or main effect for time (p = 0.661). There was a main effect for sex (p = 0.010). MMGMDF was greater for males (21.33 ± 3.15 Hz) than for females (17.47 ± 3.42 Hz), collapsed across time.

3.3. Correlations

sFAT was correlated with MMGMDF during steady torque at PRE (p = 0.002, r = −0.609) and POSTABS (p = 0.002, r = −0.599). There was a correlation between sFAT and the b terms during the linearly decreasing segment at POSTABS (p = 0.005, r = 0.544). However, there were no other relationships during the linearly varying segments at PRE (p = 0.474–0.787) or the linearly increasing segment at POSTABS (p = 0.110).

3.4. sFAT Matched Subset Analyses

Due to significant relationships between sFAT and MMGMDF for the steady torque levels at PRE and POSTABS, an additional analysis was performed for a subset of males (n = 6) and females (n = 5) matched for sFAT. A two-way mixed factorial ANOVA (sex × time) examining differences for sFAT indicated no significant interaction or main effects for sex or time (p > 0.050). Additionally, a two-way mixed factorial ANOVA (sex × time) examining differences for MMGMDF at steady torque indicated neither a significant interaction nor main effects for sex or time (p > 0.050). Thus, it should be stated the sex-related differences for MMGMDF at steady torque may be due to the filtering effect of sFAT [27].

4. Discussion

Significant findings for the MMGMDF-torque relationships include: (1) greater b terms for the linear increasing in comparison to the linearly decreasing segment at PRE, (2) greater b terms for females in comparison to the males at POSTABS, and (3) a significant increase in b terms for the females post-cycling training. For the MMGMDF-torque relationships, the 95% CIs calculated for the b terms during the linearly increasing and decreasing segments of the PRE and POSTABS targeted torques were all considerably < 1 for the males and females, respectively. Thus, the patterns were nonlinear, as the rate of change for torque (X variable) was greater than MMGMDF (Y variable) for both muscle actions before and after training.
Prior to the continuous cycle training program, there were no differences in the b terms between males and females. However, there were training-induced changes for only the females, such as a significant increase in b terms when matching the POSTABS torque level (Figure 3). Consequently, females exhibited a later deflection point in the MMGMDF–torque relationships in comparison to PRE. It is suggested that MMGMDF provides insight regarding global firing frequencies of unfused active MUs [12]. Thus, the larger b terms exhibited by the females suggests a greater reliance on increasing MU firing rates for the unfused MUs to modulate torque following training, whereas the similar b terms for the males at the PRE and POSTABS targeted torques suggest MU control strategies (respective contributions of MU recruitment and rate coding) were unchanged. The lack of change in b terms for the males supports Martinez-Valdes et al. [10], which reported two weeks of long duration cycling training had no effect on MU firing rates at various contraction intensities in men. However, the results for the current study contrast with those of Sontag et al. [11], which reported 10 weeks of cycling training increased the b terms in the MMGRMS–torque relationship in males and females during a linearly increasing muscle action up to 70% of pre-training MVC, suggesting increased MU recruitment. The training-related increase of b terms by the females during the POSTABS contraction for the current study also elicited sex-related differences at post-training. Subsequently, these findings in conjunction with Sontag et al. [11] may suggest sex-specific adaptations in MU control strategies following endurance training during moderate-intensity, but not high-intensity, contractions. Nonetheless, the b terms calculated for the MMGMDF–torque relationships indicated 10 weeks of cycling elicited training-related differences for the females, resulting in sex-related differences at post-testing.
In addition, there were divergent findings between muscle actions before and after training. For example, for PRE, the b terms during the linearly increasing segment were greater than during the linearly decreasing segment, whereas there were no differences between muscle actions for POSTABS (Figure 4). It is well known that lower-threshold MUs possess greater firing frequencies than higher-threshold MUs [28] and, thus, the findings at PRE suggest a greater dependence on earlier recruited, lower-threshold MUs to modulate torque during the linearly increasing segment and the activation of higher-threshold MUs to modulate torque during the linearly decreasing segment. Previously, Trevino and Herda [25] reported similar b-term differences between muscle actions for MMGMPF–force relationships during a trapezoidal muscle action at 70% MVC, but not 50% or 60% MVC, in sedentary individuals. Although speculative, it is possible MMGMDF is more sensitive than MMGMPF at lower contraction intensities, as the authors reported no differences in b terms between muscle actions or among training statuses (sedentary, chronic aerobically- and resistance-trained) during contractions at 50% and 60% MVC. Future research should compare the sensitivity of MMG mean- and median-power frequency among contraction intensities and training statuses, and between muscle actions.
Following 10 weeks of training, the b terms were not different between muscle actions for POSTABS. Although the training did not result in any longitudinal changes for the b terms during the increasing or decreasing segments, the linearity of the relationships was altered. For example, the 95% CIs around the b terms during the linearly increasing segment were >0 for PRE; however, they included zero for POSTABS (Figure 3). Recently, it was reported that 5 weeks of high-intensity continuous cycling decreased MVC of the knee extensors and resulted in a larger percentage of higher-threshold MUs being recruited to match a 40% targeted torque relative to pre-training MVC [9]. Therefore, the change in the linearity of the b terms during the linearly increasing muscle action following training for the current study may reflect an accelerated activation of higher threshold MUs [11,29], which exhibit lower firing frequencies [28,30], to modulate torque for POSTABS. It has been reported that endurance training increases fatigue resistance [18] but is reported to have no effect on MU potentiation [31] and may explain the similar b terms between both segments for POSTABS, as MUs would be recruited and derecruited at the same relative torque (% MVC) during both muscle actions, respectively.
The isometric trapezoidal template also allows the examination of MU behavior during steady torque, similar to a step contraction [6]. For the current study, sex-related differences were observed independent of training. For example, males exhibited greater MMGMDF values before and after training. However, it should be noted that sFAT was correlated (p = 0.002) with MMGMDF during steady torque at PRE (r = −0.609) and POSTABS (r = −0.599). It has been reported that the MMG signal can be low-pass filtered by fat tissue, thereby attenuating the higher frequencies [27]. Subsequently, we performed a secondary analysis examining MMGMDF between a subset of males and females matched for sFAT, which indicated no sex-related differences (p = 0.395). Thus, the physiological interpretation for the greater MMGMDF values exhibited by the males during steady torque for the overall cohort is unclear. Consequently, investigating log-transformed MMGMDF-torque relationships with an isometric trapezoidal template may provide the most relevant physiological information to examine changes in MU behavior, as sFAT did not influence the b terms for this study and numerous investigations [11,16,26,27,32,33].
Although high-intensity cycling training has previously increased cardiorespiratory fitness, it has been associated with maximal strength decreases [9,11]. In addition, it has been reported that solely engaging in cycling training can have deleterious effects on bone mineral density [34]. Thus, it has been suggested that individuals include resistance and aerobic training in their exercise routines throughout the lifespan to improve bone health and muscular strength [35,36,37].

5. Conclusions

This is the first examination of short-term endurance training on MMGMDF–torque relationships of the VL. Ten weeks of continuous cycling elicited sex-specific adaptations, which also resulted in sex-related differences following training. The greater b terms exhibited by the females post-cycling suggests a larger reliance on increasing MU firing rates to modulate torque compared to baseline and compared to males post-training. Additionally, continuous cycling training altered MU activation and deactivation strategies. For PRE, the b terms suggested individuals relied primarily on MU firing rates when matching the targeted torque during the linearly increasing muscle action compared to the linearly decreasing muscle action. However, following training, the b terms were not different between muscle actions, suggesting that the relative contributions of MU recruitment and rate coding for the unfused MUs were similar during the linearly varying segments. Thus, MMGMDF–torque relationships may provide insight on unique adaptations in MU control strategies of the VL between sexes and muscle actions following continuous cycling training.

Author Contributions

M.A.T. and T.J.H.; conceptualization and methodology. M.A.T., J.A.D., S.A.S., A.J.S., J.D.M., M.E.P. and H.L.D.; data collection. M.A.T., S.P., S.A.S., A.A.O., A.J.S., J.D.M., M.E.P., H.L.D., J.A.D. and T.J.H.; data analysis. S.P. and M.A.T.; writing—original draft preparation. M.A.T., S.P., S.A.S., A.A.O., J.D.M., A.J.S., H.L.D., M.E.P., J.A.D. and T.J.H.; writing—review and editing. All authors have read and agreed to the published version of the manuscript.

Funding

National Strength and Conditioning Association Foundation Doctoral Grant FND0074499. University of Kansas Doctoral Student Research Fund (DSRF) grant.

Institutional Review Board Statement

The study was conducted according to the guidelines of the Declaration of Helsinki and approved by the Institutional Review Board of University of Kansas-Lawrence (protocol code #00002953; 16 September 2015).

Informed Consent Statement

Informed consent was obtained from all subjects.

Data Availability Statement

Please contact the corresponding author for access.

Acknowledgments

We would like to thank P.R. Maier and J.D. Lippman who aided in data collection and analysis, as well as each subject for their selfless participation.

Conflicts of Interest

The authors declare no conflict of interest.

References

  1. Orizio, C. Muscle sound: Bases for the introduction of a mechanomyographic signal in muscle studies. Crit. Rev. Biomed. Eng. 1993, 21, 201–243. [Google Scholar] [PubMed]
  2. Barry, D.; Cole, N. Muscle sounds are emitted at the resonant frequencies of skeletal muscle. IEEE Trans. Biomed. Eng. 1990, 37, 525–531. [Google Scholar] [CrossRef] [PubMed]
  3. Coburn, J.W.; Housh, T.J.; Cramer, J.T.; Weir, J.P.; Miller, J.M.; Beck, T.W.; Malek, M.H.; Johnson, G.O. Mechanomyographic and electromyographic responses of the vastus medialis muscle during isometric and concentric muscle actions. J. Strength Cond. Res. 2005, 19, 412–420. [Google Scholar] [CrossRef] [PubMed]
  4. Beck, T.W.; Housh, T.J.; Johnson, G.O.; Cramer, J.T.; Weir, J.P.; Coburn, J.W.; Malek, M.H. Does the frequency content of the surface mechanomyographic signal reflect motor unit firing rates? A brief review. J. Electromyogr. Kinesiol. 2007, 17, 1–13. [Google Scholar] [CrossRef] [PubMed]
  5. Herda, T.J.; Ryan, E.D.; Beck, T.W.; Costa, P.B.; DeFreitas, J.M.; Stout, J.R.; Cramer, J.T. Reliability of mechanomyographic amplitude and mean power frequency during isometric step and ramp muscle actions. J. Neurosci. Methods 2008, 171, 104–109. [Google Scholar] [CrossRef] [PubMed]
  6. Ryan, E.D.; Beck, T.W.; Herda, T.J.; Hartman, M.J.; Stout, J.R.; Housh, T.J.; Cramer, J.T. Mechanomyographic amplitude and mean power frequency responses during isometric ramp vs. step muscle actions. J. Neurosci. Methods 2008, 168, 293–305. [Google Scholar] [CrossRef]
  7. Trevino, M.A.; Herda, T.J. Mechanomyographic mean power frequency during an isometric trapezoid muscle action at multiple contraction intensities. Physiol. Meas. 2015, 36, 1383–1397. [Google Scholar] [CrossRef]
  8. Vila-Chã, C.; Falla, D.; Farina, D. Motor unit behavior during submaximal contractions following six weeks of either endurance or strength training. J. Appl. Physiol. 2010, 109, 1455–1466. [Google Scholar] [CrossRef] [Green Version]
  9. Trevino, M.A.; Dimmick, H.L.; Parra, M.E.; Sterczala, A.J.; Miller, J.D.; Deckert, J.A.; Gallagher, P.M.; Fry, A.C.; Weir, J.P.; Herda, T.J. Effects of continuous cycling training on motor unit firing rates, input excitation, and myosin heavy chain of the vastus lateralis in sedentary females. Exp. Brain Res. 2022, 240, 825–839. [Google Scholar] [CrossRef]
  10. Martinez-Valdes, E.; Falla, D.; Negro, F.; Mayer, F.; Farina, D. Differential Motor Unit Changes after Endurance or High-Intensity Interval Training. Med. Sci. Sports Exerc. 2017, 49, 1126–1136. [Google Scholar] [CrossRef] [Green Version]
  11. Sontag, S.A.; Trevino, M.A.; Herda, T.J.; Sterczala, A.J.; Miller, J.D.; Parra, M.E.; Dimmick, H.L.; Deckert, J. Endurance training alters motor unit activation strategies for the vastus lateralis, yet sex-related differences and relationships with muscle size remain. Eur. J. Appl. Physiol. 2021, 121, 1367–1377. [Google Scholar] [CrossRef]
  12. Beck, T.W.; Housh, T.J.; Cramer, J.T.; Weir, J.P.; Johnson, G.O.; Coburn, J.W.; Malek, M.H.; Mielke, M. Mechanomyographic amplitude and frequency responses during dynamic muscle actions: A comprehensive review. Biomed. Eng. Online 2005, 4, 67. [Google Scholar] [CrossRef] [PubMed] [Green Version]
  13. Orizio, C.; Perini, R.; Veicsteinas, A. Muscular sound and force relationship during isometric contraction in man. Eur. J. Appl. Physiol. Occup. Physiol. 1989, 58, 528–533. [Google Scholar] [CrossRef] [PubMed]
  14. Zwarts, M.J.; Keidel, M. Relationship between electrical and vibratory output of muscle during voluntary contraction and fatigue. Muscle Nerve 1991, 14, 756–761. [Google Scholar] [CrossRef] [PubMed]
  15. Farina, D.; Merletti, R.; Enoka, R.M. The extraction of neural strategies from the surface EMG: An update. J. Appl. Physiol. 2014, 117, 1215–1230. [Google Scholar] [CrossRef] [PubMed] [Green Version]
  16. Herda, T.J.; Housh, T.J.; Fry, A.C.; Weir, J.P.; Schilling, B.; Ryan, E.D.; Cramer, J.T. A noninvasive, log-transform method for fiber type discrimination using mechanomyography. J. Electromyogr. Kinesiol. 2010, 20, 787–794. [Google Scholar] [CrossRef]
  17. Beck, T.W.; Housh, T.J.; Fry, A.C.; Cramer, J.; Weir, J.P.; Schilling, B.; Falvo, M.J.; Moore, C.A. The influence of muscle fiber type composition on the patterns of responses for electromyographic and mechanomyographic amplitude and mean power frequency during a fatiguing submaximal isometric muscle action. Electromyogr. Clin. Neurophysiol. 2007, 47, 221–232. [Google Scholar]
  18. Howald, H.; Hoppeler, H.; Claassen, H.; Mathieu, O.; Straub, R. Influences of endurance training on the ultrastructural composition of the different muscle fiber types in humans. Pflüg. Archiv. 1985, 403, 369–376. [Google Scholar] [CrossRef]
  19. Garnett, R.A.; O’Donovan, M.; Stephens, J.A.; Taylor, A. Motor unit organization of human medial gastrocnemius. J. Physiol. 1979, 287, 33–43. [Google Scholar] [CrossRef]
  20. Whaley, M.H.; Brubaker, P.H.; Otto, R.M.; Armstrong, L.E. ACSM’s Guidelines for Exercise Testing and Prescription; Lippincott Williams & Wilkins: Philadelphia, PA, USA, 2006. [Google Scholar]
  21. Beck, T.W.; DeFreitas, J.M.; Stock, M.S.; Dillon, M.A. An examination of mechanomyographic signal stationarity during concentric isokinetic, eccentric isokinetic and isometric muscle actions. Physiol. Meas. 2010, 31, 339–361. [Google Scholar] [CrossRef]
  22. Karvonen, M.; Kentala, K.; Mustala, O. The effects of training heart rate: A longitudinal study. Ann. Med. Exp. Biol. Fenn. 1957, 35, 307–315. [Google Scholar] [PubMed]
  23. Lounana, J.; Campion, F.; Noakes, T.D.; Medelli, J. Relationship between %HRmax, %HR Reserve, %VO2max, and %VO2 Reserve in Elite Cyclists. Med. Sci. Sports Exerc. 2007, 39, 350–357. [Google Scholar] [CrossRef] [PubMed]
  24. Swain, D.P. Energy Cost Calculations for Exercise Prescription. Sports Med. 2000, 30, 17–22. [Google Scholar] [CrossRef]
  25. Trevino, M.A.; Herda, T.J. The effects of training status and muscle action on muscle activation of the vastus lateralis. Acta Bioeng. Biomech. 2015, 17, 107–114. [Google Scholar]
  26. Trevino, M.A.; Herda, T.J. The effects of chronic exercise training status on motor unit activation and deactivation control strategies. J. Sports Sci. 2015, 34, 199–208. [Google Scholar] [CrossRef] [PubMed]
  27. Cooper, M.A.; Herda, T.J.; Vardiman, J.P.; Gallagher, P.M.; Fry, A.C. Relationships between skinfold thickness and electromyographic and mechanomyographic amplitude recorded during voluntary and non-voluntary muscle actions. J. Electromyogr. Kinesiol. 2014, 24, 207–213. [Google Scholar] [CrossRef] [PubMed]
  28. De Luca, C.J.; Contessa, P. Biomechanical benefits of the Onion-Skin motor unit control scheme. J. Biomech. 2014, 48, 195–203. [Google Scholar] [CrossRef] [Green Version]
  29. Farina, D.; Holobar, A.; Gazzoni, M.; Zazula, D.; Merletti, R.; Enoka, R.M. Adjustments differ among low-threshold motor units during intermittent, isometric contractions. J. Neurophysiol. 2009, 101, 350–359. [Google Scholar] [CrossRef] [Green Version]
  30. De Luca, C.J.; Contessa, P. Hierarchical control of motor units in voluntary contractions. J. Neurophysiol. 2012, 107, 178–195. [Google Scholar] [CrossRef] [Green Version]
  31. De Luca, C.J.; Kline, J.C.; Contessa, P. Transposed firing activation of motor units. J. Neurophysiol. 2014, 112, 962–970. [Google Scholar] [CrossRef] [Green Version]
  32. Trevino, M.A.; Herda, T.J.; Fry, A.C.; Gallagher, P.M.; Vardiman, J.P.; Mosier, E.M.; Miller, J.D. The influence of myosin heavy chain isoform content on mechanical behavior of the vastus lateralis in vivo. J. Electromyogr. Kinesiol. 2016, 28, 143–151. [Google Scholar] [CrossRef] [PubMed]
  33. Olmos, A.A.; Herda, T.J.; Sontag, S.A.; Trevino, M.A. The influence of chronic training status on the mechanical behavior of the vastus lateralis during repetitive trapezoidal contractions. J. Musculoskelet. Neuronal Interact. 2022. Available online: https://www.ismni.org/jmni/accepted/JMNI_21M-09-194.pdf (accessed on 10 April 2022).
  34. Abrahin, O.; Rodrigues, R.P.; Marçal, A.C.; Alves, E.A.C.; Figueiredo, R.C.; de Sousa, E.C. Swimming and cycling do not cause positive effects on bone mineral density: A systematic review. Rev. Bras. de Reum. (Engl. Ed.) 2016, 56, 345–351. [Google Scholar] [CrossRef] [PubMed] [Green Version]
  35. Friedlander, A.L.; Genant, H.K.; Sadowsky, S.; Byl, N.N.; Glüer, C.-C. A two-year program of aerobics and weight training enhances bone mineral density of young women. J. Bone Miner. Res. 2009, 10, 574–585. [Google Scholar] [CrossRef]
  36. Campos, R.; de Mello, M.T.; Tock, L.; Silva, P.L.; Masquio, D.C.; de Piano, A.; Sanches, P.L.; Carnier, J.; Corgosinho, F.C.; Foschini, D.; et al. Aerobic Plus Resistance Training Improves Bone Metabolism and Inflammation in Adolescents who Are Obese. J. Strength Cond. Res. 2014, 28, 758–766. [Google Scholar] [CrossRef]
  37. Armamento-Villareal, R.; Aguirre, L.; Waters, D.L.; Napoli, N.; Qualls, C.; Villareal, D.T. Effect of Aerobic or Resistance Exercise, or Both, on Bone Mineral Density and Bone Metabolism in Obese Older Adults While Dieting: A Randomized Controlled Trial. J. Bone Miner. Res. 2019, 35, 430–439. [Google Scholar] [CrossRef]
Figure 1. Top: illustration of a mechanomyographic (MMG) signal recorded from the vastus lateralis (VL) for one participant during a 40% isometric trapezoidal muscle action. Bottom: the torque signal is superimposed over the targeted torque template as it appeared during testing.
Applsci 12 05213 g001
Figure 2. Individual values, means (horizontal bars), ± the 95% confidence intervals for the b terms from the mechanomyographic median power frequency vs. torque relationships at the pre-training (PRE) and post-training absolute (POSTABS) torque levels for males and females. * indicates b terms were greater for females compared to males at POSTABS (p = 0.013). # indicates b terms for females were greater at POSTABS than PRE (p = 0.036).
Applsci 12 05213 g002
Figure 3. Individual values, means (horizontal bars), ±the 95% confidence intervals for the b terms from the mechanomyographic median power frequency vs. torque relationships for the linearly increasing and decreasing segment from the pre-training (PRE) and post-training absolute (POSTABS) torque levels. * indicates greater b terms for the linearly increasing segment than the linearly decreasing segment at PRE (p < 0.001).
Applsci 12 05213 g003
Figure 4. Plotted means with the standard error of the mean for males (black lines) and females (grey lines) during the linearly increasing (A,C) and linearly decreasing (B,D) segments of the mechanomyographic median power frequency (MMGMDF)–torque relationships from 10% to 40% maximal voluntary contraction (MVC) for the pre-training (top) and post-training absolute torque levels (bottom).
Applsci 12 05213 g004
Table 1. Means, standard deviations (in parentheses), and 95% confidence interval (CI) ranges for the b terms calculated for the log-transformed mechanomyographic median power frequency–torque relationships during the pre-training (PRE) and post-training absolute (POSTABS) torque levels for the males and females.
Linearly Increasing SegmentLinearly Decreasing Segment
MaleFemaleMaleFemale
PREb termsmean0.163 (0.200)0.095 (0.188)−0.035 (0.211)−0.079 (0.176)
95% CI0.039–0.287−0.003–0.193−0.166–0.096−0.171–0.014
POSTABSb termsmean−0.050 (0.255)0.124 (0.246)−0.117 (0.168)0.141 (0.229)
95% CI−0.208–0.108−0.005–0.253−0.211–−0.0120.021–0.260
Publisher’s Note: MDPI stays neutral with regard to jurisdictional claims in published maps and institutional affiliations.

