Article

Experimental and Numerical Investigation of the Seismic Performance of Bridge Columns with High-Strength Reinforcement and Concrete

1
Department of Civil Engineering, National Cheng Kung University, Tainan 70101, Taiwan
2
Matrix Structural Engineers, Houston, TX 77056, USA
*
Authors to whom correspondence should be addressed.
Appl. Sci. 2022, 12(11), 5326; https://doi.org/10.3390/app12115326
Submission received: 12 May 2022 / Revised: 22 May 2022 / Accepted: 23 May 2022 / Published: 25 May 2022

Abstract

:
Despite the numerous advantages high-strength reinforcement (HSR) and high-strength concrete (HSC) offer over conventional materials, the practical use of these materials for bridge column design in seismic zones has somewhat been limited. This is due to the insufficient research data and guidelines for the seismic design of bridges using HSC and HSR and the lack of a reliable analytical model. Therefore, to address this issue and promote the application of HSR and HSC, this paper investigates high-strength bridge columns’ seismic performance experimentally and numerically. Six large-scale reinforced concrete (RC) bridge columns and one multi-column bent frame were tested under a quasi-static cyclic loading with constant axial compression. The primary design parameters were axial load ratio, longitudinal and transverse reinforcement yield strength, and transverse reinforcement spacing. The failure pattern of high-strength columns was similar to conventional RC columns and satisfied the requirements for seismic design in terms of failure mode, hysteresis behavior, ductility, and energy dissipation capacity. The experimental ductility values of the high-strength columns were satisfactory and capable of meeting the ductility demand of most codes. Furthermore, a numerical model was built using the OpenSees program to predict the seismic performance of the specimens and then verified by comparing them with the test results of 12 columns. The numerical model’s results were in good agreement with the experimental results. The results suggested that numerical modeling techniques commonly used for normal strength concrete (NSC) columns can be used for HSC bridge columns by incorporating a proper material model.

1. Introduction

It is widely known that high-strength construction materials such as high-strength concrete (HSC) and high-strength reinforcement (HSR) can carry a much higher load without increasing the size of structural members [1,2]. Such an ability is an attractive solution to a long-standing construction demand to cut material costs and increase usable space. The research and application of HSC and HSR in engineering structures, particularly reinforced-concrete (RC) buildings, can be dated as far back as 1988 when Japan launched a national project to promote HSC and HSR [3]. However, high-strength materials are not without flaws. The materials are inherently more brittle than their normal-strength counterpart, leading to a more challenging application in seismic regions that require high ductility and deformation capacity [4]. A higher amount of confinement is required in HSC [5,6,7] to maintain a similar ductility, which inadvertently causes reinforcement bar (rebar) congestion and constructability issues in plastic hinge regions [8]. Therefore, more studies have been focusing on improving the seismic performance of structures with high-strength materials. Experimental studies have demonstrated that HSC columns with higher ductility could be achieved using HSR transverse reinforcement [9,10,11,12]. In addition, researchers have studied and compared the seismic performance of RC columns reinforced with different grades of rebar, ranging from normal strength reinforcement (NSR) grade 60 (420 MPa) to HSR grade 120 (830 MPa). The research findings conclude that satisfactory seismic performances of structures can be achieved using HSR grade 80 (550 MPa), grade 100 (690 MPa), and grade 120 (830 MPa) [13,14,15,16,17]. Similarly, research regarding the drift capacity of HSR and NSR was also conducted; the study concluded that the drift capacity of columns constructed with Grade 80 and Grade 120 longitudinal rebar (HSR) is comparable with columns constructed with Grade 60 longitudinal rebar (NSR) [13,18]. These findings were later adopted into the lat-est ACI 318-19 [19] code provision that allows the use of grade 80 HSR in the special moment-resisting frames.
As one of the most densely populated seismic zones, Taiwan has been actively researching the applicability of high-strength materials for the country’s infrastructures. In 2008, the Taiwan New RC research project was launched to apply HSC and HSR to RC columns in high-rise buildings [20]. The Taiwan New RC project categorizes concrete as HSC if the minimum concrete compressive strength is 70 MPa and rebar as HSR if the yield stress is 685 MPa and 785 MPa for longitudinal rebar and transverse rebar, respectively. Since the project’s launch, many studies have been conducted [21,22,23,24] in an effort to draft the design guidelines for the use of HSC and HSR for RC structures [25]. However, all the research projects are limited to the application of HSC and HSR in high-rise RC buildings. Meanwhile, a bridge has a different structural configuration and often has all the seismic energy absorbed solely by the columns. Hence, stringent research shall also be conducted for the application of HSC and HSR in bridge columns. Although the AASTHO provision [26] specifies the permissible yield strength of grade 100 (690 MPa) rebar for designing and constructing some structural bridge members, its practical use in seismic zones has been limited due to the lack of experimental data [14]. Some of the available experimental studies are conducted by Su et al. [27]; they tested nine large-scale circular columns with high yield strength longitudinal and transverse reinforcement of 500 MPa and 600 MPa, respectively. Su et al. [28] also tested five circulars and five rectangular RC bridge piers with a longitudinal and transverse reinforcement of 500 MPa and 600 MPa, respectively. However, it is worth mentioning that the seismic performance of high-strength RC bridge columns with both longitudinal and transverse reinforcement above 700 MPa has not been explored. The research and experimental test data on seismic performance of bridge columns with HSC and HSR are still limited to this date.
This paper aims to expand the study and understanding of bridge columns’ seismic behavior and performance with HSC and HSR using experimental and numerical means. The unique test program is one of its kind being conducted on bridge columns with HSC and HSR in Taiwan. The paper first compares the seismic performance of HSC bridge columns reinforced with high-strength longitudinal and transverse reinforcement (above 700 MPa) with that of normal-strength RC bridge columns subjected to quasi-static cyclic loading. A parametric study is then conducted to investigate the effect of design parameters, such as material strength, axial load ratios, and the transverse reinforcement spacing on the seismic performance of the high-strength bridge columns, which includes hysteresis loops, load-carrying capacity, initial stiffness, ductility, stiffness degradation, energy dissipation capacity, equivalent viscous damping ratios, and residual drift ratio. Last, the paper presents a numerical model using the open-source finite element platform Open-Sees [29] to simulate the seismic behavior of the high-strength bridge column. The numerical model was verified with the experimental test database of 12 column specimens. The numerical model was able to predict hysteretic behaviors, such as pinching, strength and stiffness degradation, and energy dissipation, with adequate accuracy under various input parameters.

2. Experimental Procedure

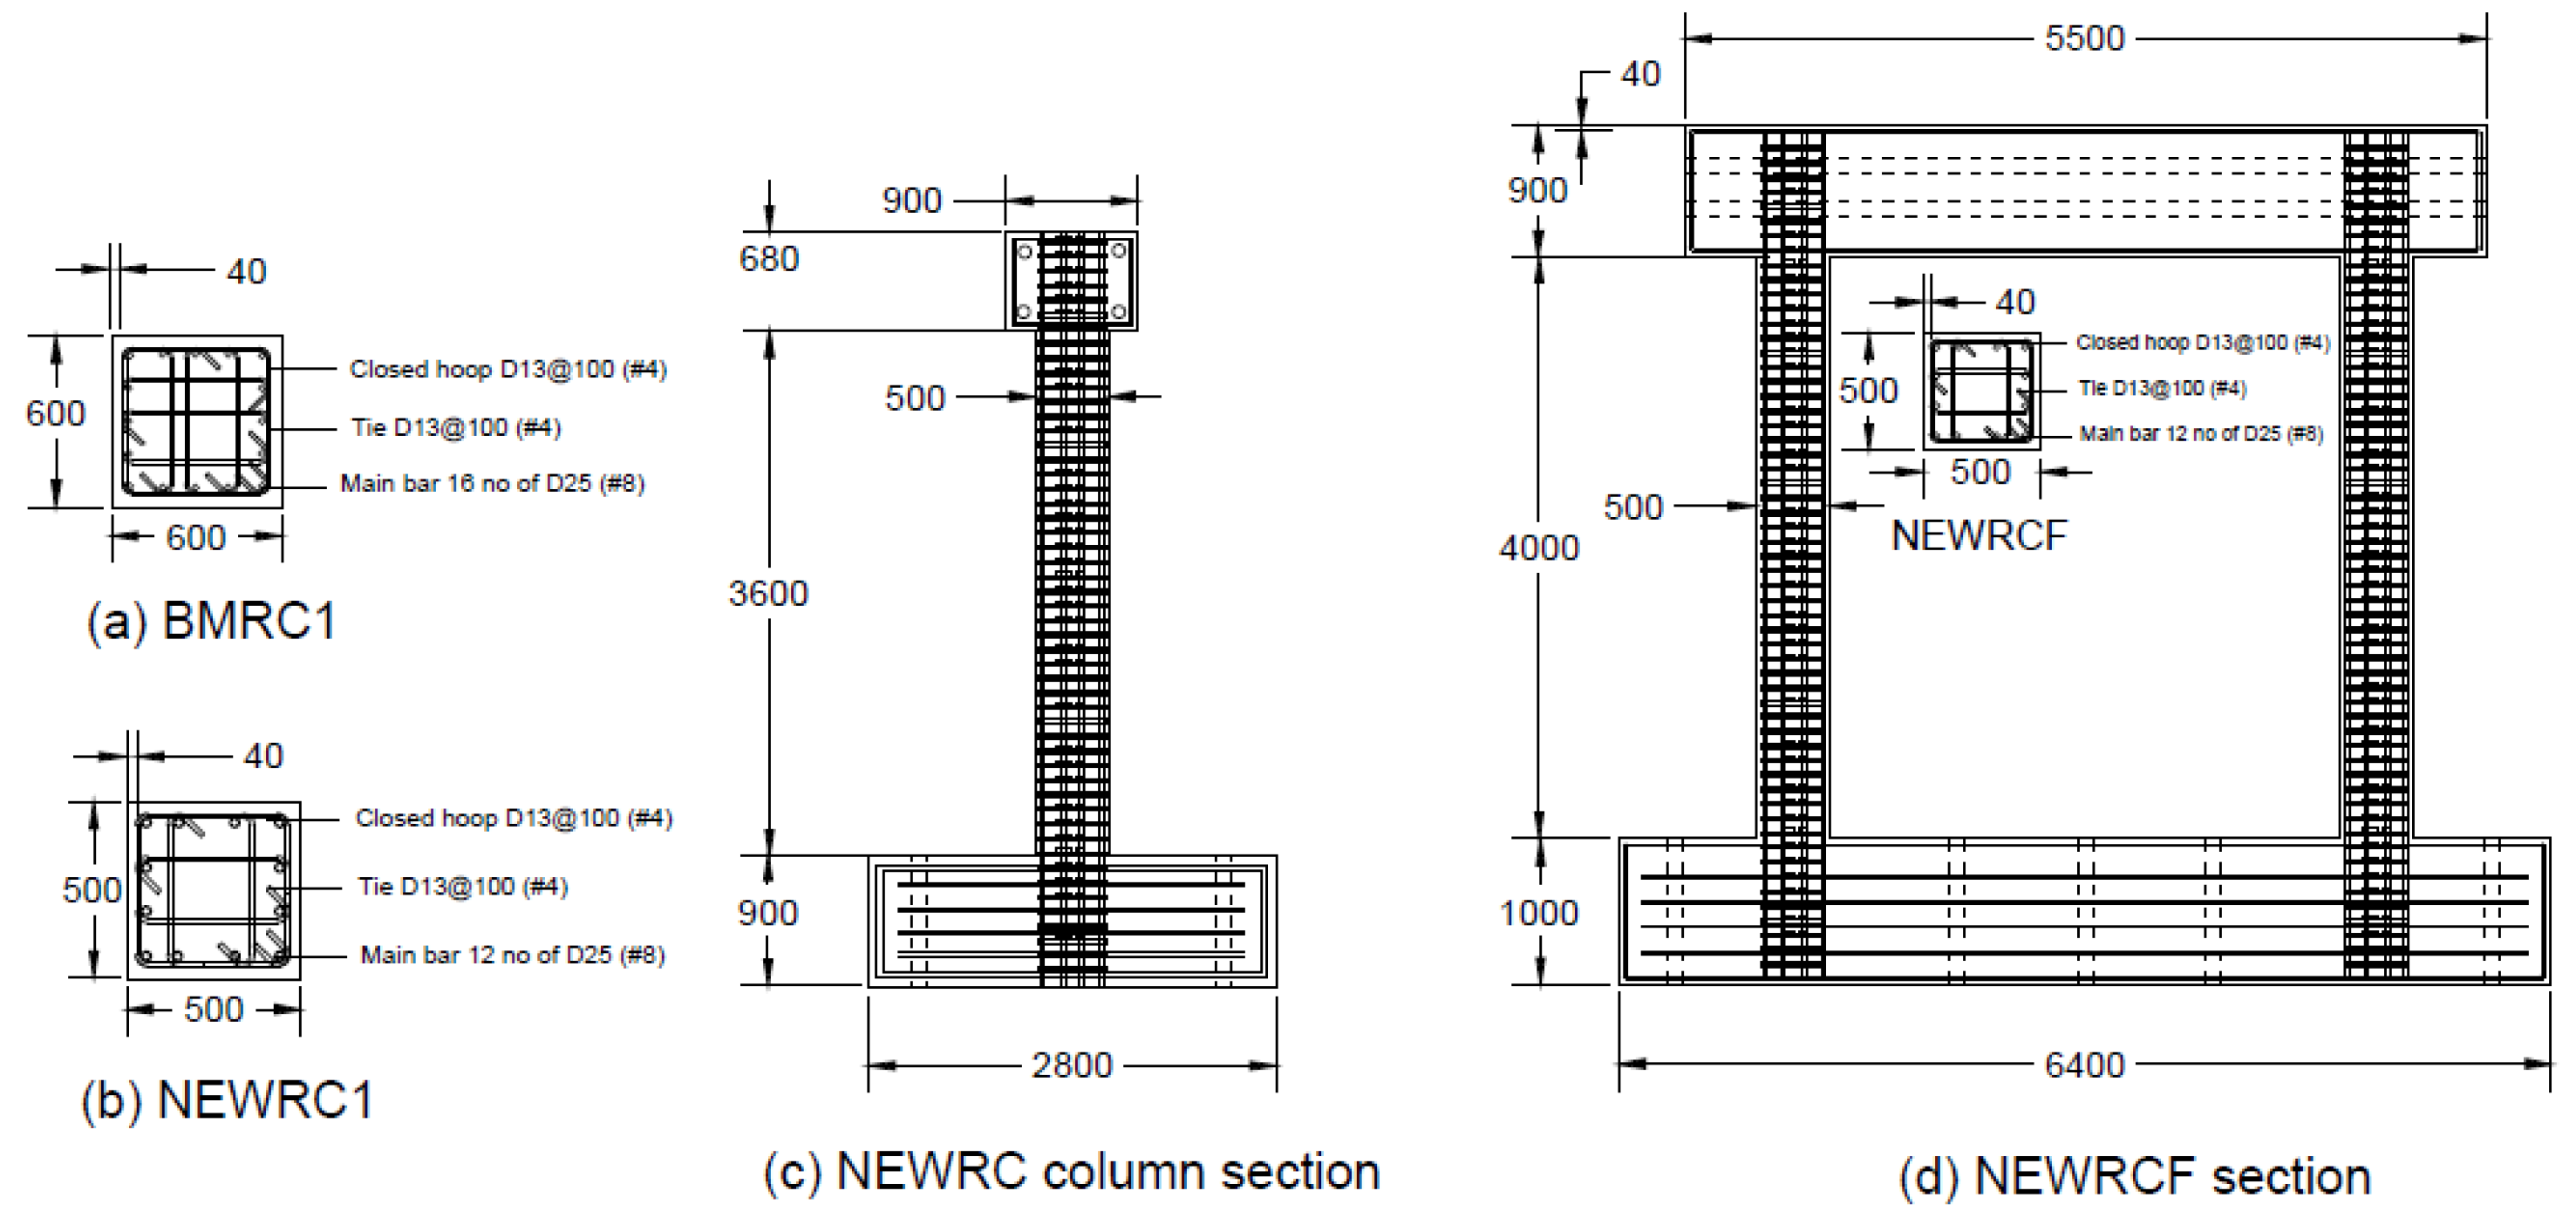
2.1. Specimen Design

An experimental program was conducted to understand the high-strength bridge column’s seismic behavior and compare it with the conventional RC bridge column. A total of six full-scaled bridge columns, including five high-strength bridge columns and one conventional RC column, were designed and subjected to a quasi-static cyclic loading test under a constant axial load. After completing the bridge column test, one single-bay high-strength frame (multi-column bent) was designed and tested under quasi-static cyclic loading. The prototype of the RC bridge column is a typical rectangular bridge column in Taiwan. The dimensions and design of the specimen reinforcements are shown in Figure 1. Specimen BMRC1 was designed as a control specimen with normal-strength materials. It has a 600 mm × 600 mm square cross-section and is reinforced with 16 D25 (No. 8) bars and transversely reinforced with D13 (No. 4) crossties and 135-degree seismic hooks.
On the other hand, specimens NEWRC1, NEWRC2, NEWRC3, NEWRC4, and NEWRC5 are composed of high-strength materials, have a square cross-section of 500 mm × 500 mm, and are reinforced with 12 D25 (No. 8) longitudinal bars and transversely reinforced with D13 (No. 4) crossties and 135-degree seismic hooks. The clear height of all the column specimens is 3600 mm, while the thickness of the concrete cover is 40 mm. The longitudinal reinforcement ratio for BMRC1 was 2.26%, whereas, for all the NEWRC columns, it was 2.44%. Although the longitudinal reinforcement ratio between BMRC1 and NEWRC columns is similar, the cross-sectional area and longitudinal rebar vary. Due to this, specimen NEWRC1 has a 30.5% reduction in column cross-sectional area, 25% reduction in longitudinal reinforcement area, and 35.7% reduction in the transverse reinforcement area compared with specimen BMRC1. The primary objective of having different specifications for BMRC1 and NEWRC1 is to investigate whether a similar force-deflection response can be achieved with the reduced cross-sectional area, longitudinal reinforcement area, and transverse reinforcement area. The experimental parameters used for determining the seismic behavior of the NEWRC columns are the spacing of the transverse reinforcements, the axial load ratio, and transverse reinforcement strength. In this study, the amount of transverse reinforcement for BMRC1 was 1.08%, while for NEWRC columns, it ranged from 0.344% to 1.03%. The transverse reinforcements’ spacing was kept at 100 mm for BMRC1, NEWRC1, NEWRC4, and NEWRC5, which is less than five times the diameter of the longitudinal bars. However, for NEWRC2 and NEWRC3, the transverse reinforcement spacings were increased to 200 and 300 mm, respectively, which is higher than five times the diameter of the longitudinal bars. In the literature, premature bar buckling has often been identified as the main factor for the failure of the high-strength column [30]. In this view, the results from NEWRC1, NEWRC2, and NEWRC3 will provide an insight into the influence of transverse spacing on the high-strength columns’ seismic performance. Furthermore, to investigate the effects of the axial load ratio on the seismic performance, the axial load on the NEWRC4 was twice that of NEWRC1.
The frame specimen was constructed and tested after completing the BMRC1 and NEWRC columns test; therefore, the design of the frame specimen is provided separately. In the frame specimen NEWRCF, both the columns (piers) had the same cross-sectional design and detailing as the NEWRC1. The primary purpose of experimenting with the frame specimen is to investigate whether the single column behavior can be reflected in the multi-column bent frame structure. However, the clear height and clear span for column and beam of NEWRCF were 4000 mm and 5500 mm, respectively. The beam had a cross-section of 900 mm × 1100 mm and was reinforced with eight D25 (No. 8) bars and 32 D13 (No. 4) closed stirrups.

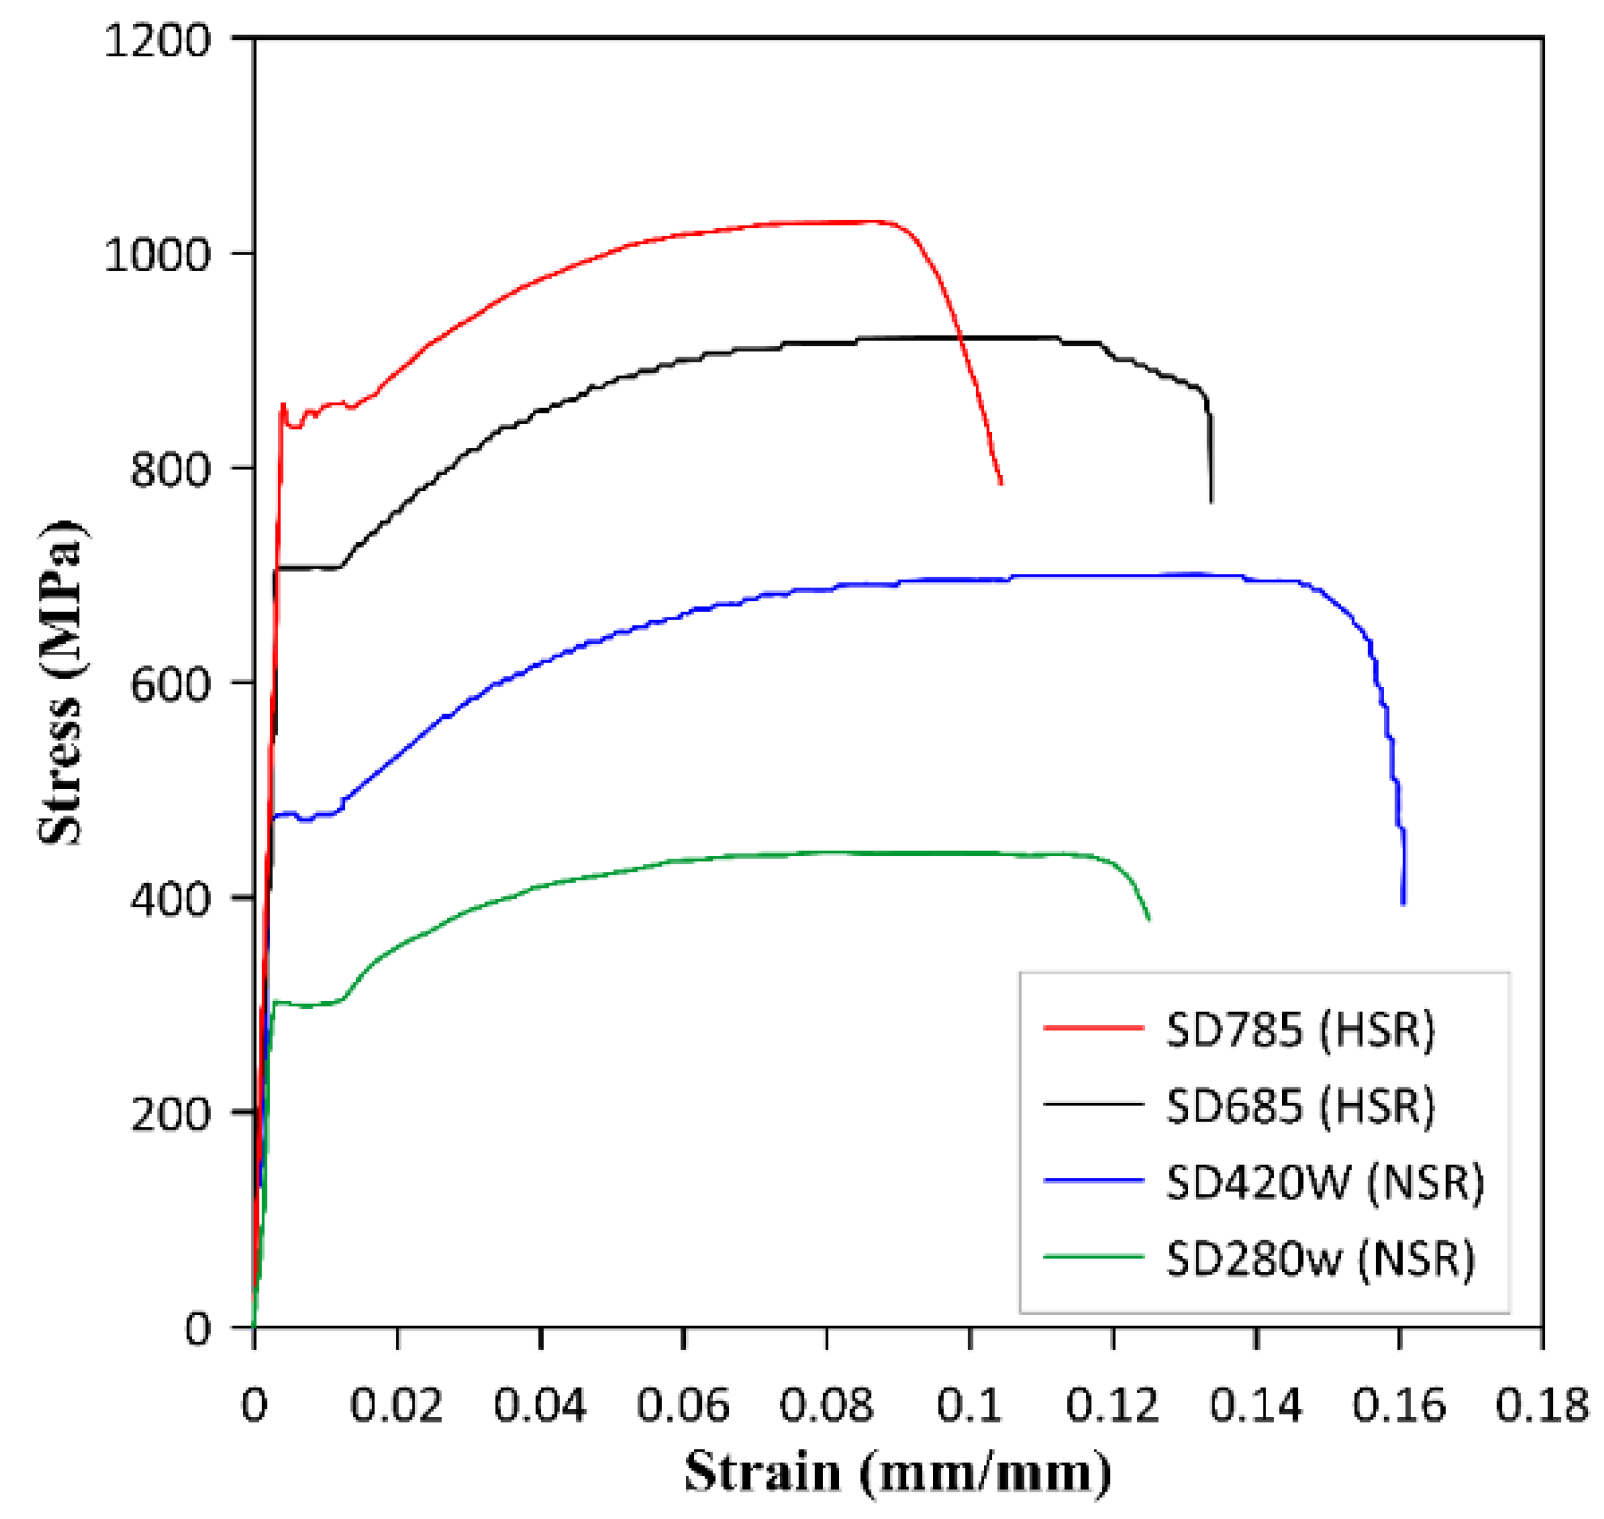
2.2. Material and Sectional Properties

BMRC1 was cast with NSC and NSR, whereas the NEWRC columns and NEWRCF were cast with HSC and HSR. The details of the HSC material properties are shown in Table 1. The mix proportions per volume (m3) of HSC comprise 170 kg water, 400 kg cement, 170 kg Class-F fly ash, 50 kg silica fume, 844 kg coarse aggregates, 719 kg fine aggregates, and 14.26 kg high-range water-reducing admixture. The maximum water-binder material ratio (w/b) was 0.274. The average slump at casting was approximately 250 mm. The compressive strength values were based on the compression tests of water-cured concrete cylinders (120 mm in diameter and 240 mm in height) at the end of 28 days. The actual compressive strength of concrete f c for NSC and HSC were 37 MPa and 80.9 MPa, respectively.
The stress–strain relationship of the longitudinal rebar is shown in Figure 2. SD420w and SD280w are NSR used in BMRC1, whereas SD685 and SD785 are high-strength rebars used in all NEWRC columns and frame specimens. The yield strength ( f y ) of the longitudinal reinforcements D25 SD420W and D25 SD685 were 534 MPa and 736 MPa, respectively.
Two types of transverse reinforcement were used: SD280W (normal strength) and SD785 (high-strength). The yield strength of the transverse reinforcement ( f y t ) for D13 SD280W and D13 SD785 were 341 and 813 MPa, respectively. Furthermore, in this study, specimen NEWRC5 has a unique combination composed of HSR for longitudinal reinforcement and NSR for transverse reinforcement. Hence, the results from NEWRC5 can be compared with NEWRC1 to investigate whether transverse reinforcement strength influenced the seismic performance of NEWRC bridge columns.
Although NEWRCF has the same cross-sectional design and detailing as that of the NEWRC1, the actual material properties may be varied as they were constructed separately. The actual yield strength of the longitudinal reinforcement ( f y ) and transverse reinforcement ( f y t ) for NEWRCF was 723 and 833 MPa, respectively. Its actual compressive strength of concrete ( f c ) was 80 MPa. Moreover, its longitudinal reinforcement and transverse reinforcements were 2.3% and 1.29%. In addition to this, the axial compression ratio was 0.1% and applied on both piers. The material properties and design parameters for all the specimens are listed in Table 2.

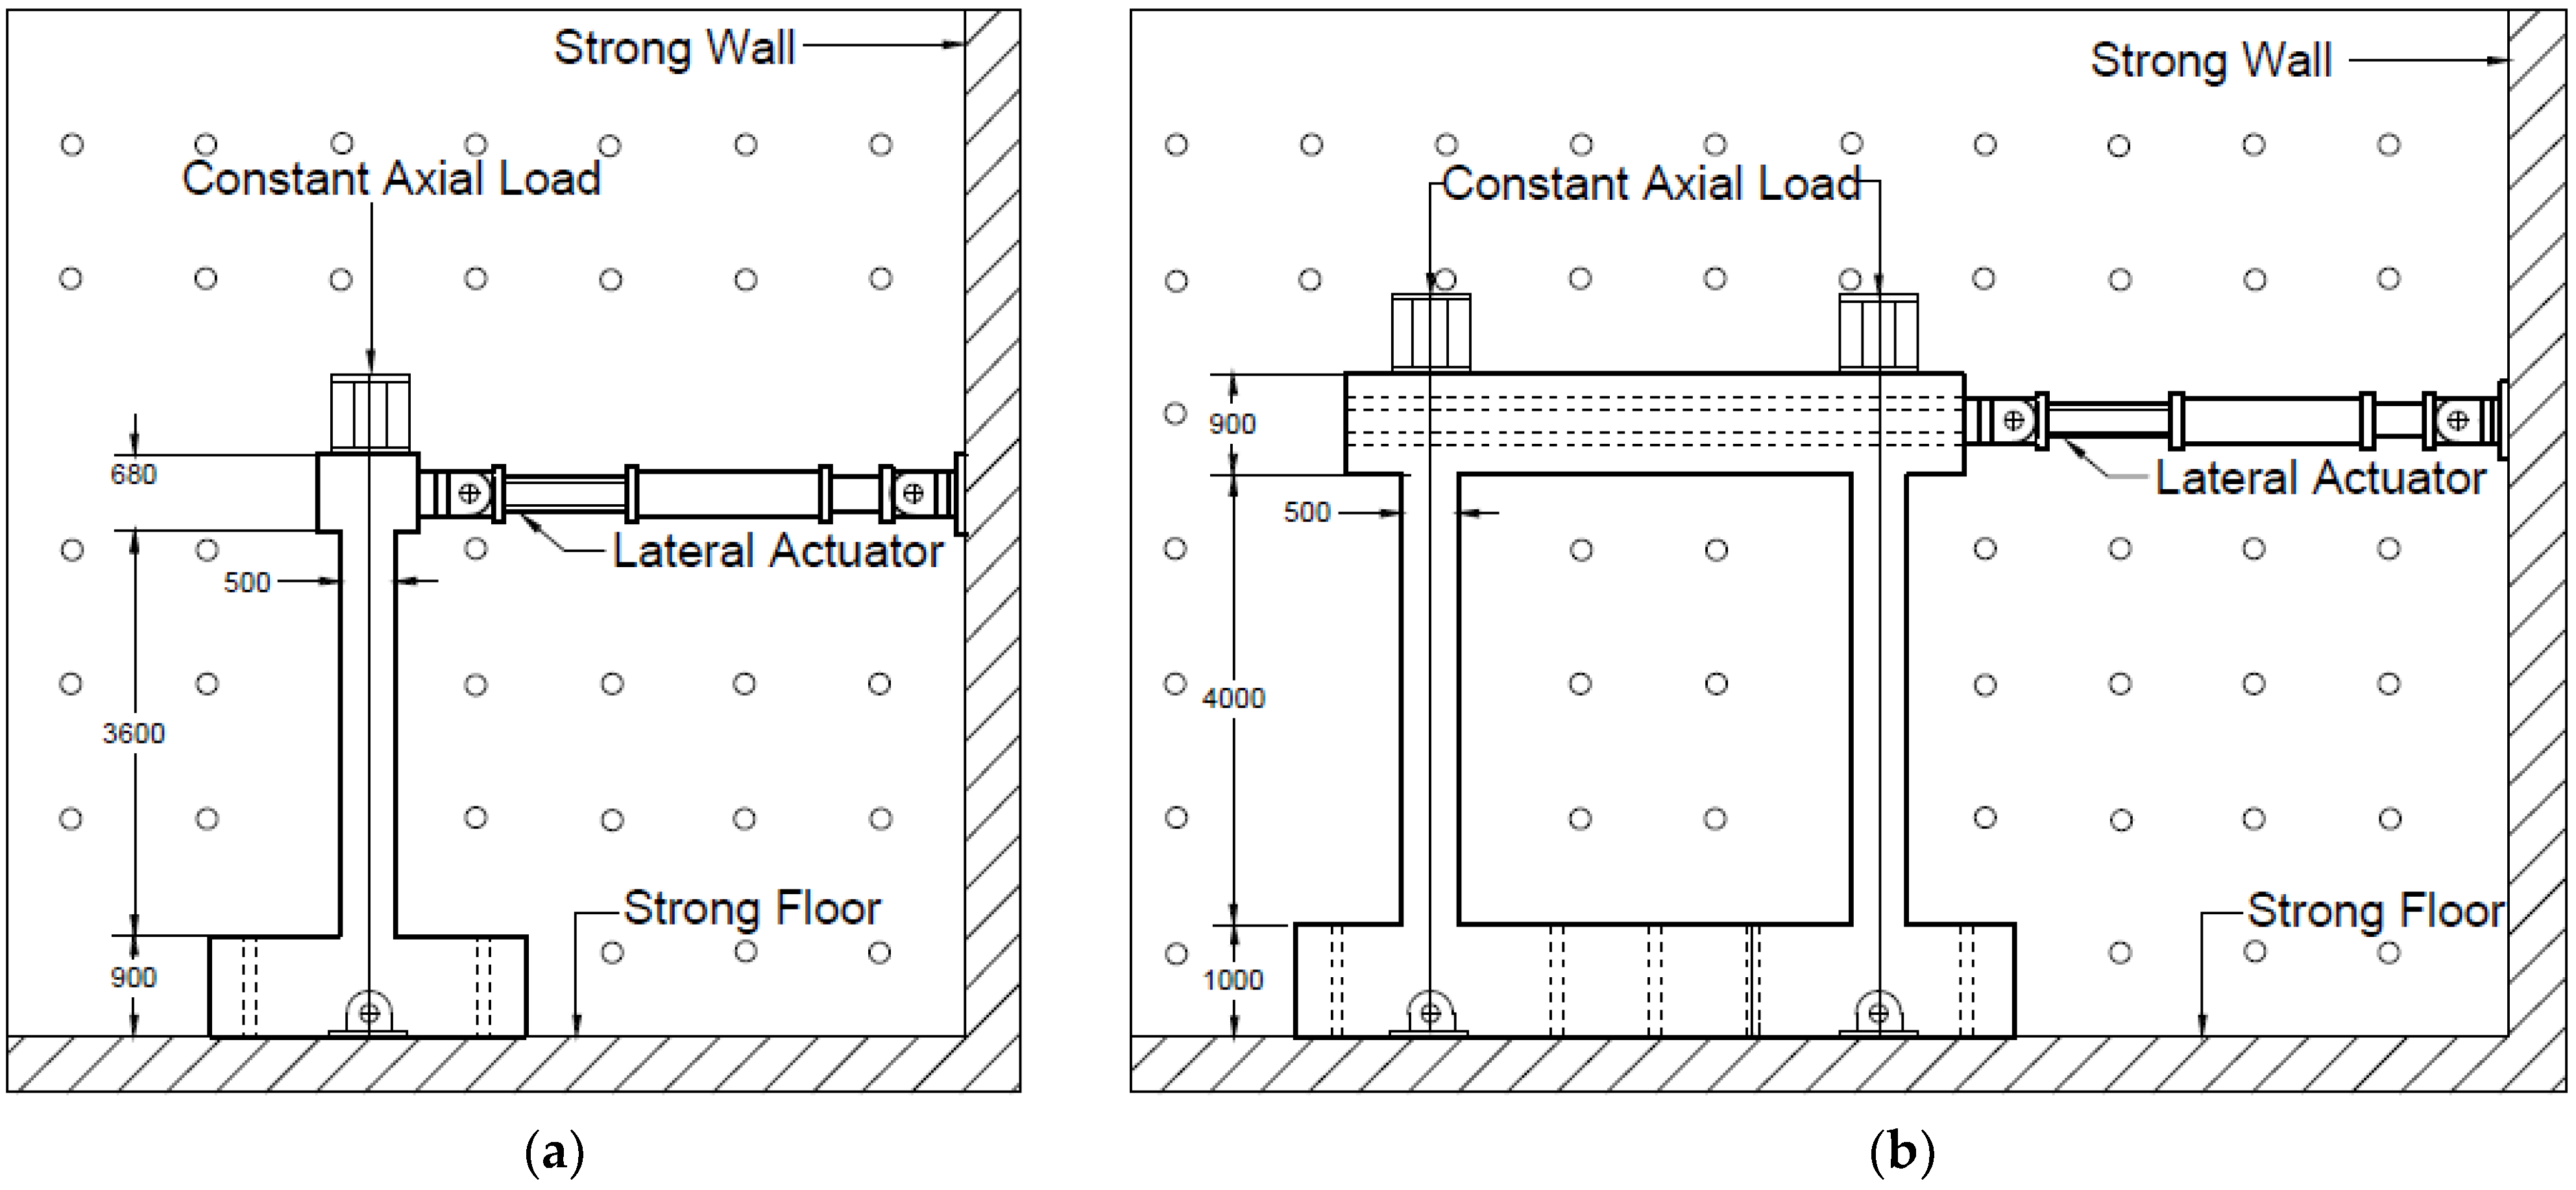
2.3. Construction and Test Setup

The BMRC1, NEWRC columns, and NEWRCF frame specimens were constructed and tested at the National Center for Research on Earthquake Engineering (NCREE, Taipei) laboratory. A schematic diagram of the test setup is shown in Figure 3. First, the stub footing of all the columns and frames was post-tensioned using four tie-down rods with a clamping force of 320 kN and anchored into the laboratory’s strong floor. Then, constant axial compression was applied to the test column through a loading system using a steel beam, an oil pump, a pin connection, and high-tension rods.

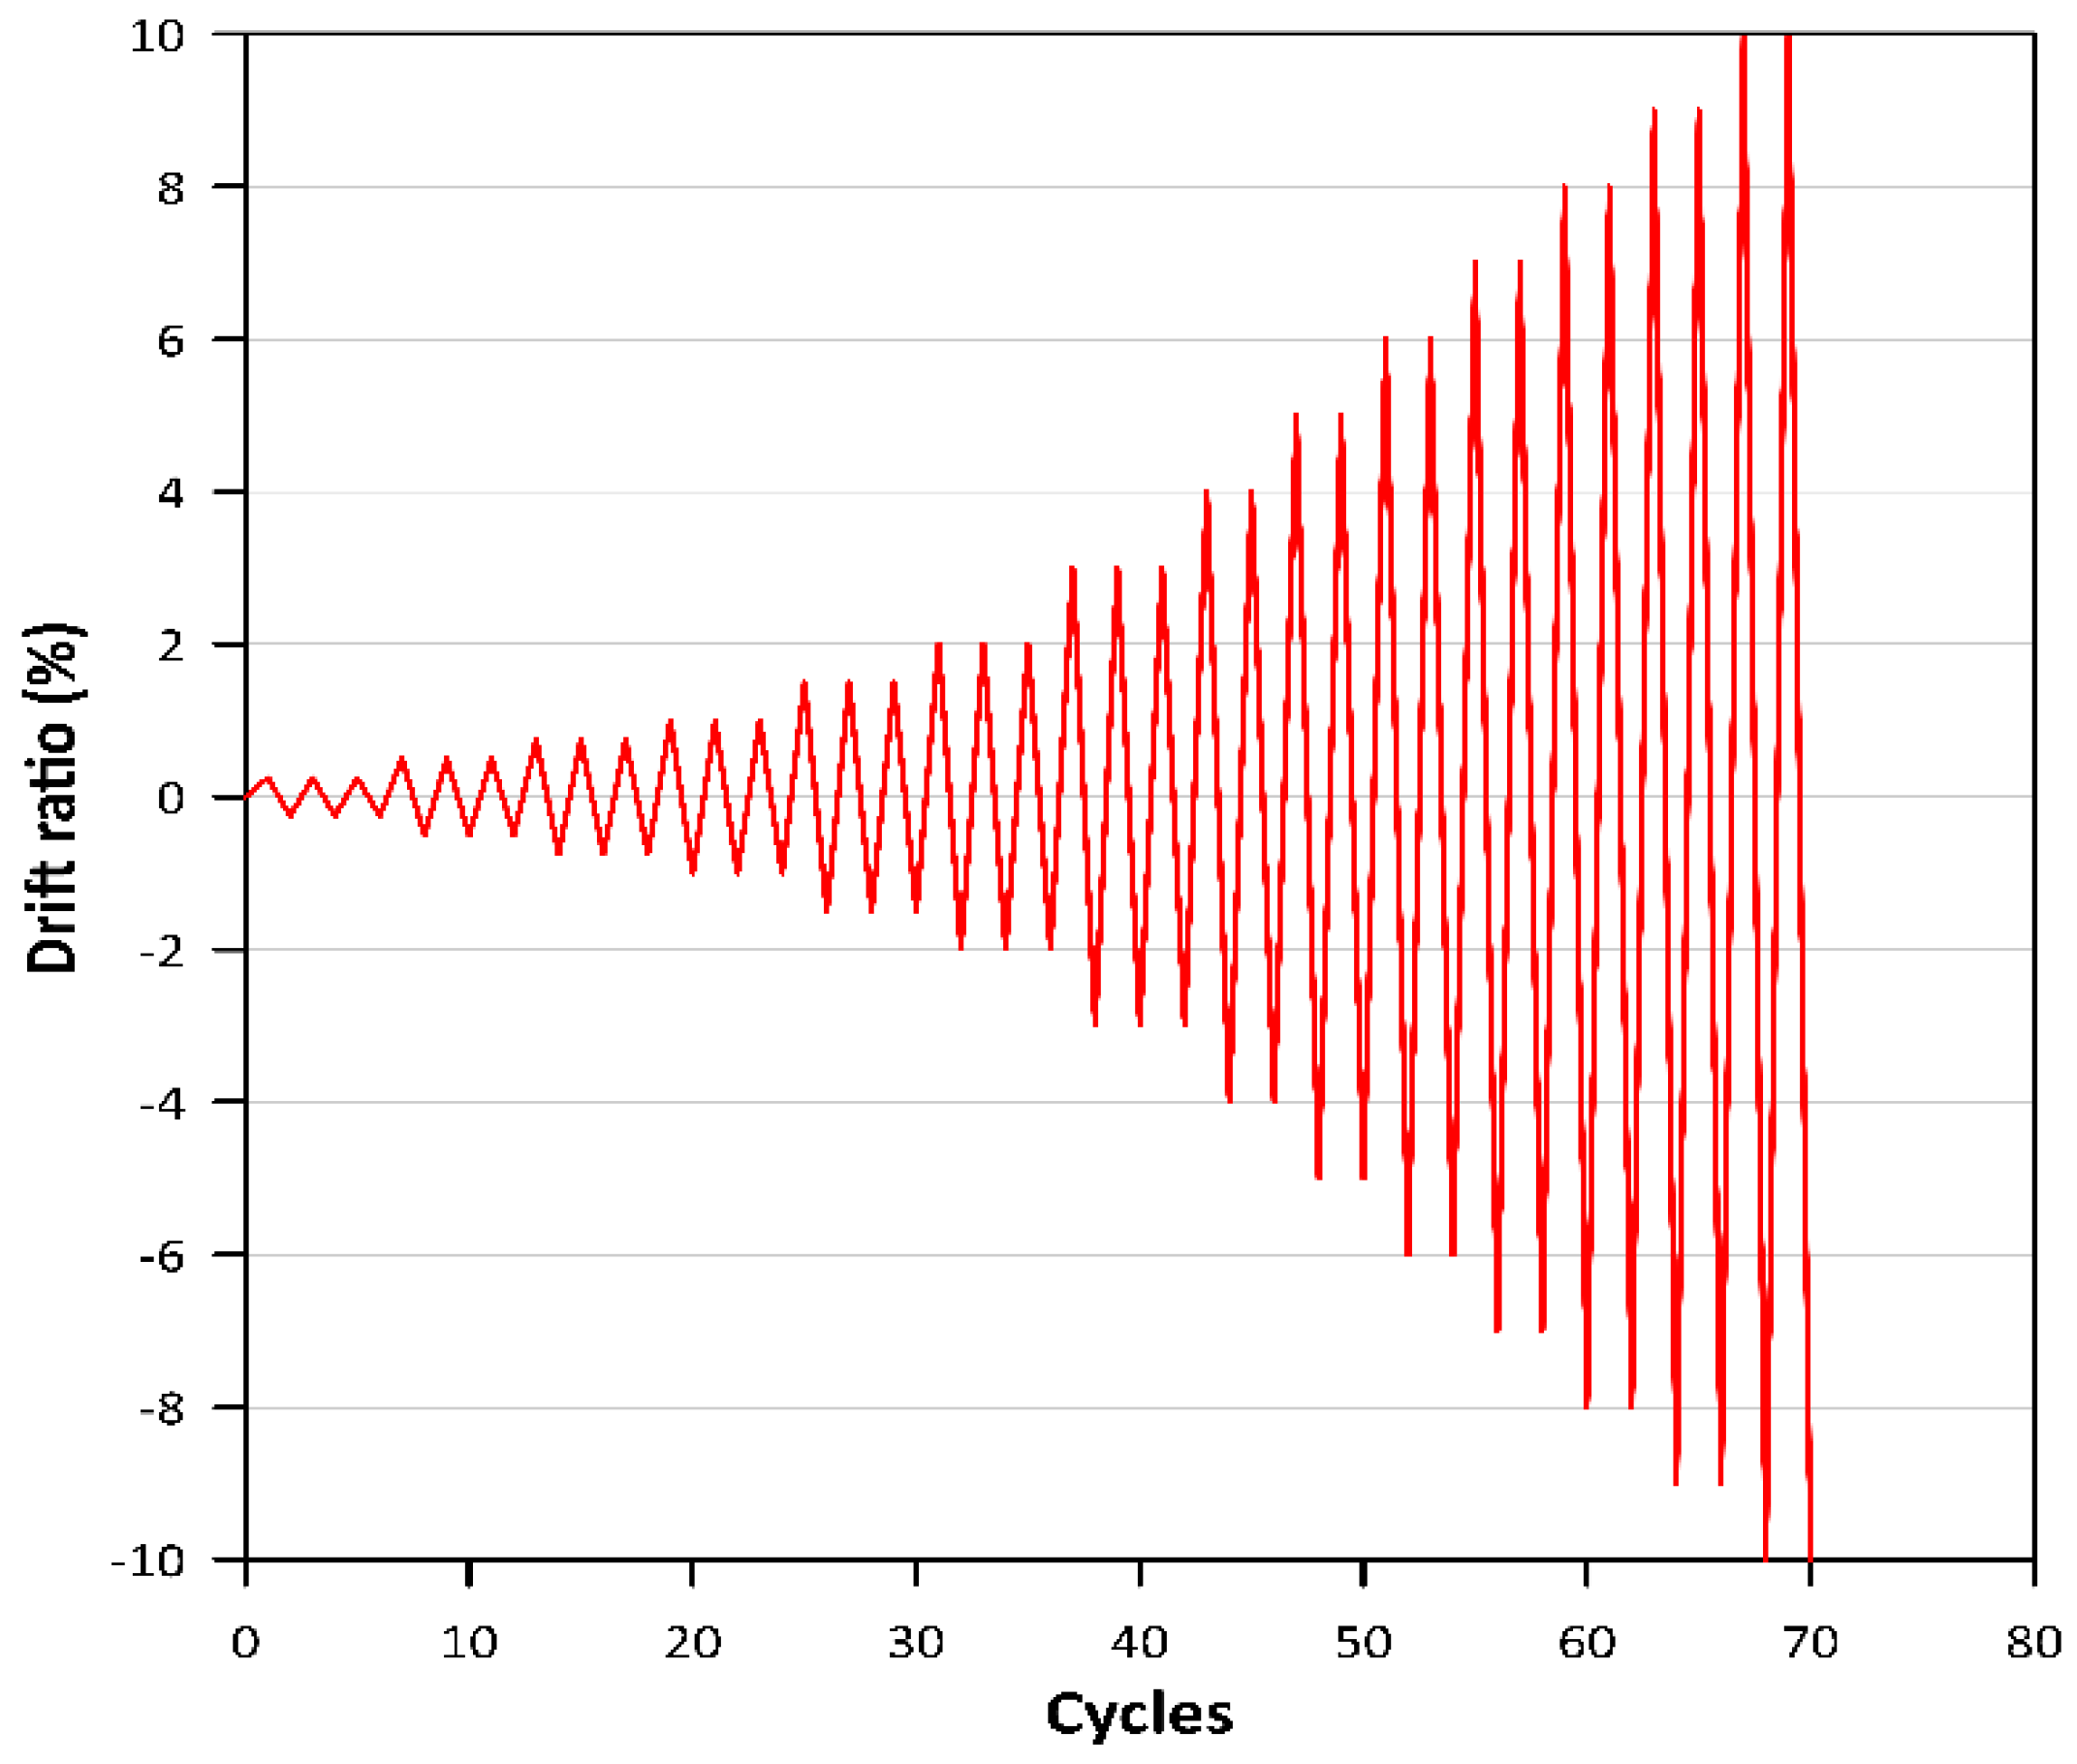
2.4. Instrumentation and Loading Procedure

The reversal lateral quasi-static cyclic load was applied by the lateral actuator. The lateral cyclic loading included drift levels of ± 0.25 % , ± 0.5 % , ± 0.75 % , ± 1 % , ± 1.5 % , ± 2 % , ± 3 % , ± 4 % , ± 5 % , ± 6 % , ± 7 % , ± 8 % , ± 9 % , and ± 10 %. In Figure 4, the loading protocol of the specimens is shown. Each drift cycle was repeated three times up to ± 3 % and then twice for the remaining drift levels [31] so that to examine the stiffness and strength degradation of the column. The test ended when the remaining lateral force capacity dropped by 20% from the peak force or any longitudinal bars ruptured on either column’s push or pull sides. Strain gauges were installed on the longitudinal and transverse reinforcement where plastic hinges are expected to occur. The lateral actuator’s built-in force sensor and displacement gauges measured the lateral load and lateral displacement, respectively.

3. Results and Discussion

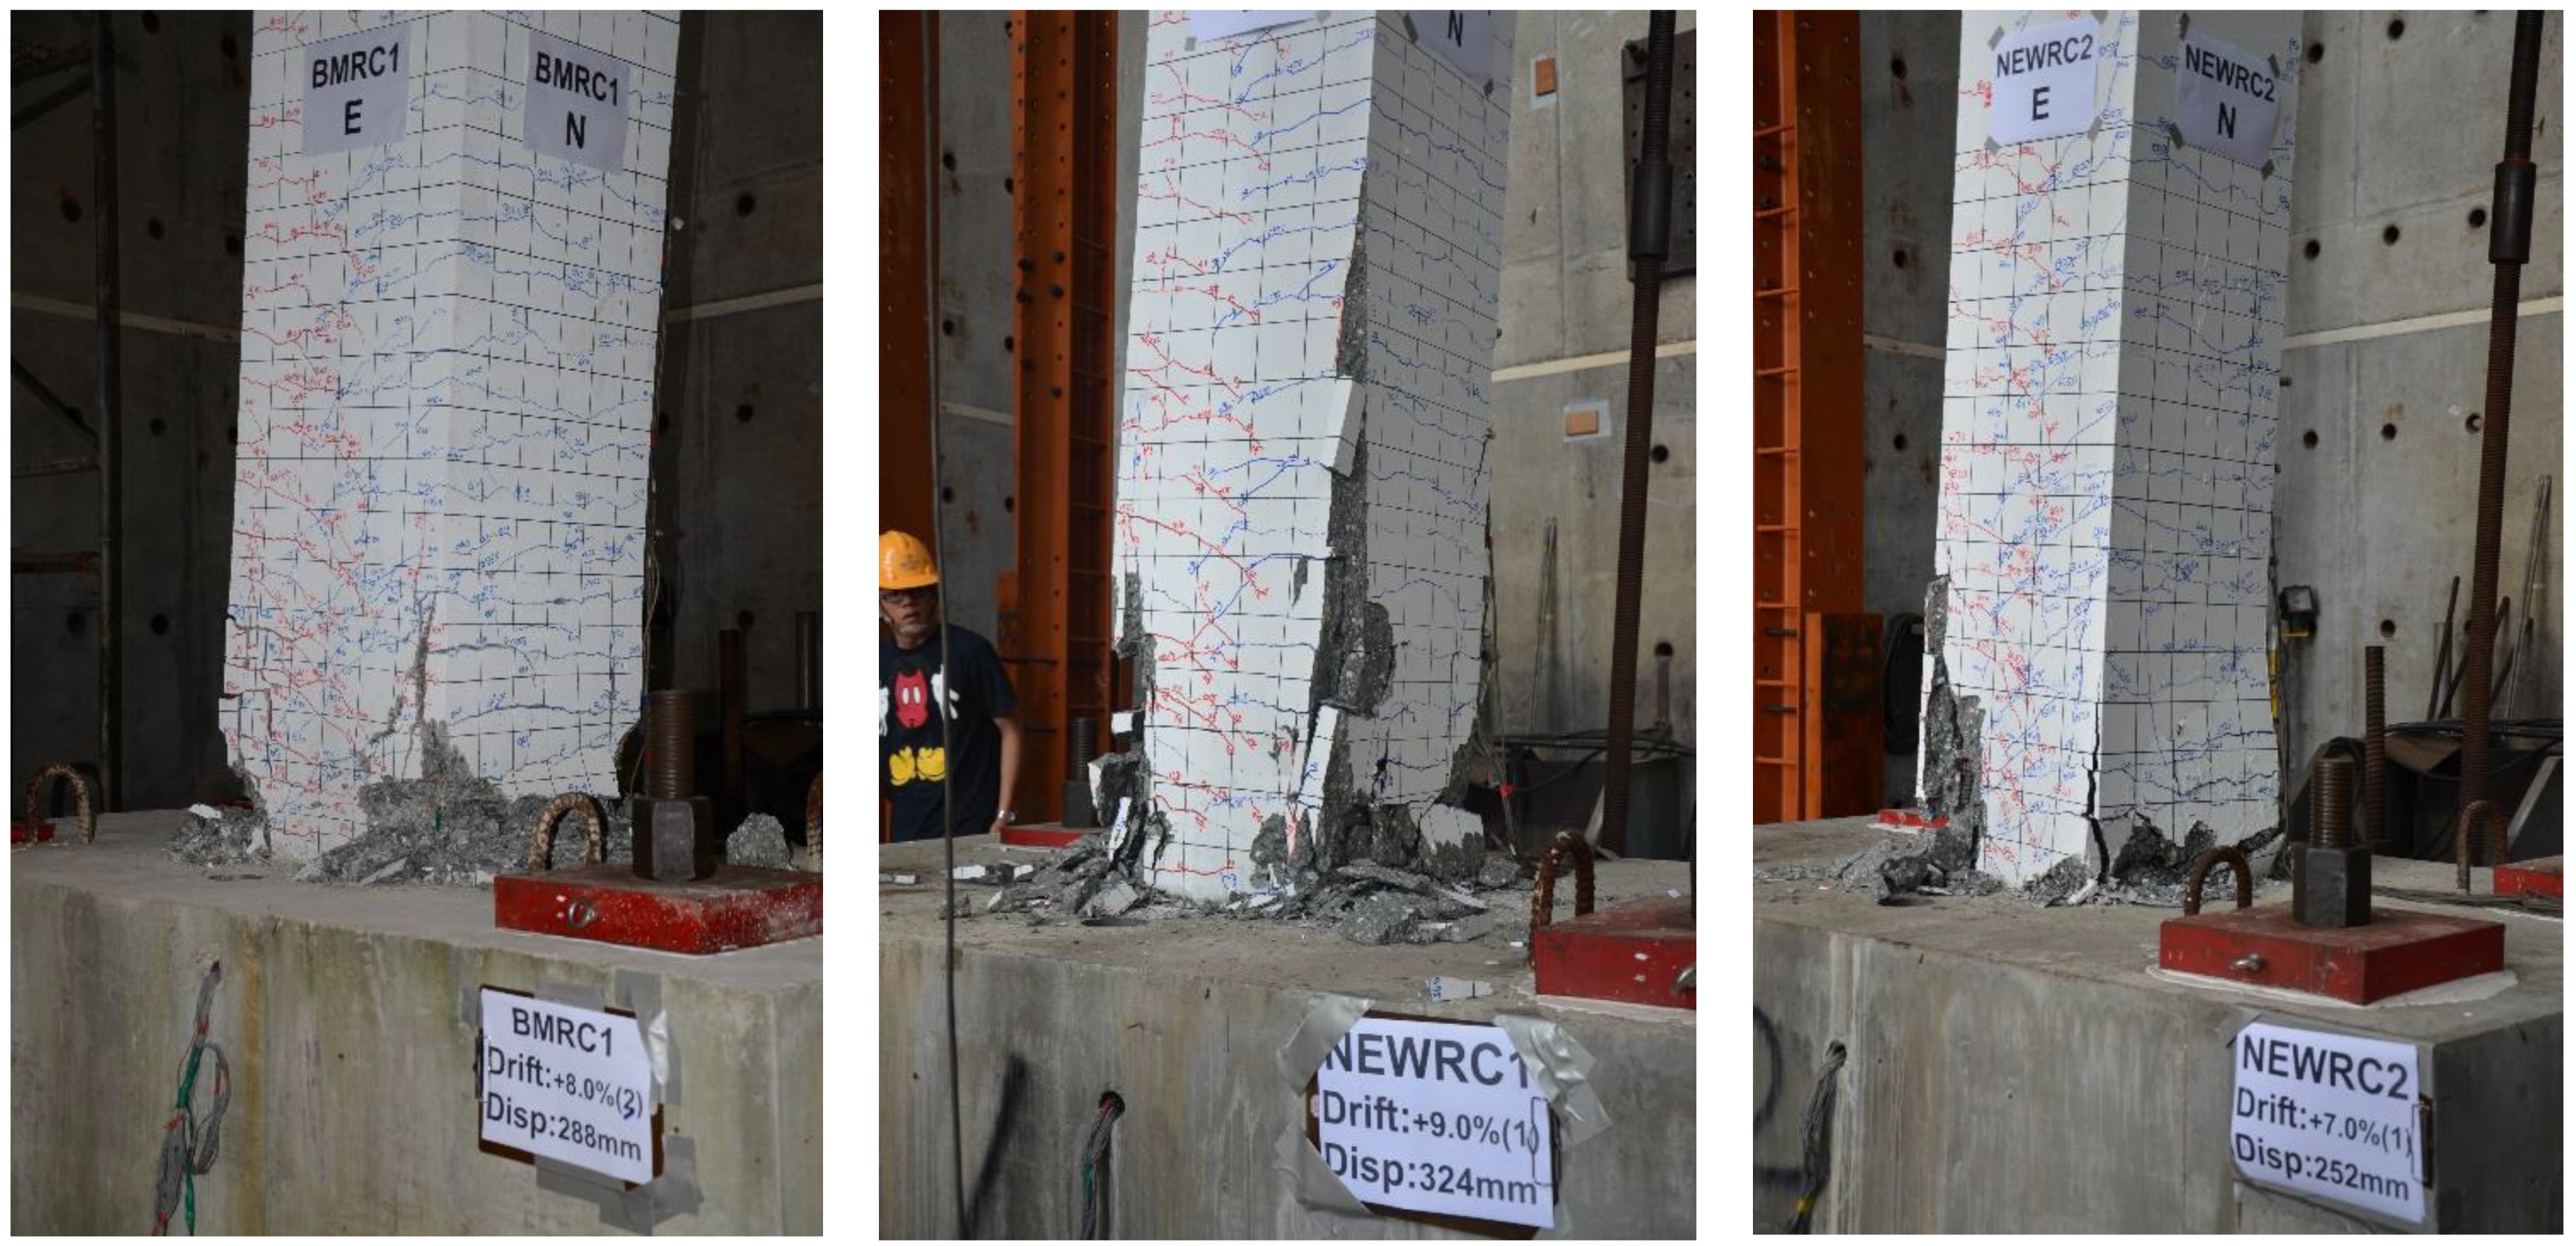
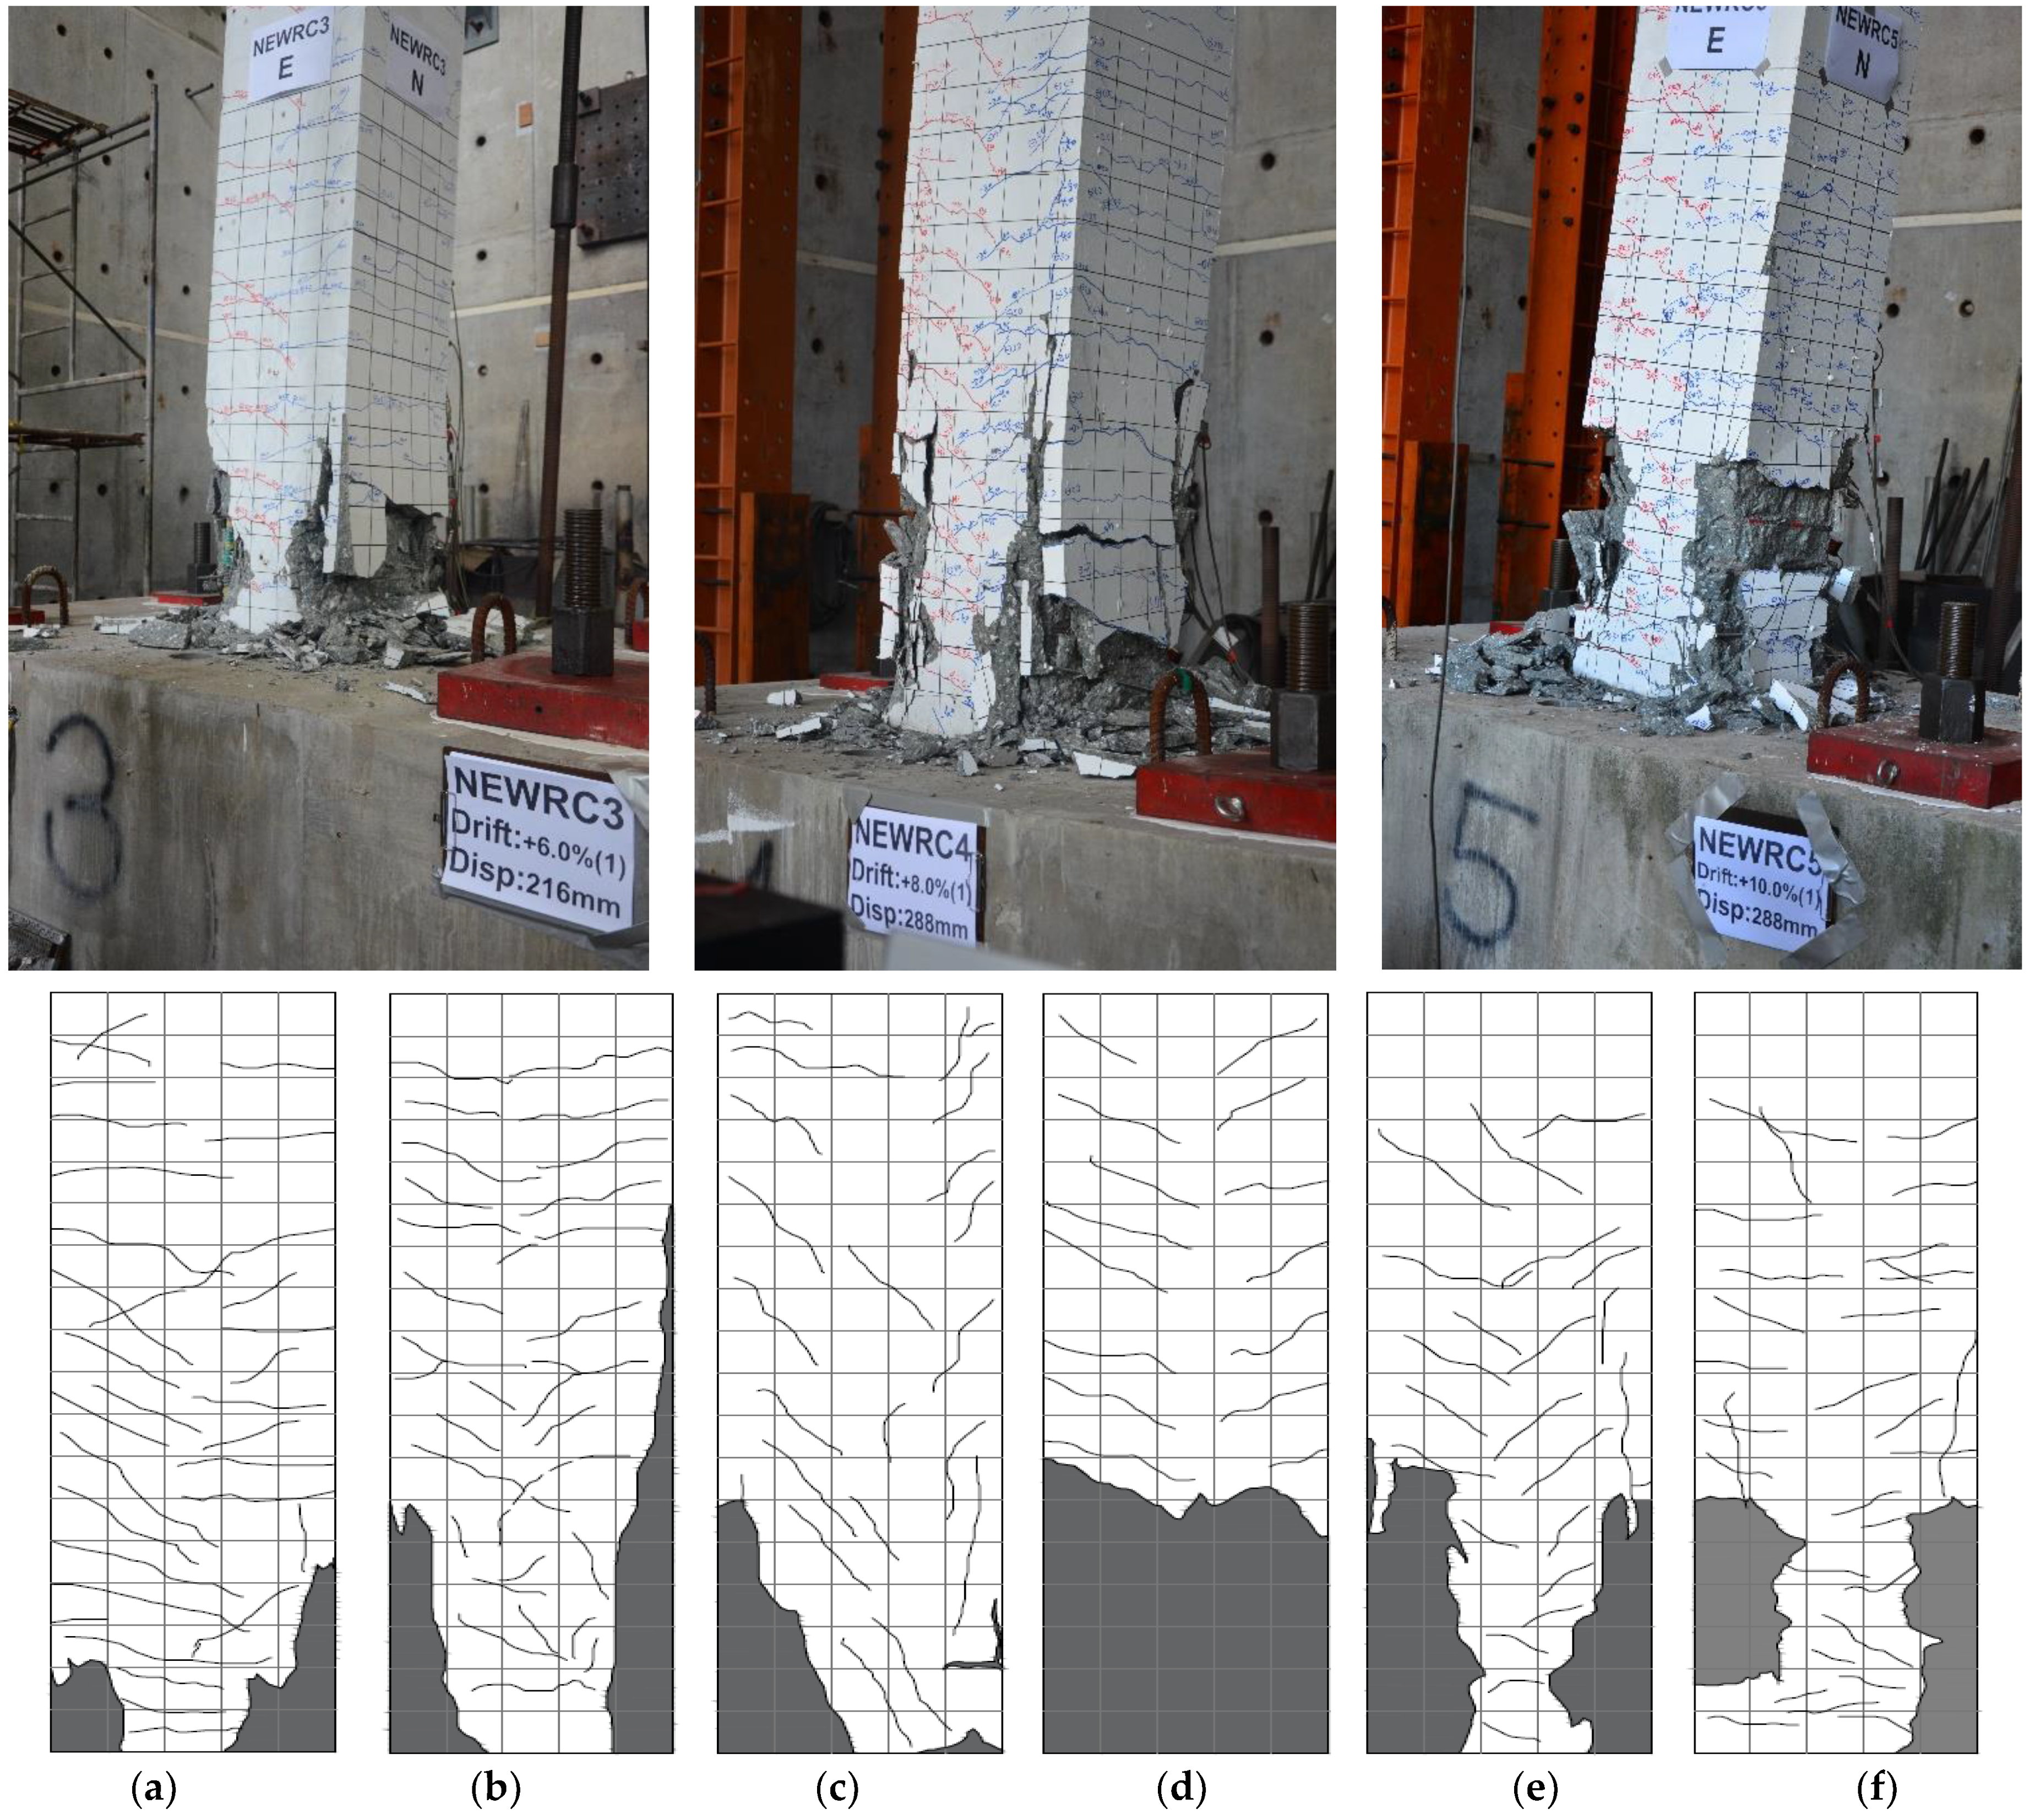
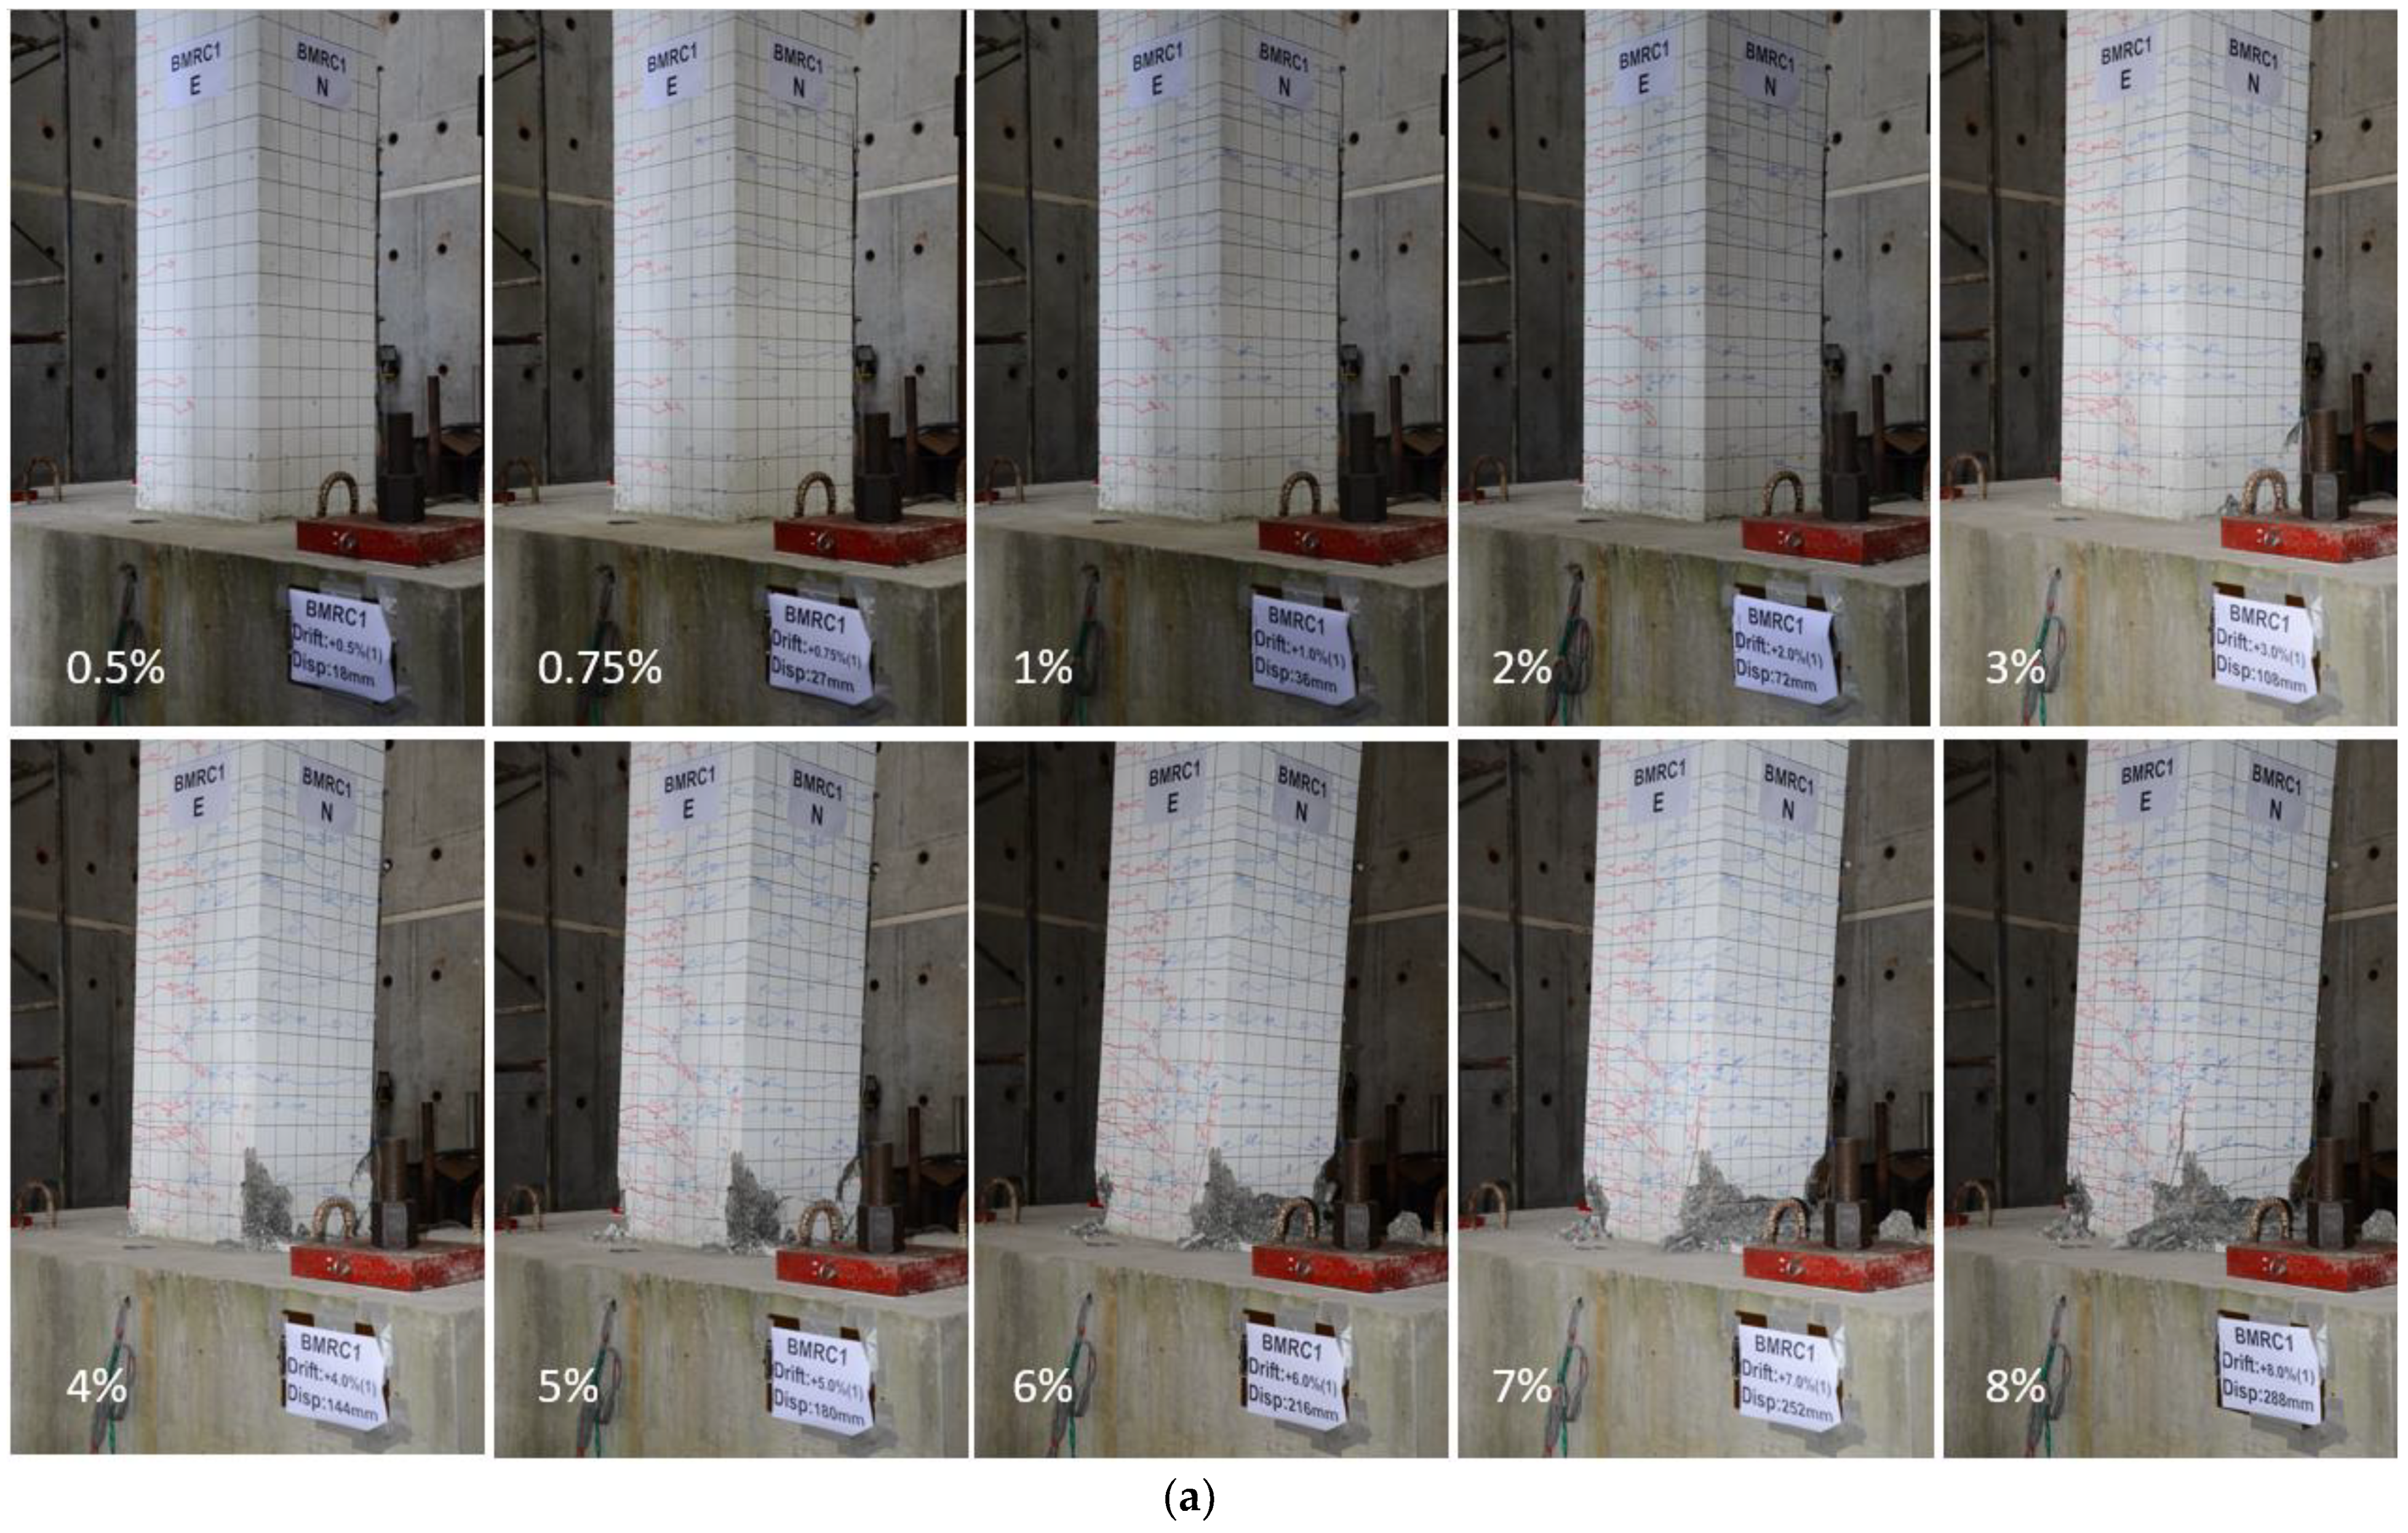
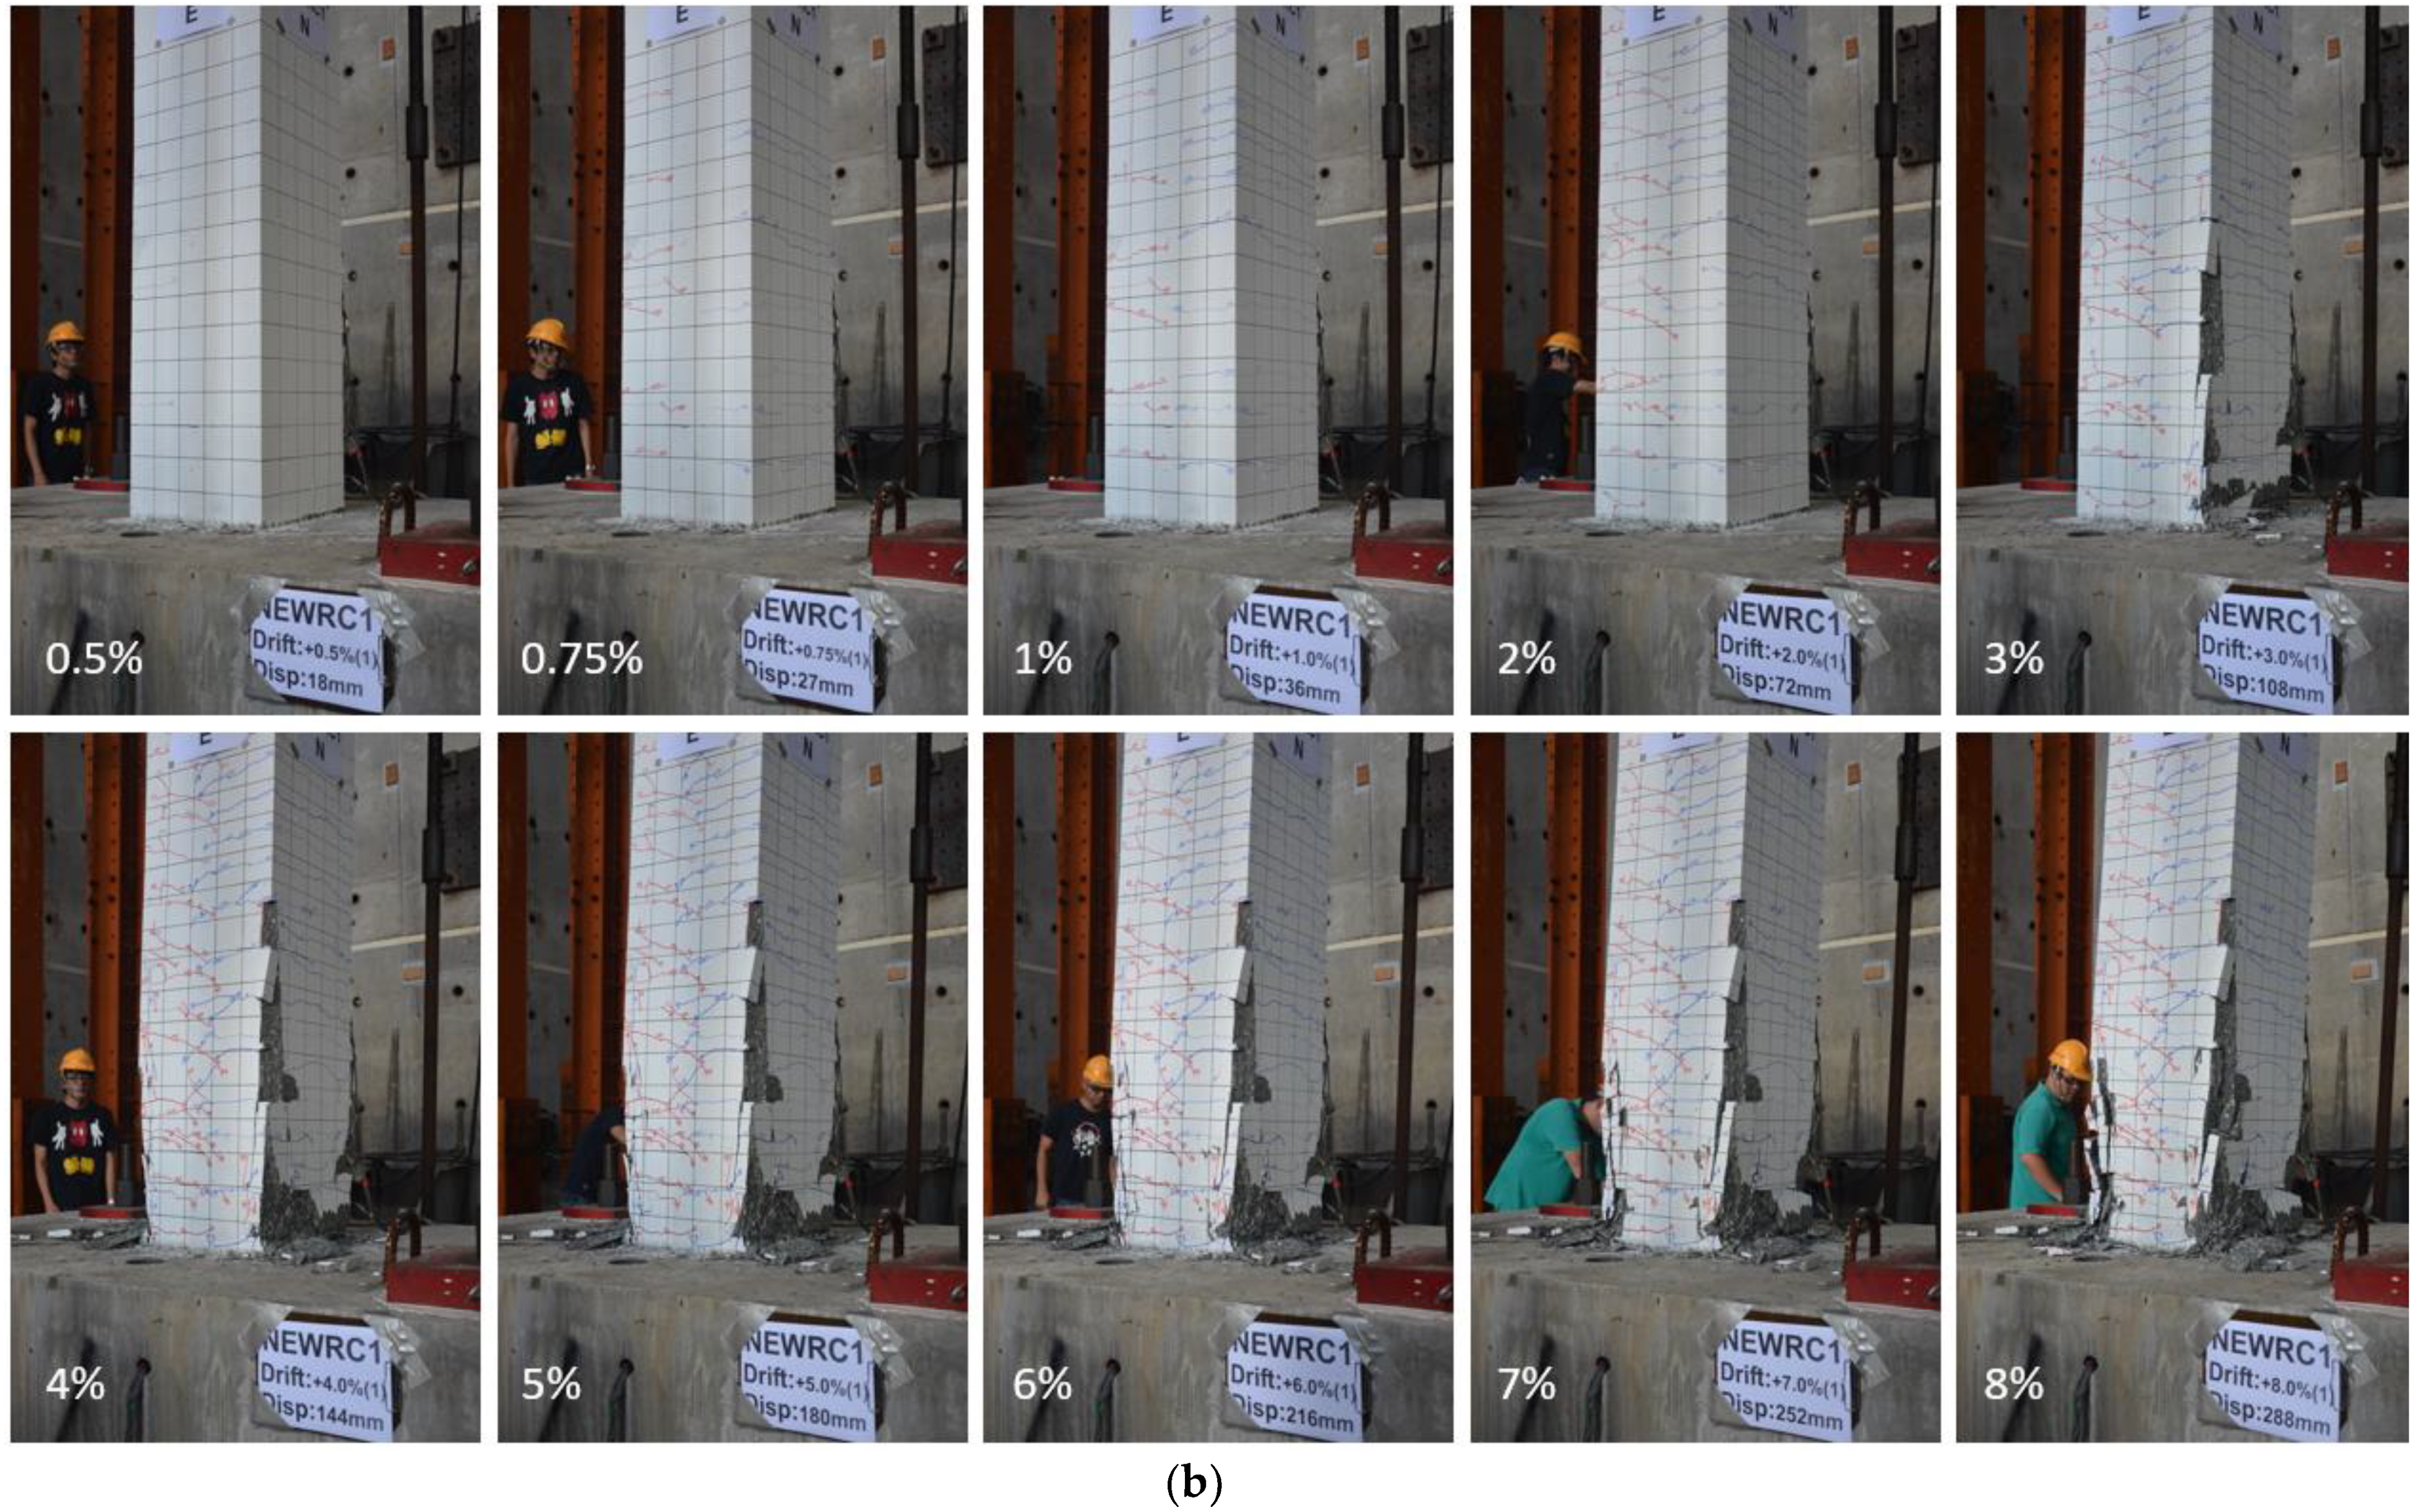
3.1. General Observations and Failure Modes

3.1.1. BMRC1, NEWRC 1–5 Columns
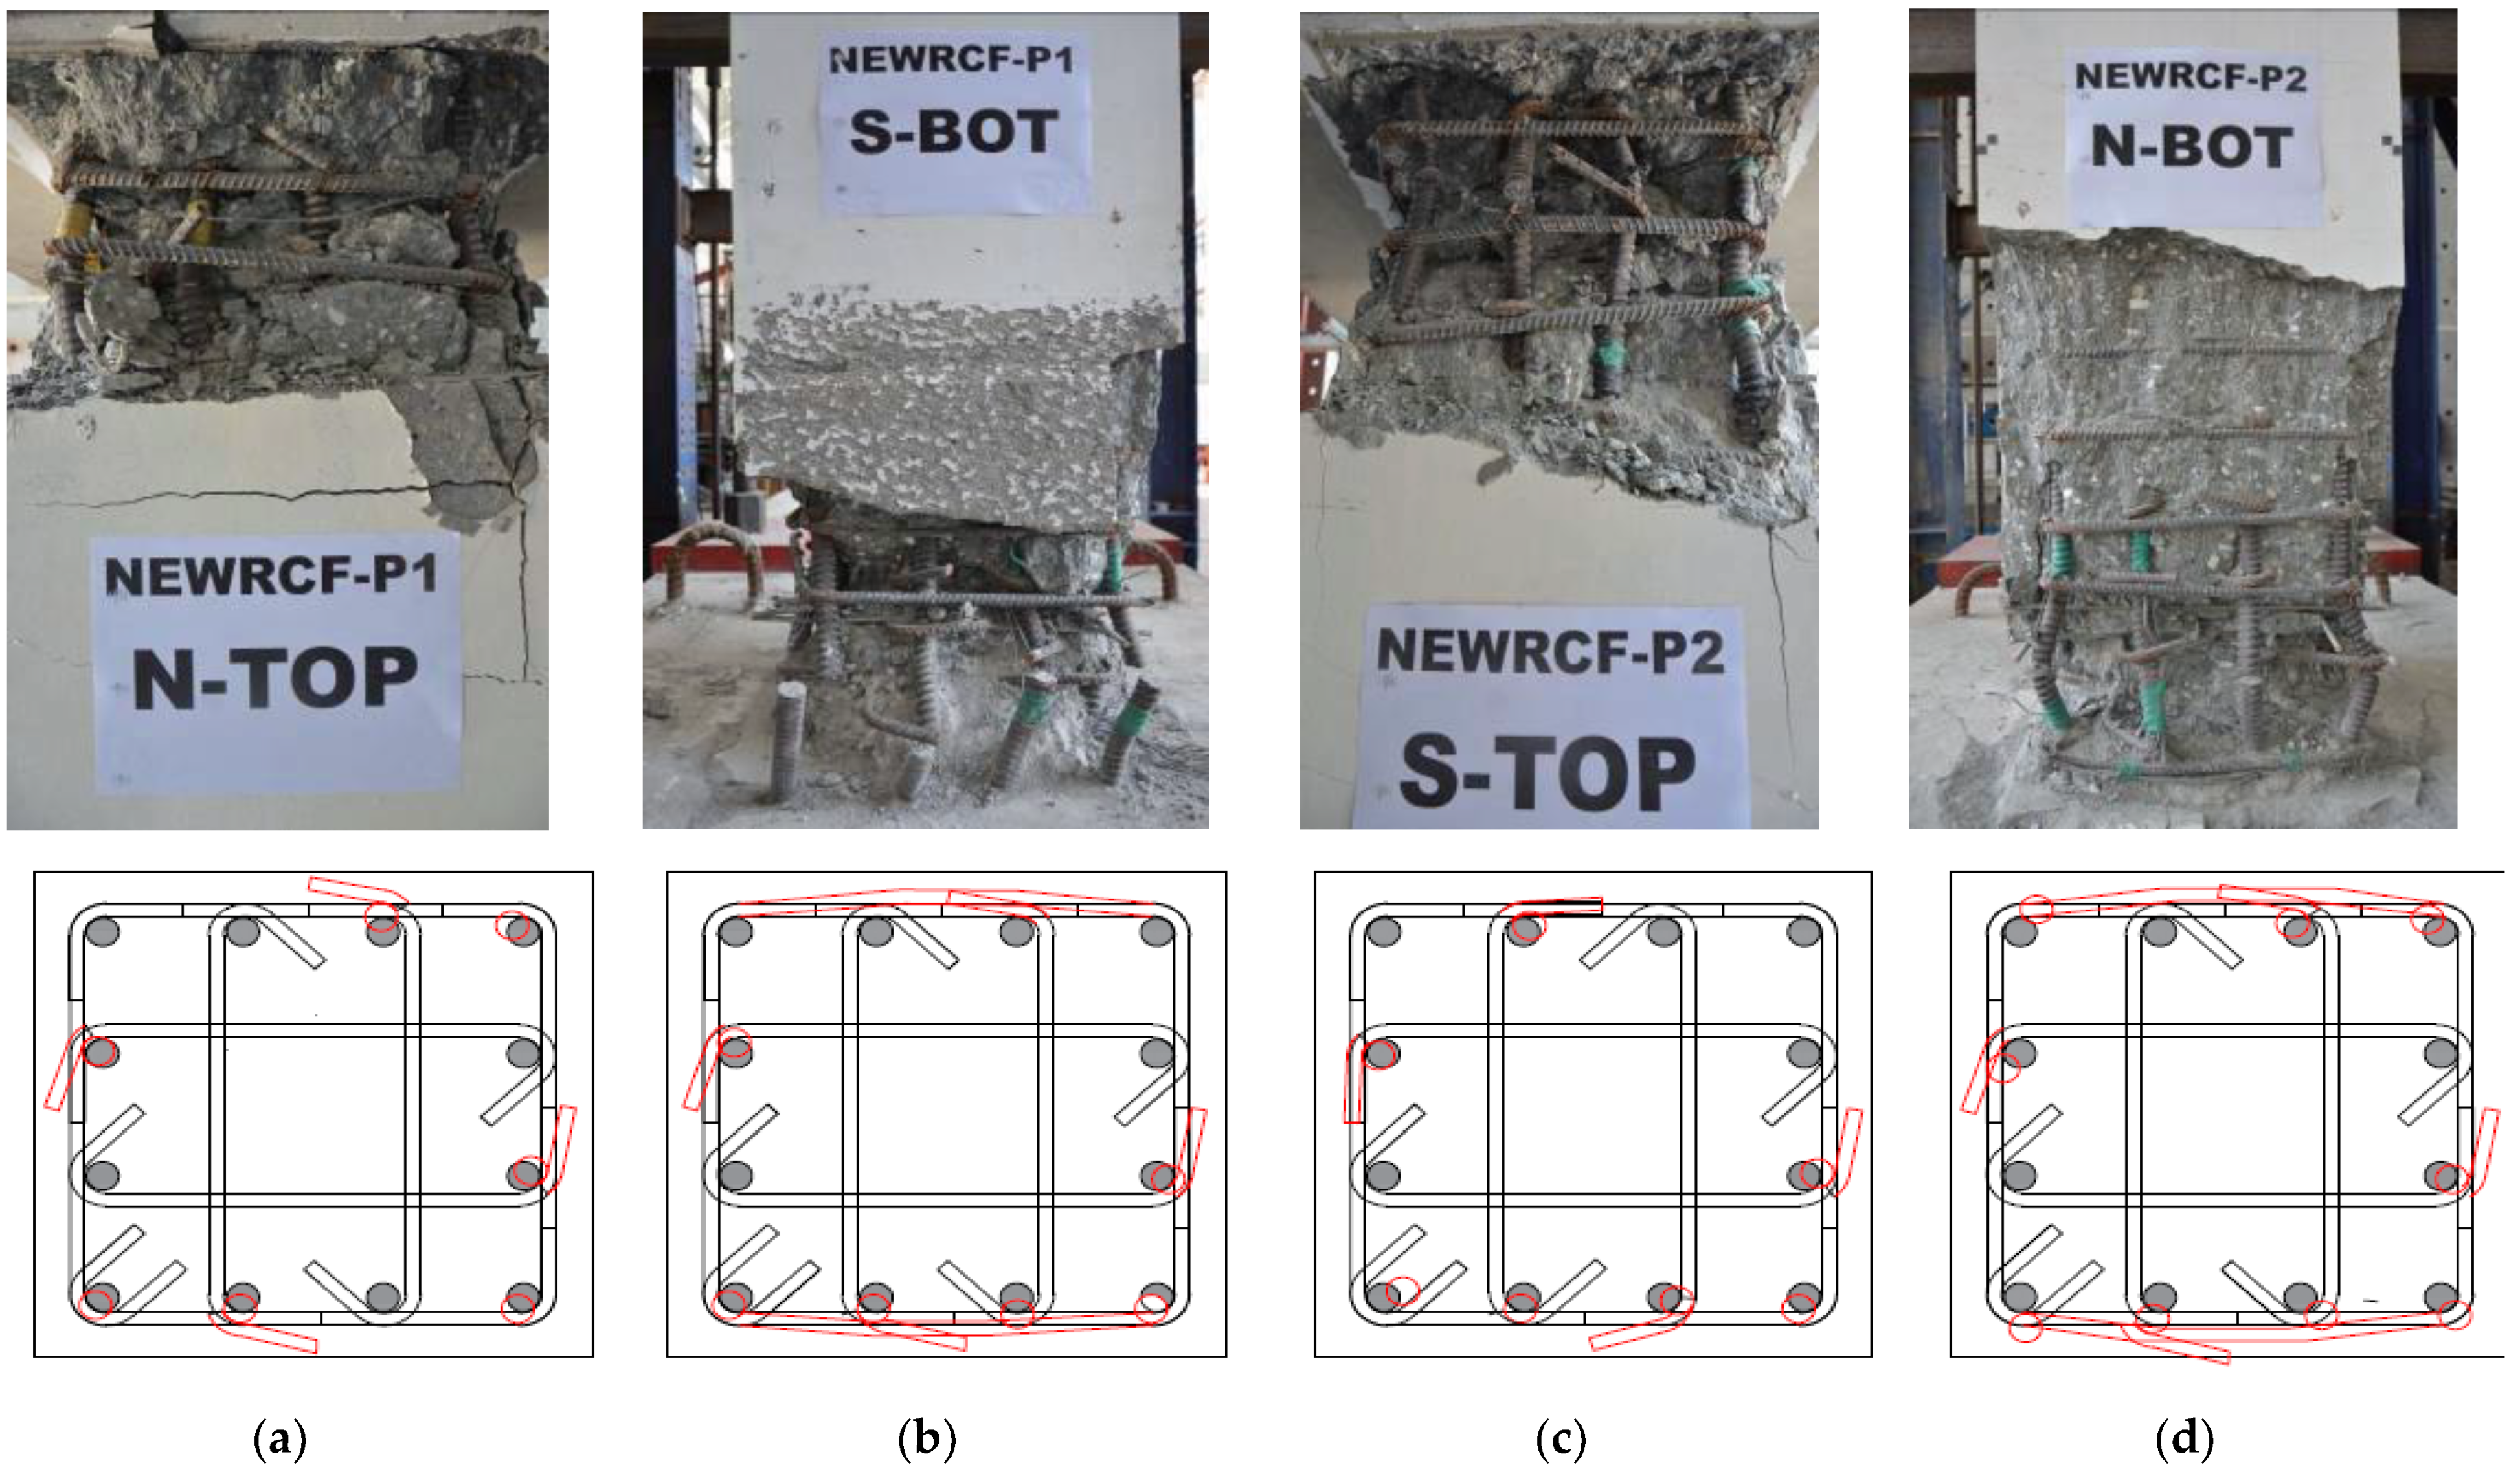
The failure mode and crack pattern of all the column specimens are illustrated in Figure 5. As can be seen in these figures, the damage was concentrated at the base of the column (plastic hinge area) in the loading direction, as reported in [32]. In general, all the specimens experienced four stages of failure: cracking, yield, ultimate, and rebar buckling, despite varying material strengths, spacings, and axial load ratios. The six columns’ failure process was similar; therefore, it can be concluded that NEWRC columns have a failure process similar to that of the BMRC column. No apparent cracks were observed on the specimen surfaces at the initial loading stage for all the specimens, as the deformation was in the elastic range. However, as the lateral load increased, flexural cracks began appearing at the base of the column. Longitudinal rebar was observed to yield around a 1.8–2.0% drift ratio for all specimens. BMRC1 achieved its peak load when the drift ratio was around 2–3%, whereas all the NEWRC columns achieved their peak load when it was approximately 2.5–4%. After the NEWRC column reached its peak load, extensive cover concrete cracks extended upwards from the column base, eventually leading to spalling of the cover. However, for BMRC1, less spalling was observed. Hence, the spalling of the cover concrete was more extensive in NEWRC columns at a lower drift ratio than BMRC1. NEWRC4 experienced more transverse cracking and damages during each drift ratio than NEWRC1, which indicates that the cracking load increased with an increase in axial load ratio.
In specimens NEWRC2 and NEWRC3, due to the increase in transverse reinforcement spacing, longitudinal rebar buckling was observed at an earlier drift ratio of around 4–5%, compared to around 7% for NEWRC1. Furthermore, the longitudinal rebar buckling eventually led to shear strength degradation, with more flexural-shear cracks being observed in the specimens NEWRC2 and NEWRC3. Comparing the behavior of NEWRC1, NEWRC2, and NEWRC3, the transverse reinforcement ratio was identified as the main contributing factor in the failure of NEWRC columns, as less amount of transverse reinforcement ratio can lead to early failure of columns. The failure process of NEWRC5 was identical to that of NEWRC1; both failed due to longitudinal rebar buckling. Hence, it can be concluded that the use of HSR transverse reinforcement cannot avoid longitudinal rebar buckling, and its replacement with the NSR in NEWRC5 had no apparent effects on its failure process. Therefore, it can be concluded that the spacing of transverse reinforcement has more influence on the longitudinal rebar buckling than the strength of transverse reinforcement.
In this section, specimens BMRC1 and NEWRC1 were selected to analyze the influence of material properties on the failure process. The cracking and failure process corresponding to each drift ratio level for the specimens BMRC1 and NEWRC1 is shown in Figure 6. In the early stages (around 0.5–2% drift ratio), BMRC1 had more cracks on its surface than NEWRC1. Both specimens achieved their peak load around a 2–3% drift ratio. However, there was a difference between their failure processes after reaching the peak load. In BMRC1, there was no sudden drop in the lateral load, and less cover concrete spalling was observed. However, NEWRC1 experienced a sudden drop in the lateral load, and more cover concrete spalling was observed. Even though more surface cracks and spalling were observed in NEWRC1, it maintained its core integrity and performed well. BMRC1 and NEWRC1 failed at 8% and 9% drift ratios, respectively, due to the longitudinal rebar buckling and concrete crushing. Hence, from the comparison above, it can be concluded that the strength of the materials had very little or no influence on the longitudinal rebar buckling, as both specimens failed due to buckling.

3.1.2. NEWRCF Frame

The overall failure process of the NEWRCF was identical to NEWRC1; during the initial drift ratio of 0.25%, no apparent cracks were observed. The first flexural cracks were observed during the second cycle at a 0.5% drift ratio level, and the first diagonal crack was observed in the first cycle with a 1% drift ratio. In general, the first cracks were observed at the bases of the column on both sides, followed by the column and beam connections. The longitudinal rebar on both columns (piers) yielded around a drift ratio of 1.5–2%. NEWRCF achieved its peak load at a 3% drift ratio, following which the cracks intensified at the base of both the piers, thus leading to the cover concrete spalling. The longitudinal rebar buckling was observed around a 6% drift ratio, which eventually led to shear strength degradation, and the experiment ended at a drift ratio of 7%. Overall, the failure mode was flexural dominated. Figure 7 shows the detailed images of the failure modes and damage concentrated around the top and bottom of the piers’ connection.
Furthermore, after the test ended, the cover concrete was removed, and it was observed that the 90-degree hooks opened outwards in multiple locations, which led to the buckling of the longitudinal rebar. However, the 135-degree seismic hooks did not open and remained intact. Hence, the comparison between NEWRC columns reflects that using HSR for transverse reinforcement does not necessarily prevent longitudinal rebar buckling.

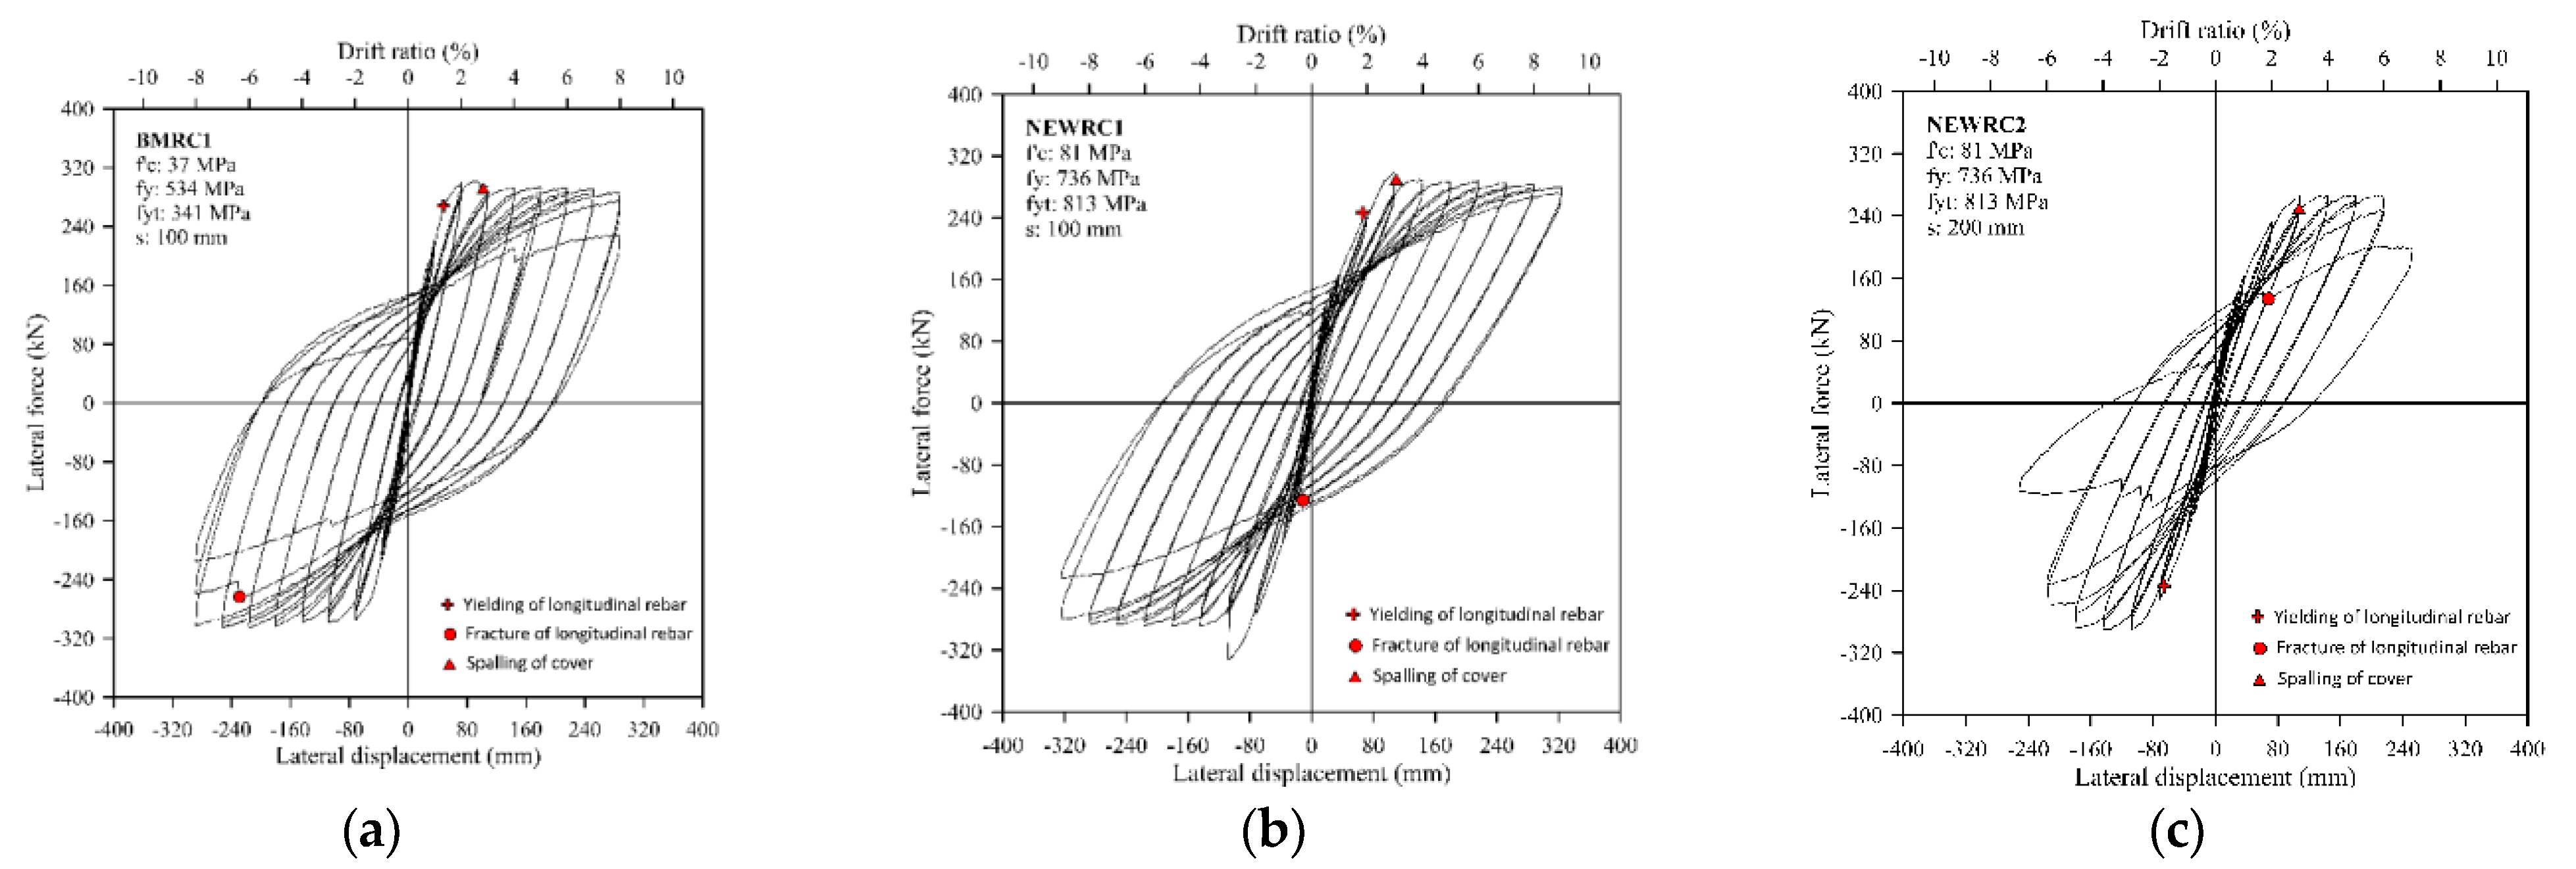
3.2. Hysteresis Loops

The hysteresis loops of all the specimens are shown in Figure 8, where the longitudinal rebar yielding point, cover concrete spalling, and longitudinal rebar fracture point are marked. Figure 8 depicts the hysteresis loops of specimens BMRC1 and NEWRC1. It can be observed that the change of materials had a notable impact on the shape of the hysteresis loops as the latter’s area was narrow and small in all the NEWRC specimens, thereby dissipating less energy compared to BMRC1. The peak lateral load of BMRC1 was 305.45 kN, whereas the peak lateral load of NEWRC1 was 332.45 kN, which was 9% larger than that of BMRC1.
In Figure 8, the hysteresis loop of specimens NEWRC1, NEWRC2, and NEWRC3 are also presented. The longitudinal rebar buckling in NEWRC2 and NEWRC3 was observed at an early stage compared to NEWRC1, leading to shear strength degradation. The peak lateral loads of NEWRC2 and NEWRC3 were 12.3% and 4.35% lower than NEWRC1, respectively, indicating that the spacing of transverse reinforcement had a marginal impact on the overall peak lateral load but had a significant impact on the rebar buckling and shear strength degradation.
Moreover, also in Figure 8, the hysteresis loop of NEWRC1 and NEWRC4 is presented. Due to the doubled axial compression ratio, the peak lateral load of NEWRC4 was 364 kN, i.e., 10% larger than NEWRC1, while the peak drift ratio was smaller than NEWRC1. As the drift ratio level increased, more severe shear strength degradation was observed in NEWRC4.
When considering Figure 8, the hysteresis loop of NEWRC1 and NEWRC5 is presented. The peak lateral load of NEWRC5 was 337.5 kN, i.e., 1.5% larger than NEWRC1. However, it is worth noting that both the specimens showed similar hysteresis loop shapes regardless of HSR transverse reinforcement strength replacement with NSR.
Also, in Figure 8, the hysteresis loop of NEWRCF is shown. The hysteresis response and energy dissipation were found to be satisfactory. The force-displacement response was elastic during the initial stage and gradually shifted towards an inelastic response at higher drift ratios. The peak lateral load recorded was 1087 kN, corresponding to a 2% drift ratio. The buckling of the longitudinal rebar was observed around a 6% drift ratio, due to which the specimen’s load-bearing capacity and dissipated energy decreased gradually.

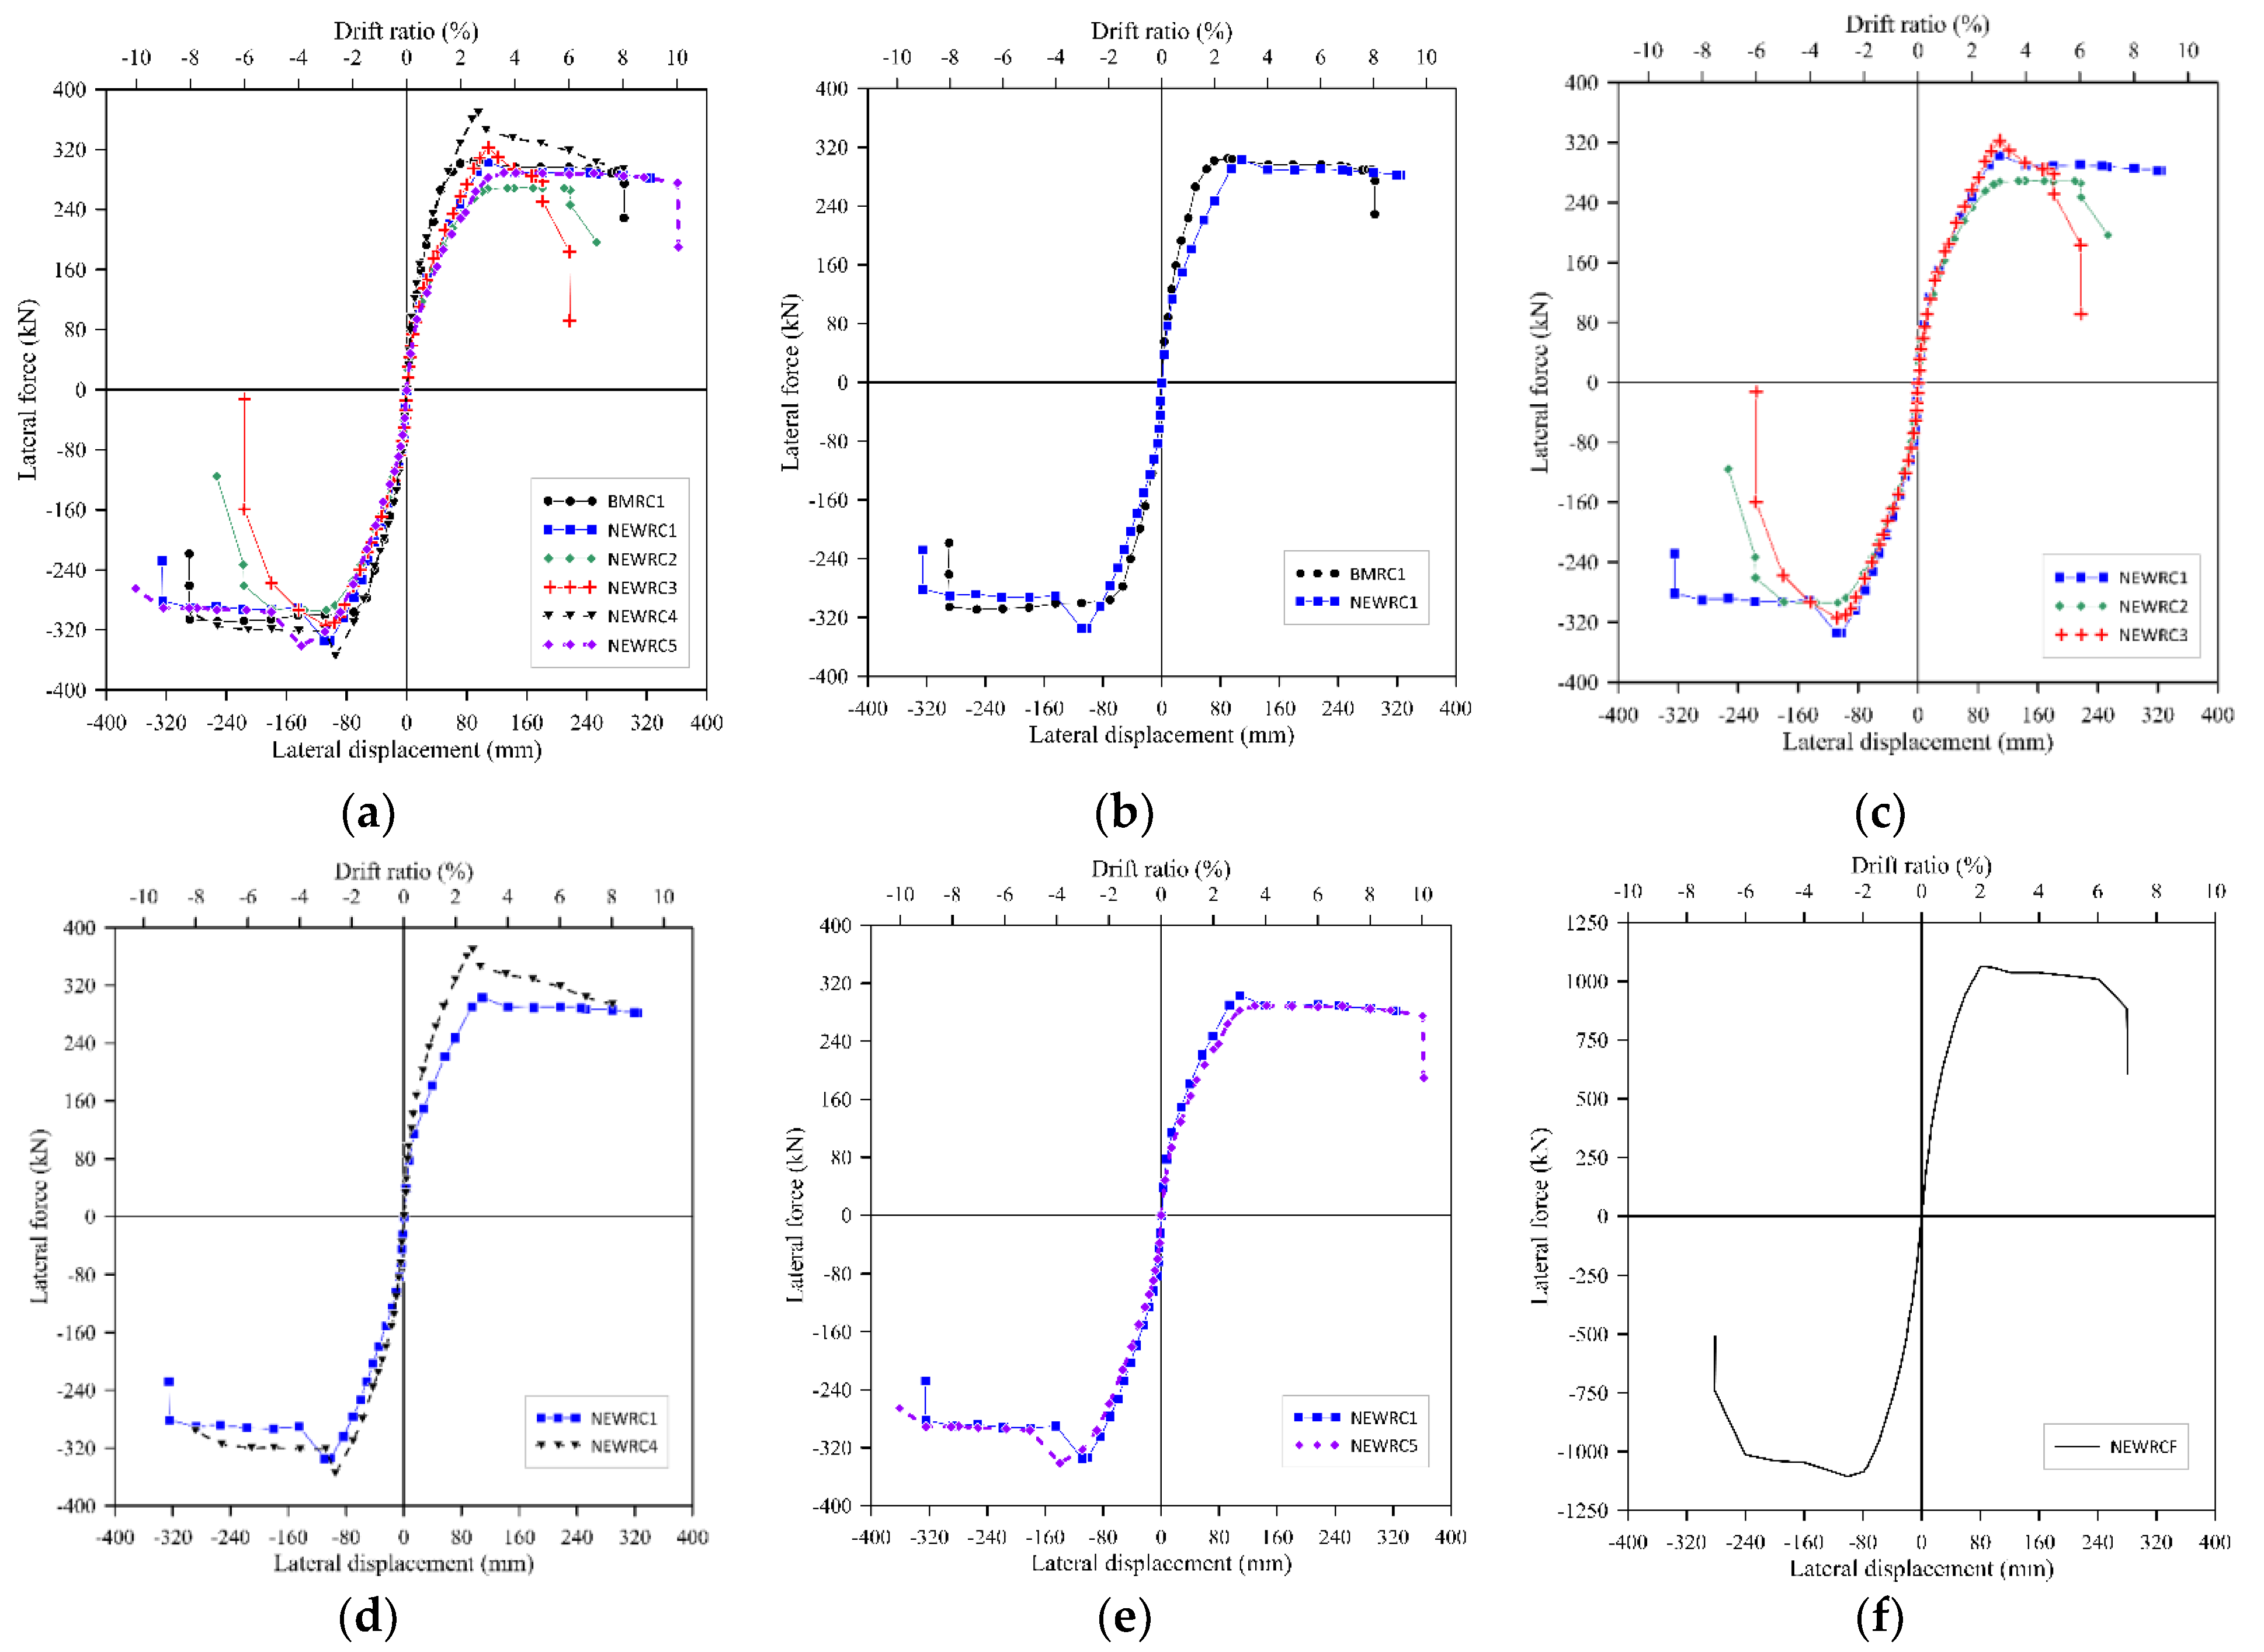
3.3. Backbone Curves

The backbone curves of all the column specimens are presented in Figure 9. The backbone curve reflects the relationship between the peak loads and the corresponding displacement at each drift ratio point. Based on the backbone curve, three stages can be observed: (a) the elastic stage, i.e., the straight line before reaching the yield point, (b) the elastic-plastic stage, i.e., nonlinear response, and (c) the failure stage, i.e., shear strength degradation after longitudinal rebar buckling. It can be seen from Figure 9 that the material properties, axial load ratio, and transverse reinforcement spacing had some impact on the overall response of the backbone curve. Specimens BMRC1 and NEWRC4 had distinct initial stiffness compared to other specimens. Hence, it can be concluded that before reaching the yield load, initial stiffness can be affected by material strengths and axial load ratio.
Additionally, in Figure 9, a comparison is made between the backbone curves of the column BMRC1 and NEWRC1; it can be observed that the overall force-displacement response is similar between the two specimens. Hence, the primary objective of this study to achieve a similar force-displacement response with a reduced cross-sectional area and rebar volume with NEWRC1 was achieved. It can also be observed that the use of high-strength material enhances the initial stiffness, as BMRC1 is stiffer than NEWRC1. However, both specimens followed a similar pattern after achieving the peak load and failed due to longitudinal rebar buckling. The difference in the behavior of BMRC1 and NEWRC1 could be due to the combined influence of both concrete as well as steel, as reported by [33,34]; therefore, future studies can focus on combining the HSC with NSR and NSC with HSR.
A comparison between the backbone curves of the columns NEWRC1, NEWRC2, and NEWRC3 can be seen in Figure 9. Here, the backbone curves of all three specimens overlap before the column’s yield load point, which indicates that the difference in transverse rebar spacing did not influence the initial stiffness. However, apparent differences can be observed in the elastic-plastic stage and failure process. The shear strength degradation in the specimens NEWRC2 and NEWRC3 was more rapid due to the longitudinal rebar buckling at an earlier drift ratio, thus indicating that NEWRC2 and NEWRC3 have poor ductility compared to NEWRC1.
From Figure 9, a comparison is visible between the backbone curves of the columns NEWRC1 and NEWRC4. The maximum load of NEWRC4 is higher than that of NEWRC1 due to the increase in axial load ratio. There is an apparent difference in the initial stiffness between the specimen; NEWRC4 is stiffer than NEWRC1. For NEWRC4, after reaching the maximum load, a steeper descending branch and rapidly degrading strength can be observed, thus indicating poor ductility compared with NEWRC1. The ultimate drift ratio declines from 9% to 8% when the axial load increases. This is because a higher axial load exacerbates the compressive failure of core concrete, especially at the latter stages of loading.
Furthermore, in Figure 9, the backbone curves of the columns NEWRC1 and NEWRC5 are compared with each other. The force-displacement relationship, initial stiffness, yield point, elastic-plastic response, and failure pattern for both the specimens are identical. Hence, the results suggest that the NSR and HSR transverse reinforcements can provide similar confinement under a low axial load. Therefore, it is advised to check transverse reinforcement spacing and axial load ratio from all the comparison results when designing high-strength bridge columns.
Additionally, in Figure 9, the backbone curve for NEWRCF is presented. The backbone curve showed three stages: elastic, elastic-plastic, and shear strength degradation. NEWRCF exhibited an elastic response, as the backbone curve is straight in the initial stage. After reaching the peak load, it showed an elastic-plastic response due to no strength degradation at a 2–6% drift ratio. However, after a 6% drift ratio, prominent longitudinal rebar buckling was observed in both the piers, leading to sudden shear strength degradation, ultimately leading to the specimen’s failure.

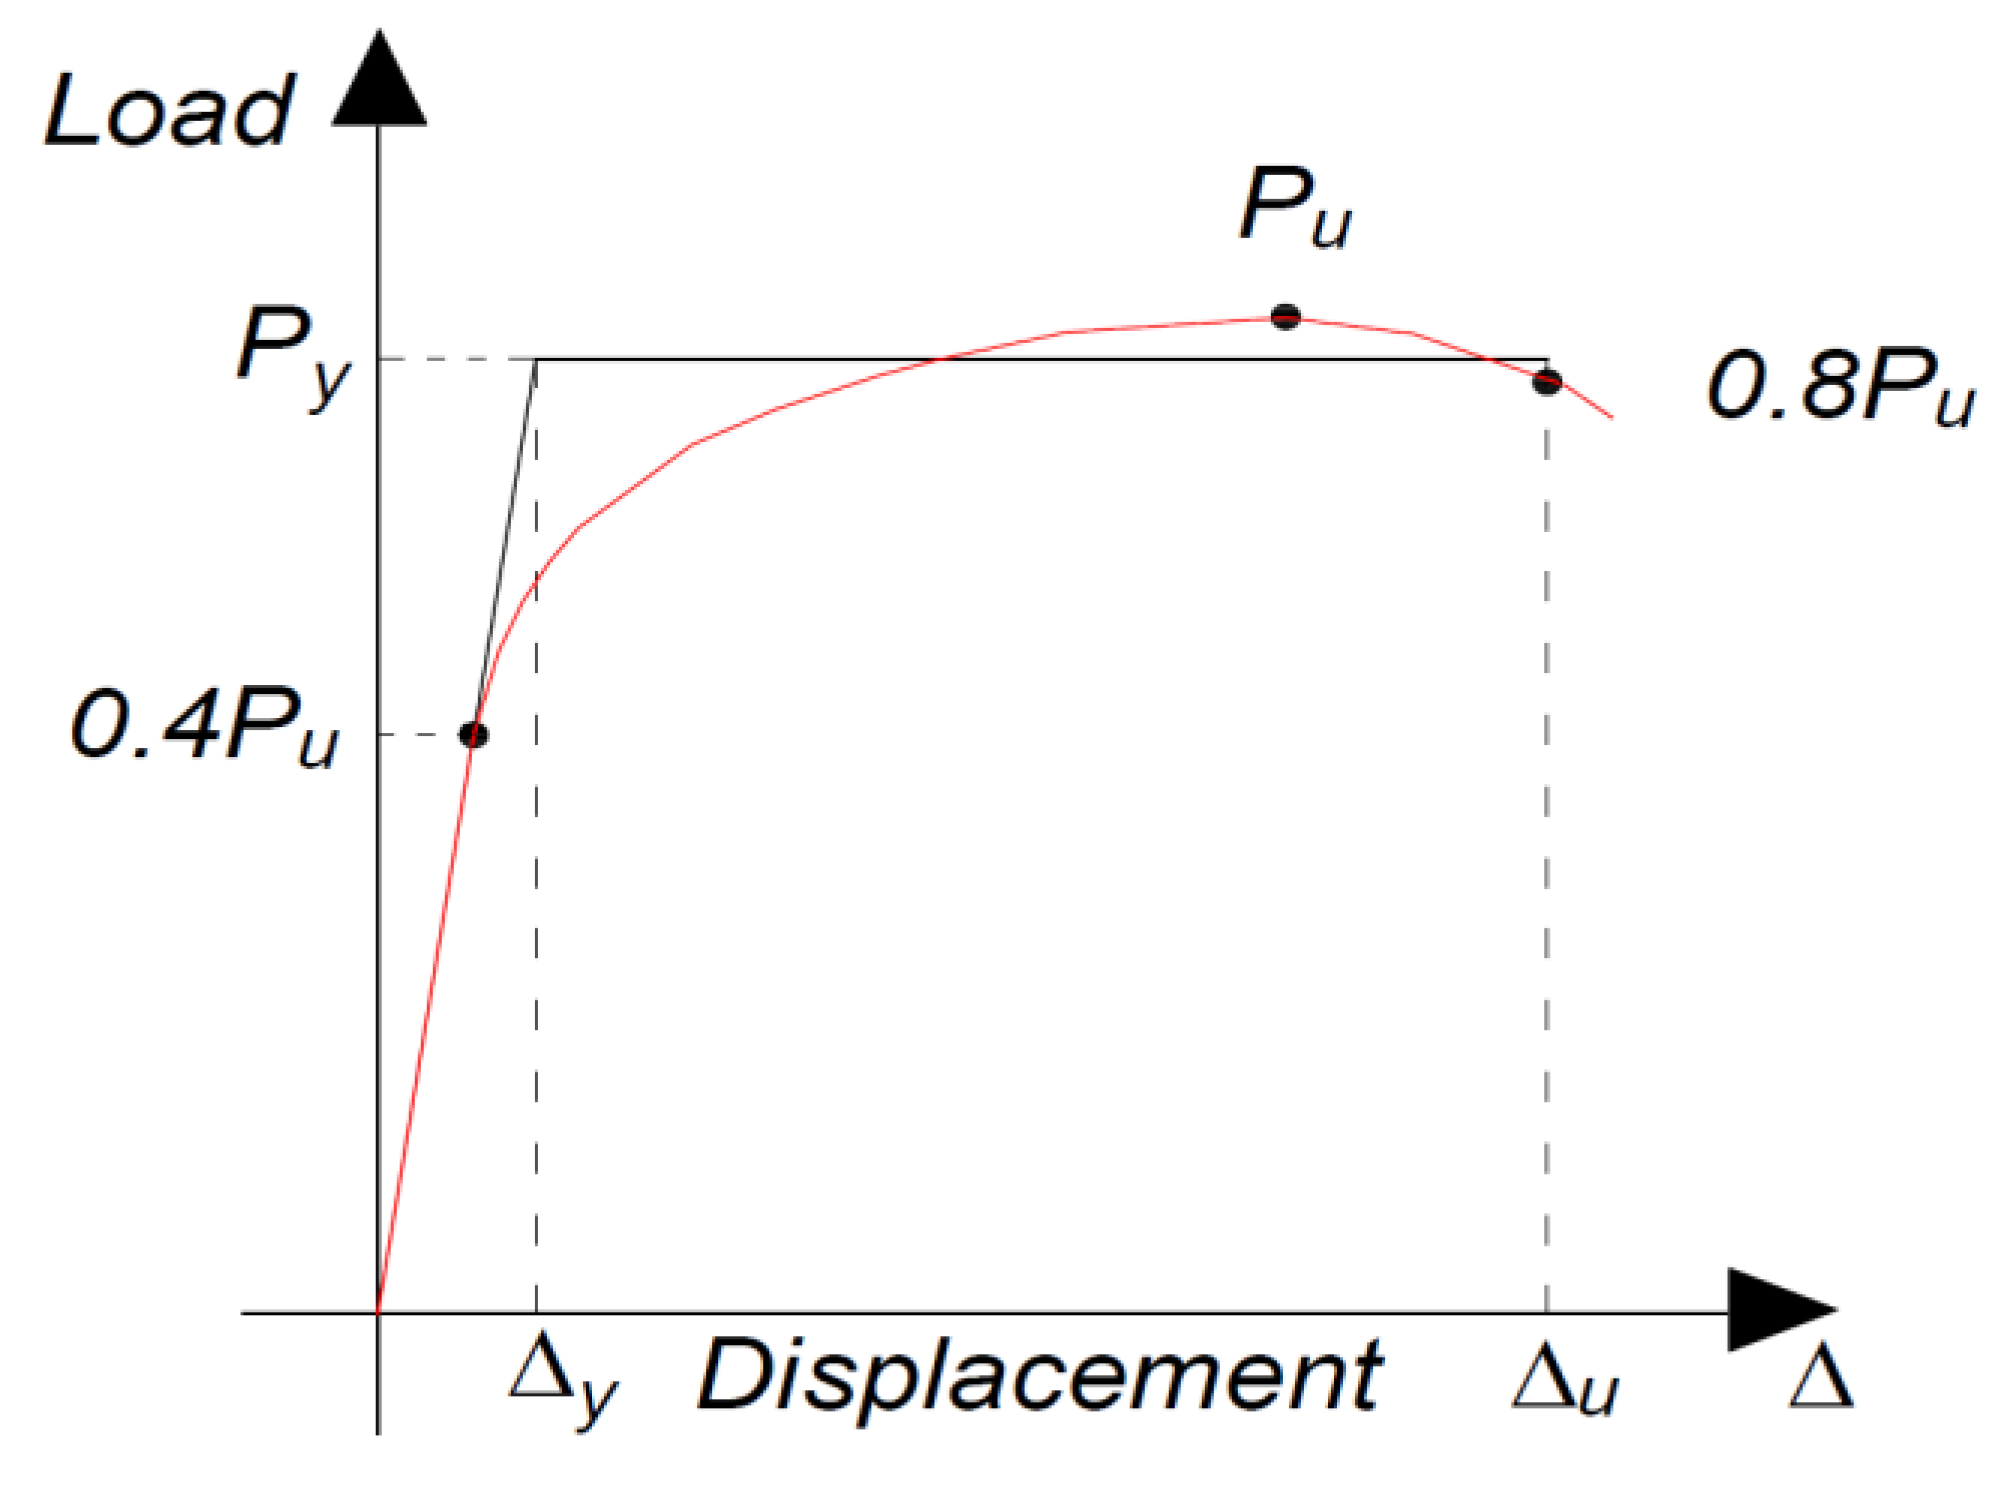
3.4. Strength and Displacement Ductility

The ability of the structures to endure deformation without the collapse of the structure is called displacement ductility. It is one of the essential criteria related to the seismic response of structures and can be calculated using Equation (1).
μ = u y
where y is the corresponding displacement to the yield load, and u is the maximum displacement of the structure calculated using the equivalent energy method [35], as shown in Figure 10.
The displacement, load, and drift ratio corresponding to the yield point, peak point, and ultimate point, along with the displacement ductility for all the specimens, are presented in Table 3. As shown in the table, specimens BMRC1, NEWRC1, NEWRC4, NEWRC5, and NEWRCF have excellent ductility as their ductility ratio is more significant than 5, which is greater than the code specification of MOTC, Taiwan, ROC [36], for bridges located in the seismic zone.
Compared to BMRC1, NEWRC1 recorded a 4.7% decrease in displacement ductility, indicating that the material properties slightly influenced the displacement ductility. Furthermore, when other input parameters are the same, an increase in the transverse reinforcement spacing results in the rapid degradation of the displacement ductility; NEWRC2 and NEWRC3 show a reduced displacement ductility of 33.3% and 46.3%, respectively, compared to NEWRC1. On the other hand, an increase in the axial load ratio and varying transverse reinforcement strength increased the displacement ductility slightly; NEWRC4 and NEWRC5 showed an increased displacement ductility of 7.1% and 5.9%, respectively, compared to NEWRC1. The displacement ductility of the specimen NEWRCF frame is greater than 5.0, which implies that the frame has good ductility and deformation capability under quasi-static cyclic loading.
As the primary mode of failure was identified as buckling of longitudinal rebar. Therefore, in Table 3, the deformation at rebar buckling from the experimental results ∆bbexp was compared with the buckling failure point ∆bbpred proposed by Berry and Eberhard [37]. The buckling limit equation is presented in Equation (2). The results suggest that the predicted values were in the acceptable range for all the columns and frame specimens.
b b L % = 3.25   1 + K e b b ρ e f f d b D 1 P A g f c 1 + L 10   D
where b b / L is the drift ratio at buckling failure, K e b b = 40 for rectangular-reinforced columns and 150 for spiral-reinforced columns but should be taken as 0 for columns with s d b > 6 ,   ρ e f f = ρ s f y t / f c ρ s is the volumetric transverse reinforcement ratio, f y t is the yield stress of the transverse reinforcement, L   is the distance from the column base to the point of contra flexure, and D is the column depth.

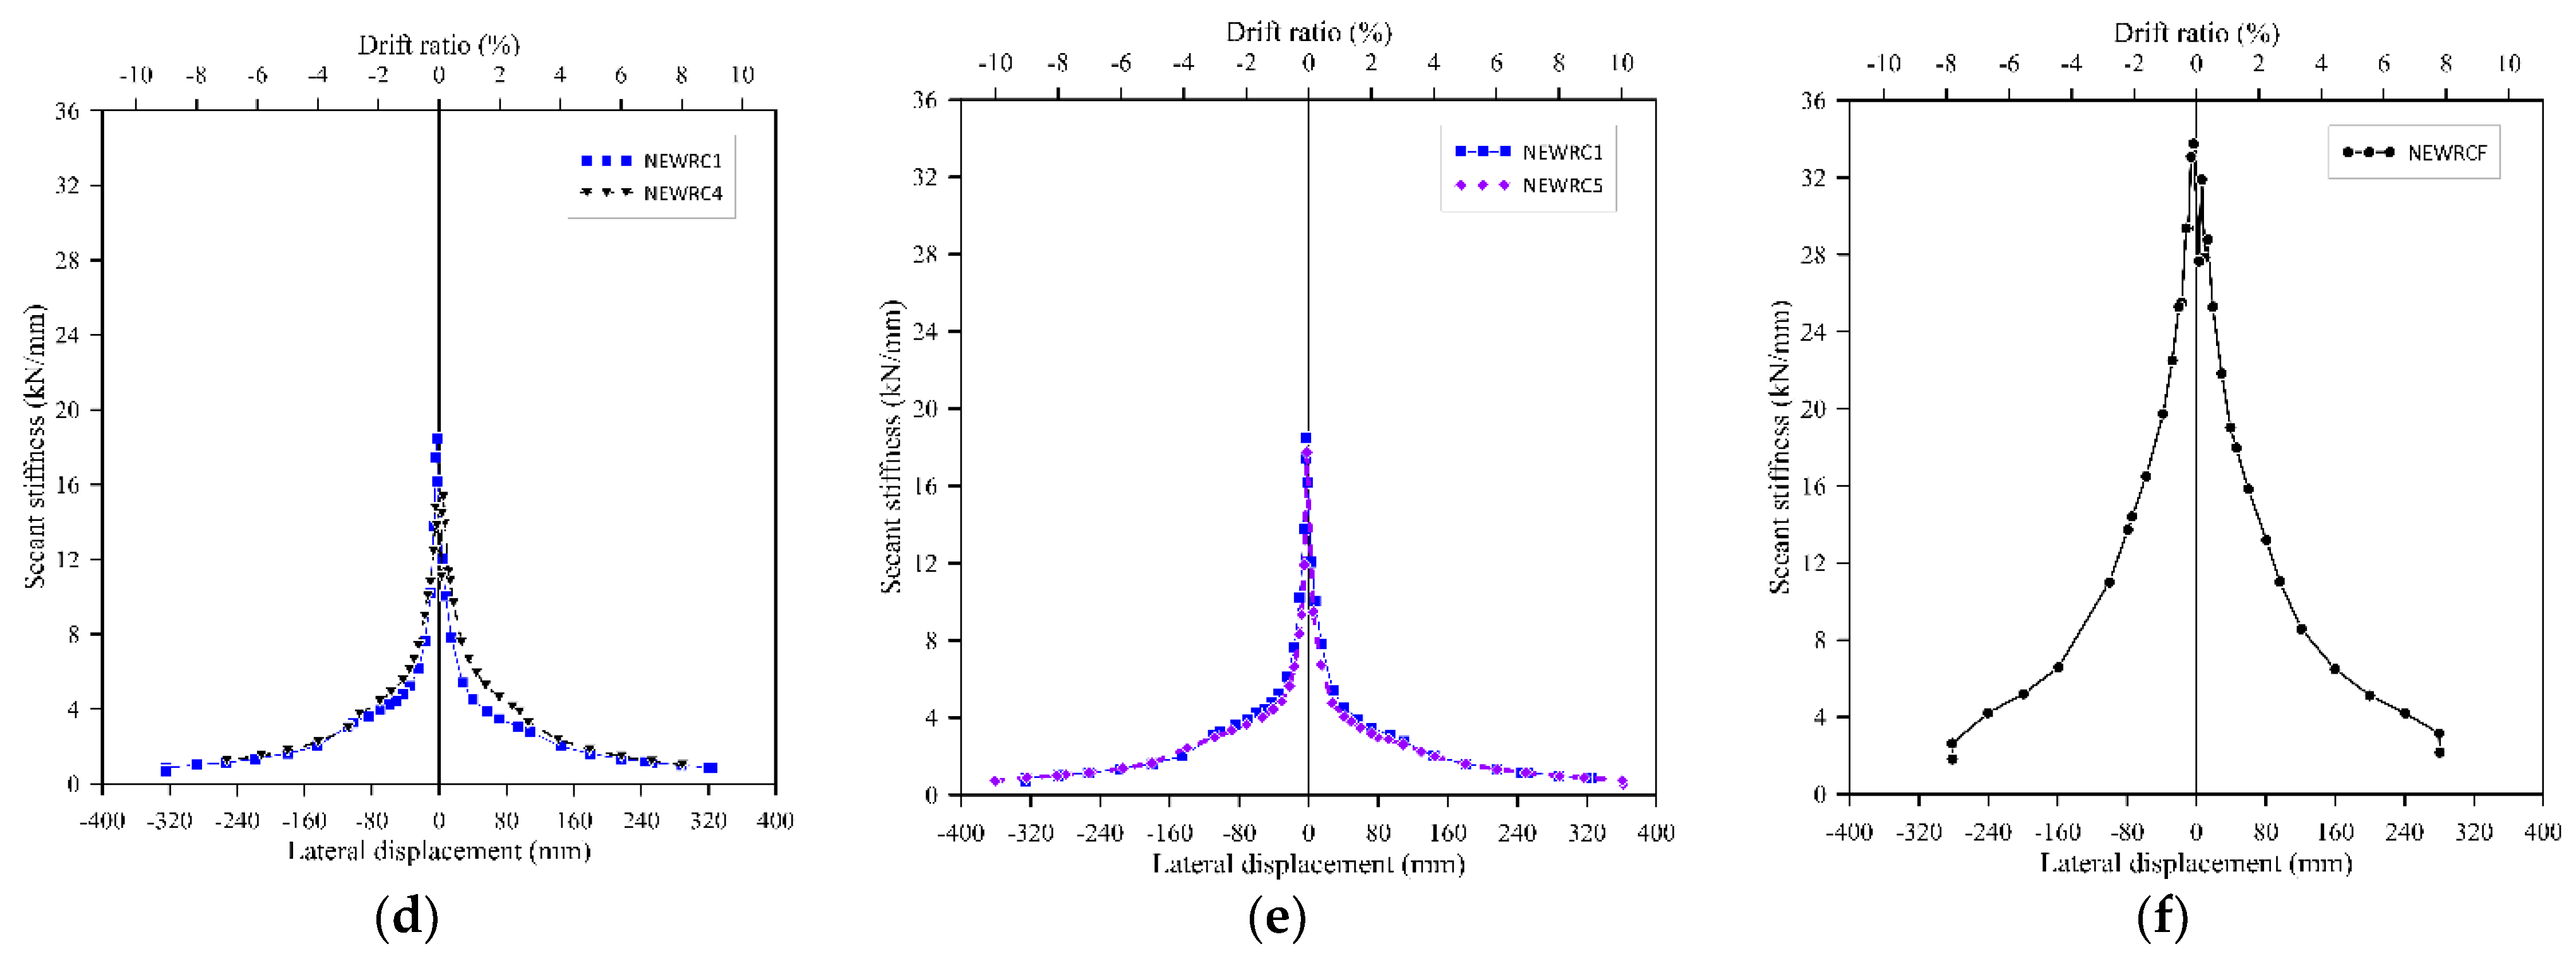
3.5. Stiffness Degradation

Stiffness is an essential aspect of the seismic design of a load-bearing structure, and it degrades with the concrete cracks and the longitudinal rebar’s yield. Secant stiffness was calculated using Equation (3), where K i is the average secant stiffness at the ith loading cycle, + P i and P i represent the positive and negative lateral load at the ith cycle, respectively, and + i and − i are the corresponding lateral displacement.
K i = + P i   + P i   + Δ i   + Δ i      
Figure 11 shows the stiffness degradation curves for all the specimens. Here, secant stiffness quickly degrades at the initial stage as the concrete cracks and accumulates damage under repeated loading cycles. However, after reaching the yield point—with the development of plastic deformation—the stiffness degradation slows down and remains stable. Additionally, in Figure 11, the effect of material properties on the secant stiffness of the column is shown. It can be observed that the secant stiffness for BMRC1 before reaching the peak load was slightly higher than NEWRC1. However, they show a similar degradation process after reaching the peak load.
Figure 11 further shows the effect of transverse reinforcement influence on the secant stiffness. From this, it can be seen that the initial stiffness of NEWRC2 and NEWRC3 is slightly higher than that of NEWRC1. However, there is no apparent difference in the degradation process as they follow a similar pattern. Meanwhile, Figure 11 also shows the effect of the axial load ratio on the secant stiffness of the columns. It can be observed that the secant stiffness of NEWRC4 is higher than that of NEWRC1.
Moreover, the degradation process varies slightly here. Hence, it can be concluded that an increase in axial load ratio increases the secant stiffness and accelerates the stiffness degradation process. Figure 11 also depicts the secant stiffness between NEWRC1 and NEWRC5, where it can be seen that both specimens have a similar secant stiffness and follow a similar degradation pattern. Furthermore, Figure 11 shows the secant stiffness of the specimen NEWRCF. During the initial cycles, the rate of stiffness degradation is higher. However, after the specimen reaches its yield load, the stiffness degradation slows down gradually. In the later cycles, it remains stable, which shows that NEWRCF has good ductility.

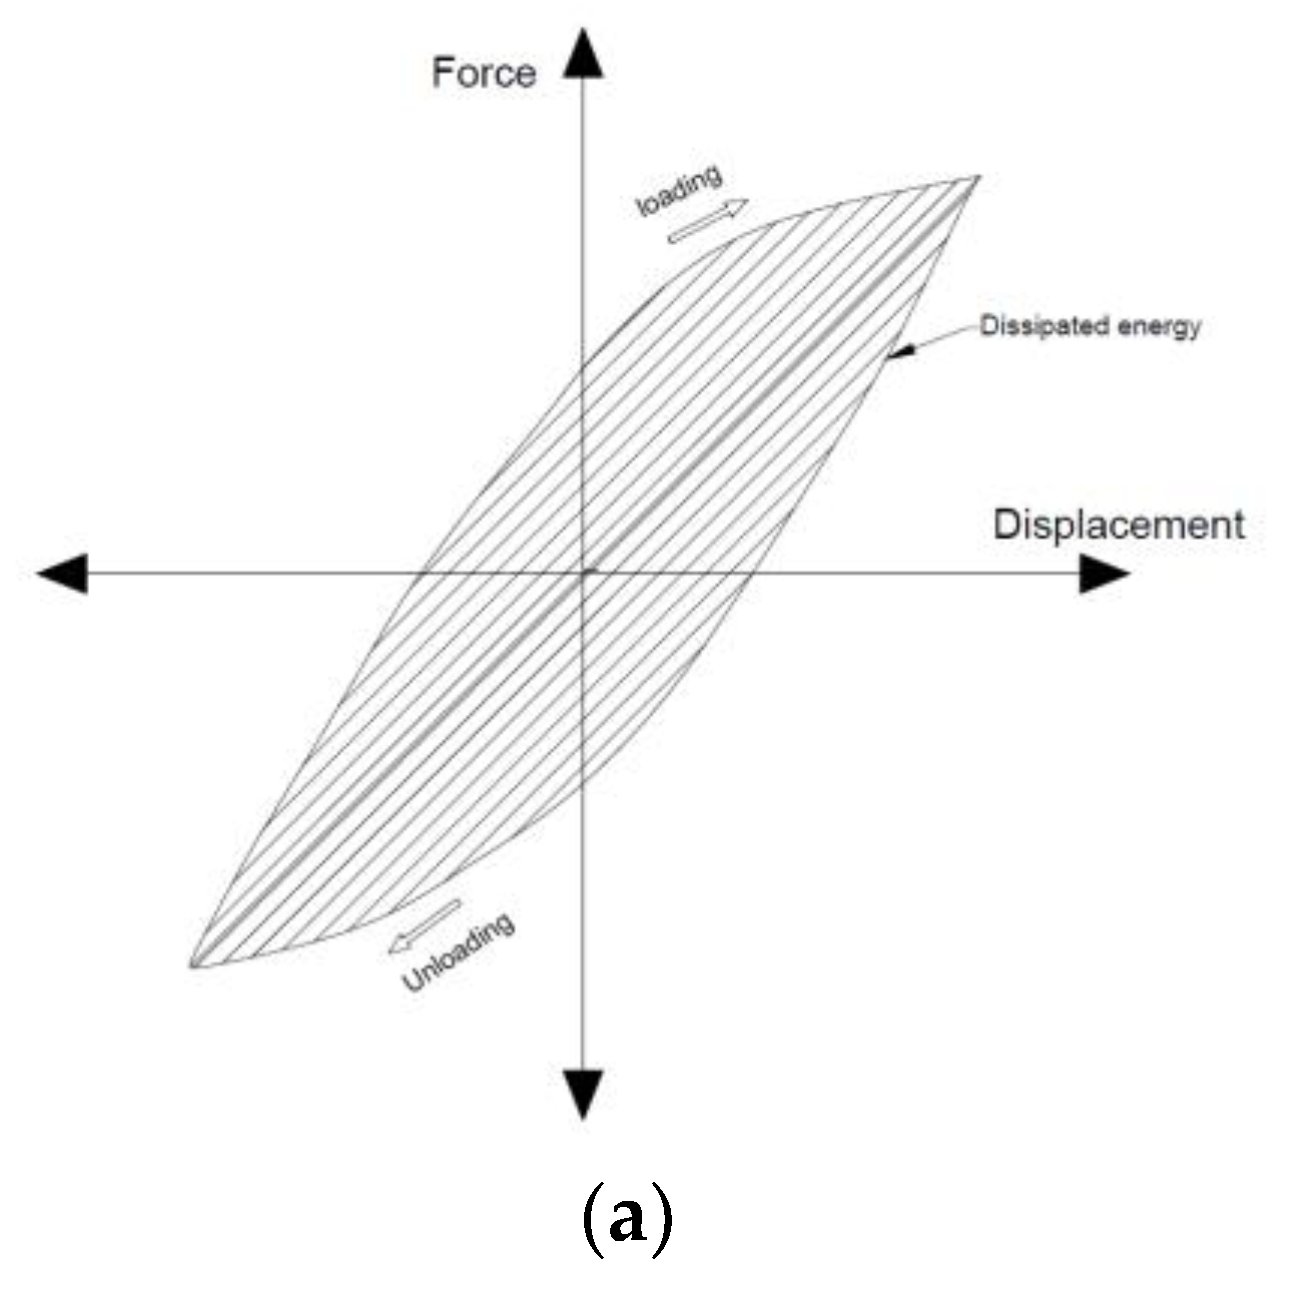
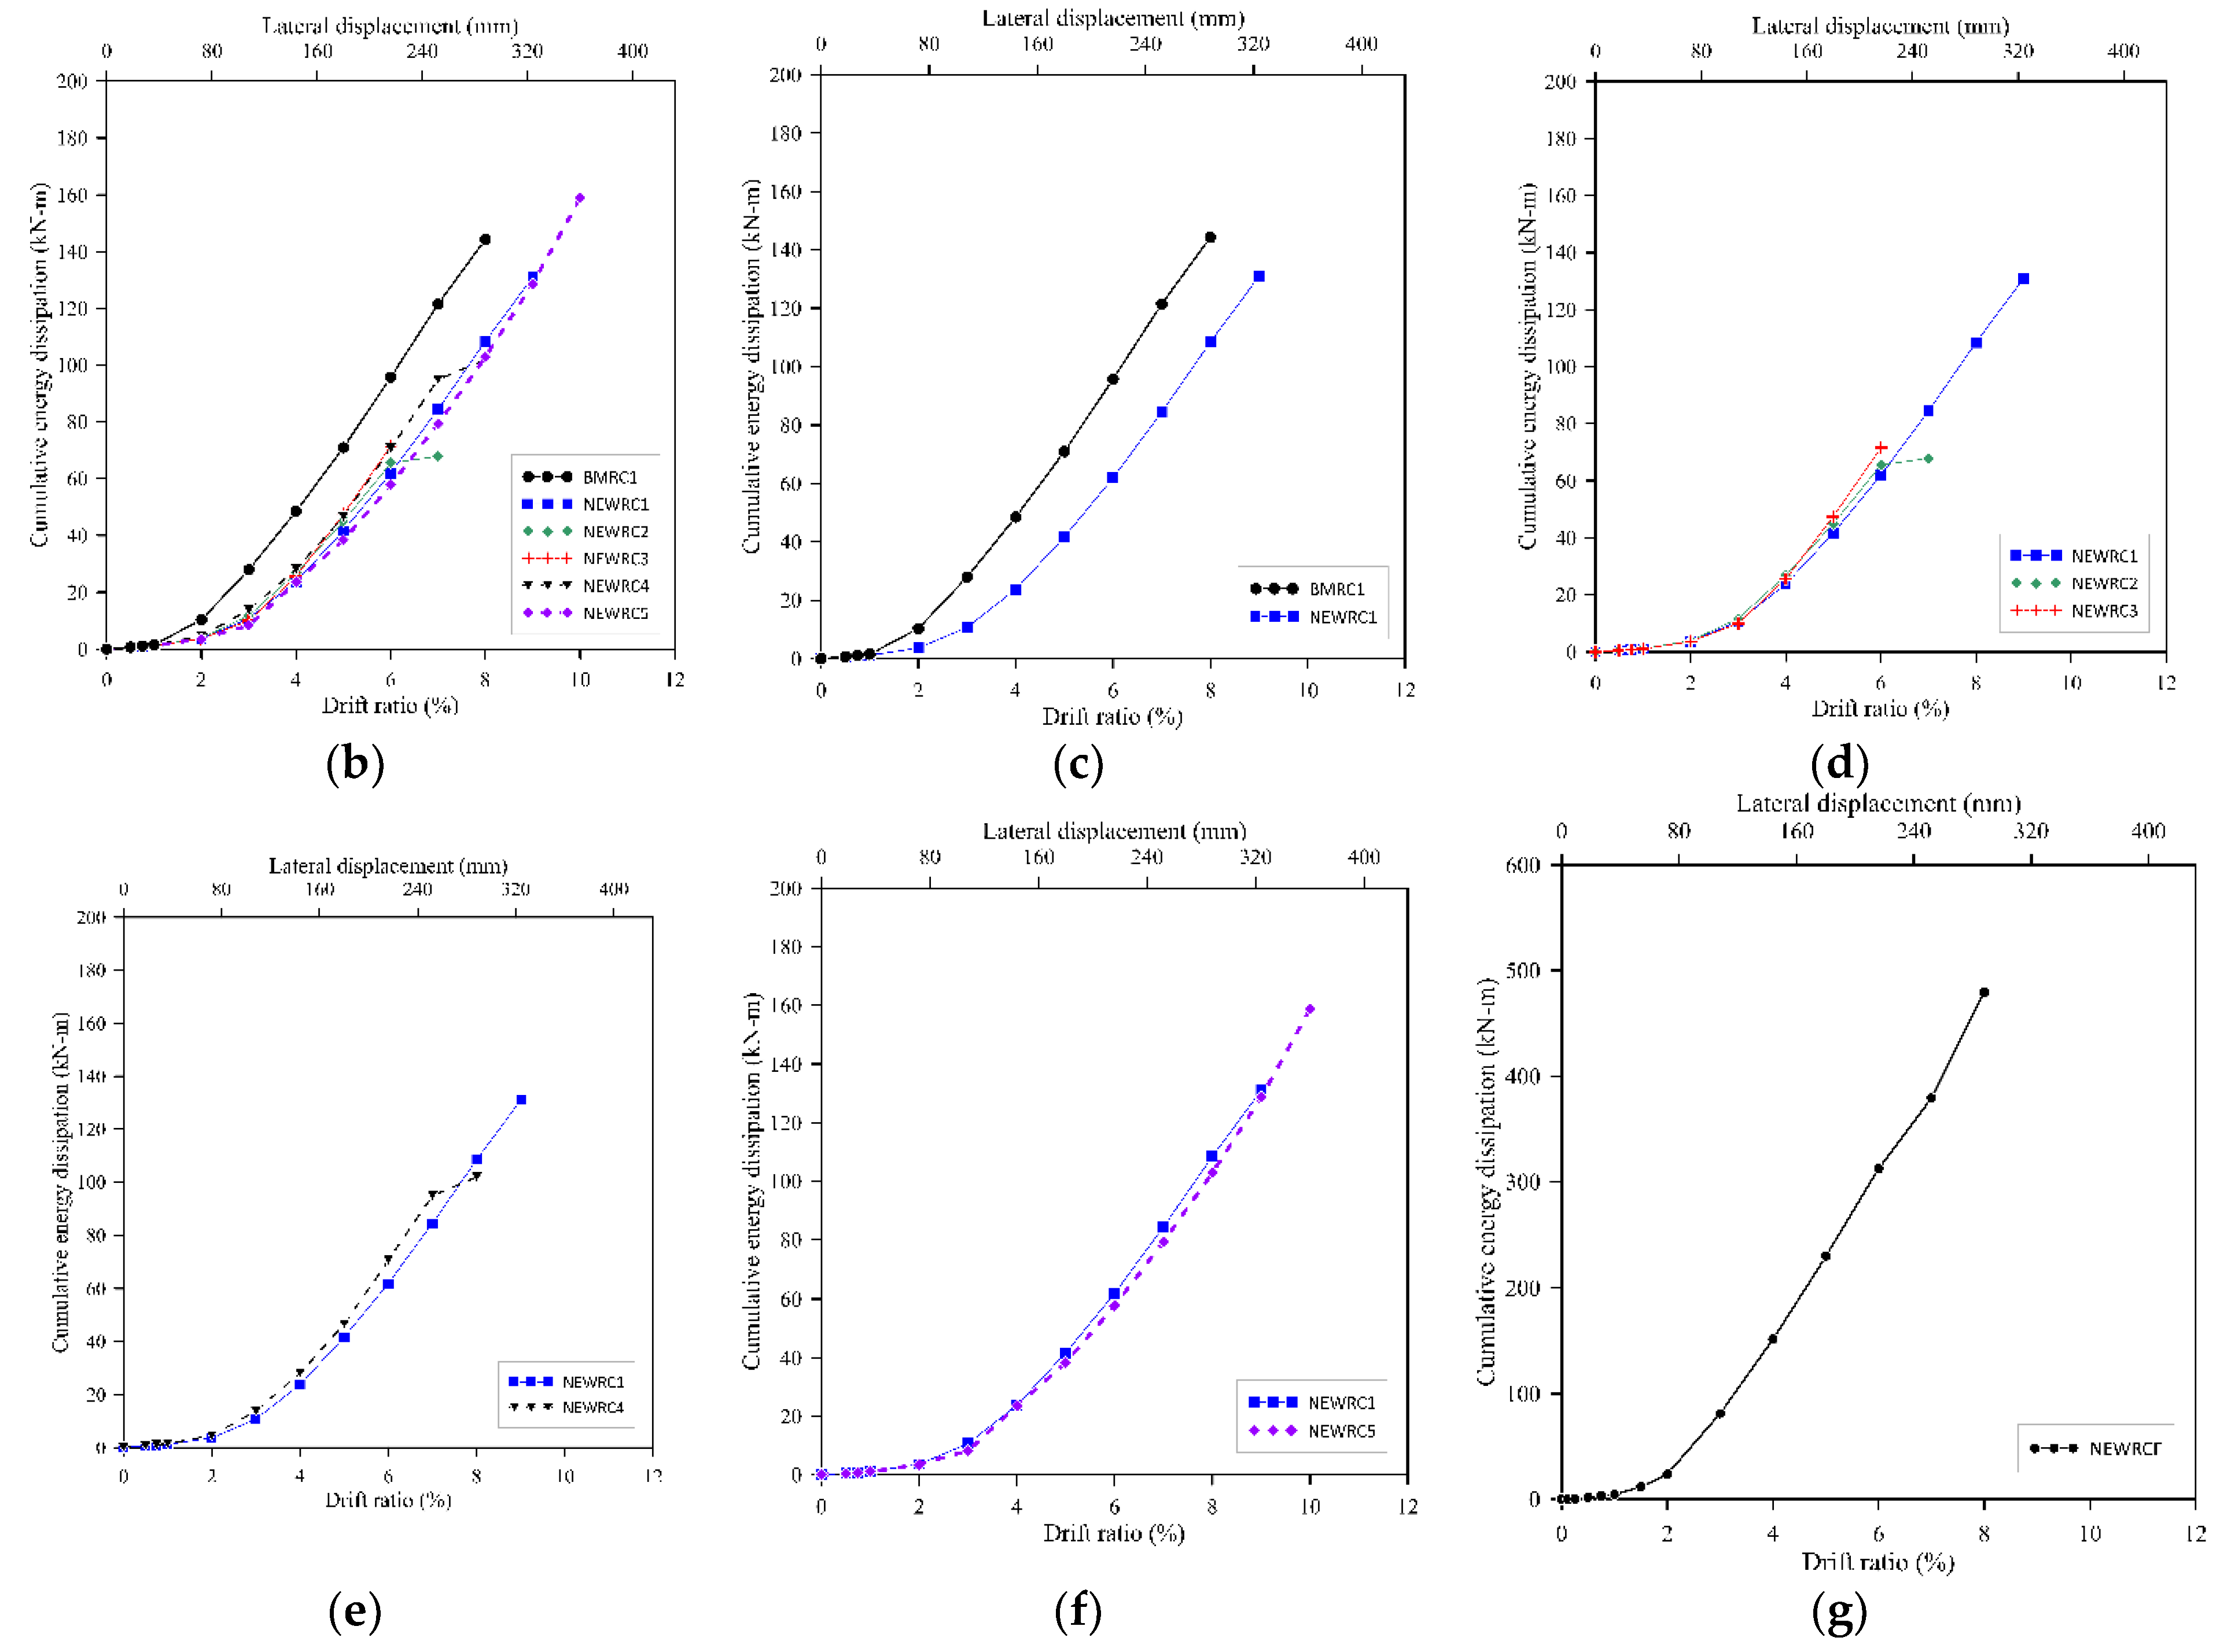
3.6. Energy Dissipation Capacity

The energy dissipation capacity of the structure plays an essential role in determining its seismic performance, especially in the elastoplastic stage. In general, a larger hysteresis loop contributes to better energy dissipation capacity. The average between the hysteresis loops at each drift level was used to calculate the cumulative energy dissipation capacity, as shown in Figure 12.
Figure 12 also shows the comparison between the cumulative energy dissipation for all the specimens. The energy dissipation values increasingly vary with the increasing drift ratio. Here, it can be noted that all the NEWRC specimens have a distinctive pattern compared to BMRC1. Additionally, in Figure 12, the energy dissipation between BMRC1 and NEWRC1 is compared; under the same drift ratio, BMRC1 has a higher capacity than NEWRC1. The results suggest that the material properties had a significant influence on the energy dissipation capacity of the columns.
Further, in Figure 12, a comparison between NEWRC1, NEWRC2, and NEWRC3 is made to investigate the influence of transverse reinforcement spacing on the energy dissipation capacity. It can be observed that until the 4% drift ratio, the energy dissipated by all three specimens is similar. However, after 4%, the energy dissipated by NEWRC3 is slightly higher, followed by NEWRC2 and NEWRC1. It is evident that the transverse reinforcement spacing only had a minor influence on its energy dissipation capacity under the same drift level.
The energy dissipation curves for NEWRC1 and NEWRC4 are also shown in Figure 12. It can be observed that under the same drift ratio, the energy dissipated by NEWRC4 is slightly higher than that of NEWRC1. Hence, it can be concluded that the increase in the axial load ratio can increase the energy dissipation of the specimen. The replacement of HSR transverse reinforcement strength with NSR had no apparent influence on the energy dissipation capacity of the columns, as the energy dissipated by NEWRC1 and NEWRC5 is approximately the same, as shown in Figure 12.
Figure 12 further shows the energy dissipation curve for NEWRCF. The frame’s energy dissipation capacity increased linearly with the increase in drift cycles, which indicates that the NEWRCF has a strong energy dissipation capacity under the cyclic loading.

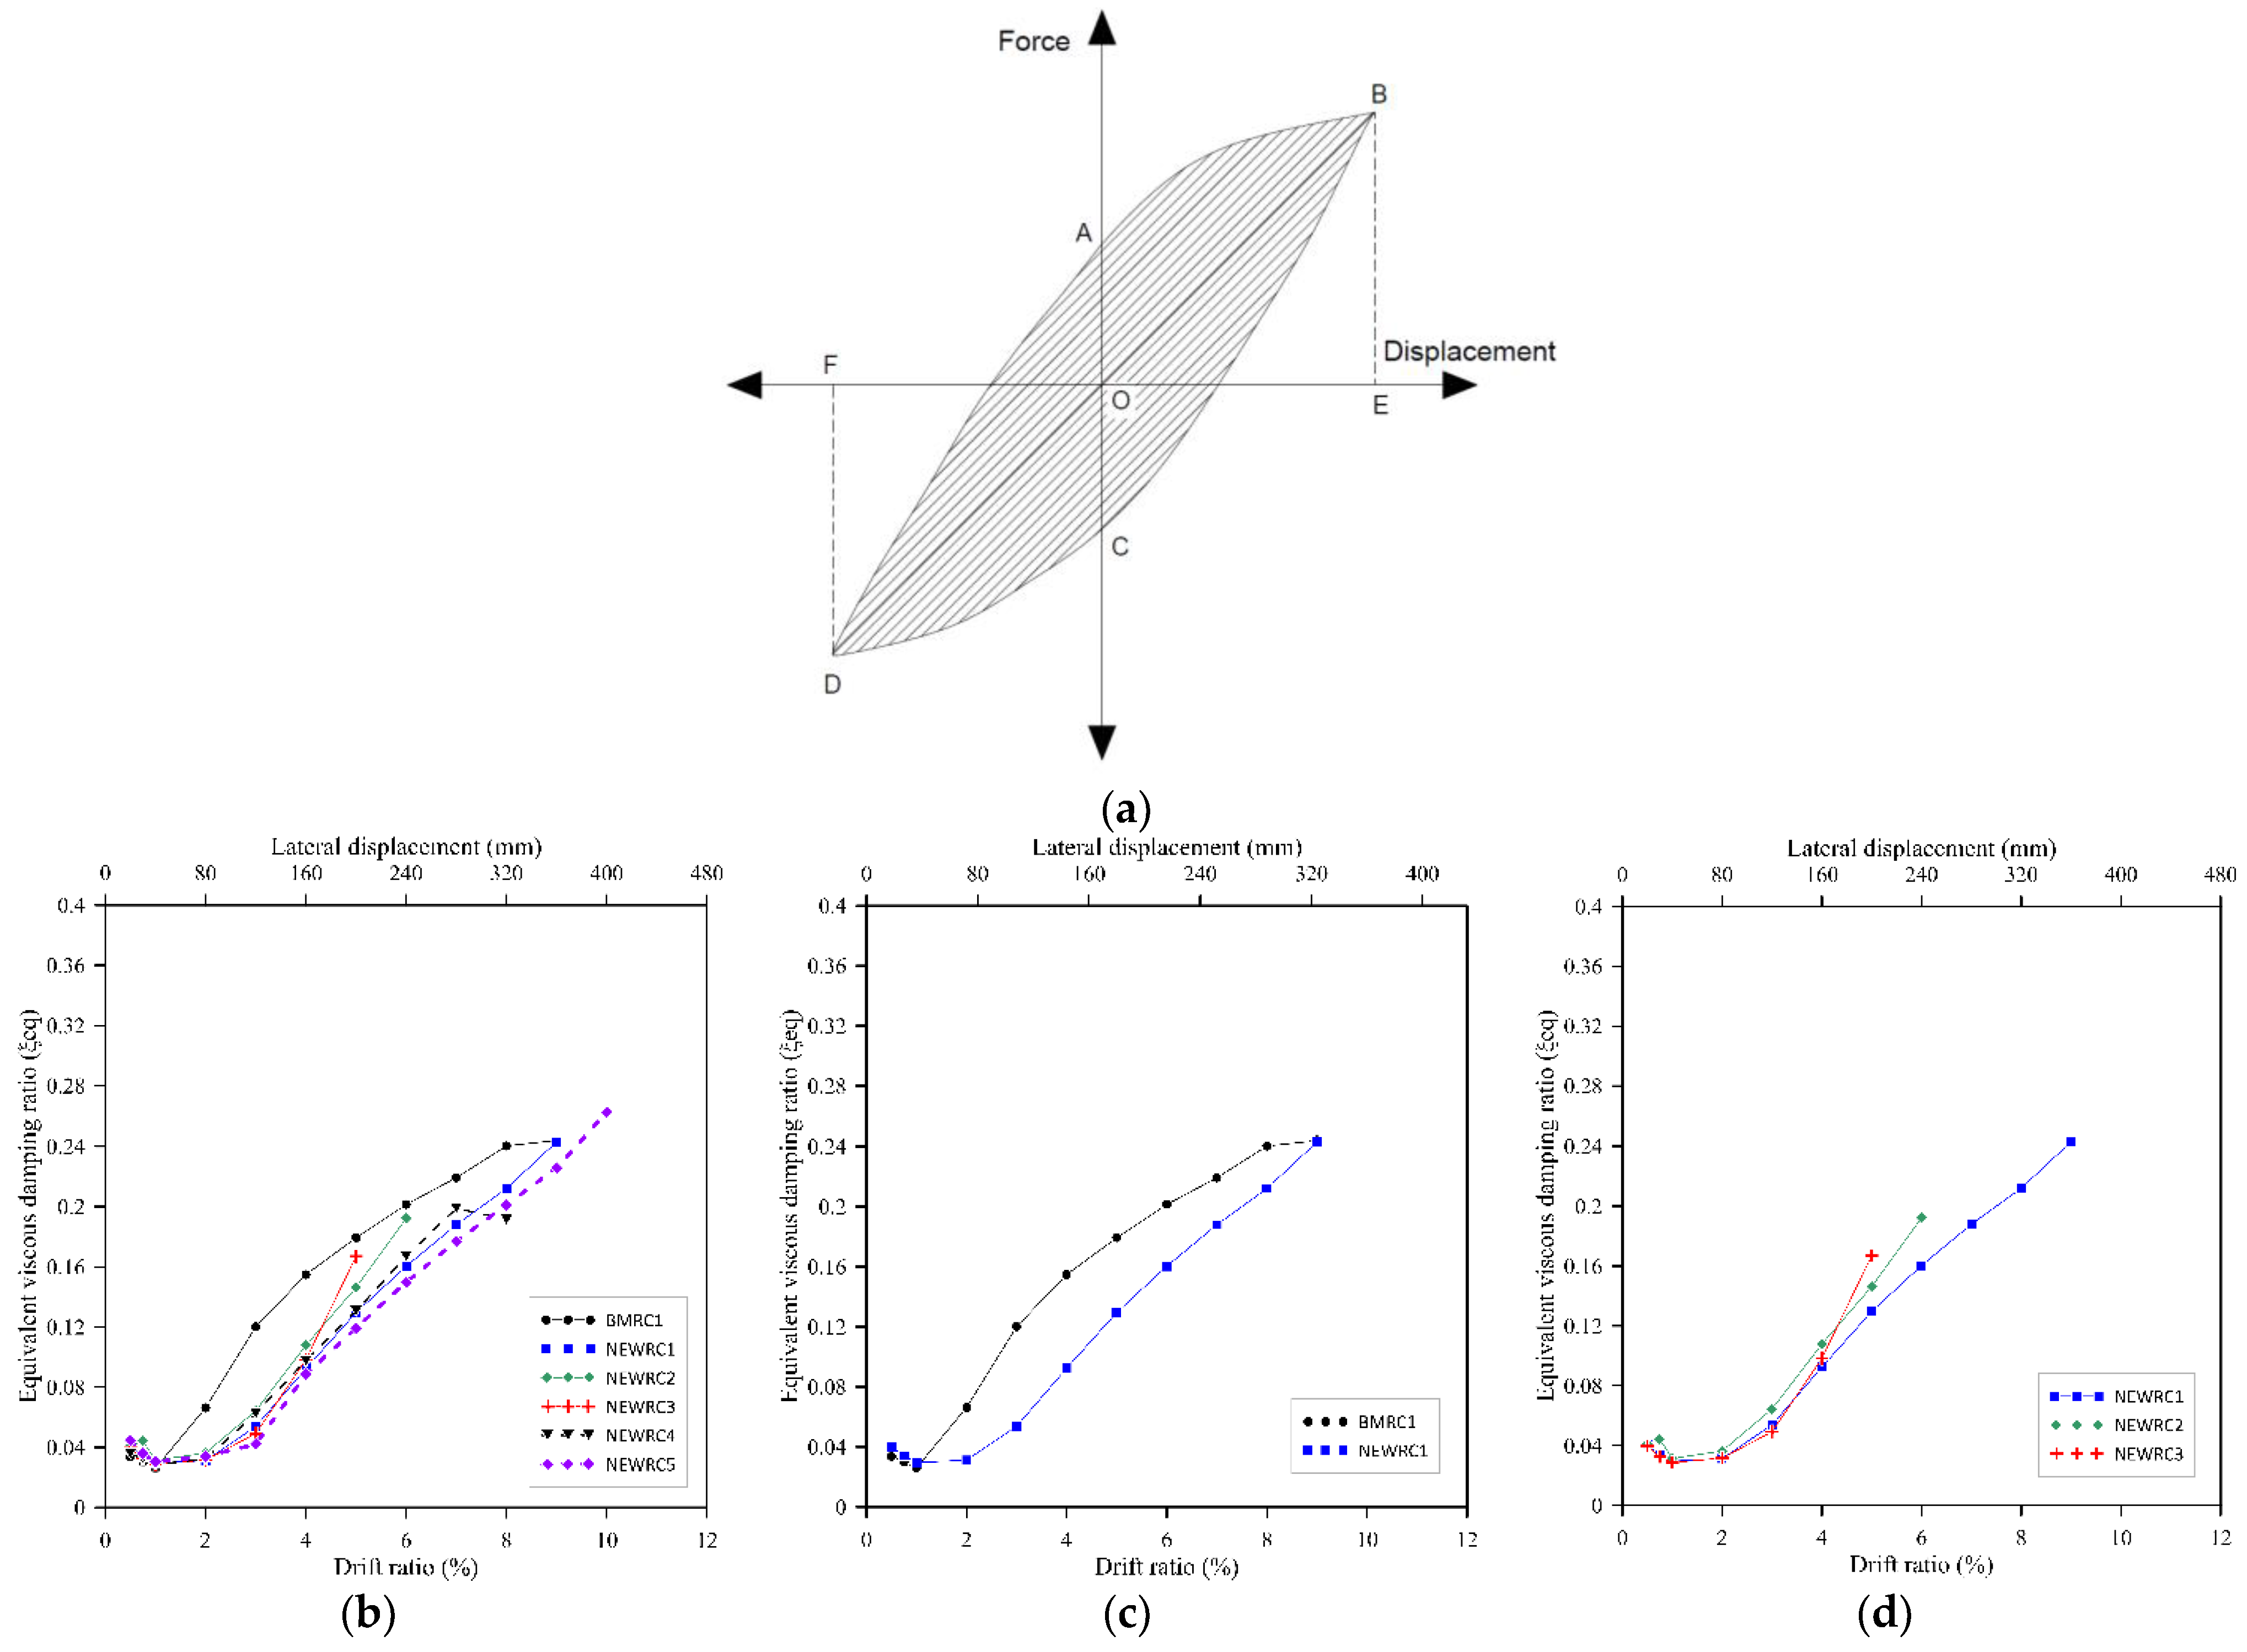
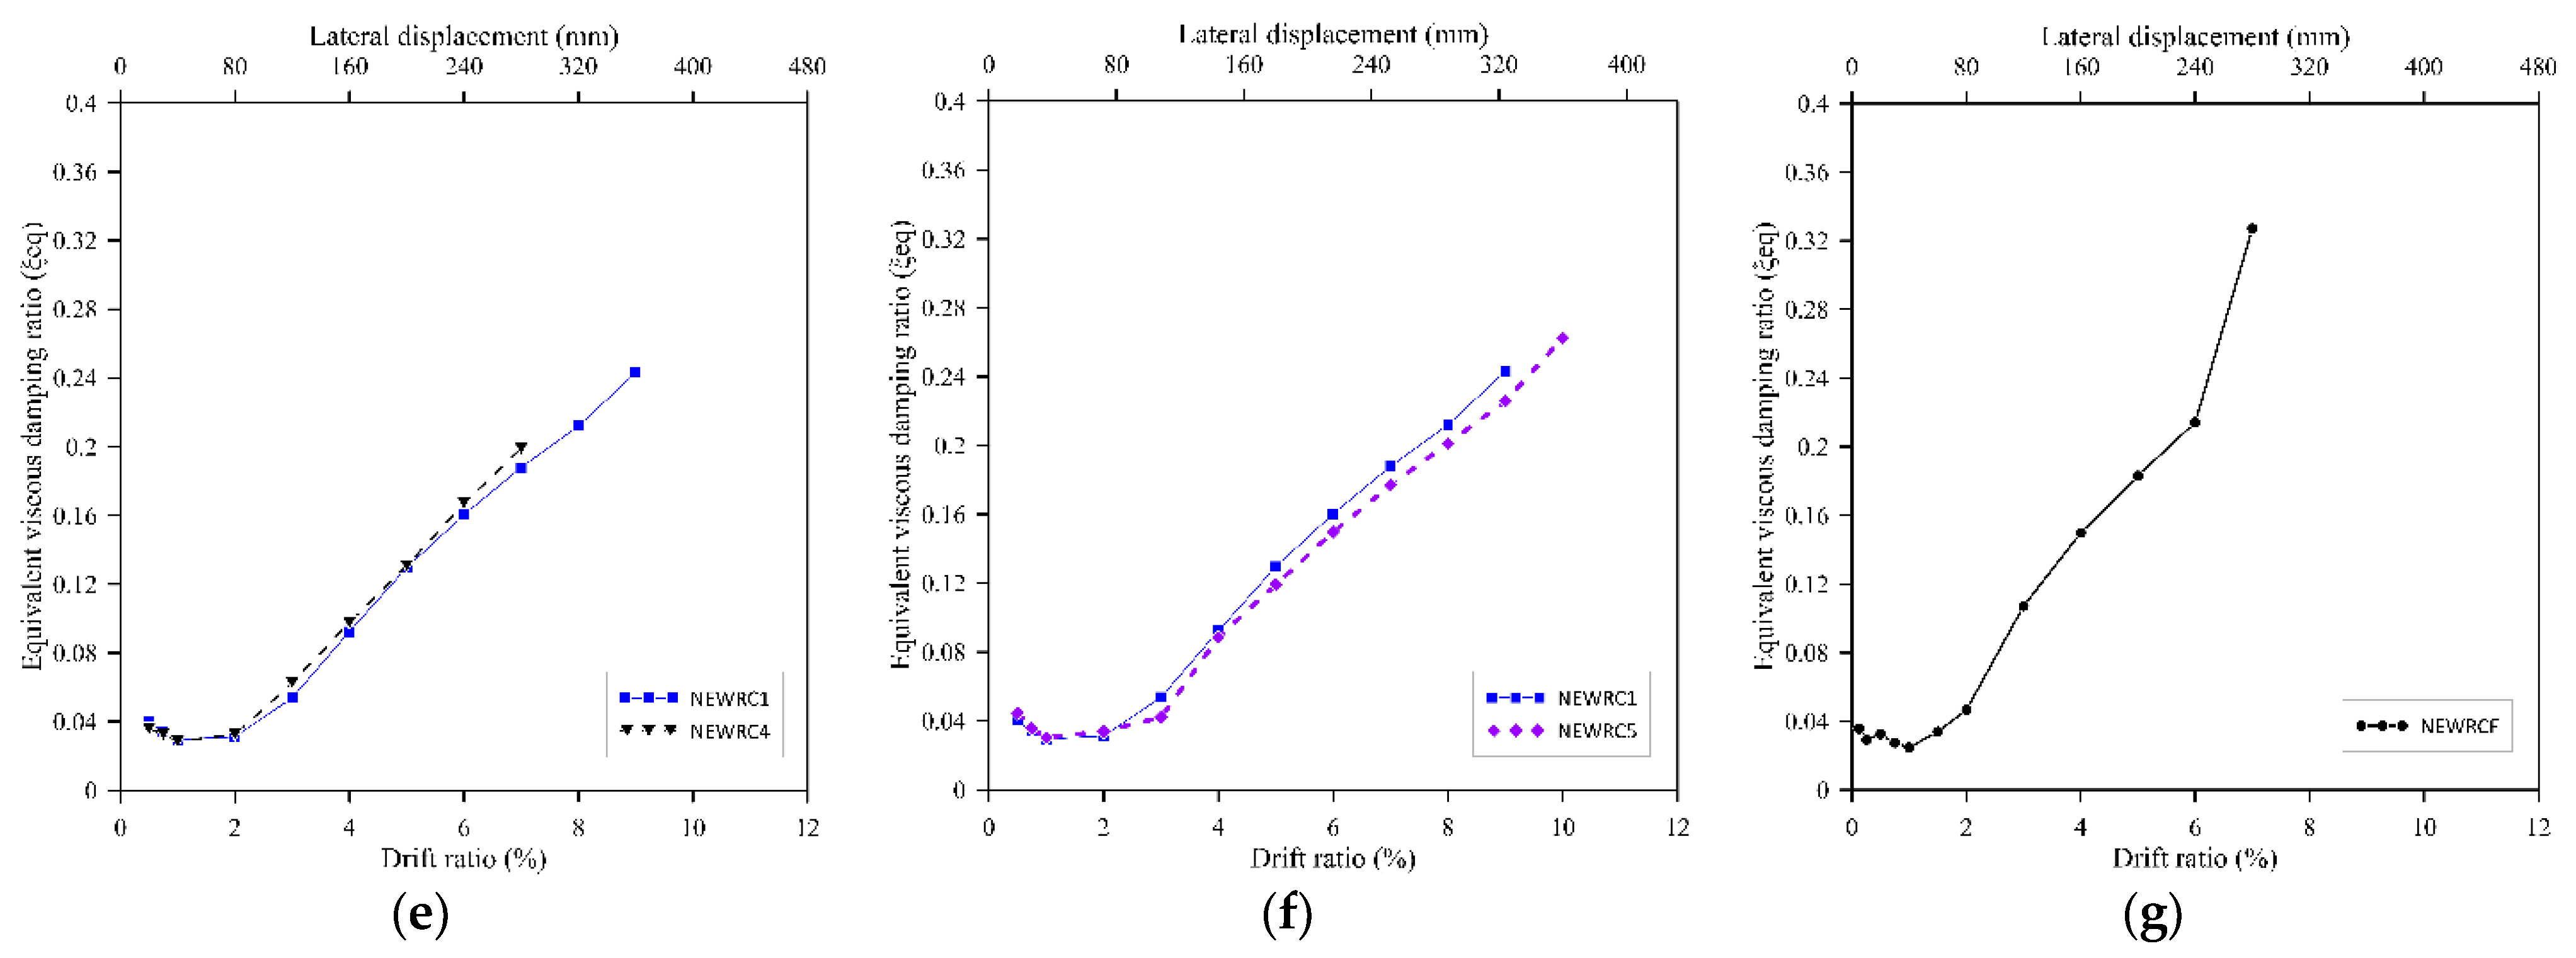
3.7. Equivalent Viscous Damping Ratio (ξeq)

An equivalent viscous damping ratio was calculated to quantify further and understand the energy dissipation of the NEWRC bridge column and frame. It is estimated that in a typical RC structure, the elastic damping ratio ξ eq accounts for around 5% of the critical damping. In the present study, the equivalent viscous damping ratio ξ eq was calculated using the method provided in [38]:
ξ eq = 1 2 π S A B C + S C D A S O F D + S O B E
In Equation (4), S A B C and S C D A represent the areas enclosed by the shaded hysteresis loop, and S O F D + S O B E is the energy stored in the triangle, as shown in Figure 13. In general, each test specimen’s equivalent viscous damping ratio increases gradually as the displacement increases. Furthermore, in Figure 13, from comparing the equivalent viscous damping ratio for all the column specimens, it is clear that BMRC1 has a higher ξ eq .   Compared to other NEWRC columns. In Figure 13, the equivalent viscous damping ratio for BMRC1 and NEWRC1 is compared, which shows that, before the yielding stage, both specimens have similar ξ eq . However, after the yielding stage, they follow a different pattern since the ξ eq for BMRC1 is significantly higher than that of NEWRC1. The results suggest that material properties had an apparent influence on the energy dissipation capacity of the columns.
In Figure 13, energy dissipation between NEWRC1, NEWRC2, and NEWRC3 is compared with each other. It is seen that, before the 4% drift ratio, the ξ eq for all the specimens are similar. However, after the 4% drift ratio, the ξ eq for NEWRC1 is slightly lower than that of the other two specimens. It might be because of the strength degradation after longitudinal rebar buckling. Additionally, in Figure 13, the ξ eq for NEWRC4 is compared with NEWRC1. From the results, it is evident that an increase in axial load ratio had only a minor influence on the equivalent viscous damping ratio of the columns. Furthermore, in Figure 13, the ξ eq for NEWRC5 is compared with NEWRC1; at every drift ratio, the ξ eq for NEWRC5 is slightly lower than that of NEWRC1. Hence, the replacement of transverse reinforcement strength had only a minor impact on the equivalent viscous damping ratio of the columns. On the other hand, Figure 13 also shows the equivalent viscous damping ratio for NEWRCF. It can be observed that the equivalent viscous damping ratio of the frame increased steadily with the increase in drift ratio. Hence, it can be concluded that the equivalent viscous damping ratio capacity of the NEWRCF is satisfactory. Therefore, it is evident that the spacing of transverse reinforcement must be controlled strictly in the seismic design of high-strength bridge columns.

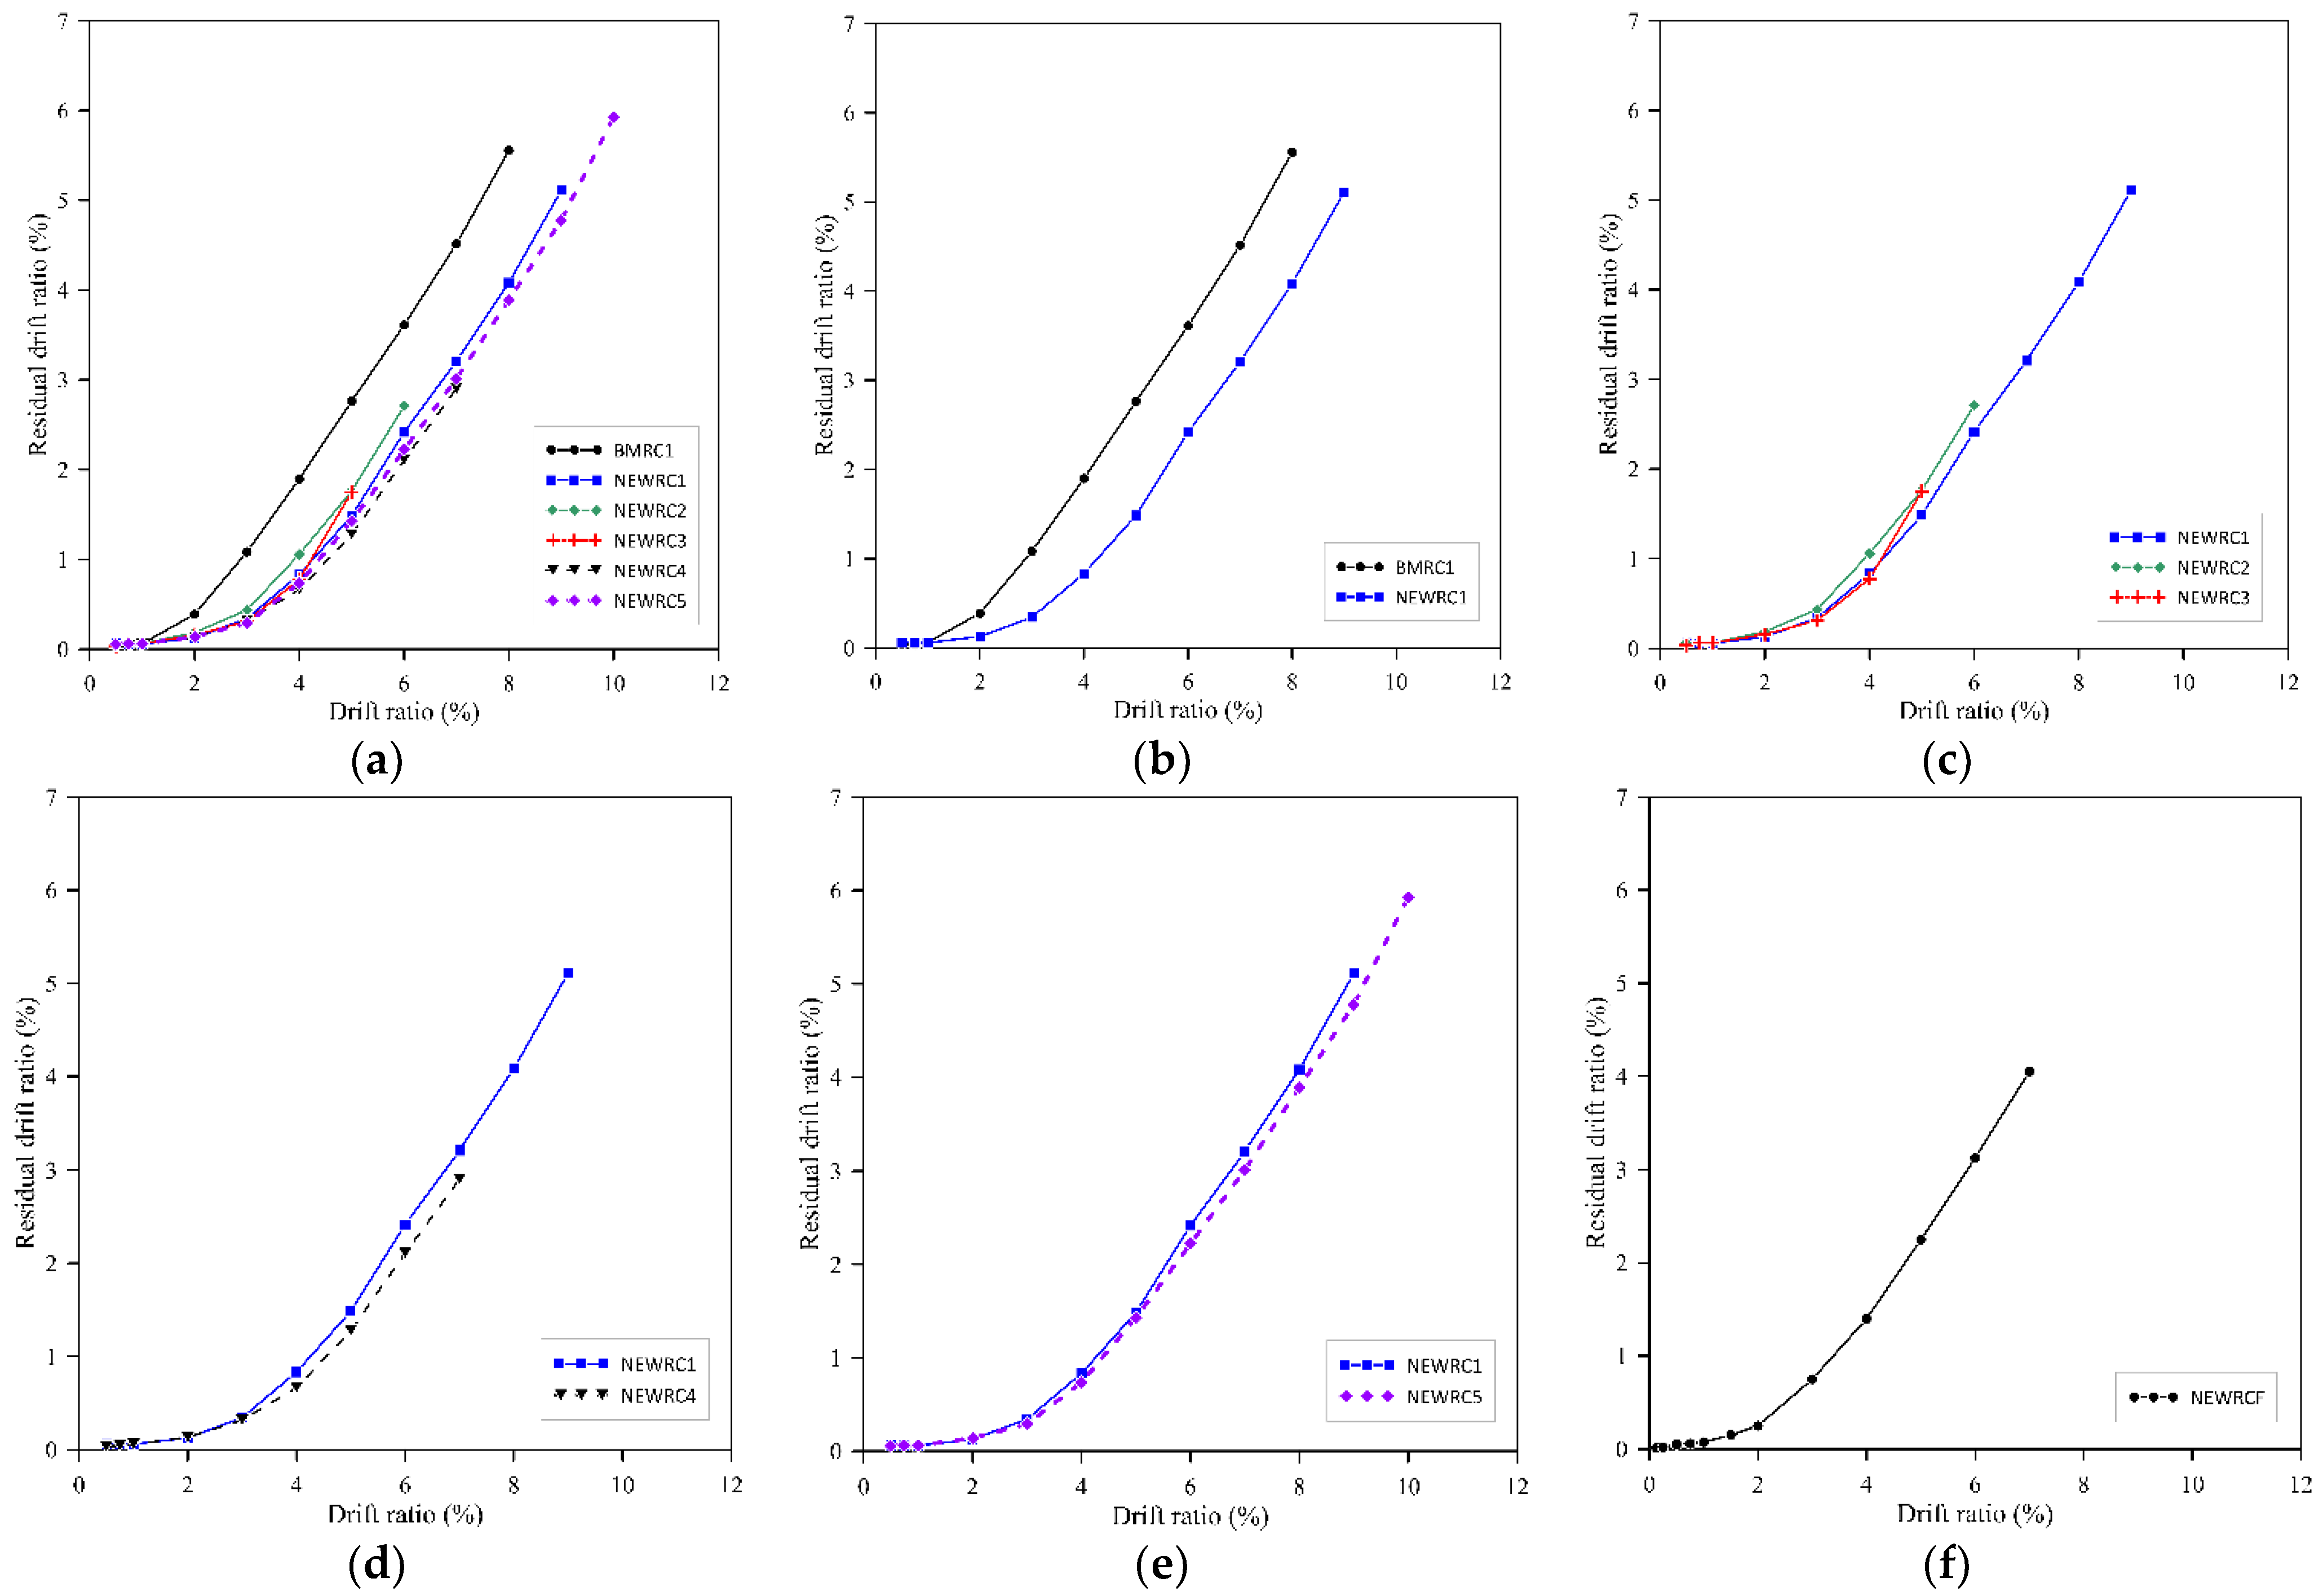
3.8. Residual Drift Ratio

The residual drift ratio D r at each drift ratio level can be calculated by Equation (5):
D r = D r + + D r 2
where D r + and D r are the positive and negative drift ratios when the lateral load in the first cycle of each drift ratio level is 0. In Figure 14, the relationship between the residual drift ratios and drift levels for all the specimens is presented. In general, when the drift ratio was less than 1%, all the specimens’ residual drift ratio was relatively small and similar. This could be because all the specimens were in the elastic stage at that moment. Therefore, the specimens could return to their original position when the load was removed. At a larger drift ratio of 4%, all the NEWRC columns had a residual drift ratio lower than 1%, which indicates that the self-centering capacity of the NEWRC columns is better than BMRC1.
In Figure 14, the residual drift ratio of BMRC1 and NEWRC1 is compared. It is evident that after a 1.5% drift ratio, the residual drift ratio of BMRC1 is significantly higher than NEWRC1. The residual drift ratios of NEWRC1 at 4% and 8% drift ratio is 56.2% and 26.5% smaller than that of the specimen BMRC1. Hence, it can be concluded that the material strength has an apparent impact on the residual drift ratio. On the other hand, the transverse reinforcement spacing had no apparent influence on the residual drift ratio, as the residual drift ratio curve for NEWRC1, NEWRC2, and NEWRC3 were similar, as shown in Figure 14.
Further, in Figure 14, the residual drift ratio between NEWRC1 is compared with NEWRC4 and NEWRC5. From the comparison made, it can be observed that NEWRC4 has a slightly lower residual drift ratio than NEWRC1. Hence, it can be concluded that an increase in the axial load ratio reduces the residual drift ratio by a small margin. In the case of NEWRC5, until the 5% drift ratio, the residual drift capacity of NEWRC5 and NEWRC1 is similar. However, after that, NEWRC1 has a slightly higher residual drift ratio than NEWRC5.
In Figure 14, also the residual drift ratio of NEWRCF is shown. At a larger drift ratio of 3.5%, the residual drift ratio of NEWRCF is smaller than the repairable limit of 1%, as specified by [36]. Hence, it can be concluded that NEWRCF exhibits excellent residual drift capacity even at a higher drift ratio.

3.9. Minimum Transverse Reinforcement

According to ACI 318-19 [19], in order to successfully distribute the internal forces, the amount of confinement should be greater than that of Equations (6) and (7). Here, the confinement provision does not consider axial compression. However, it does consider the effects of the compressive strength of concrete f c and the yield strength of the transverse reinforcement ( f y t ) . In this research, NEWRC1 and NEWRC5 had the same configuration except for the yield strength of the transverse reinforcements ( f y t ) . In NEWRC1, it was 813 MPa, whereas, for NEWRC5, it was 341 MPa. Therefore, according to Equations (6) and (7), the minimum transverse reinforcement required would be different for NEWRC1 and NEWRC5 when considering the reinforcements’ yield strength. Despite this, the same amount of transverse reinforcement was provided.
A v , minACI = 0.062   f c b w s f yt   0.35 b w s f yt   MPa
ρ t , minACI = A v , minACI b w s = 0.062 f c f yt   0.35 f yt   MPa
In Figure 15, the backbone curve, cumulative energy dissipation, and equivalent viscous damping ratio between NEWRC1 and NEWRC5 are shown. In Figure 15, the backbone curve for both the specimens is compared. It was seen that they had similar initial stiffness, elastic-plastic stage, and failure process. The specimens recorded a similar peak load, as only a minor difference of 1.5% was observed between them. Further, in Figure 15, the cumulative energy dissipated by both the specimens is shown. It can be observed that at every drift ratio, both dissipated similar energy. The ductility ratio for NEWRC1 was 5.49, whereas for NEWRC5, it was 5.81, i.e., almost a 6% increase. Both specimens also had similar residual drift ratios, as they recorded a residual drift ratio of less than 1% at even a larger drift ratio of 4%. Therefore, the comparison shows that even though a less amount of transverse reinforcement was provided in NEWRC5 than required by ACI 318-19 [19], it did not impact its seismic performance, as the seismic performance between NEWRC1 and NEWRC5 was similar.

4. Numerical Simulation

4.1. Model Development

OpenSees is one of the most popular object-oriented software frameworks for simulations. Hence, it was used to develop the numerical simulation model for the high-strength bridge columns subjected to quasi-static cyclic loading. Numerical models that can predict the behaviors of the structures in the elastic range, inelastic range, and post-failure range are necessary to assess the structures. Since the experimental tests comprising HSC and HSR are comparatively more expensive than the conventional RC, it is essential to develop numerical models that can reasonably predict the behavior of high-strength bridge columns under various configurations. Over the years, researchers have developed many numerical prediction models for bridge columns [39,40]. However, each of these models is calibrated from different test data and often leads to different damage parameters, making them impractical for general use. Therefore, in this study, a computationally efficient FE model for predicting the seismic performance of high-strength bridge columns was developed. The proposed numerical model only requires the material and geometric properties of the columns as input parameters for predicting the load-deflection relationships under quasi-static cyclic loading. The modeling details (material, elements, loading, etc.) are provided in the following subsections.

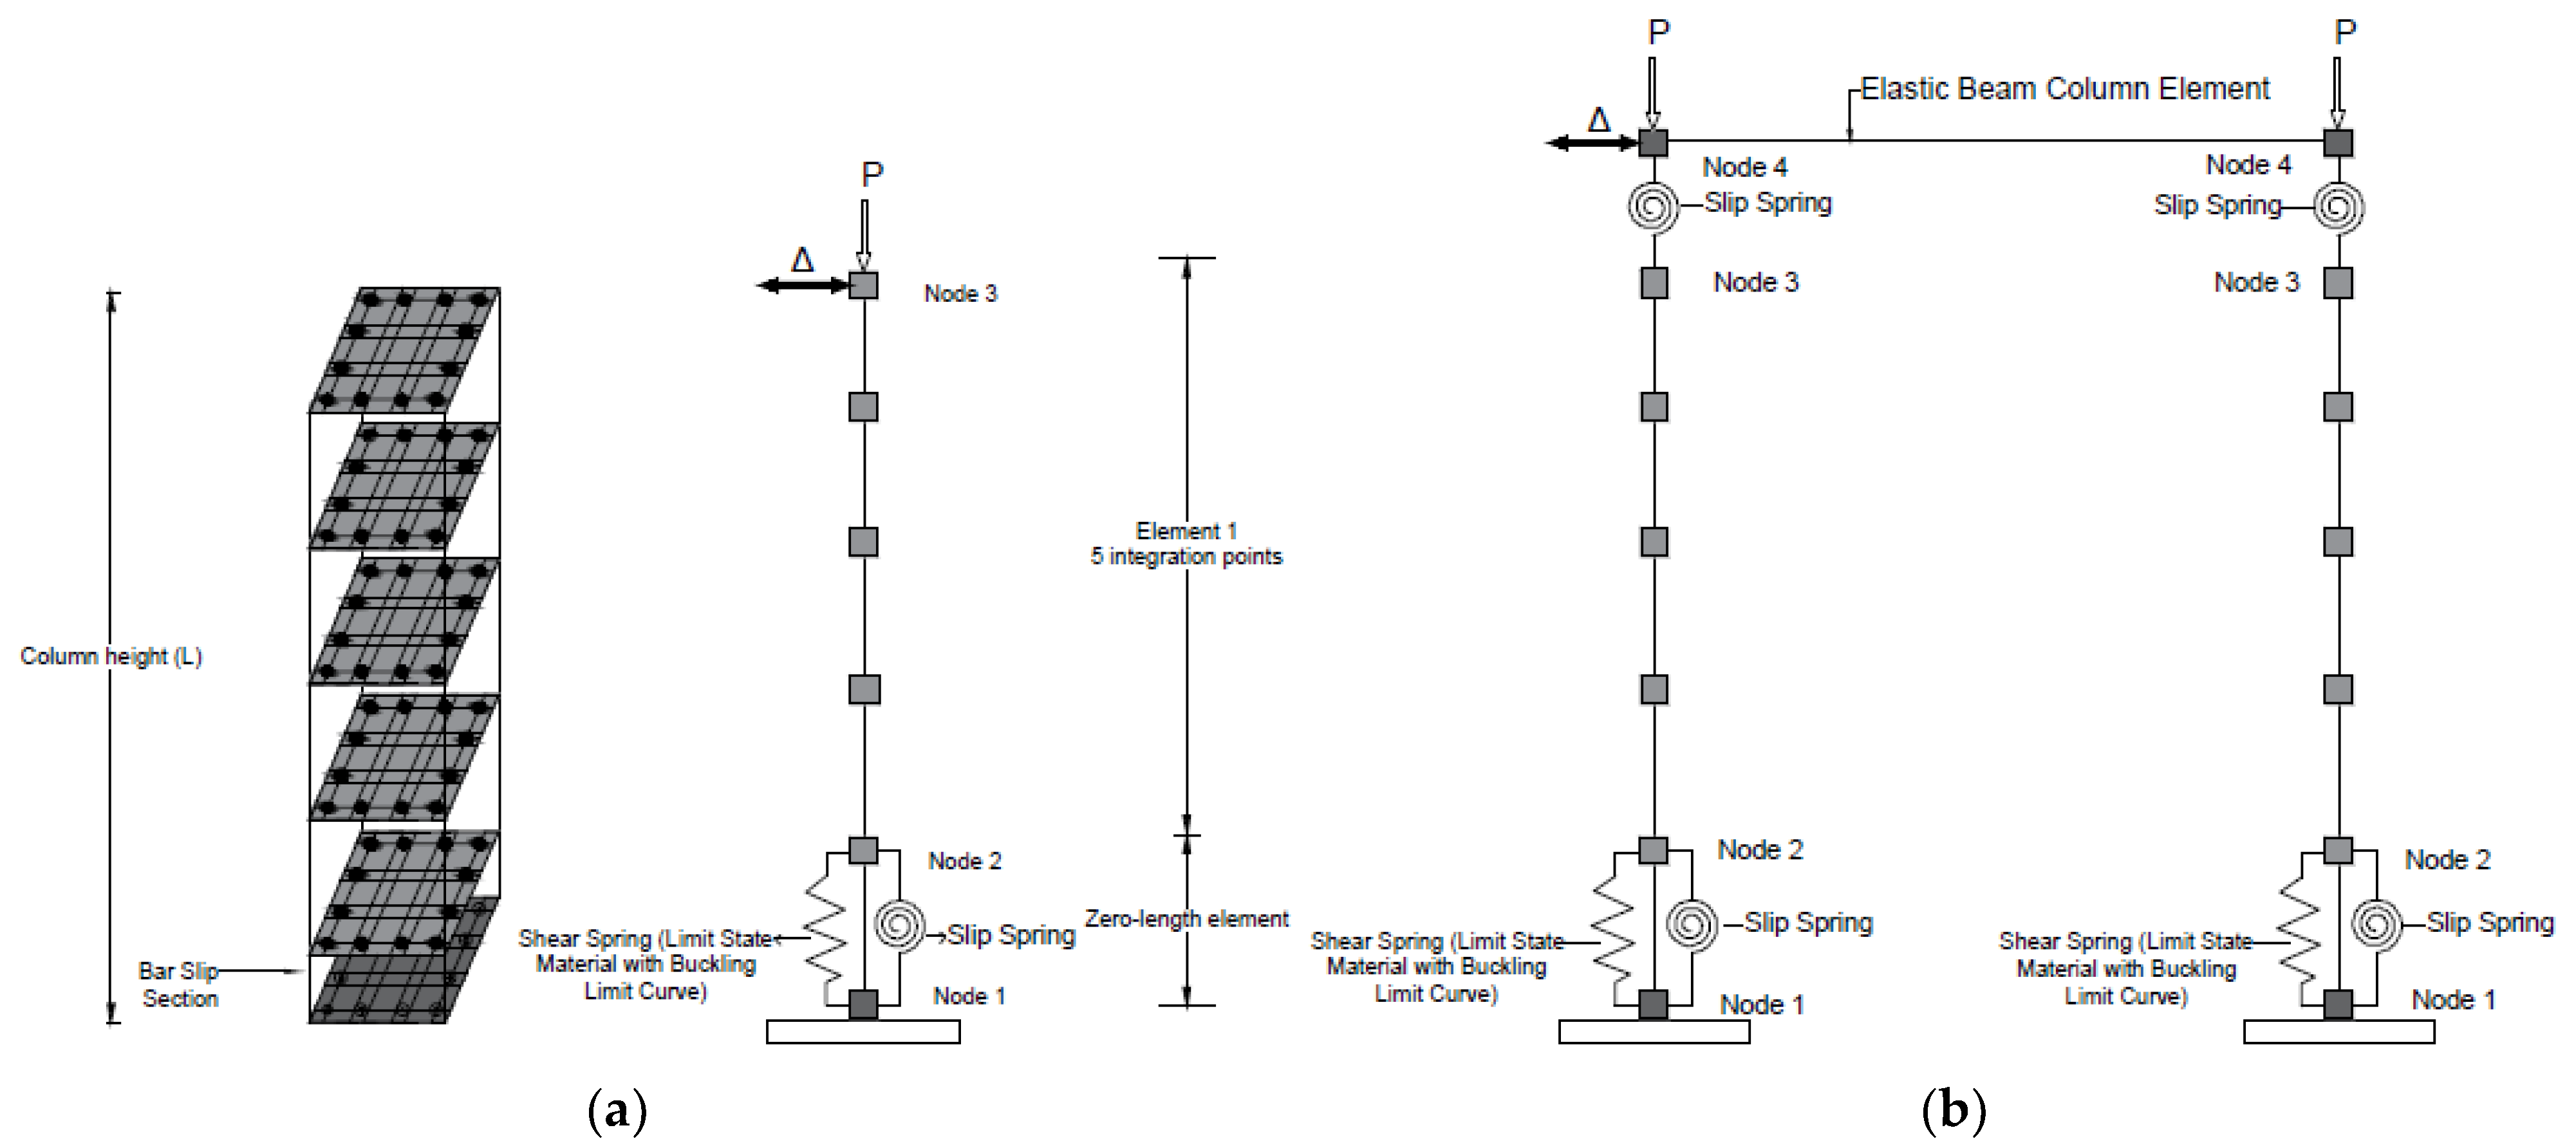
4.1.1. OpenSees Simulation Model

The numerical model used for high-strength bridge columns is shown in Figure 16. All degrees of freedom at the supported end were fixed, while those at the loaded end were left free to replicate the experimental conditions. Force-based fiber beam-column elements with five integration points were used to model the column element, as it considers the nonlinear deformation of the structural members and allows for plasticity along the length of the element. OpenSees employs the fiber-element technique for the modeling of RC structural members. The member cross-section is represented by steel and concrete fibers that are defined as their uniaxial constitutive material models. The “Concrete04,” a uniaxial concrete material, was used to model the confined concrete behavior in the core concrete and the unconfined concrete behavior in the cover concrete. Each parameter of the unconfined concrete was obtained from the tests of the actual concrete specimens, while those of the confined concrete were calibrated using XTRACT [41] and NewRC-Mocur2020 [42], considering the influence of hoops and ties.
Similarly, the “Hysteretic” material model in OpenSees, a uniaxial bilinear hysteretic material object with a pinching effect, was used to model the longitudinal rebar. The post-yielding ratio was in the range of 0.5 to 2.5% of Young’s modulus of steel. The pinching factor for strain or deformation during reloading (pinch-X) and the pinching factor for stress or force during reloading (pinch-Y) were set as 0.4 and 0.6, respectively [43].

4.1.2. Rotational Slip Spring

A slip spring was used to simulate the rigid body rotation caused by the strain penetration (i.e., bond-slip between the concrete and longitudinal rebars). Due to the high degree of nonlinearity in the proposed model, the bond-slip was set at an elastic level to conserve the model’s unpredictability. The rotational stiffness of the slip spring K s l i p recommended by Elwood and Eberhard [44] was used. It can be calculated using Equation (8).
K s l i p = 8 u d b f y M y ϕ y
where d b is the nominal diameter of the longitudinal reinforcement, f y is the yield stress of the longitudinal reinforcement, M y is the effective yield moment, ϕ y is the effective yield curvature, and u is the uniform bond stress along the embedded length. The yield moment and curvature were calculated from the cross-sectional analysis using NewRC-Mocur2020 [42], an open-source program developed for performing the cross-sectional analysis of high-strength columns.

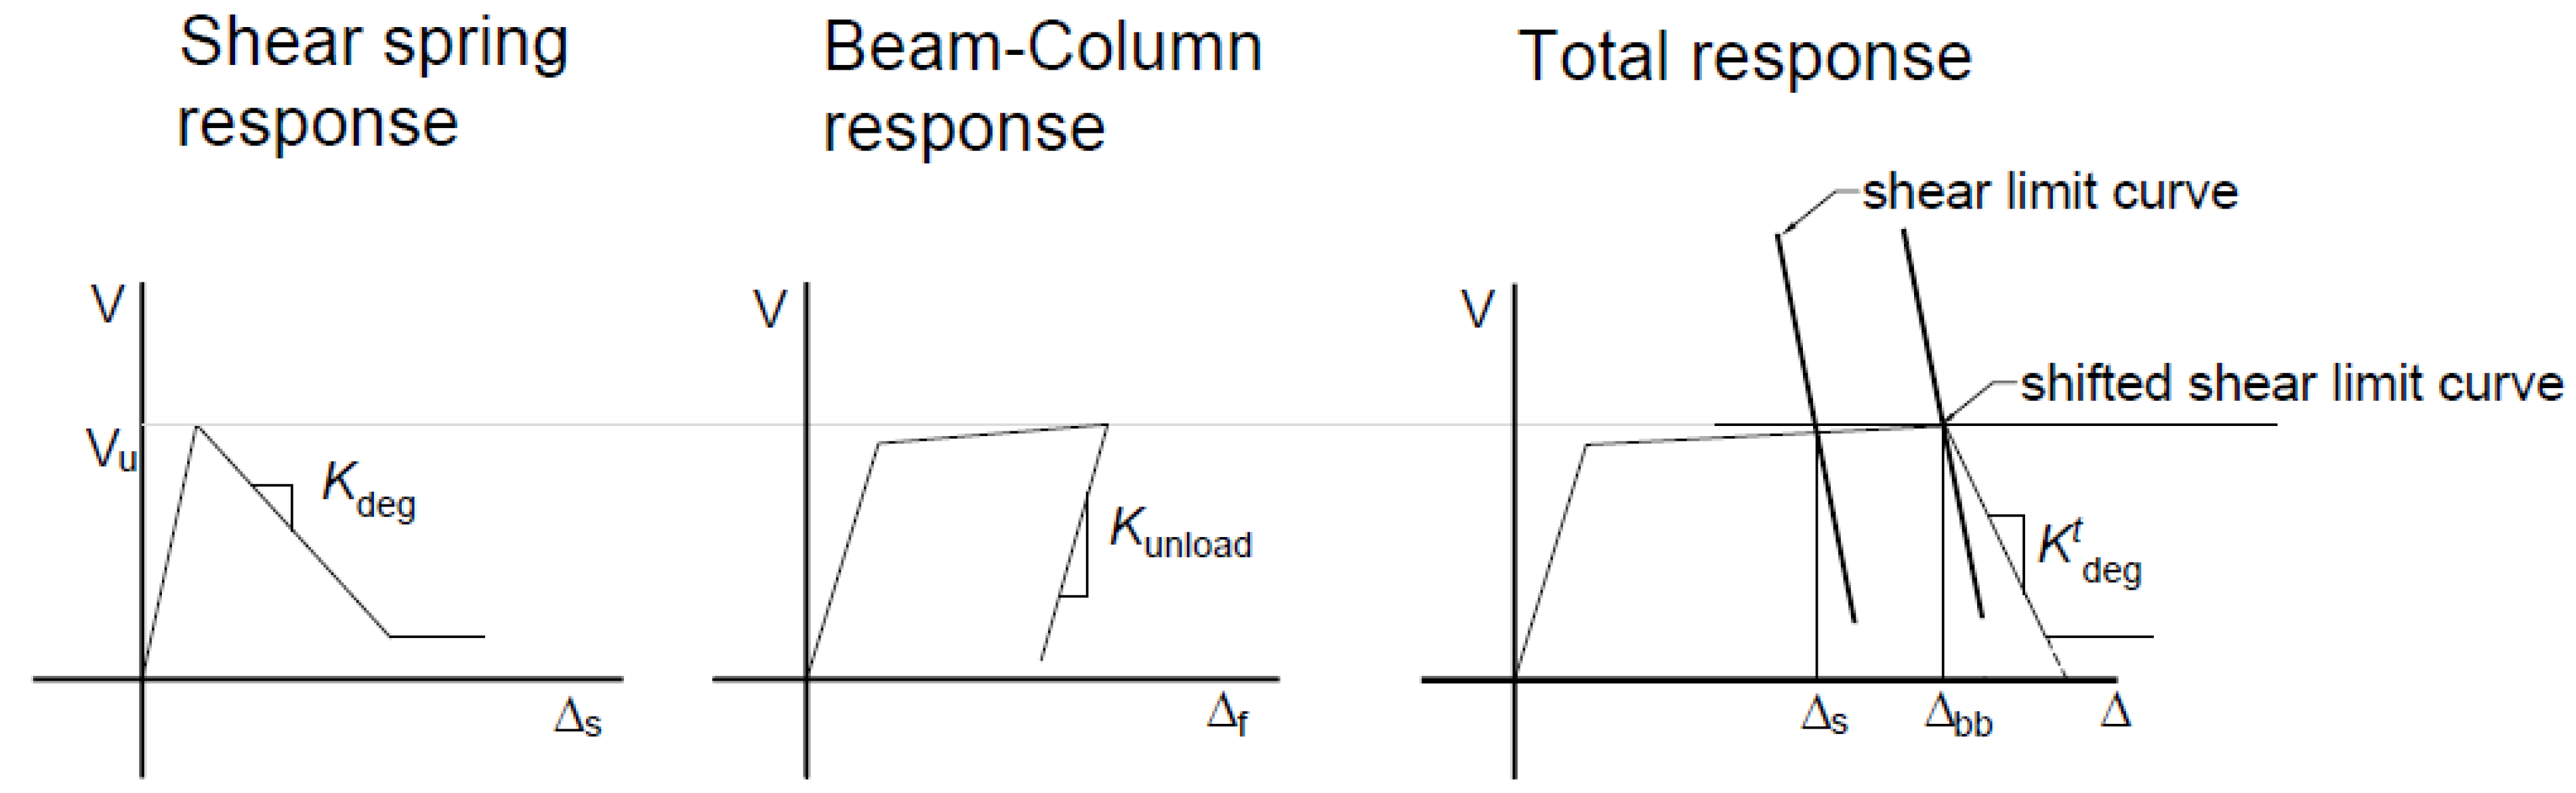
4.1.3. Buckling Shear Spring

The experimental results from this paper and the literature suggested that most of the high-strength columns failed due to excessive buckling of longitudinal rebar. Hence to simulate the behavior of the high-strength bridge column experiencing strength degradation due to the buckling, a shear spring with the shear limit state developed by Elwood [45] was used. However, to activate the shear spring at the buckling displacement, the method proposed by [43] was used in which the buckling point was shifted using the buckling limit equation proposed by Berry and Eberhard [37], as shown in Figure 17. The buckling shear spring represents the behavior of the NEWRC bridge columns after the longitudinal rebar buckling was detected. For all the cases, the nonphysical parameters on the spring, pinch-X, pinch-Y, damage1, damage2, and beta were set at 1.0, 1.0, 0.0, 0.0, and 0.4, respectively. The buckling limit point was calculated using Equation (2).
The degrading slope K d e g t of the total response can be estimated according to Equation (9). The degrading slope K d e g of the shear spring was taken as 0.5   K d e g t . Both the rotational spring and buckling shear springs were modeled as zero-length elements.
K d e g t = V u b b
In Figure 16, the numerical model adapted for the NEWRCF frame specimen is presented. It is similar to the NEWRC column model; the beam (pier cap) is defined as an elastic beam-column element, and the rotational slip spring is provided on the beam-column joints to capture the strain penetration due to bond-slip. The material models for concrete, steel, and zero-length elements remained unchanged throughout the analysis.

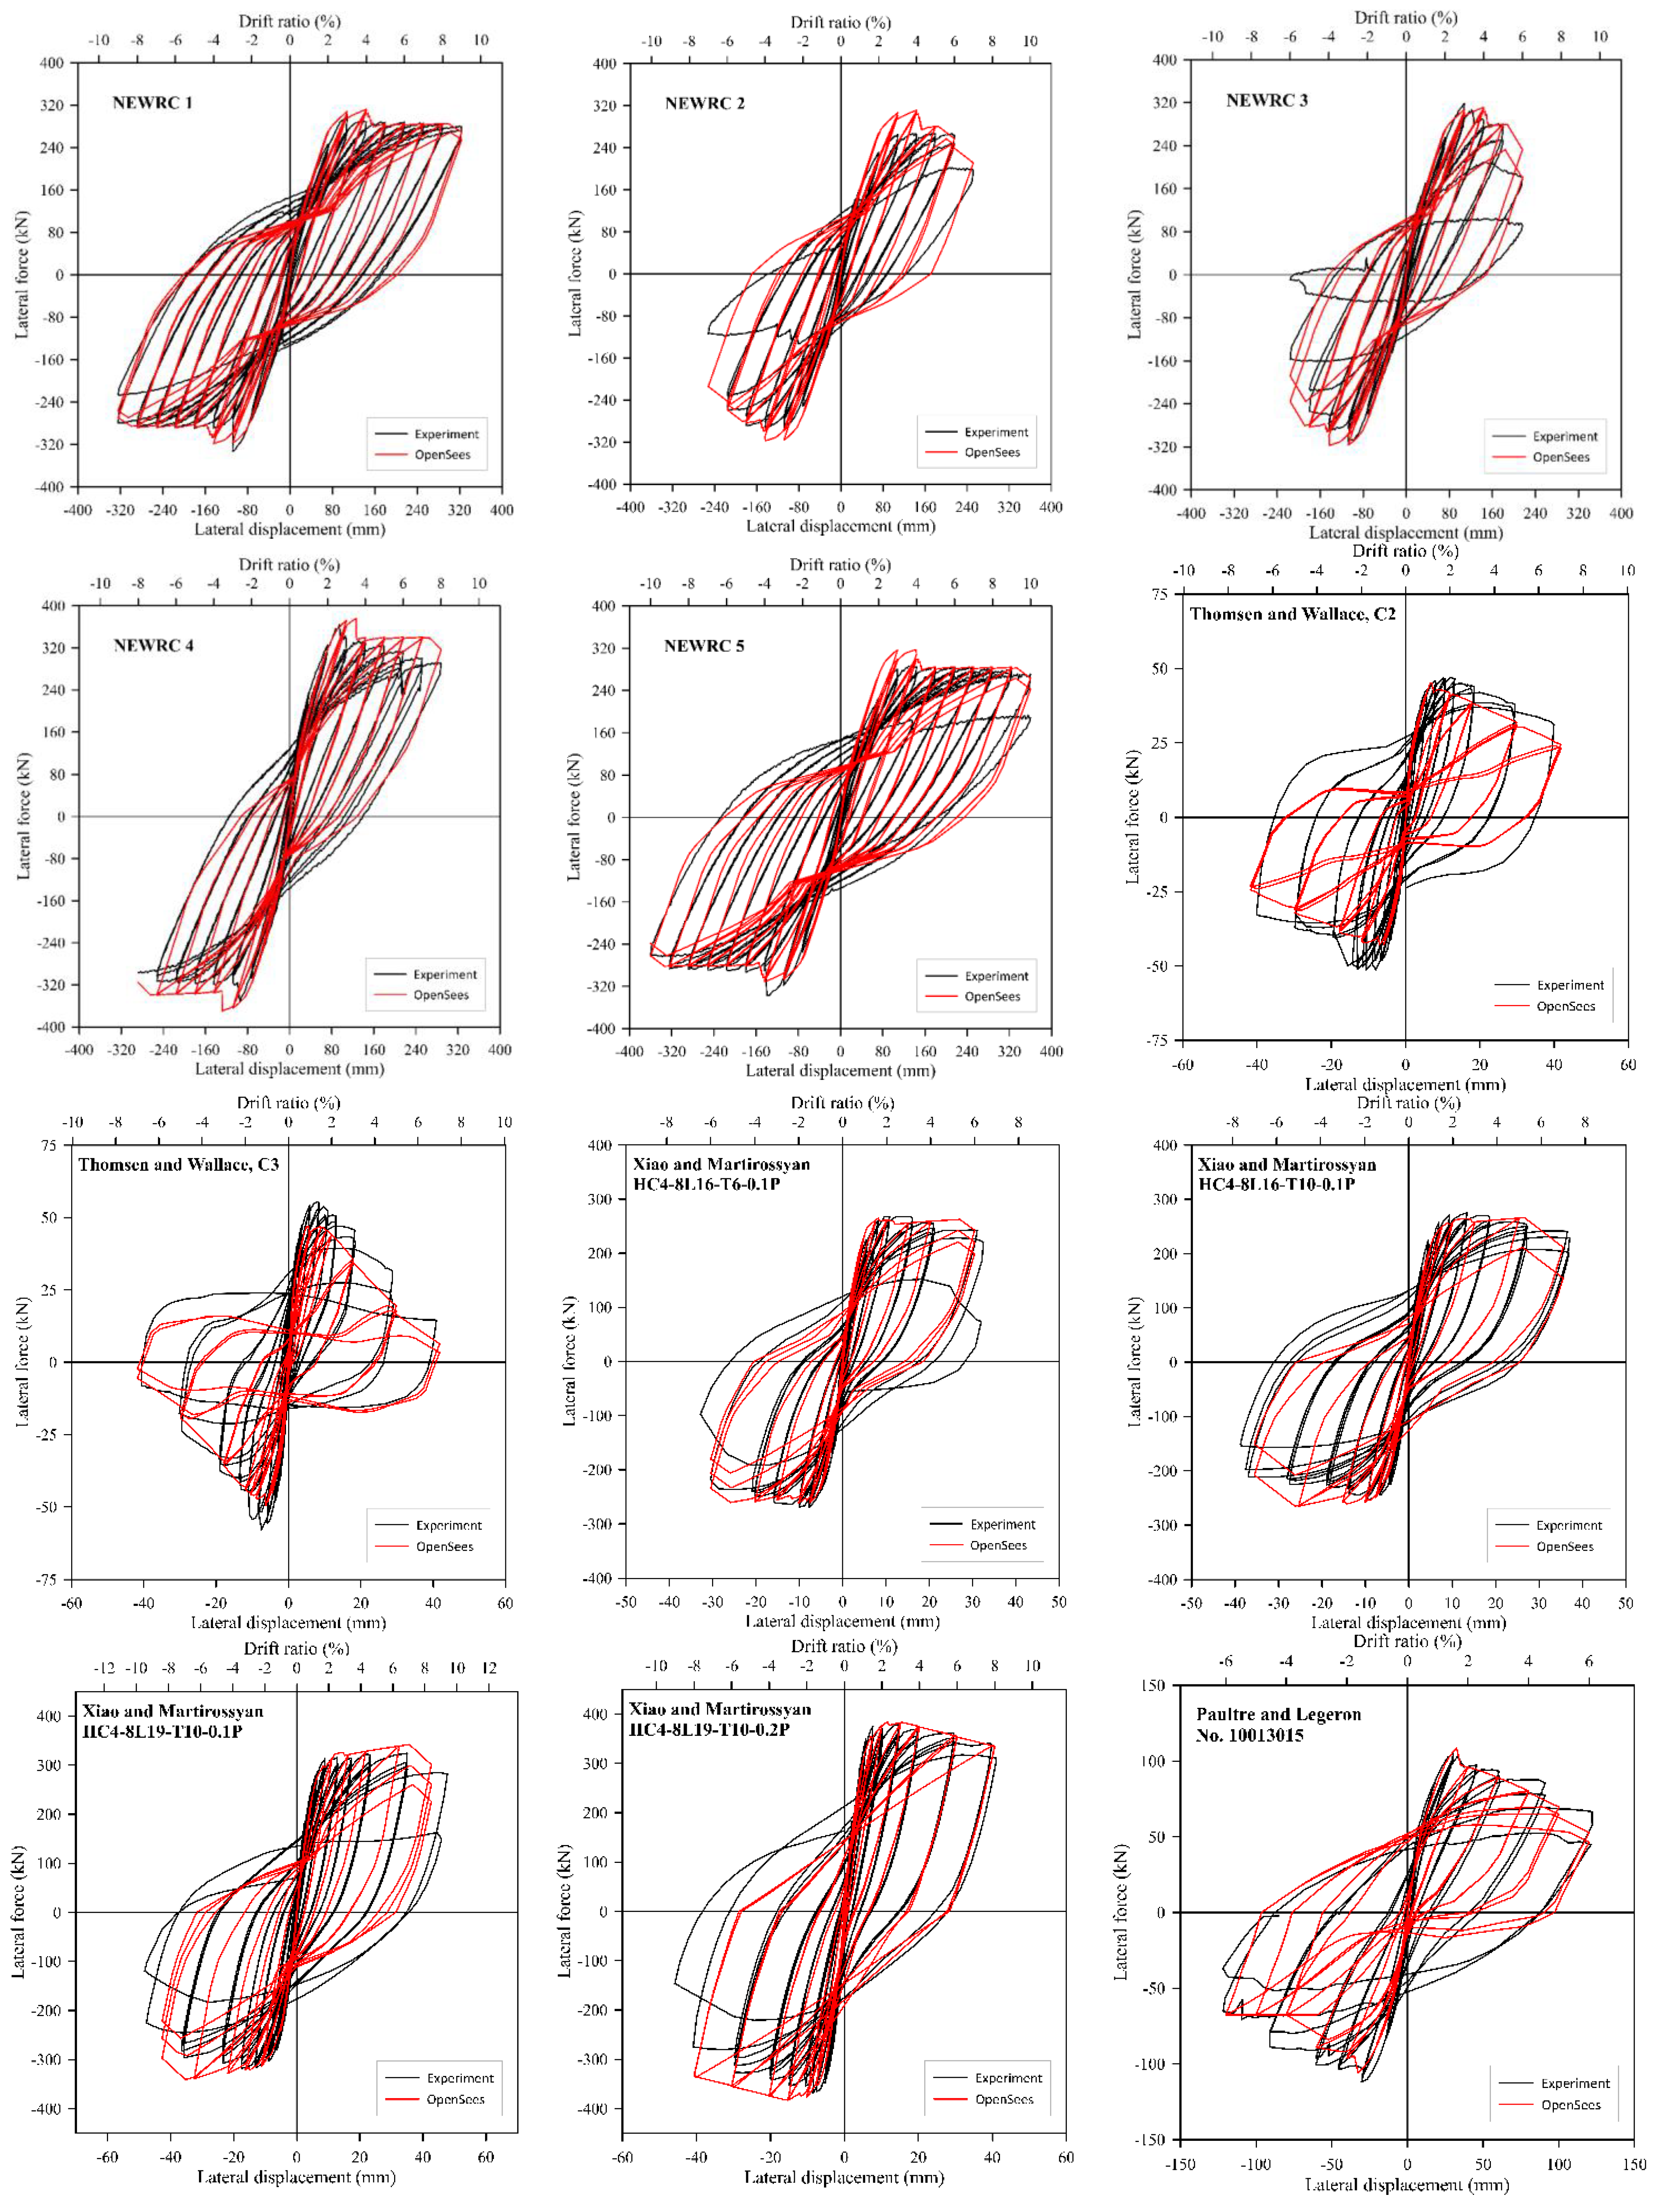
4.2. Numerical Results of NEWRC Columns

To validate the accuracy of the numerical model, the authors established a test database from the columns introduced in the experiment and literature [46,47,48]. The experimental data for the database was obtained from the Pacific Earthquake Engineering Research Center (PEER) and is presented in Table 4; it contains 12 high-strength columns (including five columns tested in this paper) with an axial load carrying capacity varying from 5 to 20%. The hysteretic-loop comparisons between the analytical model and experimental results are shown in Figure 18. The numerical model hysteretic curves were in good agreement with the experimental hysteretic curves, thus confirming that the model can simulate the influence of axial load ratio, transverse rebar spacing, and yield strength of transverse reinforcement very well. The results suggest that the numerical model accurately predicts initial stiffness, peak load, pinching behavior, and shear strength degradation due to the longitudinal rebar buckling. Comparing the results obtained from the numerical model, the difference in the peak load from the experimental results and the numerical model was 1.025. The specimens NEWRC2, NEWRC3, HC4-8L16-T6-0.1P, HC4-8L16-T10-0.1P, and HC4-8L19-T10-0.1P experienced substantial rebar buckling. This phenomenon was reflected well in the numerical model as the shear strength degradation due to longitudinal rebar buckling was predicted well, as shown in Figure 18.

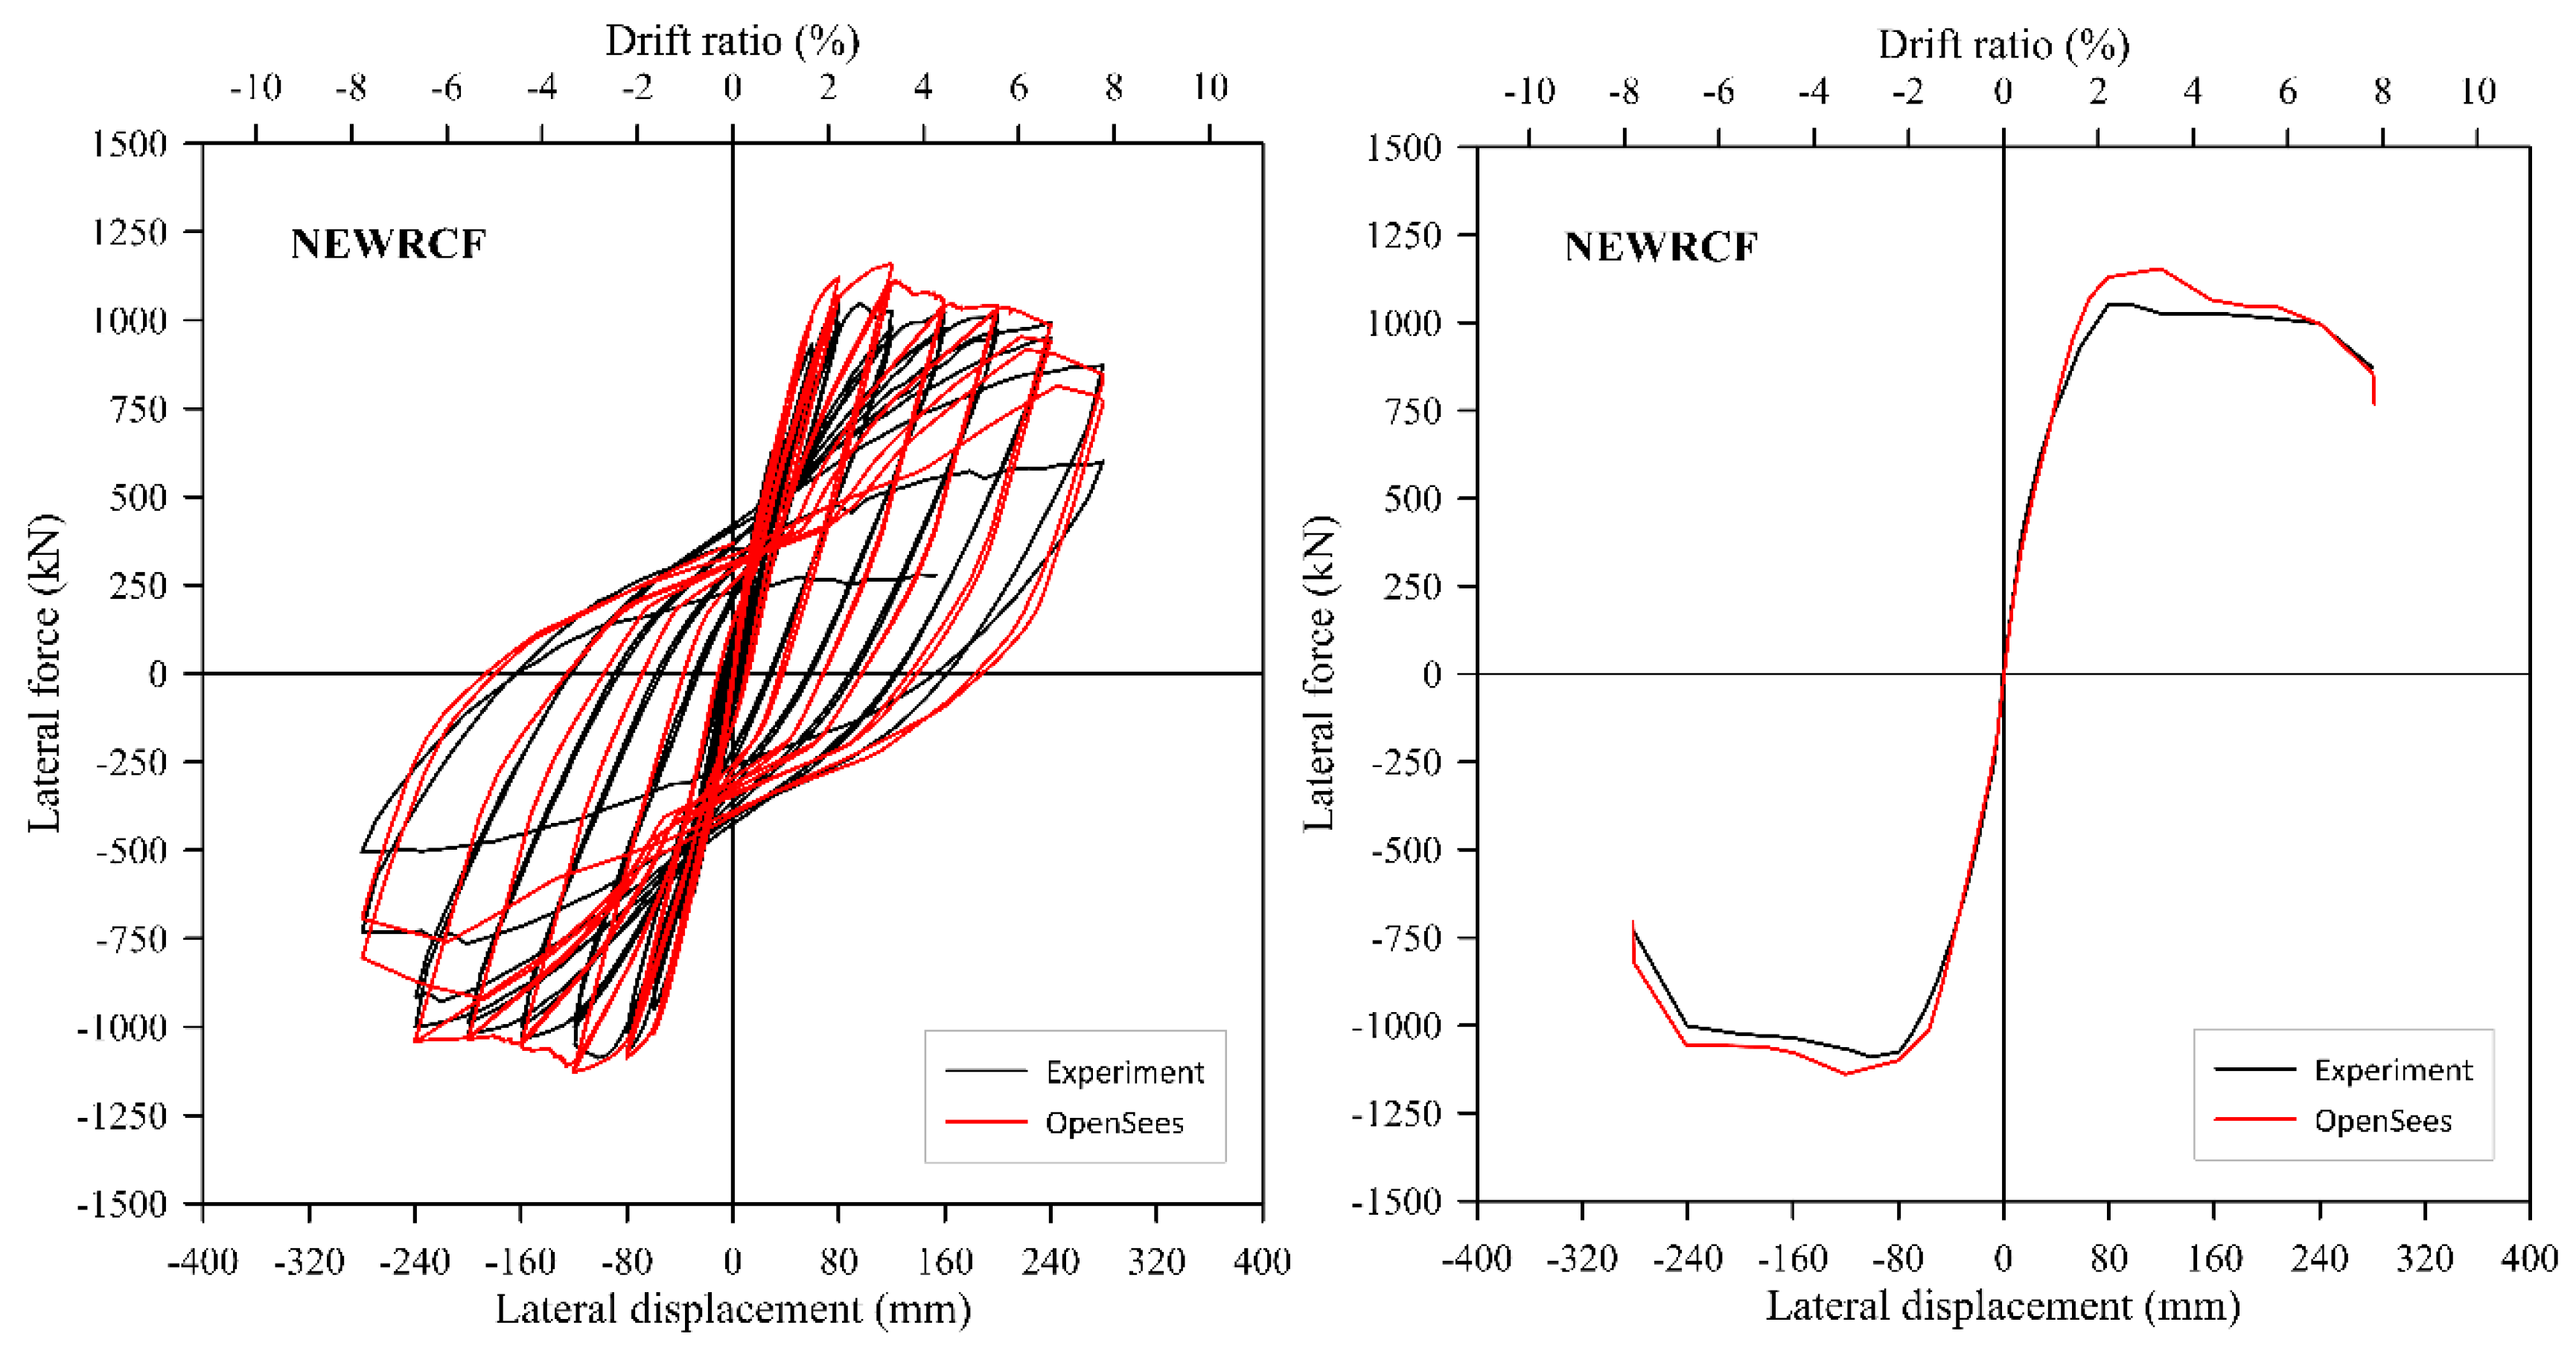
4.3. Verification of the Numerical Model Using NEWRCF

To further verify the reliability of the numerical model, the numerical model was applied to the specimen NEWRCF. Figure 19 shows the experimental hysteresis loop and backbone curve comparisons with that of the numerical model; it can be seen that the latter’s curves gave a close prediction of the experimental envelope curves. The ratio of the maximum force between the experimental results and the numerical model was 0.94. The drift at longitudinal rebar buckling from the experimental results was 5.98%, whereas, from the numerical model, it was 5.80%. The numerical model accurately predicted the initial stiffness, peak load, unloading stiffness, and pinching effect. The magnitude of the strength degradation was also predicted well, as it remained within the acceptable boundaries. Overall, the numerical model can accurately simulate the nonlinear response of high-strength columns and frame structures.

5. Conclusions

The study discussed an experimental investigation and numerical modeling of large-scale high-strength bridge columns. The test parameters were the material strength, axial load ratio, and spacing of transverse reinforcement. Based on the results of this experimental study and numerical modeling, the following conclusions are drawn:
  • The failure process of NEWRC columns was similar to that of the BMRC1 column and consisted of four stages: cracking, yield, ultimate, and failure. Longitudinal rebar buckling was identified as the contributing factor for all the column’s failure, and it was influenced by the spacing of the transverse reinforcement. NEWRC1 had a similar force-displacement relationship as BMRC1 despite a reduced cross-sectional area, longitudinal reinforcement area, and transverse reinforcement area.
  • In comparison among the NEWRC specimens, the ductility ratio of NEWRC1, NEWRC4, and NEWRC5 were higher than 5, thus satisfying the MOTC-2020 code requirement. On the other hand, for NEWRC2 and NEWRC3, it was lower than 5. The results suggested that transverse reinforcement’s spacing greatly influenced its ductility ratio and failure pattern, especially in the elastoplastic zone.
  • The energy dissipation capacity and equivalent viscous damping ratio of NEWRC columns are compared with BMRC1. Hence, the results suggested that using HSC and HSR can result in lower energy dissipation and equivalent viscous damping ratio compared to conventional RC columns. For NEWRC columns, within a certain range, a higher axial load ratio, such as in NEWRC4, resulted in an increased energy dissipation capacity.
  • NEWRC5 had a similar force-displacement, energy dissipation, viscous damping ratio, and residual drift ratio as NEWRC1. Hence, the replacement of HSR transverse reinforcement with NSR did not necessarily influence the column’s seismic performance under a low axial load. Therefore, the combination of NSR for transverse reinforcement and HSR for longitudinal reinforcement in bridge columns can be more economical.
  • The ACI 318-19 code equations for minimum transverse reinforcement consider the strength of transverse reinforcement; however, from the comparison between NEWRC1 and NEWRC5, it was observed that it would increase the overall volume of reinforcement which would be unnecessary, especially under the low axial load.
  • NEWRCF had a similar failure pattern as NEWRC1, with the leading cause of failure being the buckling of the longitudinal rebar. Overall, NEWRCF had a good seismic response, as a ductility ratio of 5.19 was recorded, and the residual drift ratio was below 1%, even at a higher drift ratio of 3%.
  • The numerical model developed in OpenSees using a buckling shear spring was able to predict the seismic performance of the high-strength columns precisely. Moreover, the model also considered the material strength, transverse reinforcement spacing, and axial load ratio and predicted the shear-strength degradation due to longitudinal rebar buckling with high accuracy. The proposed numerical model can further be applied to investigate the seismic performance of a broader range of high-strength columns in both buildings and bridges.

Author Contributions

Conceptualization, R.S. and K.-Y.L.; methodology, K.-Y.L. and W.W.; software, R.S.; validation, K.-Y.L. and R.S.; formal analysis, R.S.; investigation, R.S.; resources, K.-Y.L. and W.W.; data curation, R.S.; writing—original draft preparation, R.S.; writing—review and editing, R.S.; visualization, K.-Y.L. and W.W.; supervision, K.-Y.L.; project administration, K.-Y.L.; funding acquisition, K.-Y.L. All authors have read and agreed to the published version of the manuscript.

Funding

The test program was made possible by research project funding granted by the Ministry of Science and Technology (MOST), Taiwan, under grant number MOST104-2625-M492-005 (PI: Liu, Kuang-Yen).

Institutional Review Board Statement

Not applicable.

Informed Consent Statement

Not applicable.

Data Availability Statement

Not applicable.

Acknowledgments

We thank the National Center for Research on Earthquake Engineering (NCREE) for their contributions during the experimental program.

Conflicts of Interest

The authors declare no conflict of interest.

References

  1. Shahrooz, B.M. Design of Concrete Structures Using High-Strength Steel Reinforcement. In Transportation Research Board; Transportation Research Board: Washington, DC, USA, 2011; Volume 679. [Google Scholar]
  2. Kelly, D.J.; Lepage, A.; Mar, D.; Restrepo, J.; Sanders, J.C.; Taylor, A.W. Use of high-strength reinforcement for earth-quake-resistant concrete structures. In Proceedings of the NCEE 2014—10th U.S. National Conference on Earthquake Engineering: Frontiers of Earthquake Engineering, Anchorage, AK, USA, 21–25 July 2014; pp. 21–25. [Google Scholar]
  3. Aoyama, H.; Murota, T.; Hiraishi, H.; Bessho, S. Development of advanced reinforced concrete buildings with high-strength and high-quality materials. In Proceedings of the Tenth World Conference on Earthquake Engineering, Madrid, Spain, 19–24 July 1992; Balkema AA Publishers: Rotterdam, The Netherlands, 1992; pp. 3365–3370. [Google Scholar]
  4. Barcley, L.; Kowalsky, M. Seismic Performance of Circular Concrete Columns Reinforced with High-Strength Steel. J. Struct. Eng. 2020, 146, 04019198. [Google Scholar] [CrossRef]
  5. Cusson, D.; Paultre, P. High Strength Concrete Columns Confined by Rectangular Ties. J. Struct. Eng. 1994, 120, 783–804. [Google Scholar] [CrossRef]
  6. Salim, R.R.; Murat, S. Strength and Deformability of Confined High-Strength Concrete Columns. ACI Struct. J. 1994, 91, 678–687. [Google Scholar] [CrossRef]
  7. Foster, S.J.; Attard, M.M. Strength and Ductility of Fiber-Reinforced High-Strength Concrete Columns. J. Struct. Eng. 2001, 127, 28–34. [Google Scholar] [CrossRef]
  8. Yu-Chen, O.; Dimas, P.K. Shear Behavior of Reinforced Concrete Columns with High-Strength Steel and Concrete. ACI Struct. J. 2015, 112, 35–45. [Google Scholar] [CrossRef]
  9. Muguruma, H.; Watanabe, F. Ductility Improvement of High-Strength Concrete Columns With Lateral Confinement. ACI Symp. Publ. 1990, 121, 47–60. [Google Scholar] [CrossRef]
  10. Li, B.; Park, R.; Tanaka, H. Stress-Strain Behavior of High-Strength Concrete Confined by Ultra-High- and Normal-Strength Transverse Reinforcements. ACI Struct. J. 2001, 98, 395–406. [Google Scholar] [CrossRef]
  11. Shi, Q.; Ma, L.; Wang, Q.; Wang, B.; Yang, K. Seismic performance of square concrete columns reinforced with grade 600 MPa longitudinal and transverse reinforcement steel under high axial load. Structures 2021, 32, 1955–1970. [Google Scholar] [CrossRef]
  12. Zhang, J.; Cai, R.; Li, C.; Liu, X. Seismic behavior of high-strength concrete columns reinforced with high-strength steel bars. Eng. Struct. 2020, 218, 110861. [Google Scholar] [CrossRef]
  13. Rautenberg, J.M.; Pujol, S.; Tavallali, H.; Lepage, A. Drift Capacity of Concrete Columns Reinforced with High-Strength Steel. ACI Struct. J. 2013, 110, 307–317. [Google Scholar] [CrossRef]
  14. Barbosa, A.R.; Link, T.; Trejo, D. Seismic Performance of High-Strength Steel RC Bridge Columns. J. Bridge Eng. 2016, 21, 04015044. [Google Scholar] [CrossRef]
  15. Lucas, A.L.; Santiago, P. Drift Demands on Reinforced Concrete Structures Subjected to Strong Ground Motions. ACI Struct. J. 2019, 116, 103–115. [Google Scholar] [CrossRef]
  16. Duy, V.T.; Jack, P.M. Special Moment Frames with High-Strength Reinforcement—Part 1: Beams. ACI Struct. J. 2020, 117, 239–253. [Google Scholar] [CrossRef]
  17. Aishwarya, Y.P.; Santiago, P. Reinforcement Limits for Reinforced Concrete Elements with High-Strength Steel. ACI Struct. J. 2019, 116, 201–213. [Google Scholar] [CrossRef]
  18. Rautenberg, J.M.; Pujol, S.; Tavallali, H.; Lepage, A. Reconsidering the use of high-strength reinforcement in concrete columns. Eng. Struct. 2012, 37, 135–142. [Google Scholar] [CrossRef]
  19. ACI. Building Code Requirements for Structural Concrete and Commentary (ACI 318-19); American Concrete Institute: Farmington Hills, MI, USA, 2019; Volume 623. [Google Scholar]
  20. Perceka, W.; Liao, W.-C.; Wang, Y.-D. High Strength Concrete Columns under Axial Compression Load: Hybrid Confinement Efficiency of High Strength Transverse Reinforcement and Steel Fibers. Materials 2016, 9, 264. [Google Scholar] [CrossRef] [Green Version]
  21. Ou, Y.-C.; Dimas, P.K. Effect of Axial Compression on Shear Behavior of High-Strength Reinforced Concrete Columns. ACI Struct. J. 2015, 112, 209–220. [Google Scholar] [CrossRef]
  22. Liao, W.-C.; Perceka, W.; Yu, L.-C. Systematic Mix Procedures for Highly Flowable-Strain Hardening Fiber Reinforced Concrete (HF-SHFRC) by Using Tensile Strain Hardening Responses as Performance Criteria. Sci. Adv. Mater. 2017, 9, 1157–1168. [Google Scholar] [CrossRef]
  23. Cheng, M.-Y.; Marnie, B.G. Cyclic Behavior of Reinforced Concrete Flexural Members Using High-Strength Flexural Reinforcement. ACI Struct. J. 2014, 111, 893–902. [Google Scholar] [CrossRef]
  24. Ou, Y.-C.; Nguyen, N.V.B. Stress Limit for Shear Reinforcement of High-Strength Columns. ACI Struct. J. 2022, 119, 131–143. [Google Scholar] [CrossRef]
  25. NCREE. Design guideline for the building of high-strength reinforced concrete structures (draft) (NCREE-19-001). In Proceedings of the National Center for Research on Earthquake Engineering, Taipei, Taiwan, 15–19 September 2019. [Google Scholar]
  26. AASTHO. AASHTO LRFD Bridge Design Specifications; American Association of State Highway and Transportation Officials: Washington, DC, USA, 2017. [Google Scholar]
  27. Su, J.; Dhakal, R.P.; Junjie, W. Fiber-based damage analysis of reinforced concrete bridge piers. Soil Dyn. Earthq. Eng. 2017, 96, 13–34. [Google Scholar] [CrossRef]
  28. Su, J.; Wang, J.; Li, Z.; Liang, X. Effect of reinforcement grade and concrete strength on seismic performance of reinforced concrete bridge piers. Eng. Struct. 2019, 198, 109512. [Google Scholar] [CrossRef]
  29. Mazzoni, S.; McKenna, F.; Fenves, G. OpenSees Command Language; Pacific Earthquake Engineering Research (PEER) Center: Berkeley, CA, USA, 2001. [Google Scholar]
  30. Wu, D.; Ding, Y.; Su, J.; Li, Z.-X.; Zong, L.; Feng, K. Effects of tie detailing configurations on reinforcement buckling and seismic performance of high-strength RC columns. Soil Dyn. Earthq. Eng. 2021, 147, 106791. [Google Scholar] [CrossRef]
  31. Shen, J.J.; Yen, W.P.; O’Fallon, J. Development of a Handbook for Seismic Performance Testing of Bridge Piers. In Proceedings of the Sixth U.S. Conference and Workshop on Lifeline Earthquake Engineering (TCLEE), Long Beach, CA, USA, 10–13 August 2003; Advancing Mitigation Technologies and Disaster Response for Lifeline Systems. pp. 133–142. [Google Scholar] [CrossRef] [Green Version]
  32. Crespi, P.; Zucca, M.; Longarini, N.; Giordano, N. Seismic Assessment of Six Typologies of Existing RC Bridges. Infrastructures 2020, 5, 52. [Google Scholar] [CrossRef]
  33. Crespi, P.; Zucca, M.; Valente, M. On the collapse evaluation of existing RC bridges exposed to corrosion under horizontal loads. Eng. Fail. Anal. 2020, 116, 104727. [Google Scholar] [CrossRef]
  34. Saetta, A.V.; Vitaliani, R.V. Experimental investigation and numerical modeling of carbonation process in reinforced concrete structures: Part I: Theoretical formulation. Cem. Concr. Res. 2004, 34, 571–579. [Google Scholar] [CrossRef]
  35. Mohamed, N.; Farghaly, A.S.; Benmokrane, B.; Neale, K.W. Drift Capacity Design of Shear Walls Reinforced with GFRP Bars. ACI Struct. J. 2014, 111, 1397. [Google Scholar] [CrossRef]
  36. MOTC. Seismic Design Specification of Highway Bridge; Ministry of Transportation and Communication: Taipei, Taiwan, 2020.
  37. Berry, M.P.; Eberhard, M.O. Practical Performance Model for Bar Buckling. J. Struct. Eng. 2005, 131, 1060–1070. [Google Scholar] [CrossRef]
  38. Jin, L.; Zhang, S.; Han, J.; Li, D.; Du, X. Effect of cross-section size on flexural compressive failure of RC columns: Monotonic and cyclic tests. Eng. Struct. 2019, 186, 456–470. [Google Scholar] [CrossRef]
  39. Lignola, G.P.; Prota, A.E.; Manfredi, G.; Cosenza, E. Non-linear modeling of RC rectangular hollow piers confined with CFRP. Compos. Struct. 2009, 88, 56–64. [Google Scholar] [CrossRef]
  40. Cheng, H.; Li, H.; Wang, D.; Sun, Z.; Li, G.; Jin, J. Research on the influencing factors for residual displacements of RC bridge columns subjected to earthquake loading. Bull. Earthq. Eng. 2016, 14, 2229–2257. [Google Scholar] [CrossRef]
  41. Chadwell, C.; Imbsen, R. XTRACT: A Tool for Axial Force—Ultimate Curvature Interactions. In Proceedings of the Structures Congress 2004: Building on the Past, Securing the Future, Nashville, TN, USA, 22–26 May 2004; American Society of Civil Engineers: Reston, VA, USA, 2004; pp. 1–9. [Google Scholar]
  42. Lee, H.-J.; Lai, Y.-L.; Chen, C.-W.; Tao, C.-C. Behavior and modeling of high-strength concrete tied columns under axial compression. J. Chin. Inst. Eng. 2018, 41, 353–365. [Google Scholar] [CrossRef]
  43. Liu, K.-Y.; Witarto, W.; Chang, K.-C. Composed analytical models for seismic assessment of reinforced concrete bridge columns. Earthq. Eng. Struct. Dyn. 2015, 44, 265–281. [Google Scholar] [CrossRef]
  44. Kenneth, J.E.; Marc, O.E. Effective Stiffness of Reinforced Concrete Columns. ACI Struct. J. 2009, 106, 476. [Google Scholar] [CrossRef] [Green Version]
  45. Elwood, K.J. Shake Table Tests and Analytical Studies on the Gravity Load Collapse of Reinforced Concrete Frames. Ph.D.Thesis, University of California, Berkeley, CA, USA, 2002. [Google Scholar]
  46. Xiao, Y.; Martirossyan, A. Seismic Performance of High-Strength Concrete Columns. J. Struct. Eng. 1998, 124, 241–251. [Google Scholar] [CrossRef]
  47. Frederic, L.; Patrick, P. Behavior of High-Strength Concrete Columns under Cyclic Flexure and Constant Axial Load. ACI Struct. J. 2000, 97, 591–601. [Google Scholar] [CrossRef]
  48. John, H.T.; John, W.W. Lateral Load Behavior of Reinforced Concrete Columns Constructed Using High-Strength Materials. ACI Struct. J. 1994, 91, 605–615. [Google Scholar] [CrossRef]
Figure 1. Section details for the BMRC1, NEWRC columns, and NEWRCF. Unit: mm.
Applsci 12 05326 g001
Figure 2. Stress–strain curves of longitudinal rebar.
Applsci 12 05326 g002
Figure 3. Test setup: (a) NEWRC columns; (b) NEWRCF. Unit: mm.
Applsci 12 05326 g003
Figure 4. Loading protocol.
Applsci 12 05326 g004
Figure 5. Crack pattern of damage at the end of the test: (a) BMRC1; (b) NEWRC1; (c) NEWRC2; (d) NEWRC3; (e) NEWRC4; (f) NEWRC5.
Applsci 12 05326 g005aApplsci 12 05326 g005b
Figure 6. Crack pattern at corresponding drift ratio: (a) BMRC1; (b) NEWRC1.
Applsci 12 05326 g006aApplsci 12 05326 g006b
Figure 7. Crack pattern at damage at the end of the test NEWRCF: (a) P1-Top; (b) P1-Bot; (c) P2-Top; (d) P2-Bot.
Applsci 12 05326 g007
Figure 8. Hysteresis loops of specimens: (a) BMRC1; (b) NEWRC1; (c) NEWRC2; (d) NEWRC3; (e) NEWRC4; (f) NEWRC5; (g) NEWRCF.
Applsci 12 05326 g008aApplsci 12 05326 g008b
Figure 9. Backbone curves: (a) All specimen; (b) BMRC1 and NEWRC1; (c) NEWRC 1, 2, and 3; (d) NEWRC 1 and 4; (e) NEWRC 1 and 5; (f) NEWRCF.
Applsci 12 05326 g009
Figure 10. Idealized force-displacement curves.
Applsci 12 05326 g010
Figure 11. Stiffness degradation curves: (a) BMRC1 and NEWRC1–5; (b) BMRC1 and NEWRC1; (c) NEWRC1, 2, and 3; (d) NEWRC1 and 4; (e) NEWRC1 and 5; (f) NEWRCF.
Applsci 12 05326 g011aApplsci 12 05326 g011b
Figure 12. Cumulative energy dissipation: (a) Energy in the hysteretic loop; (b) BMRC1 and NEWRC1–5; (c) BMRC1 and NEWRC1; (d) NEWRC1, 2, and 3; (e) NEWRC1 and 4; (f) NEWRC1 and 5; (g) NEWRCF.
Applsci 12 05326 g012aApplsci 12 05326 g012b
Figure 13. Equivalent viscous damping ratios of the specimens: (a) Hysteretic loop; (b) All column specimens; (c) BMRC1 and NEWRC1; (d) NEWRC1, 2 and 3; (e) NEWRC1 and 4; (f) NEWRC1 and 5; (g) NEWRCF.
Applsci 12 05326 g013aApplsci 12 05326 g013b
Figure 14. Residual drift ratios at different drift ratios: (a) All column specimens; (b) BMRC1 and NEWRC1; (c) NEWRC1, 2, and 3; (d) NEWRC1 and 4; (e) NEWRC1 and 5; (f) NEWRCF.
Applsci 12 05326 g014
Figure 15. Comparison of NEWRC 1 and NEWRC 5: (a) Backbone curve; (b) Cumulative energy dissipation.
Applsci 12 05326 g015
Figure 16. Numerical models for bridge (a)column; (b) frame.
Applsci 12 05326 g016
Figure 17. Buckling shear spring.
Applsci 12 05326 g017
Figure 18. Comparisons of hysteretic curves and backbone curves from numerical simulation and experimental results.
Applsci 12 05326 g018
Figure 19. Comparison of the experimental and simulation results for NEWRCF.
Applsci 12 05326 g019
Table 1. HSC concrete mix proportion (kg/m3).
CementFly AshSilica FumeCoarse AggregateFine AggregateWaterS.P.
4001705084471917014.26
Table 2. Column and frame design parameters.
SpecimenConcrete Compressive StrengthLongitudinal Reinforcement, D25 (#8)Transverse Reinforcement, D13 (#4)Axial Compression Ratio
f c (MPa) f y l (MPa) ρ l (%) f y t (MPa) ρ t (%) s   m m P / A g f c   (%)
BMRC1375342.263411.081000.066
NEWRC180.97362.448131.031000.066
NEWRC280.97362.448130.5162000.066
NEWRC380.97362.448130.3443000.066
NEWRC480.97362.448131.031000.132
NEWRC580.97362.443411.031000.066
NEWRCF807232.38331.291000.1
Table 3. Details of the test results.
SpecimenYield PointPeak PointUltimate Point Rebar Buckling
PyθyPpθpPuθu μ = ϑuybbexpbbpredbbexp/∆bbpred
Kn(%)Kn(%)Kn(%) (%)(%)
BMRC12641.943062.502598.005.767.506.551.15
NEWRC12871.643333.002829.005.498.007.321.09
NEWRC22671.632925.002466.003.666.006.270.96
NEWRC32861.713233.002785.002.955.005.920.84
NEWRC43141.373642.702938.005.886.946.801.02
NEWRC52801.733383.9027510.005.819.006.031.49
NEWRCF10281.3510872.508847.005.196.645.961.11
Table 4. Column database.
ReferencesColumn f c
(MPa)
f y l
(MPa)
f y t
(MPa)
b
(mm)
h
(mm)
a / d P f c A g ρ l
(%)
ρ t
(%)
Test Type
This researchNEWRC180.97368135005007.20.0662.441.03C
NEWRC280.97368135005007.20.0662.440.52C
NEWRC380.97368135005007.20.0662.440.34C
NEWRC480.97368135005007.20.1322.441.03C
NEWRC580.97363415005007.20.0662.441.03C
Paultre and Legeron, 2000 [47]No. 1001301594.87296373053056.50.1362.150.76C
Thomsen and Wallace 1994 [48]C274.67381448152.41523.90.12.450.62C
C381.87381448152.41523.90.22.450.62C
Xiao and Martirossyan 1998 [46]HC4-8L19-T10-0.1P7651051025425420.12.461.5DC
HC4-8L19-T10-0.2P7651051025425420.23.51.5DC
HC4-8L16-T10-0.1P8651051025425420.0962.461.5DC
HC4-8L16-T6-0.1P8651051025425420.0962.460.75DC
This researchNEWRCF8072383350050080.12.31.29DC
Publisher’s Note: MDPI stays neutral with regard to jurisdictional claims in published maps and institutional affiliations.

