Abstract
Wellbore instability is one of the most serious problems that can occur during drilling, mainly during drilling oil or gas wells through rocks that contain a higher proportion of clay, such as shales. To prevent wellbore instability, oil companies apply different approaches to strengthen wellbore walls, and use different shale swelling inhibitors. The aim of this research was to apply a green approach and the concept of the circular economy in mud design, and to determine whether mandarin peel powder, which is a waste material, can be used as an inhibitor of shale swelling. For that purpose, pellets consisting of bentonite and quartz in a 50:50 ratio were prepared using a compactor, and bentonite-based drilling mud (BM) with and without mandarin peel powder in concentrations of 0.5, 1, 1.5 and 2% by volume of water. The swelling of quartz–bentonite pellets after 2 and 24 h in each drilling-mud sample was determined at room temperature and 90 °C using a linear swell meter. On the basis of laboratory research, we concluded that increasing the concentration of mandarin peel powder reduces pellet swelling. By adding mandarin peel powder particles between 0.1 and 0.16 mm to the base mud at a concentration of 2% by volume of water, the following was achieved: 44% reduction in API filtration, 61.54% reduction in PPT filtration, 45% reduction in pellet swelling after 24 h at room temperature, and 48.6% reduction of pellet swelling after 24 h at 90 °C.
1. Introduction
The successful construction of a wellbore is an extremely challenging technical and technological process, as each well presents its own specific challenges. Due to a number of potential problems, drilling can be significantly slowed down, and, in extreme cases, the well may be abandoned, resulting in significant financial losses. With the increasing depth of drilled wells and the increasing number of horizontal extended reach wells, the oil and gas industry faces many issues that were not as pronounced in vertical wells. According to the available data, solving problems related to wellbore instability annually costs the oil industry between USD 0.5 and 1 billion [1,2,3]. The most complex problems in the technology of deep well drilling arise from the disturbed stability of the wellbore walls due to the effect of various factors. Wellbore instability is defined as any undesirable change in the diameter (narrowing or widening) of the wellbore relative to the diameter of the drill bit used to drill a particular section of the wellbore, and is one of the major problems in drilling operations. The consequences of wellbore instability can vary, such as the difficult cleaning of the well, the demanding execution of cementing operations and logging measurements, problems with drill string tripping or casing run-off, which ultimately leads to an increase in the time planned for drilling, and the need to allocate additional resources to eliminate the negative consequences [3,4,5,6,7].
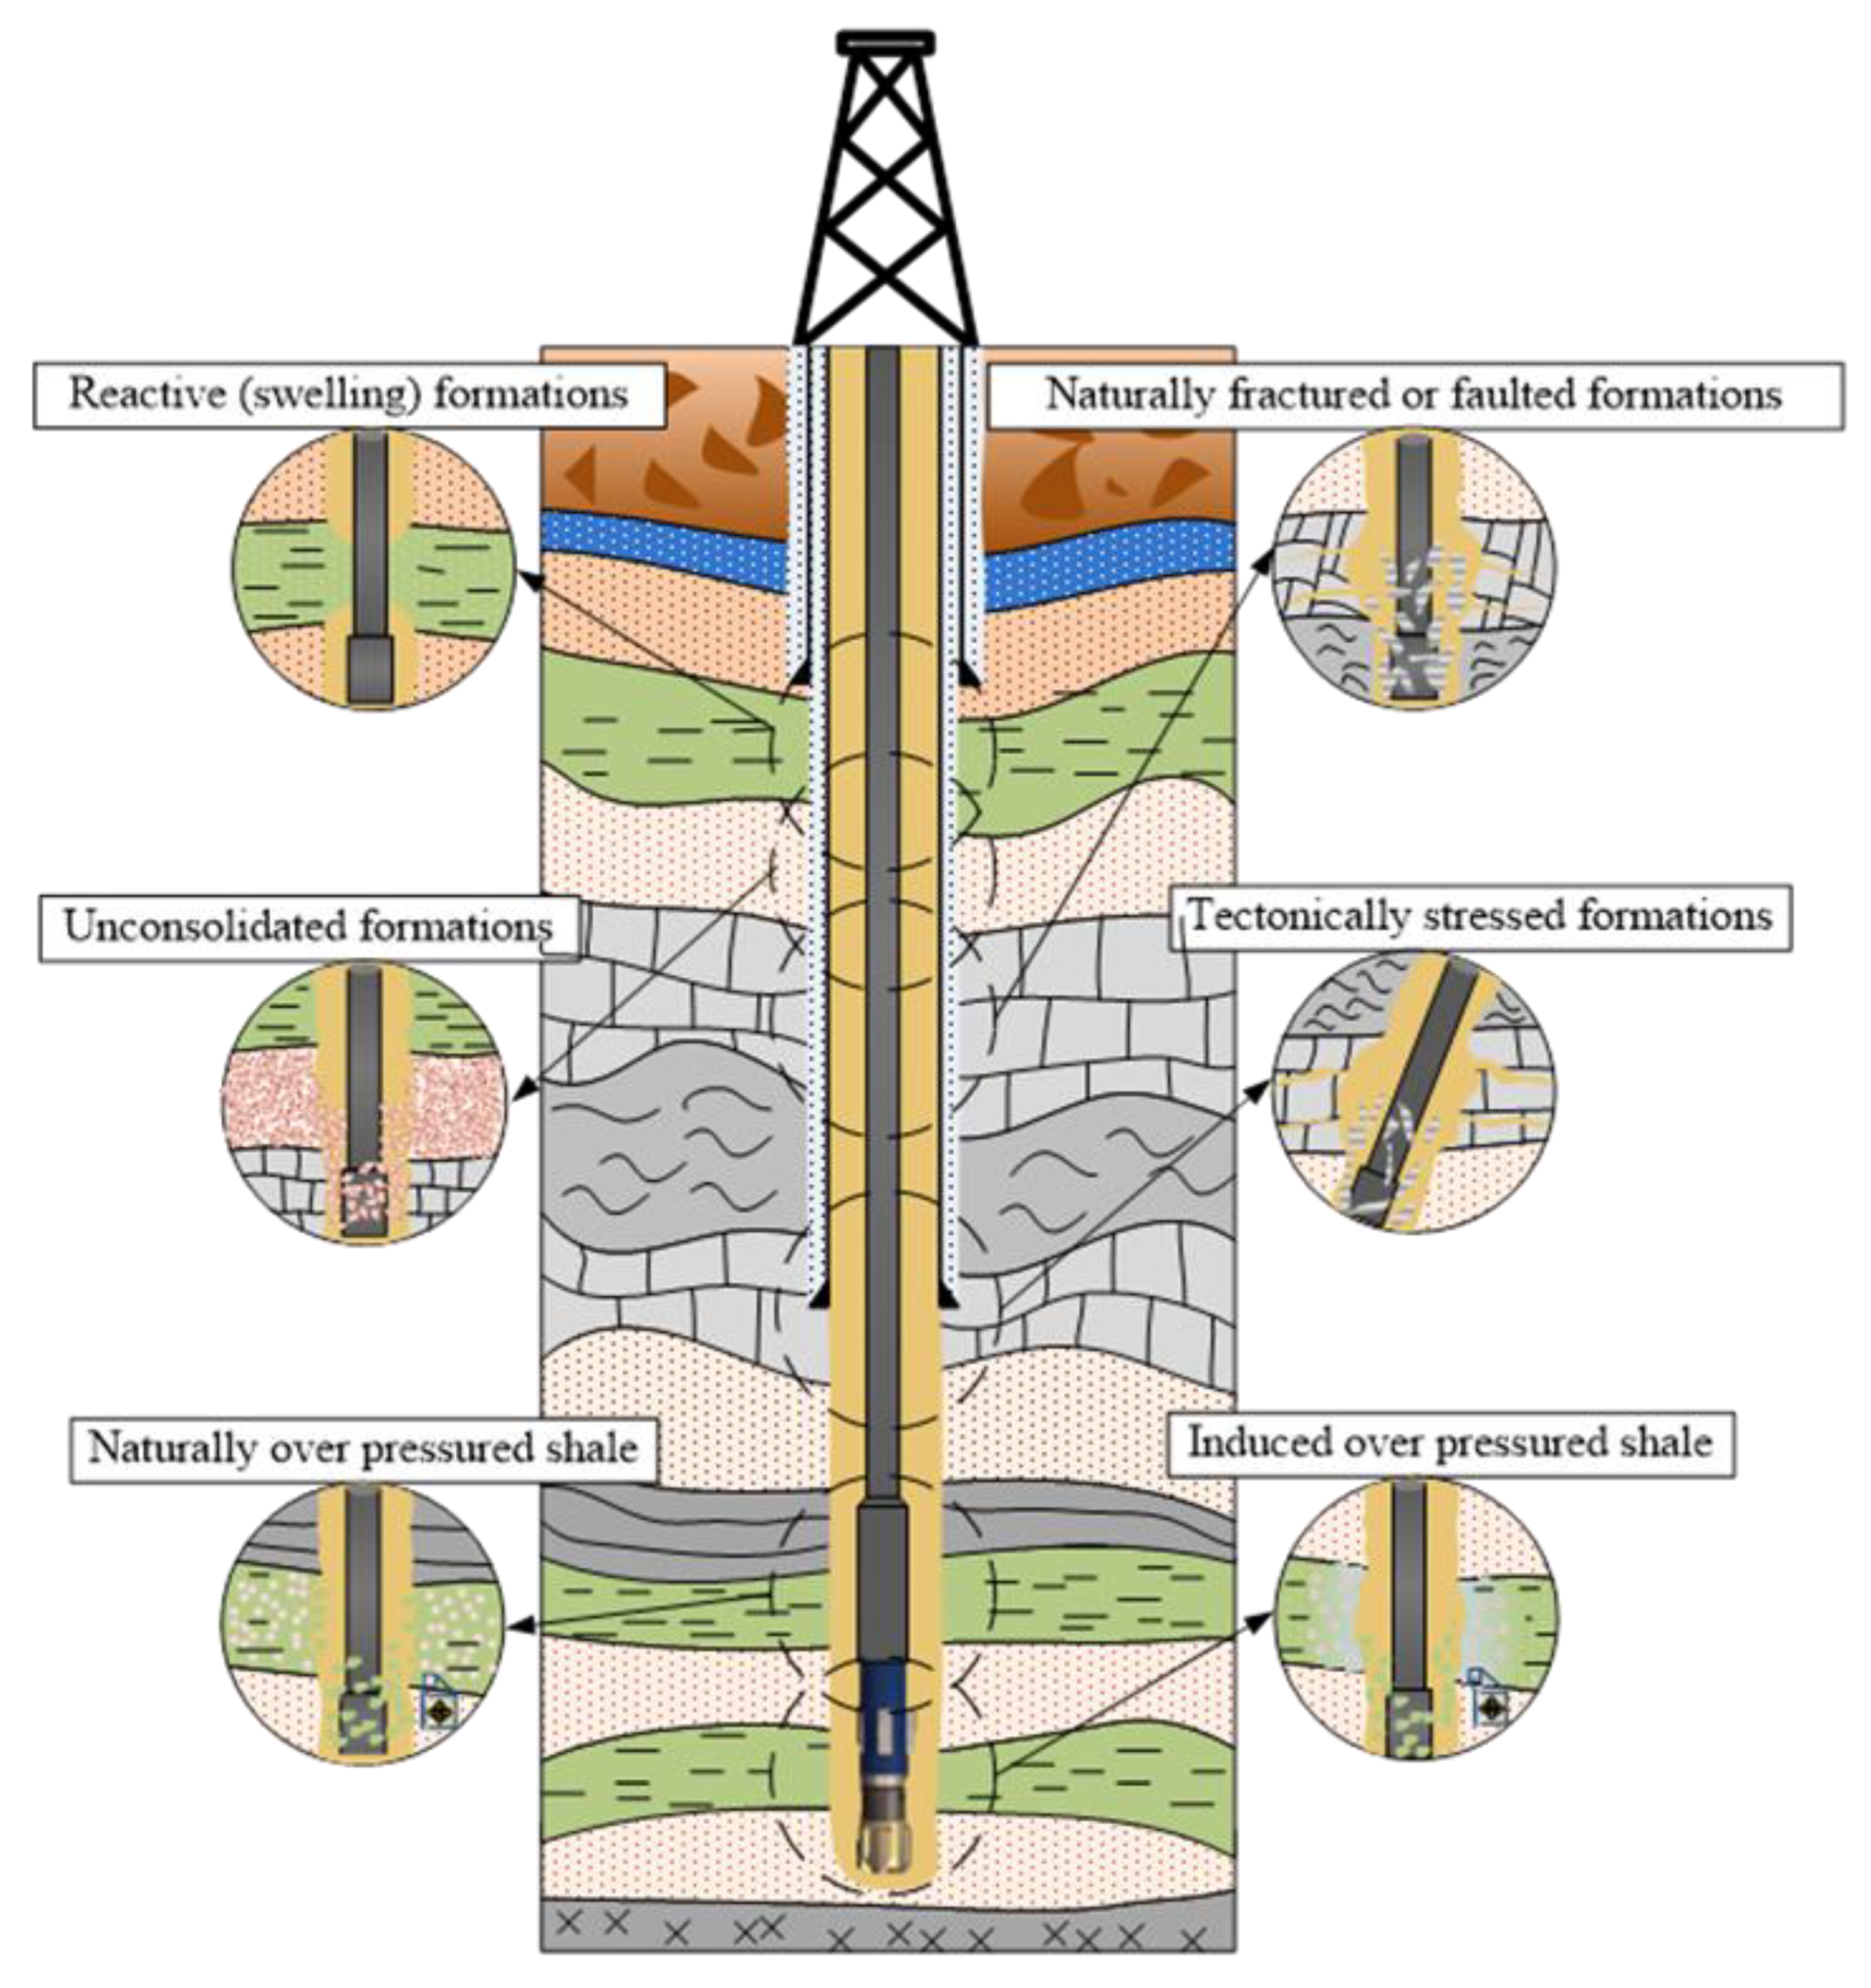
The causes of wellbore instability are numerous and vary depending on how they affect the stability of the wellbore. In most cases, wellbore instability is the result of several causes acting simultaneously. They are usually divided into two groups [5,8]: mechanical and physicochemical causes. Figure 1 illustrates different situations that can cause wellbore instability.

Figure 1.
Examples of situations that can cause wellbore instability (according to [3]).
Mechanical causes of wellbore instability result from the mechanical properties of drilled subsurface formations and from changes in stresses on the wellbore walls, while physicochemical causes are due to the interaction between rock and drilling mud. This classification can only be considered to be a framework, while wellbore instability is usually in reality the result of both groups of causes [9,10,11].
To understand the mechanical causes of wellbore instability, it is necessary to compare the state of the rock immediately before and after the wellbore is drilled through. From a rock mechanics point of view, the rock is in a natural stress equilibrium before drilling. This equilibrium state of the rock at a given depth is primarily the result of overburden (lithostatic) pressure, but also of various additional stresses resulting from tectonic activity. The moment at which the drill bit penetrates a particular rock, the existing equilibrium state is disturbed, and a new stress system is created on the wellbore walls and in the zone close to the borehole. The new stress distribution is due to a certain drilled rock volume being replaced by a mud column with a certain density. Axial (σa), radial (σr), and tangential (σt) stresses occur at the wellbore walls, while the original local (in situ) stresses continue to act at a certain distance from the well [12]. The values and stress distributions on wellbore walls depend on the combined action of mechanical, chemical, thermal, and hydraulic effects [13]. Another form of instability that can occur during drilling is rock fracture or tensile failure, which occurs when the effective value of any of the three principal stresses exceeds the tensile strength of the rock. In addition, the angle connecting the axis of the wellbore to a particular subsurface formation layer plays an important role in the stability of the wellbore. According to Labensky et al. (2003), the probability of instability increases as the angle between the axis of the wellbore and the dip angle (undip or downdip) of the formation layer decreases, while the greatest stability is achieved when the formation layer is drilled through at an angle of 90°. When designing a well, the relationships between the individual components of the local (in situ) stresses and their orientation must be taken into account [4].
Simultaneously with the process of stress redistribution on the wellbore walls that occurs during drilling, physicochemical interactions between drilling mud and rock may also occur. Various mechanisms that destabilize the wellbore can occur if the composition of the mud is not properly defined. Wellbore instability caused by physicochemical causes is most commonly associated with shale rocks due to their high clay mineral content and extremely low permeability [14,15,16]. Shale is usually composed of the following minerals: quartz, calcite, and clay from the smectite group (mostly montmorillonite), illite, chlorite, and kaolinite in varying proportions [3,17,18]. In shale, which comprises a significant amount of clay in its composition, hydration can occur during the drilling of this formation, which is a significant obstacle to successful well construction. In addition, shale is composed of mixed clay minerals in varying proportions, and their hydration behavior is difficult to predict. The behavior of shale as a rock directly depends on the behavior of a particular type of clay mineral. Each of these clay minerals has a specific crystalline structure that also determines its reaction with the mud, especially in water-based mud with respect to the reactivity of water with the clay minerals [3]. This problem is even more significant, because this type of mud is the most commonly used for drilling [19,20,21,22], as it is more environmentally friendly and cheaper than oil-based muds. Due to the relatively low permeability of the shale, mud cake is not formed on the wellbore walls [23]. The direct consequence of the nonexistence of mud cake is the rapid movement of water molecules into the pore space of the shale and an increase in pore pressure in the near-wellbore zone over time. In addition to the increase in pore pressure due to unfavorable interactions between mud and shale rock, there may also be changes in the mechanical properties of the rock, such as strength and Young’s modulus [24,25].
According to literature, 90% of all well stability problems occur when drilling through shales, formations that account for 75% of all formations through which a well is drilled [8,26,27,28,29]. The contact of shale with water from mud can cause shale hydration, changing the volume of the rock and reducing its cohesive strength. The excessive hydration of shales during drilling can lead to several problems. The main problem is the swelling of clay minerals, which creates a condition for the occurrence of wellbore instability. In addition to wellbore instability, there are other negative consequences of excessive hydration during drilling, such as excessive mud viscosity, stuck pipes, lower mechanical drilling speed, and bit balling [30,31,32]. However, it is very difficult to single out hydration as the cause of shale swelling and wellbore instability. In addition, several different processes occur during the contact between mud and rock, such as the aforementioned hydration (adsorption or absorption of water), ion diffusion flow (change in the interlayer space of the clay particles), mud filtrate flow due to overpressure in the wellbore, and capillary action [11]. A common feature of these processes is the movement of water and ion molecules into or out of the shale, and that they occur simultaneously. In some situations, different mechanisms can simultaneously cause water and ions to move in opposite directions. These processes continue until equilibrium is reached between rock and mud. Whether and to what extent such processes develop primarily depend on the mineralogical composition of the clay rock, but also on the properties of the mud in contact with the rock. In order to avoid the physicochemical causes of wellbore instability, the composition of the mud used when drilling through a particular rock must be precisely defined.
Although a certain composition of drilling mud gives satisfactory results in wellbore stabilization, recent research indicates that the problem has not yet been completely solved. The most commonly used additives to prevent clay hydration are various types of salts such as KCl, NaCl, NH4Cl, or CaCl2, and permanent inhibitors such as quaternary amine polymers [3]. When drilling through rocks that are prone to wellbore instabilities, mud composition can be optimized to have the lowest possible filtration value to minimize the amount of filtrate that penetrates the rocks of the near-wellbore zone, reacting with the clay components. However, a small amount of water always penetrates the rock before the mud cake forms, if it is created at all, as in the case of drilling through the shale formation. Therefore, it is necessary to minimize filtration by using additives such as starch, gum, and cellulose.
Since some commercially available water-based drilling mud additives fall into the category of environmentally hazardous substances (NaOH, KOH, K2SO4, polyamine, chromium-containing thinners, many shale stabilizers and mud loss additives, etc.), the new stricter environmental norms require the development of new ecofriendly additives for the adequate control of drilling mud properties with minimal environmental impact [33,34,35].
In the last decade, researchers have conducted laboratory tests to examine if waste materials can be added to water-based mud to optimize filtration properties. Table 1 lists food waste that has been used to optimize the filtration properties of water-based muds. Most of the tests were conducted with bentonite-based mud (bentonite suspension), which mainly consists of water, bentonite, and additives for pH adjustment, so Table 1 does not provide information on the composition of each mud type. Although the additives were added at different concentrations, most of the examined additives generally reduce API filtration by increasing the concentration, and Table 1 shows the highest measured value. Exceptions are green olive pits, which decrease API filtration up to a concentration of 0.75% of water volume and then increase it [36], and rice husk ash, which decreases API filtration up to a concentration of 9.6% and then increases it [37]. The range of filtration reduction for different waste materials is thus very wide, ranging from 9% to 68% for mandarin peel powder. To gain better insight into the potential of using these additives to optimize drilling mud, additional properties need to be tested. The effect of waste materials on rock swelling has not yet been studied in detail. Zhang et al. (2020) measured the swelling of a bentonite pellet in a pomelo powder solution. The pellets were compressed at 34.48 MPa (5000 psi) for 30 min. The concentration of the pomelo powder was 0.3, 0.5, 0.7, and 1% of the volume of water added to the base mud consisted of 600 mL of water and 18.6 g of bentonite. They concluded that, as the concentration of pomelo powder increased, the swelling of the pellet decreased to about 62, 60, 50, and 48% after 24 h compared to the swelling in distilled water (about 70%) [38].

Table 1.
Waste materials used to optimize the filtration properties of water-based muds.
In this research, mandarin peel powder (MPP) was used to determine its effect on the filtration properties of drilling mud and particularly on clay swelling in bentonite-based drilling mud. The main objective of the presented research was to determine whether and to what extent the particle size of the MPP affects the rock swelling properties during interaction with drilling mud. The novelty of this research is to determine the effect of MPP particle size (less than 0.10 mm, and from 0.10 to 0.16 mm) on filtration properties (API and PPT) and clay swelling at room temperature and 90 °C.
2. Materials and Methods
The effects of adding mandarin peel powder to a bentonite-based mud on filtration properties and clay swelling was performed at the Drilling Fluid Laboratory of the Faculty of Mining, Geology and Petroleum Engineering, University of Zagreb.
2.1. Preparation of Powder from Mandarin Peel
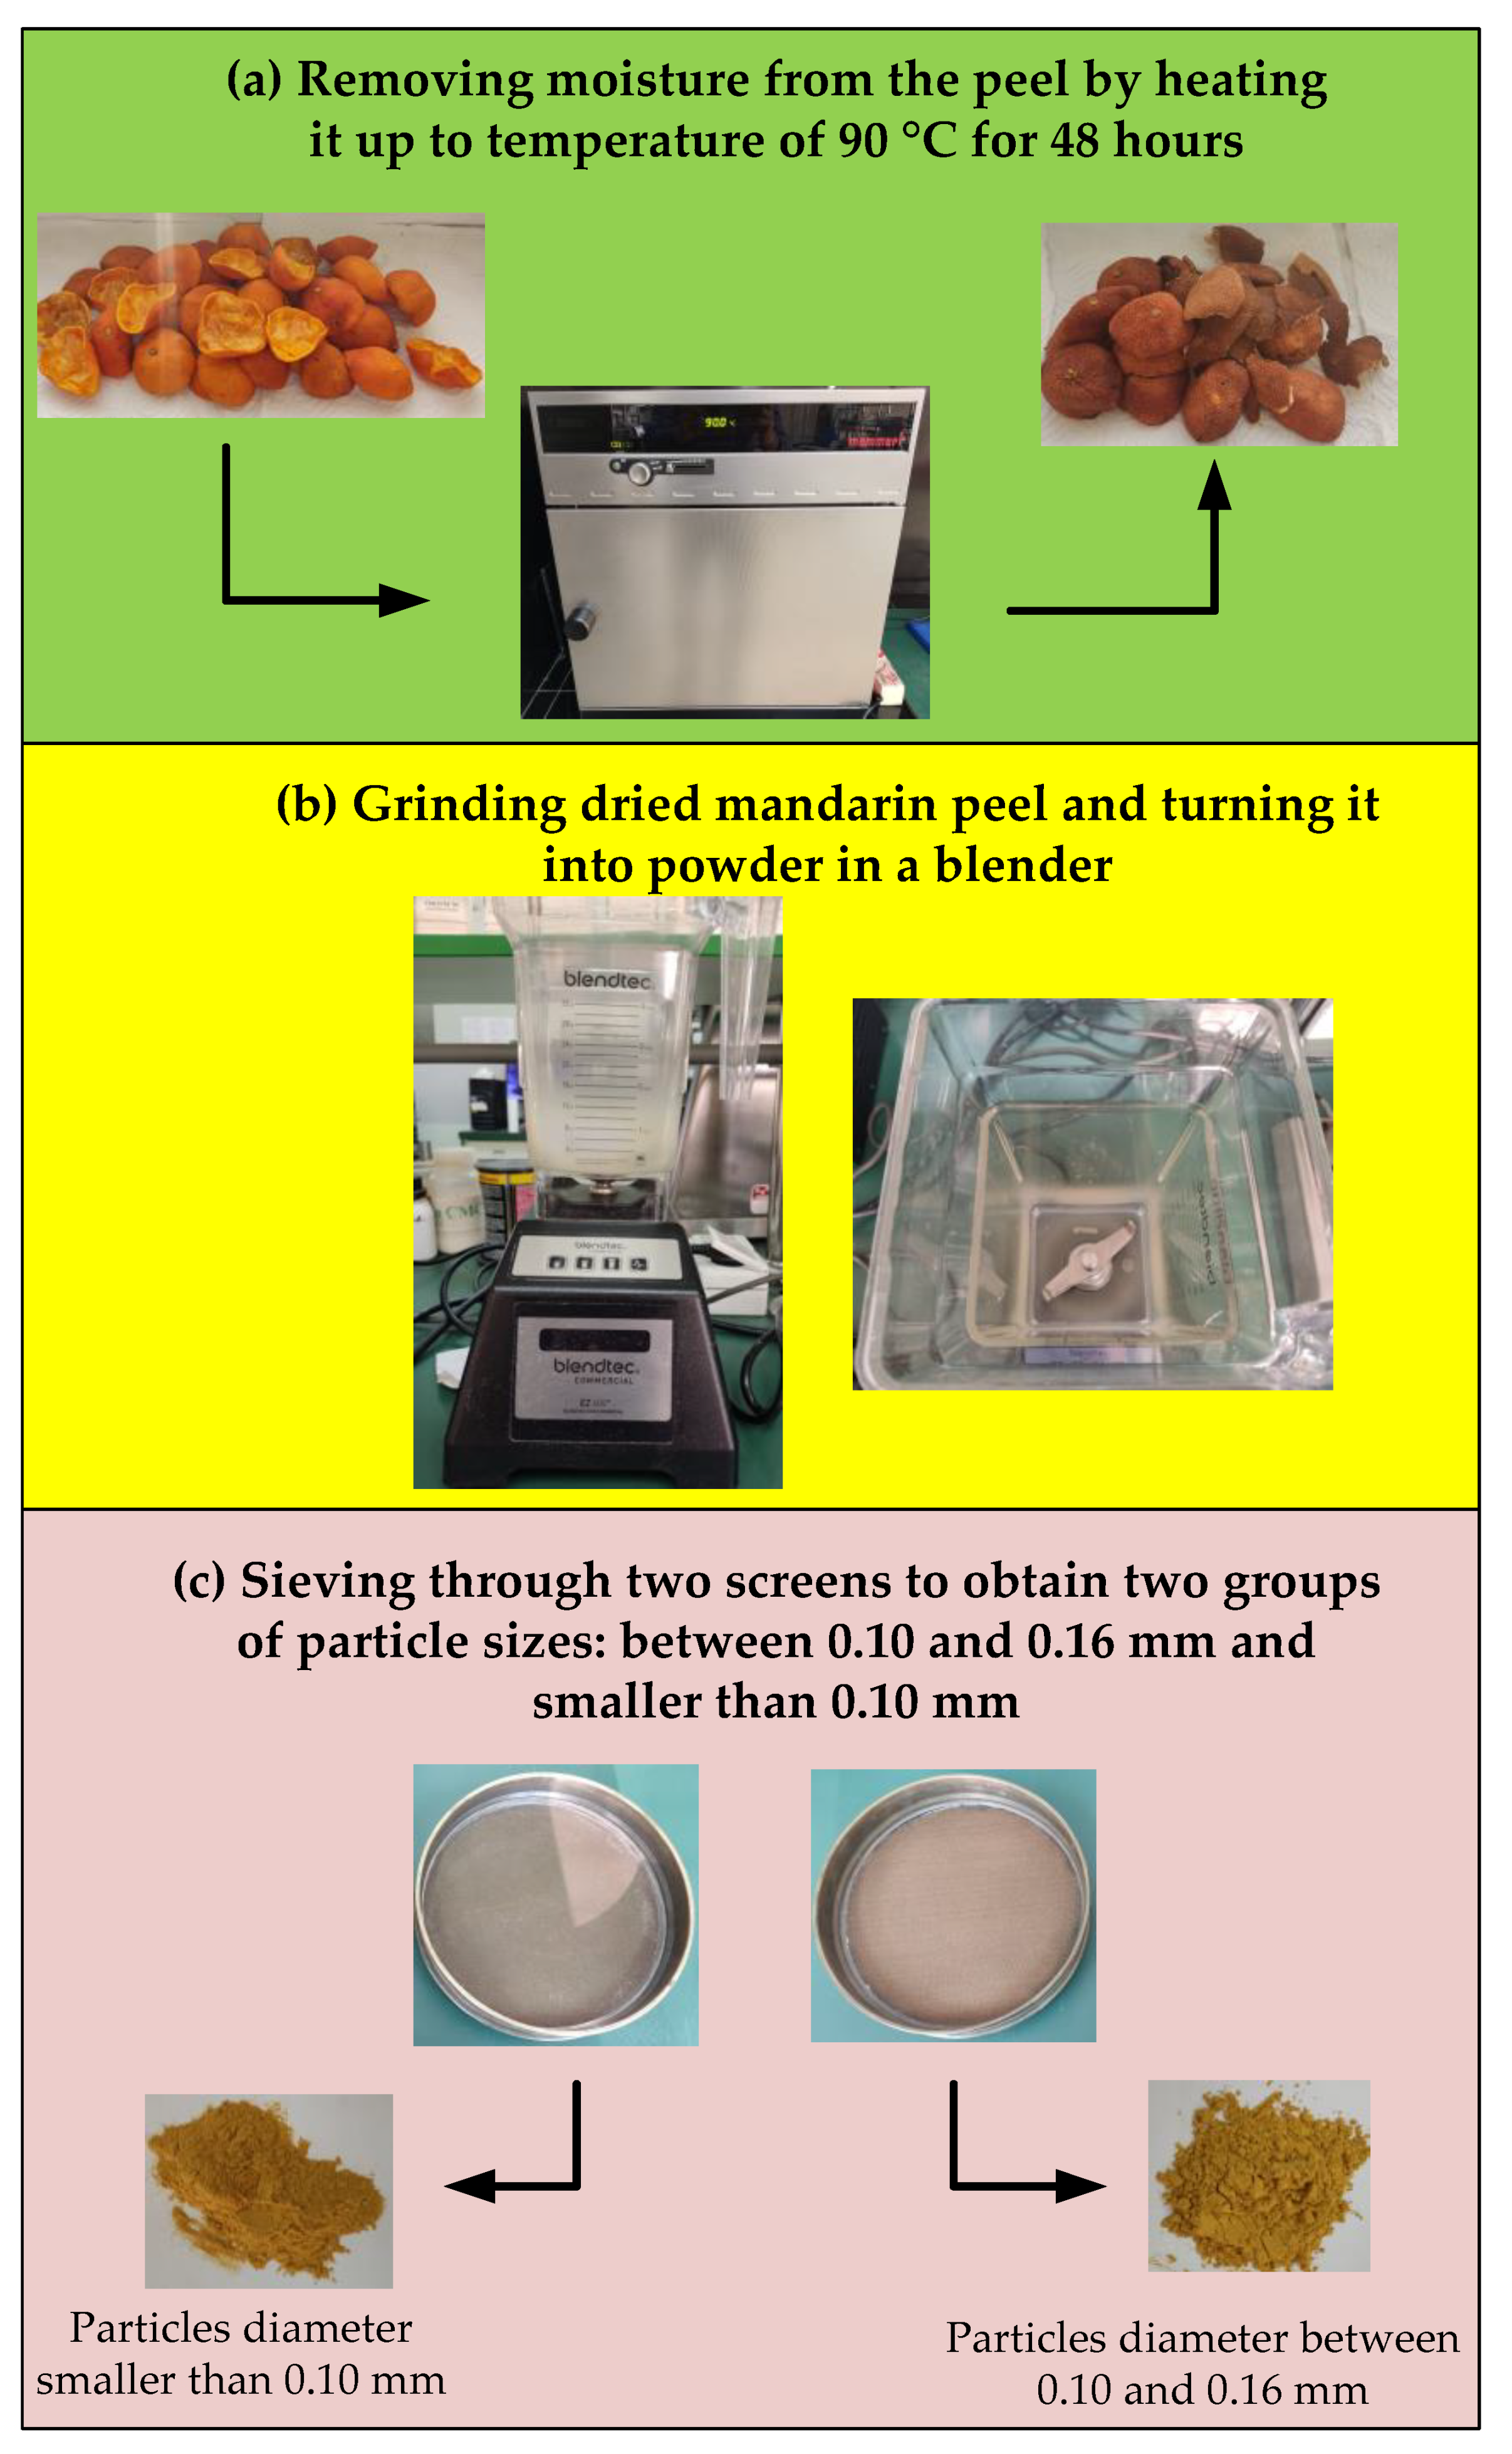
Figure 2 shows the whole procedure for the preparation of MPP. First, the mandarin peels were dried in an oven for 2 days at 90 °C to completely dehydrate the source material (Figure 2a). After dehydration, the peel was ground in a blender to obtain a fine powder (Figure 2b). The MPP was then sieved through two sieves (the openings of the sieves were 0.10 and 0.16 mm), thus dividing it into two groups regarding particle size: from 0.10 to 0.16 mm, and less than 0.10 mm (Figure 2c).
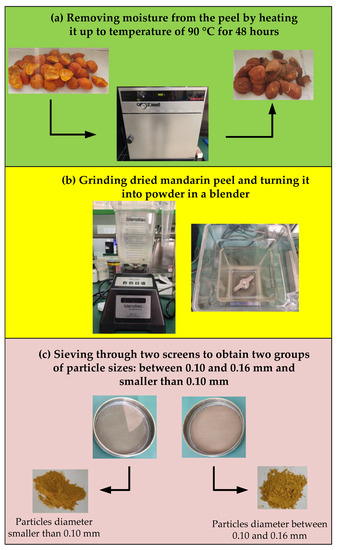
Figure 2.
Preparation of Mandarin Peel Powder.
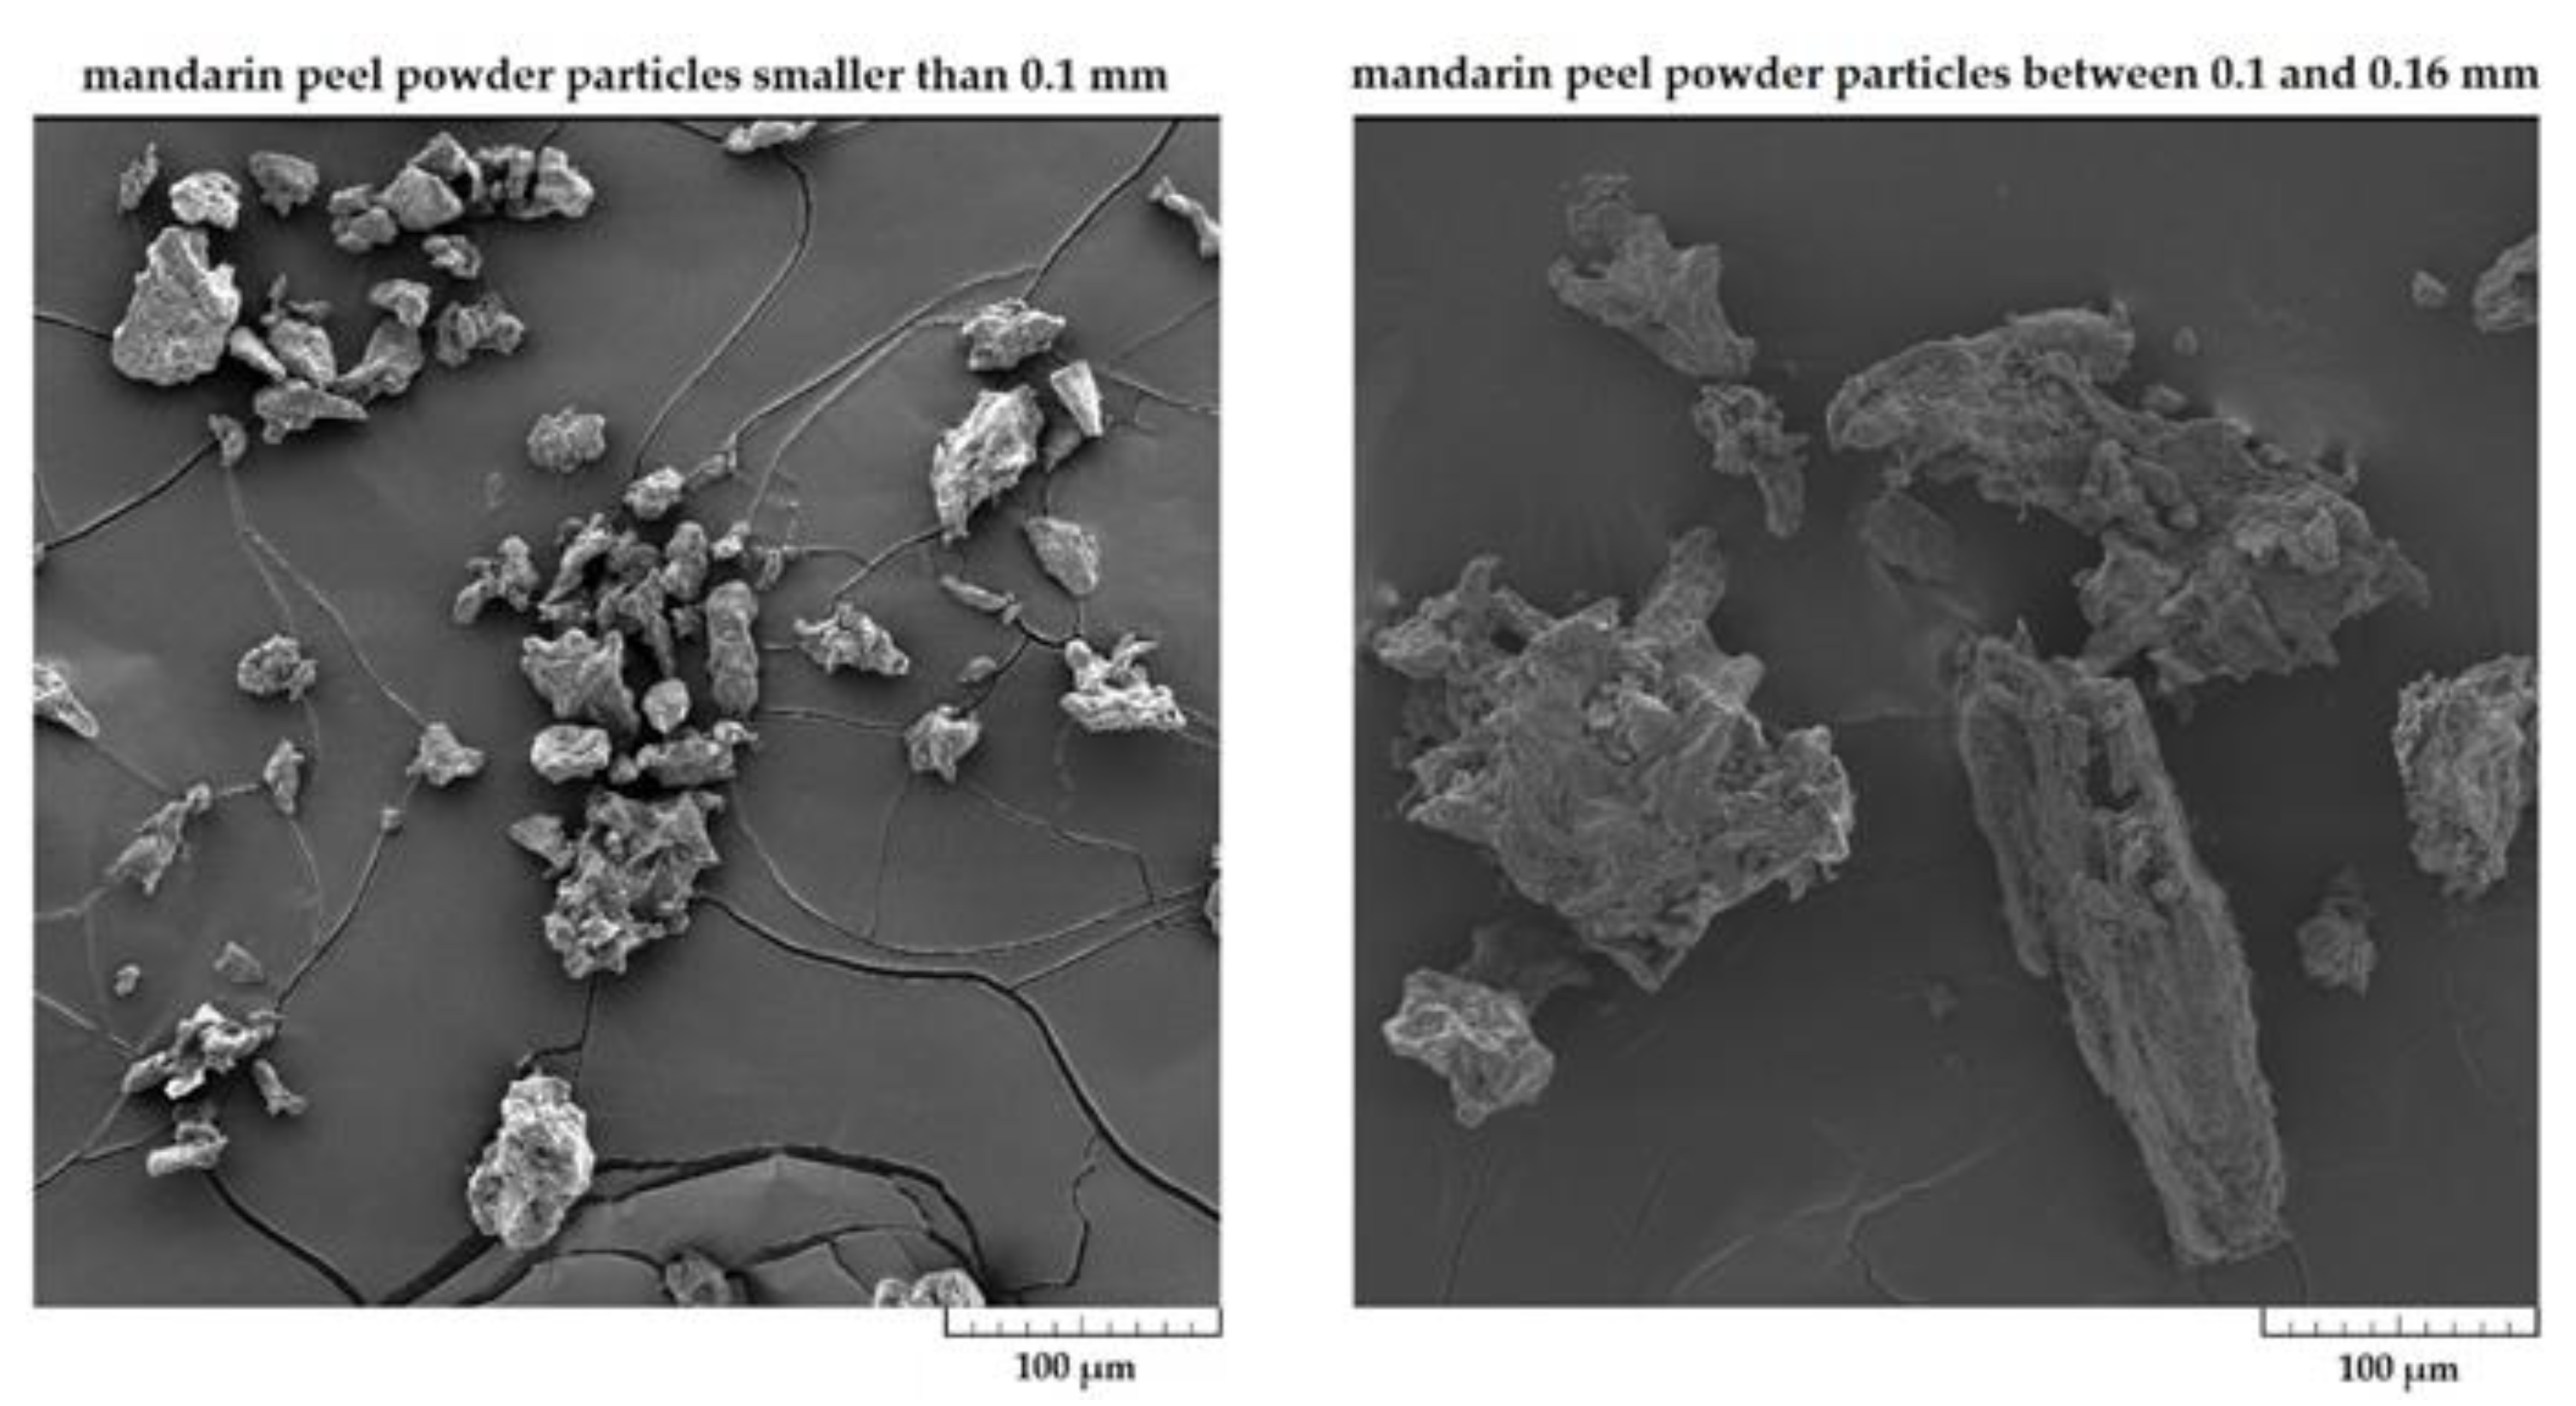
To gain insight into the size of the MPP particles after grinding and sieving, micrographs were taken with an FE-SEM Mira II LMU, Tescan at the University of Zagreb, Faculty of Textile Technology. Figure 3 (left) shows SEM images of MPP with particles less than 0.10 mm. The particles were irregularly shaped and had a wide range of sizes, although they were all smaller than 0.10 mm. Figure 3 (right) shows a SEM image of MPP containing particles from 0.10 to 0.16 mm. These particles were also irregularly shaped, and some of them were elongated and longer than 0.16 mm, but due to their smaller thickness, they still fit through the openings of the sieve.
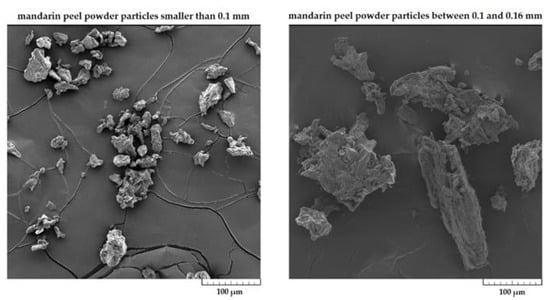
Figure 3.
SEM images of MPP containing particles (left) less than 0.10 mm and (right) from 0.10 to 0.16 mm.
Laboratory tests showed that these two groups of particle sizes influenced the filtration properties and swelling of the quartz–bentonite pellets.
2.2. Preparation of Quartz–Bentonite Pellets
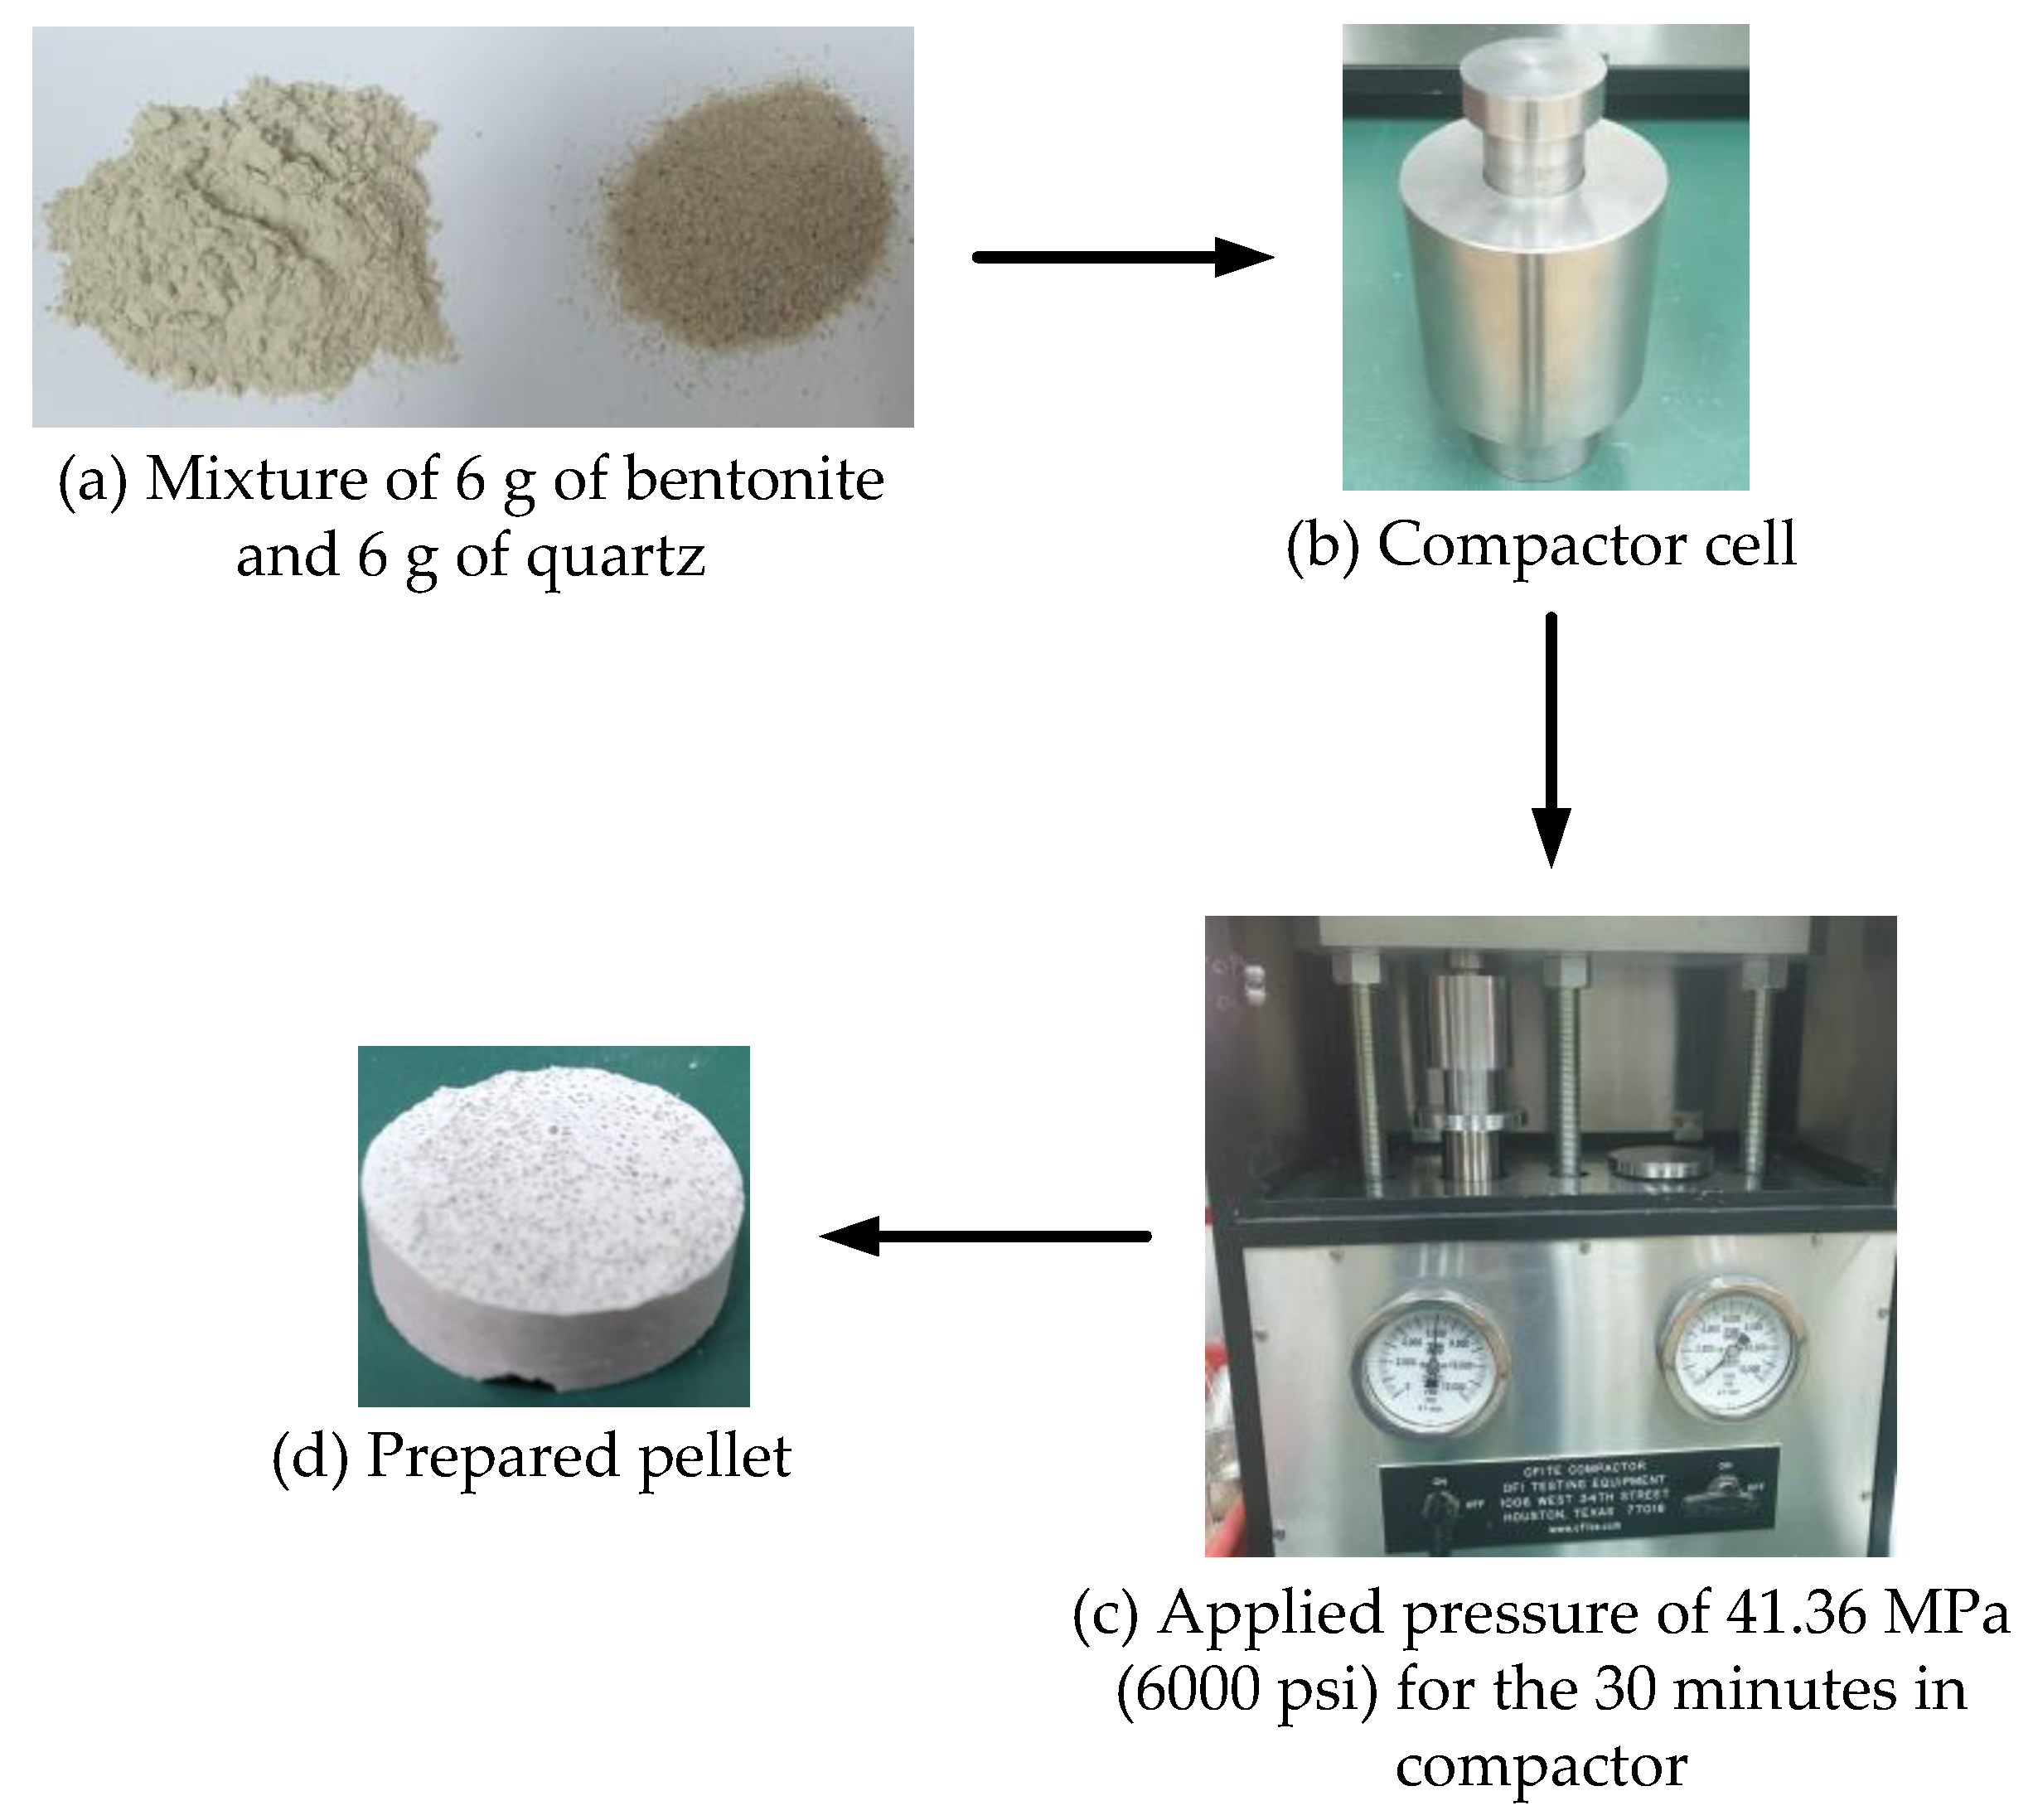
The preparation of quartz–bentonite pellets is shown in Figure 4. A mixture of 6 g of bentonite and 6 g of quartz (Figure 4a) was placed in a compactor cell (Figure 4b), which was then subjected to pressure of 41.36 MPa (6000 psi), which remained constant in the compactor for 30 min according to the manufacturer’s instructions (Figure 4c). At the end of compression time, the swelling of the prepared pellet (Figure 4d) was measured using a linear swell meter. The pressure at which the samples were compressed (41.36 MPa) was determined as a function of the type of clay formation that the specific pellets simulate, and the conditions to which the clay was subjected in the subsurface. Compression pressure can be identified as geostatic pressure applied on the clay formation at the considered depth. Assuming an average rock density of 2300 kg/m3, it is possible to calculate the geostatic pressure affecting the clay formation at a given depth. Therefore, compression pressure of 41.36 MPa (6000 psi) was selected because the objective of this study was to determine the effect of water-based drilling mud containing mandarin powder on the swelling properties of soft clay formations which are located at relatively shallow depths. The selected compression pressure value corresponds to the geostatic pressure value at a depth of about 1800 m.

Figure 4.
Preparation of quartz–bentonite pellets.
2.3. Preparation of Drilling Mud
All tested drilling-mud samples were prepared in accordance with the American Petroleum Institute Standards, API Specifications 13A and API 13B-1 [44]. To determine the effects of the adding MPP on filtration properties and clay swelling, nine drilling mud samples were prepared and subjected to laboratory testing:
- bentonite-based drilling mud (BM);
- four drilling mud samples containing different concentrations of MPP with particle size of less than 0.1 mm (marked A1–A4);
- four drilling mud samples containing different concentrations of MPP with particle size from 0.1 to 0.16 mm (marked B1–B4).
In 1000 mL of water, 60 g of bentonite was added and stirred for 20 min. To adjust the pH, 1 g NaOH was added, and bentonite-based drilling mud (BM) was prepared. To examine the effect of the particle size and its concentration on filtration properties and clay swelling, eight mud samples were tested with MPP (Table 2).
Table 2.
Composition of tested drilling-mud samples which contain MPP.
2.4. Laboratory Test Equipment and Test Procedures
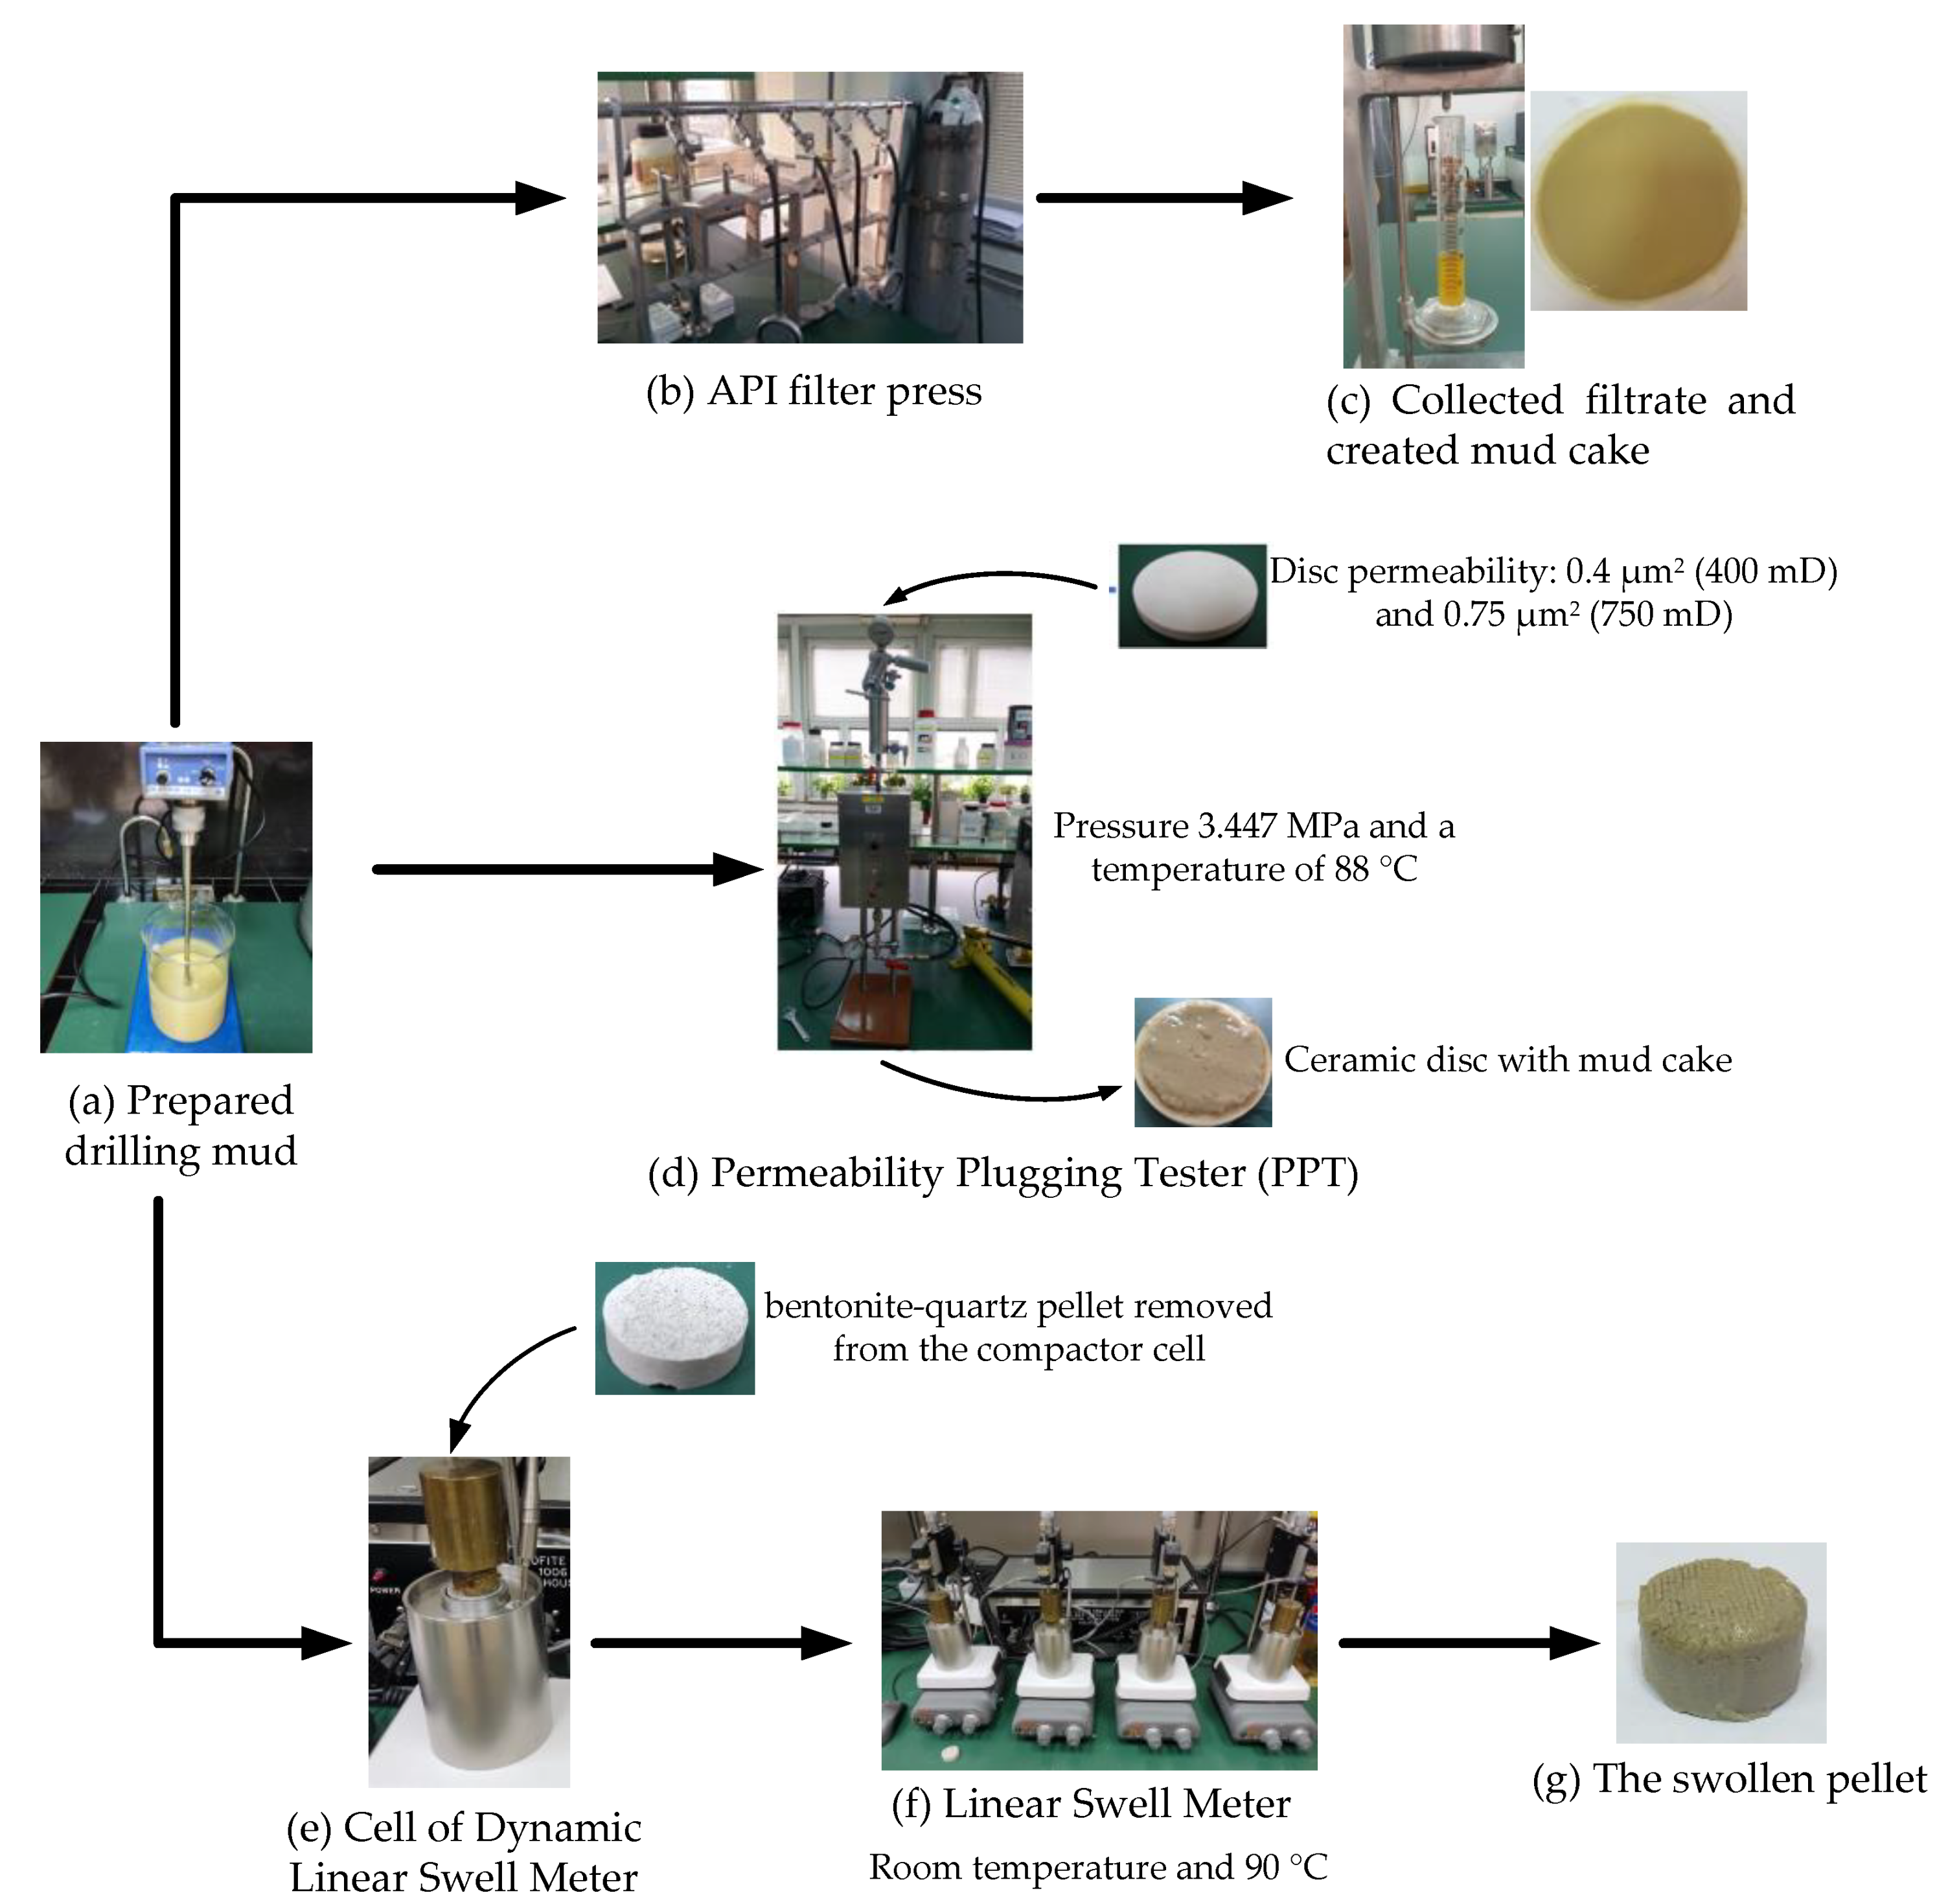
The used equipment and testing procedures are shown in Figure 5.

Figure 5.
Used equipment and test procedures.
The prepared drilling mud (Figure 5a) was poured into the cell of an API filter press (Figure 5b), and pressure of 0.6895 MPa (100 psi) was applied for a period of 30 min. The filtrate volume extracted from the drilling mud through a filter paper (Whatman No. 50, filter area 45.8 cm2) was collected in a laboratory beaker, while a mud cake was formed on the paper (Figure 5c). The collected filtrate volume is expressed as API filtration.
The capability of drilling mud to plug pores in a ceramic disc was determined using a permeability plugging tester (PPT) (Figure 5d) and ceramic discs with permeabilities of 0.4 μm2 (400 mD) and 0.75 μm2 (750 mD). The tests were performed at a differential pressure of 3.447 MPa and a temperature of 88 °C. During the test, the filtrate was collected in a measuring cylinder after 7.5 min and after 30 min. According to the manufacturer’s instructions, to calculate PPT filtration, the collected volume after 30 min must be multiplied by 2 (Equation (1)), while the volume of collected fluid before the formation of a drilling mud cake (spurt loss) is calculated by using Equation (2) [45]:
where PPT filtrate volume, mL; V7.5, fluid volume collected after 7.5 min, mL; V30, fluid volume collected after 30 min, mL; spurt loss, fluid volume collected before forming a drilling mud cake, mL.
PPT filtrate volume = 2∙V30
Spurt loss = 4∙V7.5 − 2∙V30
To determine their swelling, the bentonite–quartz pellets were removed from the compactor cell after the compression time of 30 min had elapsed, and placed in the dynamic linear swell meter cell (Figure 5e). The swelling test for each pellet in the selected drilling mud was designed and run for 24 h in the linear swell meter (Figure 5f). In the first case, the swelling of the pellets was determined at room temperature. To determine the effect of temperature on pellet swelling, in the second case, pellet swelling at 90 °C was determined. After 24 h, the swollen pellet was removed from the cell of the dynamic linear swell meter (Figure 5g).
3. Results
Table 3 shows the results of API filtration measurements for the nine tested mud samples. From the presented results, it can be concluded that API filtration decreased with the increasing concentration of MPP. A significant reduction in filtration (from 18 to 13.5 mL) was observed by adding MPP particles less than 0.10 mm at the smallest tested concentration of 0.5% by volume of water (A1), while a significant reduction was achieved at a concentration of 1% by volume of water (B2) by adding larger particles from 0.1 to 0.16 mm (from 18 to 13 mL). The largest decrease in API filtration was gained for larger MPP particles ranging in size from 0.1 to 0.16 mm, added at a concentration of 2% by volume of water (B4), and was 10 mL compared to the measured API filtration of the base mud (18 mL). The thickness of the mud cake, regardless of the concentration of MPP, was slightly decreased by the addition of MPP in comparison with the thickness of the mud cake measured with BM (1.5 mm).
Table 3.
Influence of adding MPP on API filtration [46].
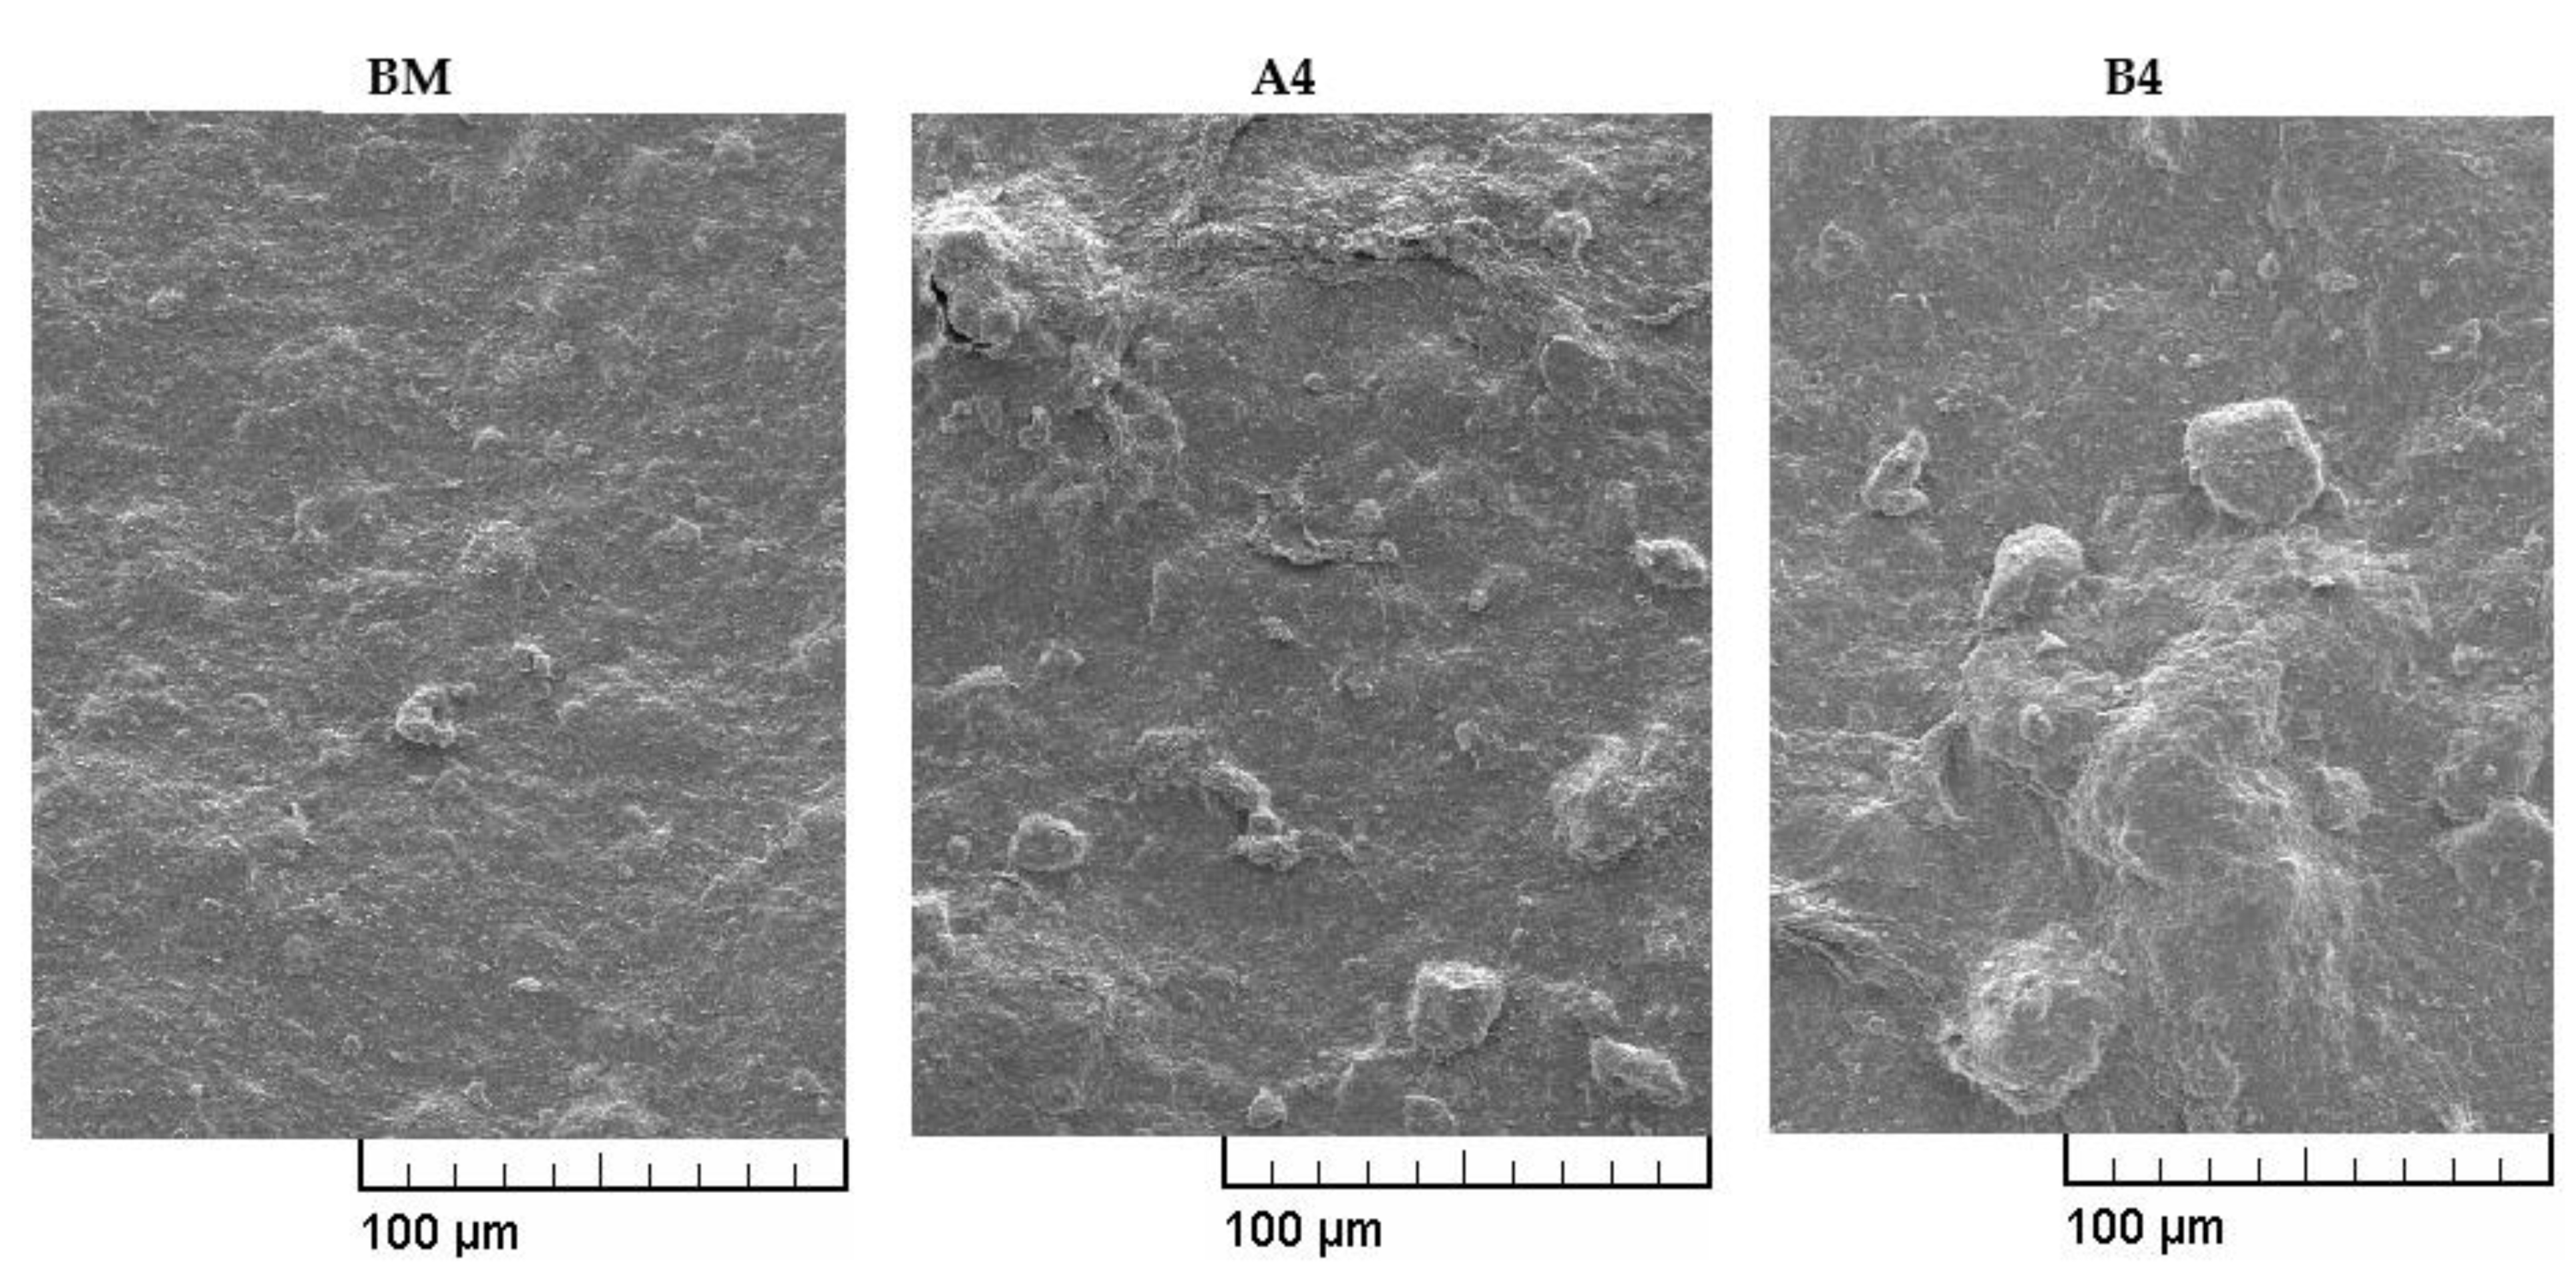
A certain amount of mandarin powder obtained from mandarin peel dissolved in water [47], which led to an increase in the viscosity of the filtrate, contributing to a decrease in filtration value. In addition, the MPP was assumed to plug the pores in the mud cake, further reducing filtration. Figure 6 shows SEM images of the mud cakes obtained after API filtration of base mud (BM), and two mud samples containing different sizes of MPP at a concentration of 2% by volume of water (A4 and B4 mud samples).
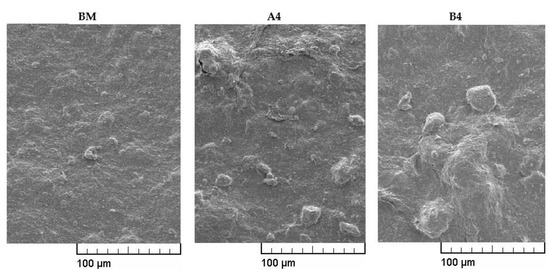
Figure 6.
SEM images of mud cakes obtained after API filtration of BM (A4 and B4).
Figure 6 shows the relief surfaces of the mud cake without the indicated pores. It can be seen that for BM the surface is quite uniform with no significant change in texture, while for muds containing MPP, larger accumulations are observed over the entire surface, which are presumably mandarin particles filling small pores in the created mud cake, resulting in a significant decrease in API filtration values.
Table 4 summarizes the data of the PPT filtration measurements for both mud samples containing 1% (A2 and B2) and 2% (A4 and B4) of MPP by volume of water.
Table 4.
Influence of adding MPP on PPT filtration.
The results for filtration through a 0.4 μm2 (400 mD) ceramic disc showed a significant decrease in PPT filtrate volume after 30 min for mud A2 (30 mL) containing MPP with a size less than 0.10 mm at a concentration of 1% by volume of water related to the results obtained for BM (52 mL), while twice the concentration of MPP (2% by volume of water) does not result in a significantly greater reduction in PPT filtrate volume (mud A4, 26 mL).
For mud containing MPP with particles size from 0.10 to 0.16 mm, the PPT filtration volume after 30 min for mud containing MPP at a concentration of 1% by volume of water (B2) was similar (32 mL) to mud containing particles less than 0.10 mm (30 mL). At a concentration of 2% by volume of water (B4), PPT filtration was similar (24 mL) to mud containing particles less than 0.10 mm (26 mL).
Spurt loss is significantly lower for mud samples containing MPP less than 0.10 mm in size for both tested concentrations (A2 and A4) (2 and 4 mL) compared to those measured with BM (8 mL). For mud samples containing particles from 0.10 to 0.16 mm, at a concentration of 1% by volume of water (B2), spurt loss decreased in relation to BM, but was still slightly higher (6 mL) than the values obtained for mud samples containing particles less than 0.10 mm (A2 and A4). At a concentration of 2% by volume of water (B2), spurt loss was considerably lower (4 mL) in comparison to values measured with BM (8 mL).
Filtration through a 0.75 μm2 (750 mD) ceramic disc showed a significant decrease in filtration volume after 30 min for mud containing MPP less than 0.10 mm at a concentration of 1% by volume of water (A2) (37 mL), related to values measured with BM (52 mL). In contrast to the measurement through a 0.4 μm2 (400 mD) ceramic disc, increasing the concentration to 2% by volume of water significantly reduced PPT filtration (22 mL with A4). For mud samples containing particles from 0.10 to 0.16 mm, a similar trend was observed as that for mud samples containing particles less than 0.10 mm, with a slightly greater decrease in the value of PPT filtration (35 and 20 mL (B muds) compared to 37 and 22 mL (mud samples A)).
Spurt loss was significantly lower for mud samples containing MPP less than 0.10 mm in size at a concentration of 2% by volume of water (A4) (10 mL) compared to values measured with BM (16 mL). For muds containing particles from 0.10 to 0.16 mm, a similar trend was observed as for muds containing particles smaller than 0.10 mm, with a slightly larger decrease in the value of spurt loss (7 and 4 mL (mud samples B)) compared to 13 and 10 mL (A muds)).
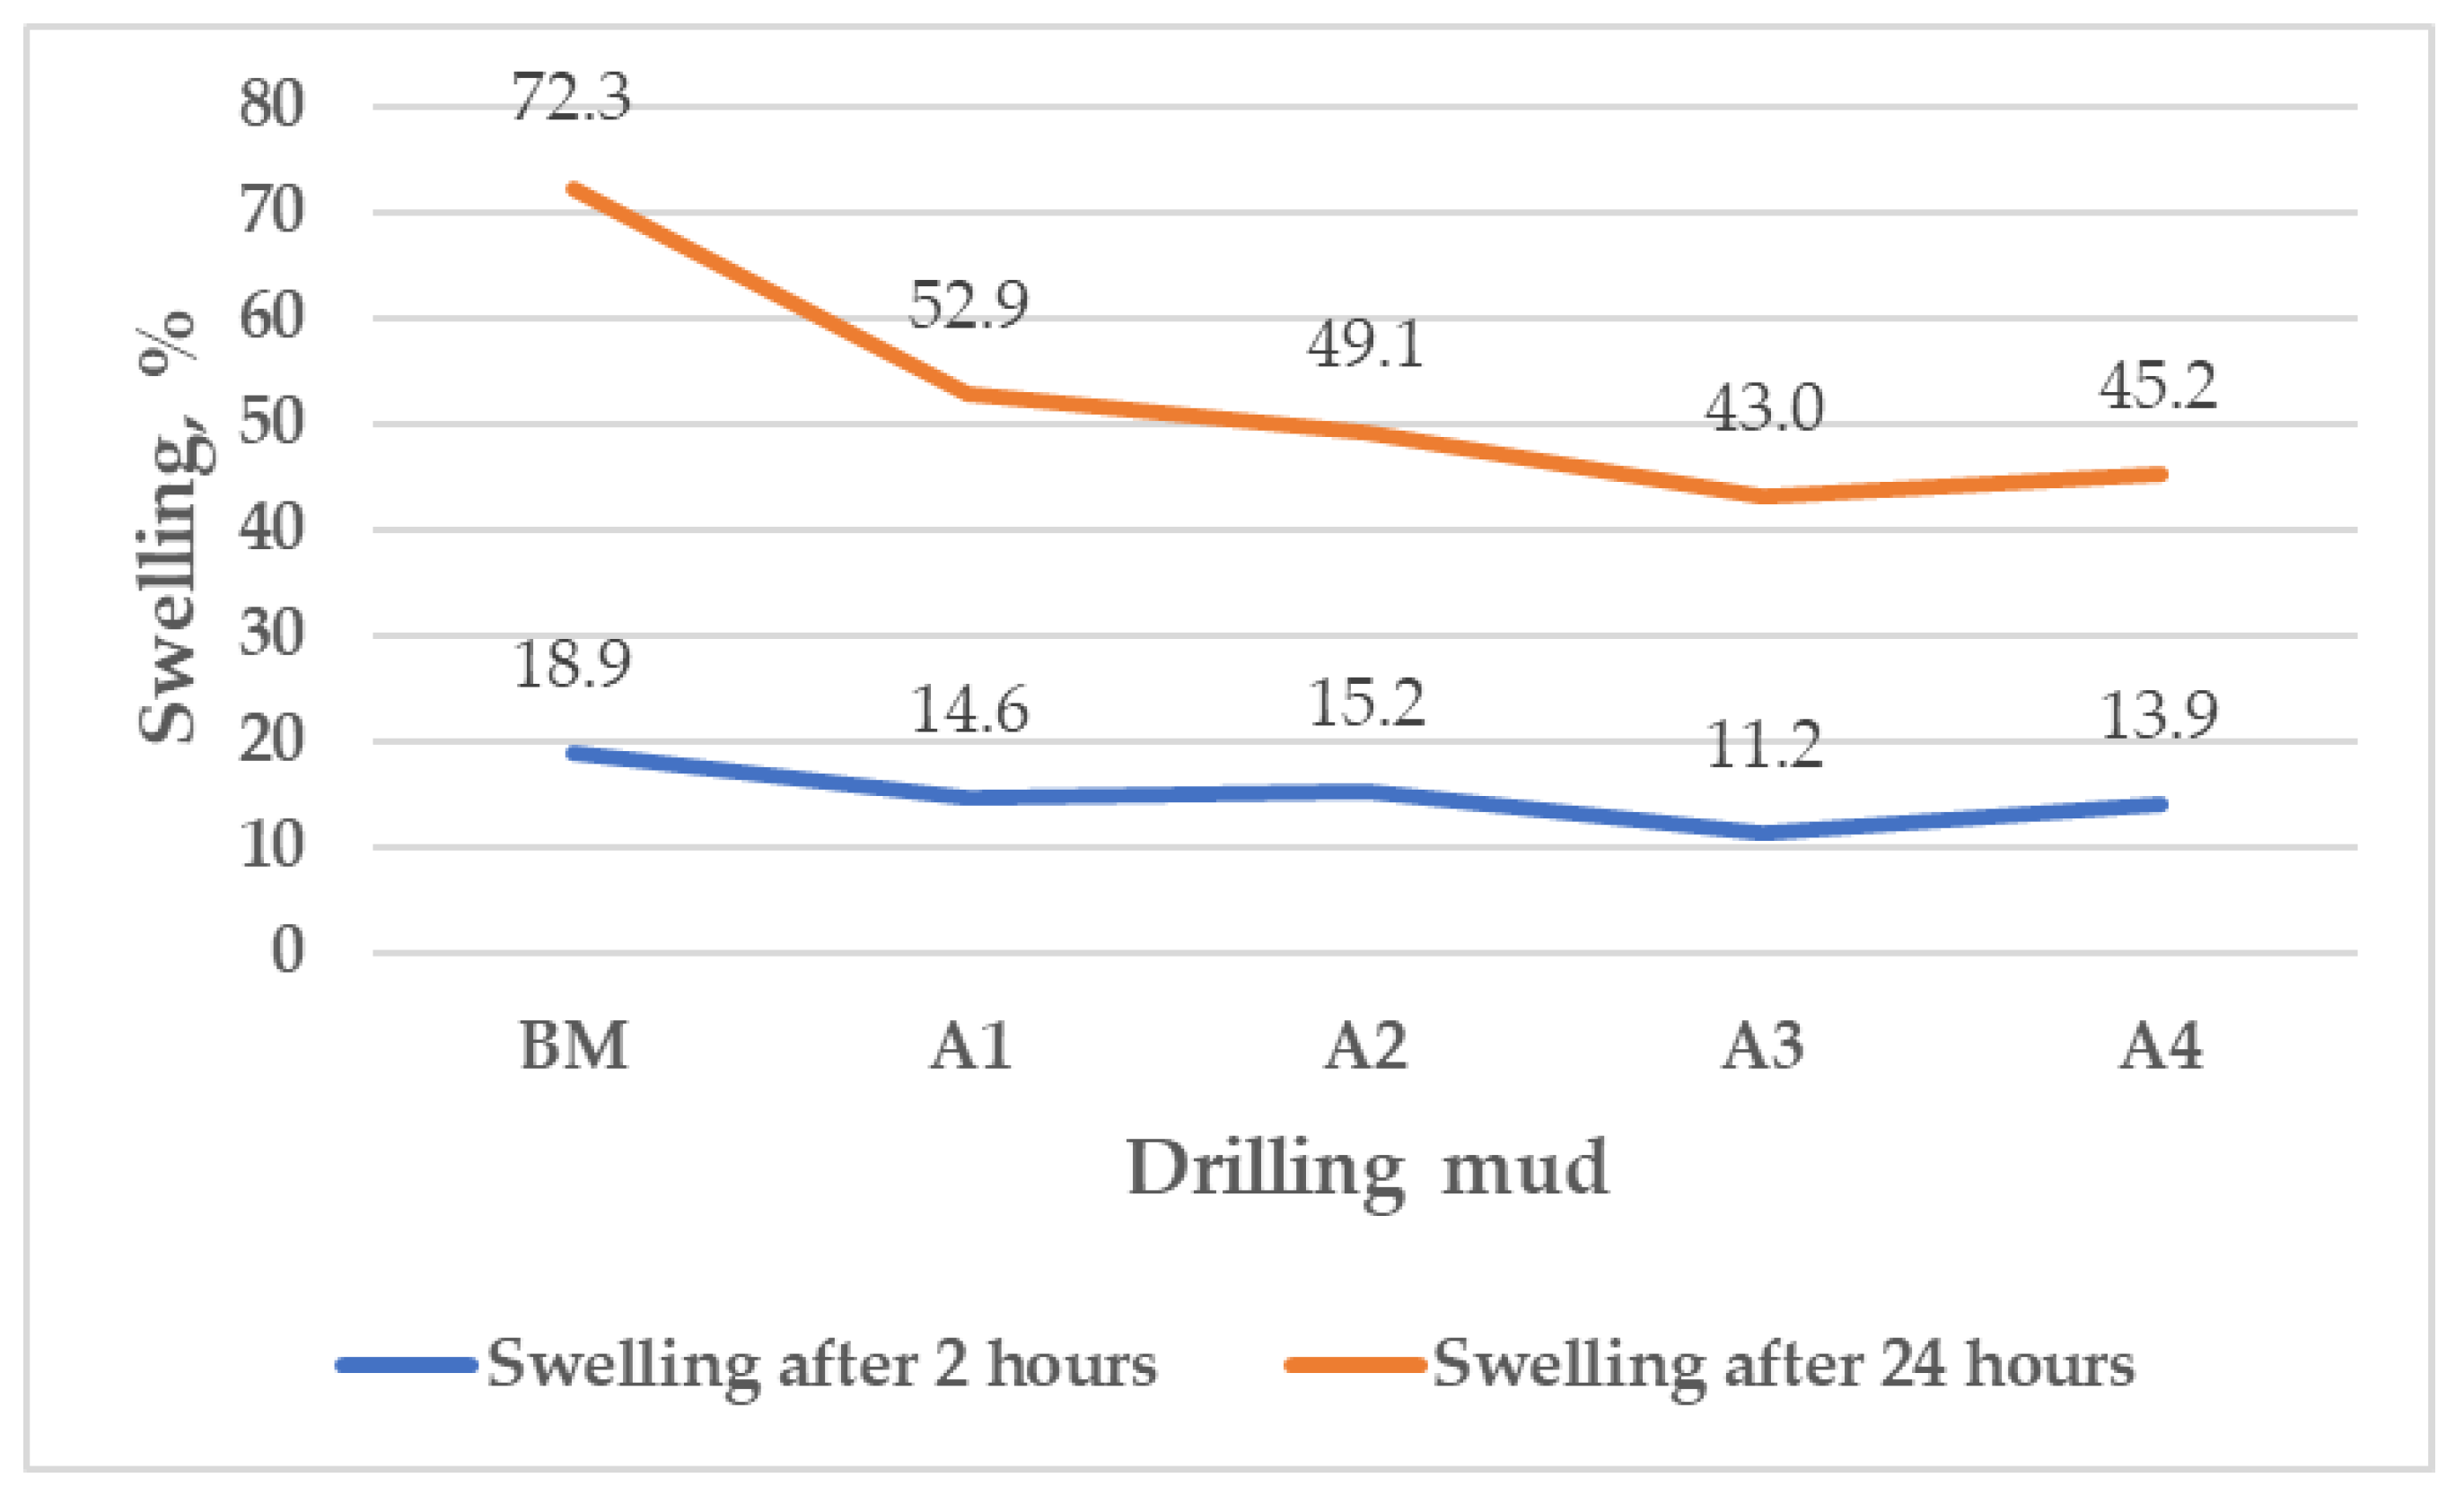
Figure 7 shows the swelling of the pellets in the base mud (BM) and in mud samples with added MPP (particles less than 0.1 mm) within 2 and 24 h (mud samples A1–A4) at room temperature.

Figure 7.
Pellet swelling in base mud and in mud with added MPP (particles less than 0.1 mm) within 2 and 24 h at room temperature.
After 2 h, the swelling of the pellets in the different formulations of mud A was reduced regardless of the concentration of MPP, and ranged from 11.2% to 15.2% compared to the swelling of the pellets in the base mud (18.9%). After 24 h, pellet swelling was also reduced regardless of MPP concentration, and ranged from 43% to 52.9% compared to pellet swelling in the base mud (72.3%). With the addition of MPP, pellet swelling was 52.9% at the lowest tested concentration of 0.5% by volume of water (A1), while increasing the concentration up to 2% did not express the same intensity of pellet-swelling decrease. Moreover, a slight increase of 2.2% in pellet swelling (from 43% (A3) to 45.2% (A4)) was observed after the addition of MPP at a higher concentration than 1.5% by volume of water.
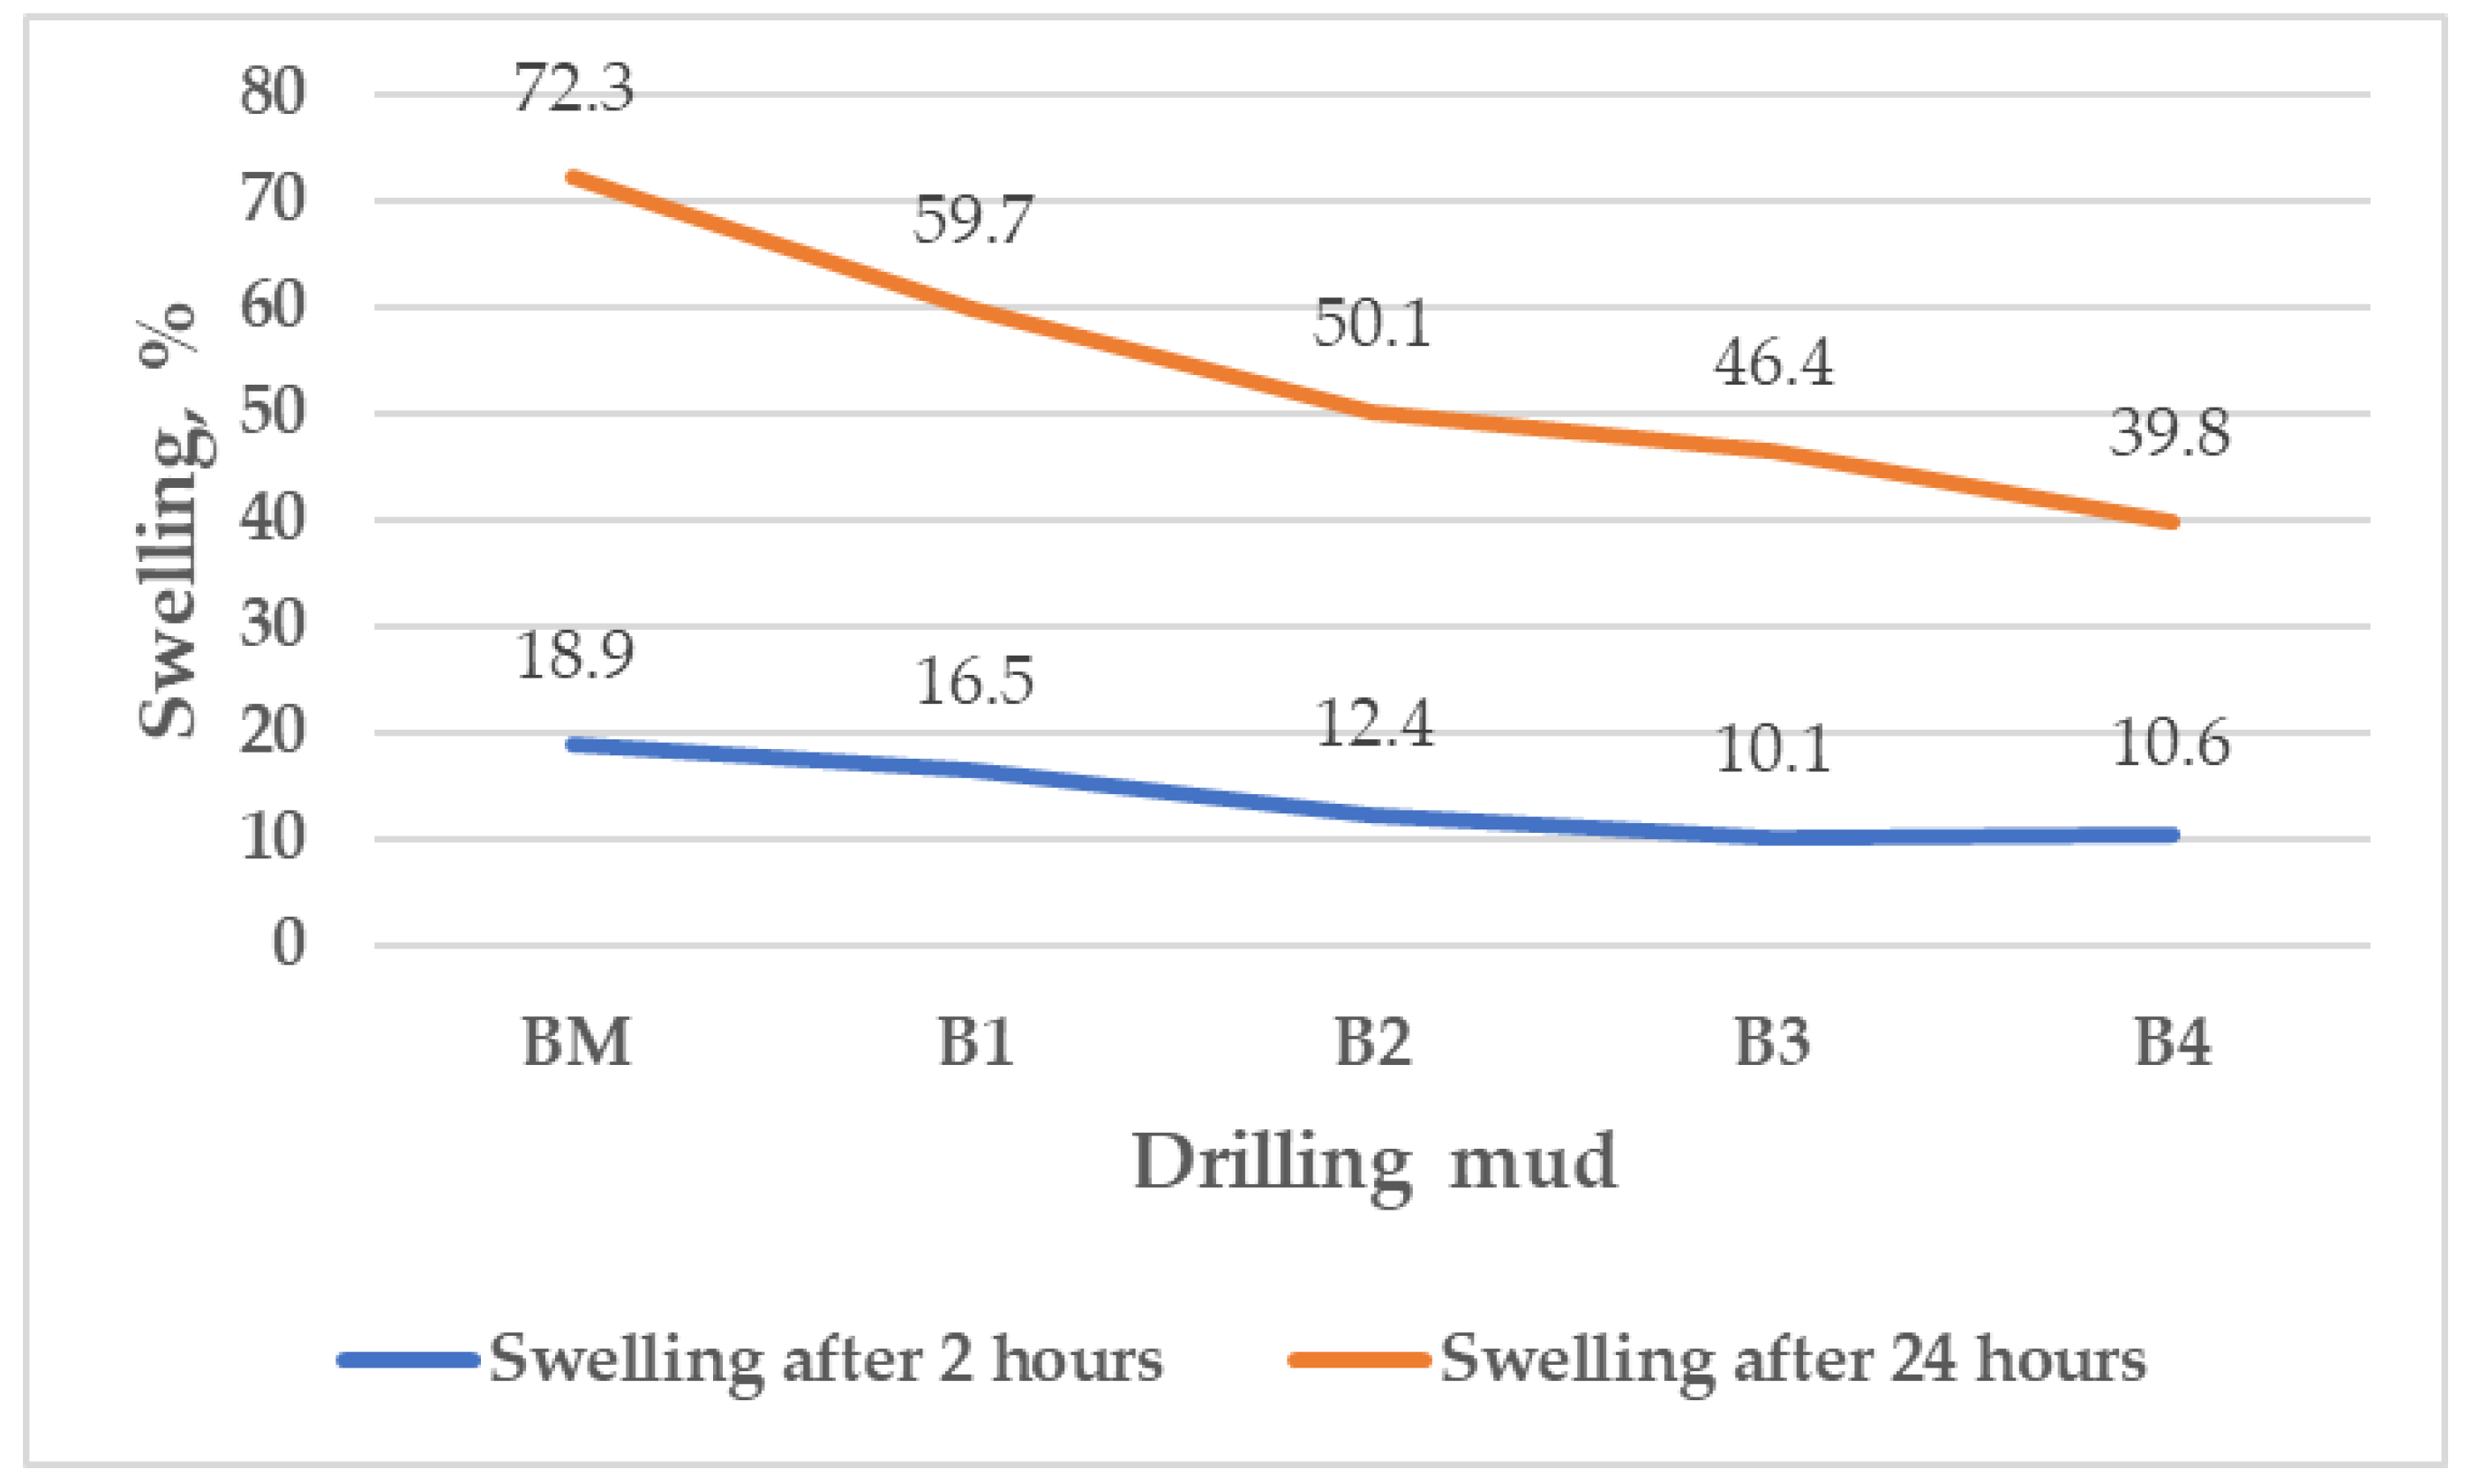
Figure 8 shows the swelling of the pellets in the base mud (BM) and in muds with added MPP (particles from 0.10 to 0.16 mm) within 2 and 24 h (mud samples B1–B4) at room temperature.
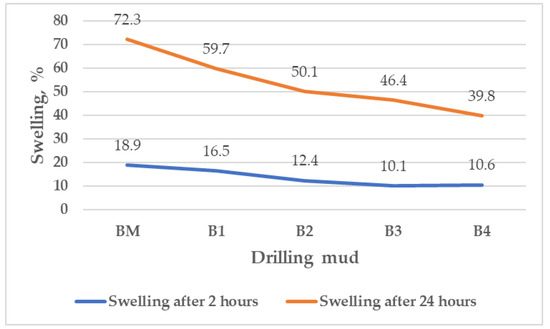
Figure 8.
Pellet swelling in base mud and in mud with added MPP (particles from 0.1 to 0.16 mm) within 2 and 24 h at room temperature.
After 2 h, the swelling of the pellets in the different formulations of mud B was reduced regardless of the concentration of MPP and ranged from 10.1% to 16.5% compared to the swelling of the pellets in the base mud (18.9%). After 24 h, pellet swelling was also reduced regardless of the concentration of MPP, and ranged from 39.8% to 59.7% compared to pellet swelling in the base mud (72.3%). When MPP was added at a concentration of 0.5% by volume of water (B1), the measured swelling was 59.7%. A concentration of MPP of 1% by volume of water and above is required to significantly reduce pellet swelling, ranging from 50.1% for mud B2 to the best result (39.8%) obtained for a mud containing 2% of MPP by volume of water (B4).
Figure 9 shows the swelling of the pellets in the base mud (BM) and in mud with added MPP (particles less than 0.10 mm) within 2 and 24 h (mud samples A1–A4) at 90 °C.
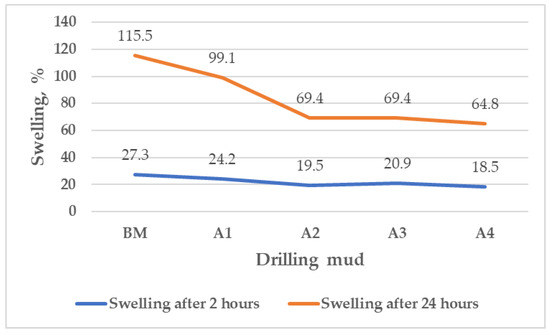
Figure 9.
Pellet swelling in base mud and in mud with added MPP (particles less than 0.1 mm) within 2 and 24 h at 90 °C.
After 2 h, the swelling of the pellets was lower regardless of the concentration of MPP, ranging from 18.5% to 24.2% compared to the swelling of the pellets in the base mud (27.3%). After 24 h, the swelling of the pellets was also decreased regardless of the concentration of the MPP, and ranged from 64.8% (A4) to 99.1% (A1) compared to the swelling in the base mud (115.5%). Increasing the concentration of MPP from 0.5% (A1) to 1% by volume of water (A2), pellet swelling continued to decrease (from 99.1% (A1) to 69.4% (A2)), but this trend did not continue with the same intensity with a further increase in MPP concentration, so the pellet swelling was 69.4% (A3) and 64.8% (A4).
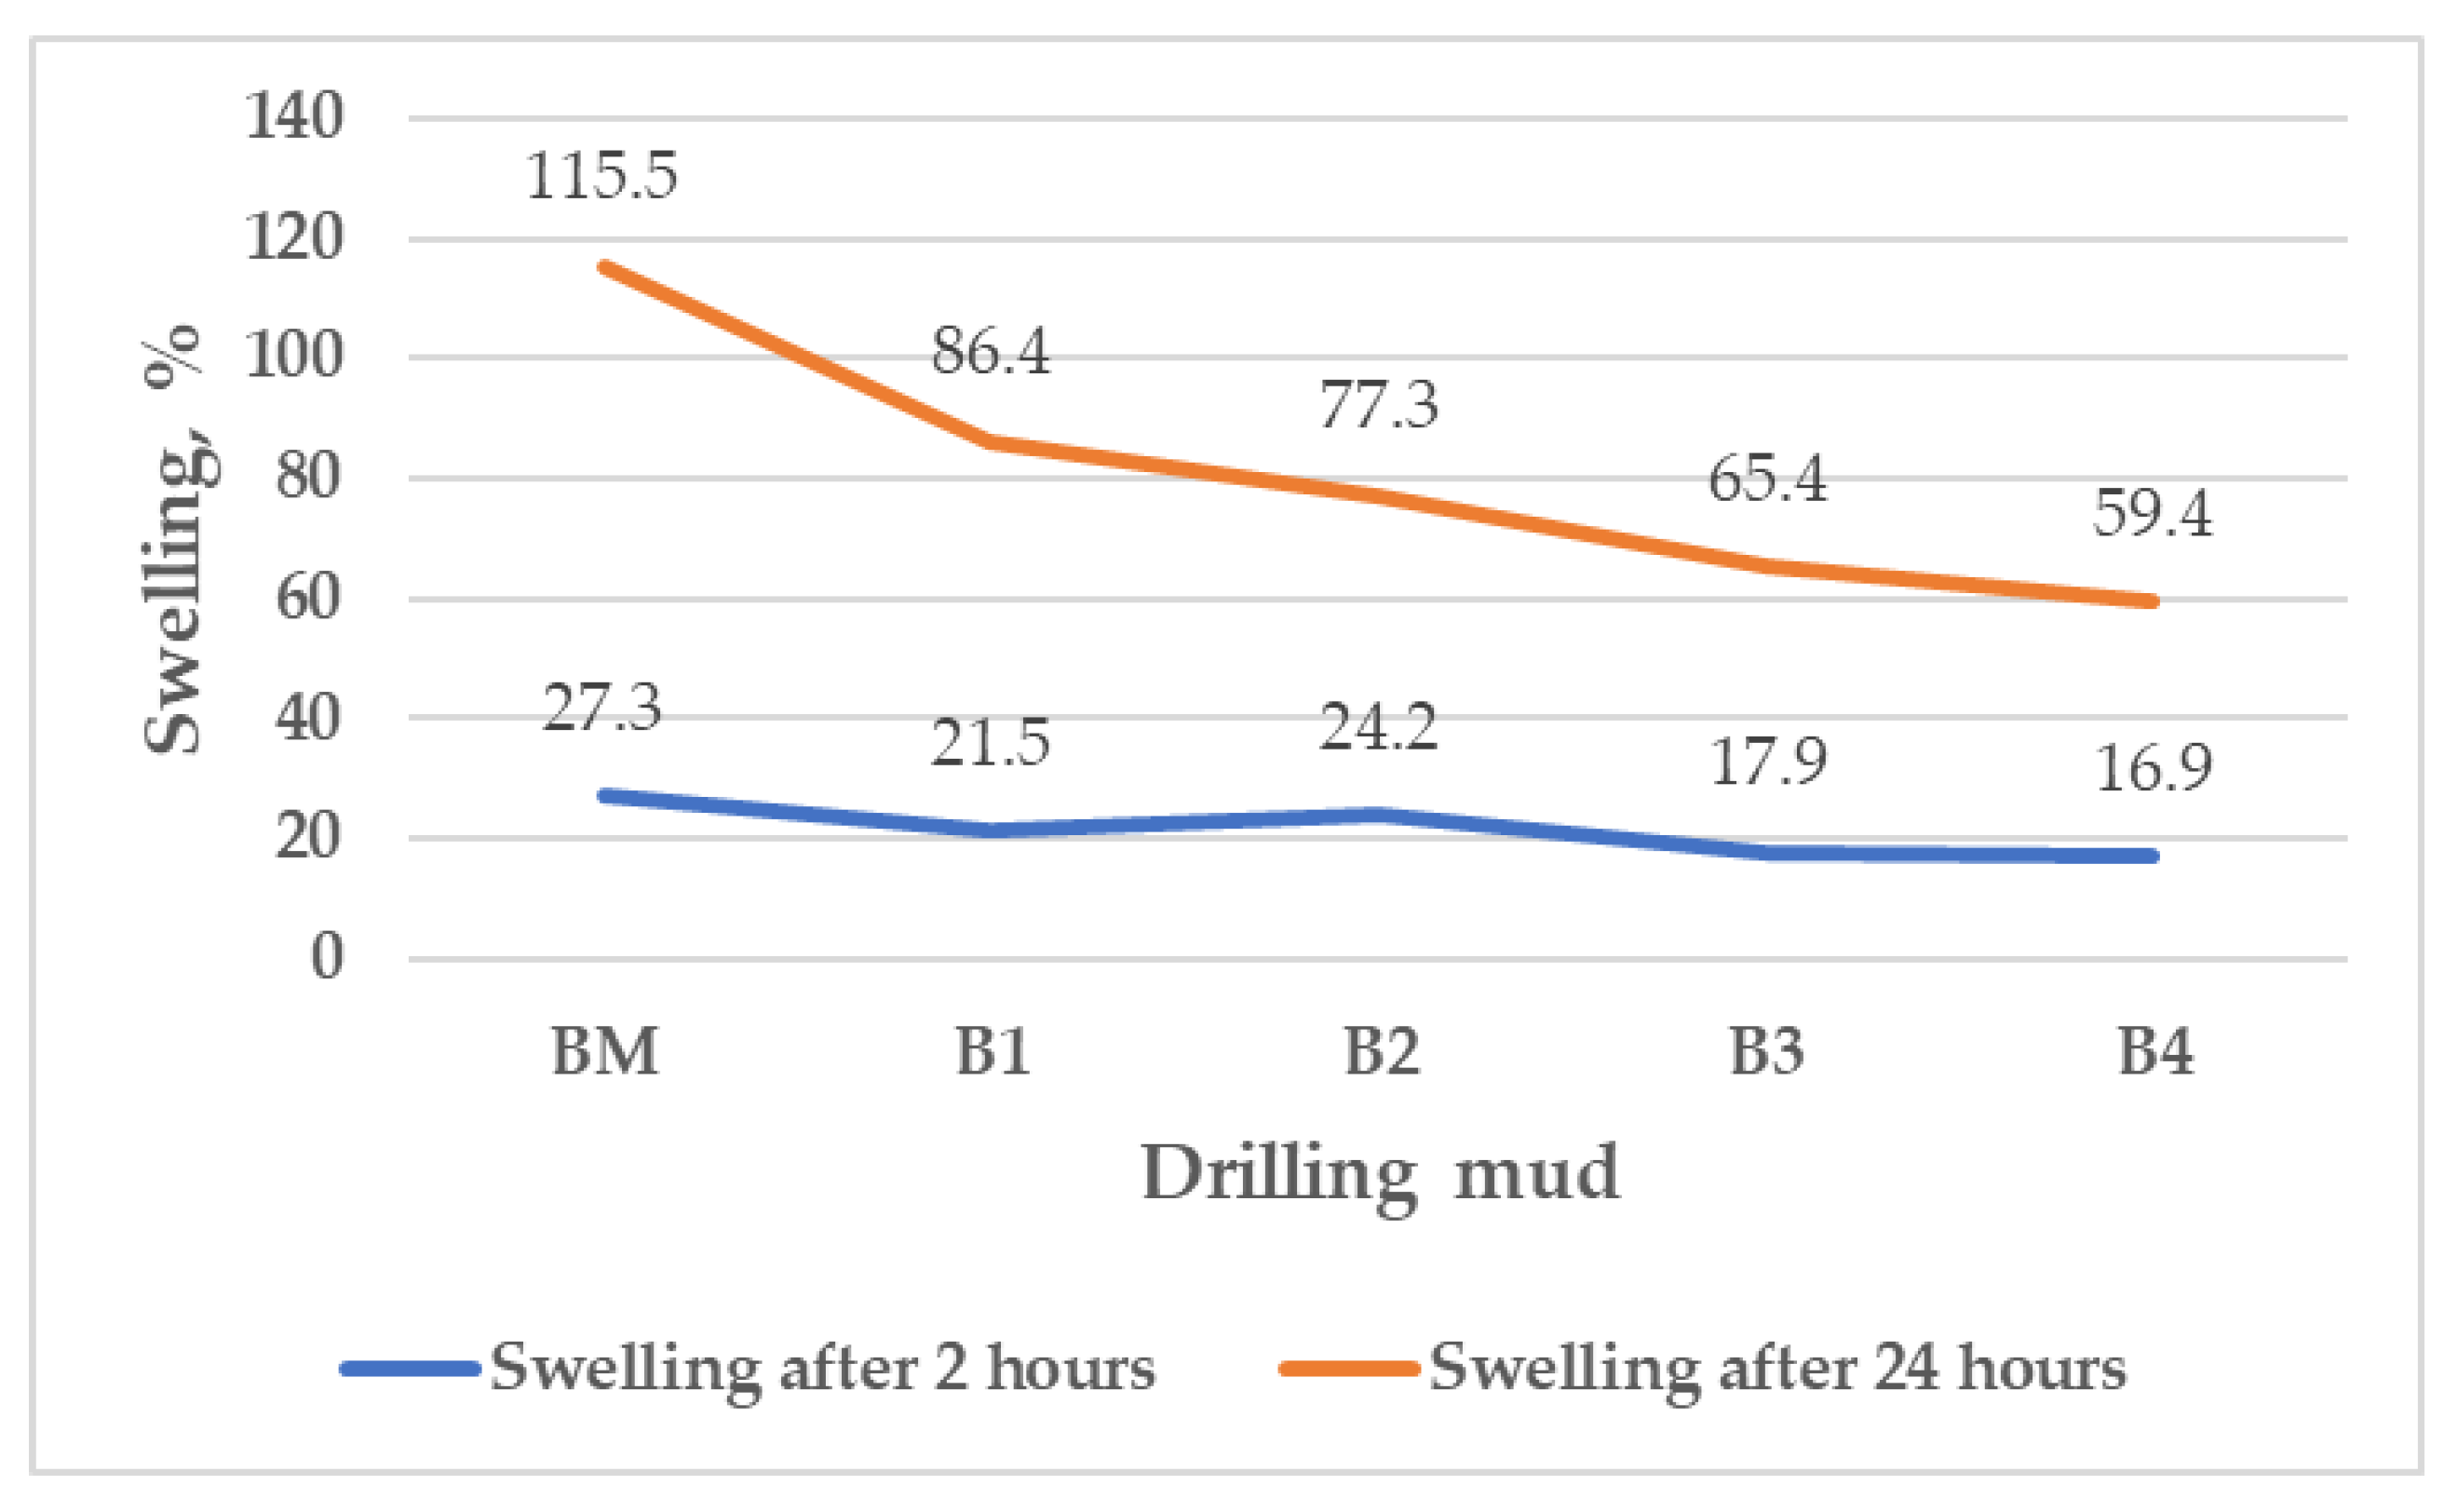
Figure 10 shows pellet swelling in the base mud (BM) and in muds with added MPP (particles from 0.10 to 0.16 mm) within 2 and 24 h (mud samples B1–B4) at 90 °C.
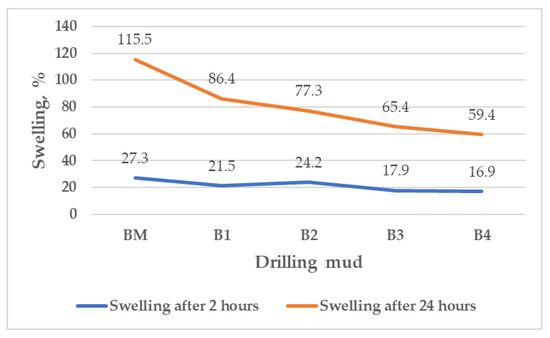
Figure 10.
Pellet welling in base mud and in mud with added MPP (particles from 0.10 to 0.16 mm) within 2 and 24 h at 90 °C.
After 2 h, the swelling of the pellets in the different formulations of mud B was reduced regardless of the concentration of MPP, and ranged from 16.9% (B4) to 24.2% (B2) compared to the swelling of the pellets in the base mud (27.3%). After 24 h, the swelling of the pellets also decreased regardless of the concentration of MPP, and ranged from 59.4% (B4) to 86.4% (B1) compared to the swelling of the base mud (115.5%). As the concentration of MPP increased, the swelling of the pellets continuously and significantly decreased, from 86.4% (B1) to 59.4% (B4).
4. Discussion
To determine the effect of MPP on filtration properties and pellet swelling, all results were compared. From the data shown in the Table 5, reduction in API filtration was evident for all tested mud samples relative to API filtration measured with the base mud (BM), expressed as a percentage.
Table 5.
Decrease in API filtration, PPT filtration, and spurt loss for all tested mud samples in regard to base mud (BM).
Comparing measured API filtration results with both particle sizes at the same concentrations of MPP, at higher concentrations (1% by volume of water and above) better results were obtained, with powder having larger particles (from 0.10 to 0.16 mm), while at low concentrations (0.5% by volume of water), better results were achieved with MPP having smaller particles than 0.10 mm.
Regardless of the permeability of the disc used in the tests (0.4 or 0.75 μm2), a positive effect of the addition of mandarin powder on the PPT filtration of the mud was observed, since its value decreased significantly in all cases compared to the values obtained with the base mud (BM).
A comparison of PPT filtration results measured with both particle sizes at the same concentrations of MPP through a 0.4 μm2 (400 mD) ceramic disc shows that, at a concentration of 1% by volume of water, slightly better results were obtained with MPP with particles less than 0.10 mm (42.31% compared to 38.46%), while at a concentration of 2% by volume of water, slightly better results were obtained with MPP with particles from 0.10 to 0.16 mm (53.85% compared to 50%). At a concentration of 1% by volume of water, results of spurt loss for mud samples containing MPP particles less than 0.10 mm were significantly better (75% reduction) than the results for mud samples containing MPP particles from 0.10 to 0.16 mm (25%). At a concentration of 2% by volume of water, regardless of MPP size, the reduction in spurt loss was similar (50%).
Comparing the PPT filtration results measured with both particle sizes at the same concentrations of MPP through a 0.75 μm2 (750 mD) ceramic disc, it is shown that slightly better results were obtained with MPP particles from 0.10 to 0.16 mm (32.69% compared to 28.85% at a concentration of 1% by volume of water and 61.54% compared to 57.69% at a concentration of 2% by volume of water). The same trend was observed in determining the value of spurt loss, with significantly better results obtained with powders with particles from 0.10 to 0.16 mm (56.25% related to 18.75% at a concentration of 1% by volume of water and 75% related to 37.75% at a concentration of 2% by volume of water).
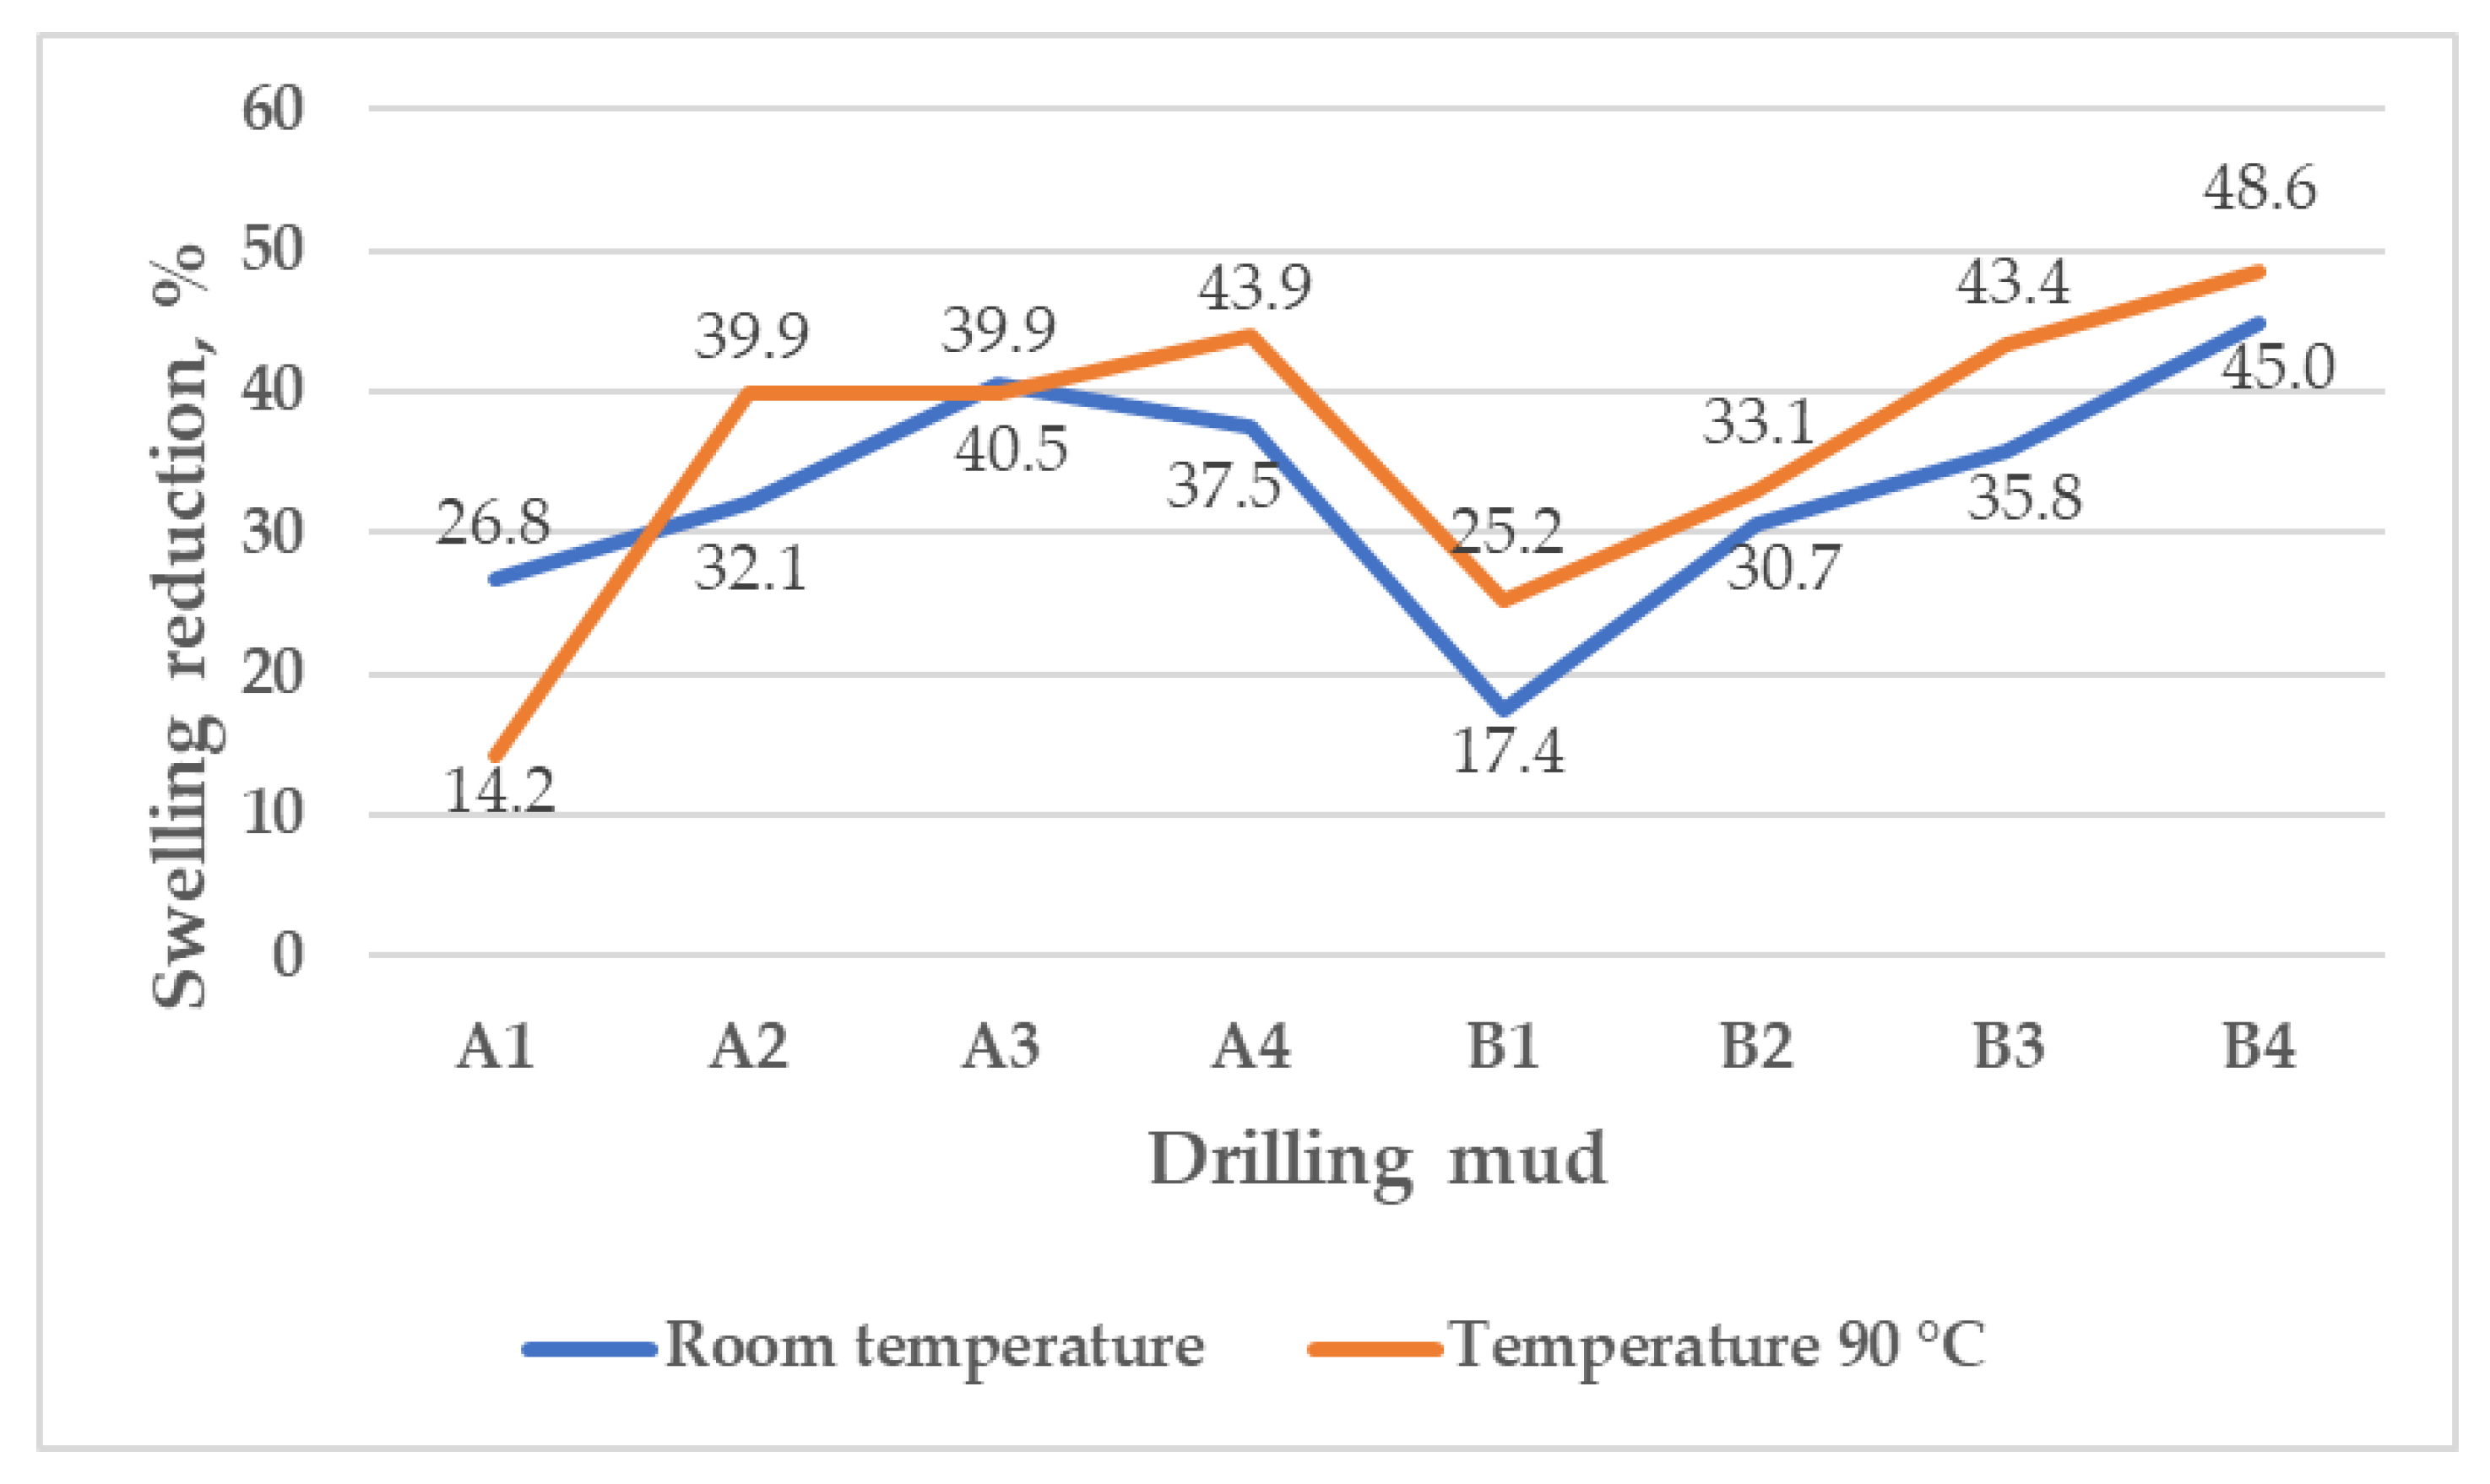
Figure 11 shows the pellet swelling reduction in mud samples with added MPP within 24 h related to the pellet swelling measured with the base mud at room temperature and 90 °C, expressed as a percentage.
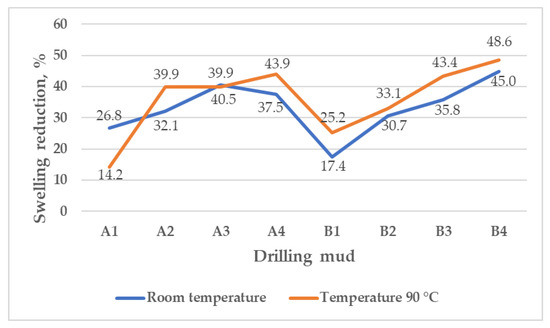
Figure 11.
Pellet swelling reduction in different mud samples with added MPP in regard to base mud (BM) within 24 h.
Regardless of the concentration of MPP and particle size, a decrease in pellet swelling between 17.4% (B1) and 45% (B4) was observed at room temperature, and a decrease in swelling between 14.2% (A1) and 48.6% (B4) was determined at 90 °C. When the concentration of MPP increased, the reduction in pellet swelling increased for mud samples containing particles from 0.1 to 0.16 mm (mud samples B1–B4), from 17.4% (B1) at a concentration of 0.5% by volume of water up to 45% measured with mud B4 containing 2% by volume of water at room temperature. At 90 °C, results were similar to those measured at room temperature, but the reduction in pellet swelling was slightly greater, from 25.2% (B1) to 48.6% (B4).
At room temperature, a similar trend was observed in measurements with mud containing MPP particles less than 0.10 mm (mud samples A1–A4), with one exception. The greatest reduction in swelling was observed for mud A3, containing MPP at a concentration of 1.5% by volume of water (40.5%). However, at a concentration of 2% by volume of water (A4), the reduction in pellet swelling was less than that (37.5%), indicating that it is not necessary to increase the concentration of MPP beyond 1.5% by volume of water. At 90 °C, the reduction in pellet swelling at a concentration of MPP of 1% by volume of water or more was similar (from 39.9% to 43.9%); at a low concentration of 0.5% by volume of water (A1; 14.2%), a slightly lower value of reduction in pellet swelling was observed compared to the reduction measured at room temperature (26.8%).
Although this research shows that the best results were obtained at higher concentrations of MPP (1.5% and 2% by volume of water), the effects on other properties of the drilling mud, especially rheology, need to be further studied to determine the potential of these muds for adequate wellbore cleaning. Considering that satisfactory results were also obtained at lower concentrations (up to 1% by volume of water), it is necessary to select those concentrations that had a satisfactory effect on API filtration and shale swelling, but that also present other adequate properties to allow for the wellbore to be safely drilled while reducing the negative environmental impact of drilling mud.
5. Conclusions
On the basis of laboratory tests, the following conclusions can be drawn:
- MPP added to water-based mud reduces API filtration, PPT filtration, spurt loss, and pellet swelling regardless of particle size and concentration;
- the best results were obtained by adding MPP with particles from 0.10 to 0.16 mm at a concentration of 2% by volume of water;
- a 44% reduction in API filtration was achieved with mud B4 containing MPP particles from 0.10 to 0.16 mm at a concentration of 2% by volume of water;
- a 61.54% reduction in PPT filtration through a 0.75 μm2 (750 mD) ceramic disk was achieved with mud B4 containing MPP particles from 0.10 to 0.16 mm at a concentration of 2% by volume of water;
- a 53.85% reduction in PPT filtration through a 0.4 μm2 (400 mD) ceramic disk was achieved with mud B4 containing MPP particles from 0.10 to 0.16 mm at a concentration of 2% by volume of water;
- a 45% reduction in pellet swelling after 24 h was measured with mud B4 containing MPP particles from 0.10 to 0.16 mm at a concentration of 2% by volume of water at room temperature;
- a 48.6% reduction in pellet swelling after 24 h was obtained with mud B4 containing MPP particles from 0.10 to 0.16 mm added at a concentration of 2% by volume of water at 90 °C;
- satisfactory results were obtained up to a MPP concentration of 1% by volume of water;
- the swelling reduction results correlated very well with the API filtration reduction results.
In general, it can be concluded that the addition of MPP to the drilling mud can increase wellbore stability. However, further measurements of the properties of the drilling mud are necessary to determine the optimal concentration that ensures adequate mud properties for the safe drilling of the well.
Author Contributions
I.M., created the idea for the paper, provided laboratory testing, wrote the draft version of paper, and the discussion and conclusion sections; N.G.-M., wrote the results section and reviewed the whole paper; B.P., prepared the introduction section and tables; P.M., provided laboratory testing, and prepared the introduction section and figures. All authors have read and agreed to the published version of the manuscript.
Funding
The dissemination process is financially supported by the University of Zagreb within the project “Circular economy in petroleum engineering” (In Croatian: Kružna ekonomija u naftnom inženjerstvu—KENI).
Institutional Review Board Statement
Not applicable.
Informed Consent Statement
Not applicable.
Data Availability Statement
Data available in a publicly accessible repository.
Conflicts of Interest
The authors declare no conflict of interest.
References
- Khodja, M.; Canselier, J.P.; Bergaya, F.; Fourar, K.; Khodja, M.; Cohaut, N.; Benmounah, A. Shale Problems and Water-Based Drilling Fluid Optimisation in the Hassi Messaoud Algerian Oil Field. Appl. Clay Sci. 2010, 49, 383–393. [Google Scholar] [CrossRef] [Green Version]
- Albooyeh, M.; Kivi, I.R.; Ameri, M. Promoting wellbore stability in active shale formations by water-based muds: A case study in Pabdeh shale, Southwestern Iran. J. Nat. Gas Sci. Eng. 2018, 56, 166–174. [Google Scholar] [CrossRef]
- Pašić, B.; Gaurina-Međimurec, N.; Mijić, P.; Medved, I. Experimental research of shale pellet swelling in nano-based drilling muds. Energies 2020, 13, 6246. [Google Scholar] [CrossRef]
- Labenski, F.; Reid, P.; Santos, H. Drilling Fluids Approaches for Control of Wellbore Instability in Fractured Formations. In Proceedings of the SPE/IADC Middle East Drilling Technology Conference & Exhibition, Abu Dhabi, United Arab Emirates, 20–22 October 2003. [Google Scholar]
- Osuji, C.E.; Chenevert, M.E.; Sharma, M.M. Effect of Porosity and Permeability on the Membrane Efficiency of Shales. In Proceedings of the SPE Annual Technical Conference and Exhibition, Denver, CO, USA, 21–24 September 2008. [Google Scholar]
- Qu, Y.; Lai, X.; Zou, L.; Su, Y. Polyoxyalkyleneamine as Shale Inhibitor in Water-Based Drilling Fluids. Appl. Clay Sci. 2009, 44, 265–268. [Google Scholar] [CrossRef]
- Gaurina-Međimurec, N.; Pašić, B. Risk Due to Wellbore Instability. In Risk Analysis for Prevention of Hazardous Situations in Petroleum and Natural Gas Engineering; Matanović, D., Gaurina-Međimurec, N., Simon, K., Eds.; IGI Global: Hershey, PA, USA, 2014; pp. 23–46. [Google Scholar]
- Pašić, B.; Međimurec, N.G.; Matanović, D. Wellbore instability: Causes and consequences. Rud.-Geološko-Naft. Zb. 2007, 19, 87–98. [Google Scholar]
- Ballard, T.J.; Beare, S.P.; Lawless, T.A. Fundamentals of Shale Stabilization: Water Transport through Shales. SPE Form. Eval. 1994, 9, 129–134. [Google Scholar] [CrossRef]
- Gaurina-Međimurec, N. Mechanical Factors of Wellbore Instability. Nafta 1994, 45, 161–170. [Google Scholar]
- Fink, J.K. Petroleum Engineer’s Guide to Oil Field Chemicals and Fluids; Gulf Professional Publishing: Waltham, WA, USA, 2011; p. 785. [Google Scholar]
- McLean, M.R.; Addis, M.A. Wellbore Stability Analysis: A Review of Current Methods of Analysis and Their Field Application. In Proceedings of the IADC/SPE Drilling Conference, Houston, TX, USA, 27 February–2 March 1990. [Google Scholar]
- Zhang, J.; Yu, M.; Al-Bazali, T.M.; Ong, S.; Chenevert, M.E.; Sharma, M.M.; Clark, D.E. Maintaining the Stability of Deviated and Horizontal Wells: Effects of Mechanical, Chemical, and Thermal Phenomena on Well Designs. In Proceedings of the SPE International Oil & Gas Conference and Exhibition, Beijing, China, 5–7 December 2006. [Google Scholar]
- Steiger, R.P. Fundamentals and Use of Potassium/Polymer Drilling Fluids to Minimize Drilling and Completion Problems Associated with Hydratable Clays. J. Pet. Technol. 1982, 34, 1661–1670. [Google Scholar] [CrossRef]
- Bol, G.M.; Wong, S.-W.; Davidson, C.J.; Woodland, D.C. Borehole Stability in Shales. SPE Drill. Completion 1994, 9, 87–94. [Google Scholar] [CrossRef]
- Ewy, R.T.; Stankovich, R.J. Shale-Fluid Interactions Measured under Simulated Downhole Conditions. In Proceedings of the SPE/ISRM Rock Mechanics Conference, Irving, TX, USA, 20–23 October 2002. [Google Scholar]
- Wilson, M.J.; Wilson, L. Clay mineralogy and shale instability: An alternative conceptual analysis. Clay Miner. 2014, 49, 127–145. [Google Scholar] [CrossRef] [Green Version]
- El-Anwar, A.; Salman, S.; Mousa, D.; Aita, S.; Makled, W.; Gentzis, T. Organic Petrographic and Geochemical Evaluation of the Black Shale of the Duwi Formation, El Sebaiya, Nile Valley, Egypt. Minerals 2021, 11, 1416. [Google Scholar] [CrossRef]
- Steiner, I.; Gaurina-Međimurec, N. Borehole Stability Study with Various Formation Cores and Inhibitive Fluid Samples. In Proceedings of the Offshore Mediterranean Conference and Exhibition, Ravenna, Italy, 15–17 March 1995. [Google Scholar]
- Sauki, A.; Shah, M.S.Z.; Bakar, W.Z.W. Application of Ester based drilling fluid for shale gas drilling. IOP Conf. Ser. Mater. Sci. Eng. 2015, 83, 012012. [Google Scholar] [CrossRef] [Green Version]
- Arinkoola, A.; Salawudeen, T.; Salam, K.; Jimoh, M.; Atitebi, Z.; Abidemi, G. Optimization of Water Based Drilling Fluid Produced Using Modified Nigerian Bentonite and Natural Biopolymers: Reduced experiment and Response Surface Methodology. Iran. J. Chem. Eng. 2019, 16, 39–53. [Google Scholar]
- Gamal, H.; Elkatatny, S.; Basfar, S.; Al-Majed, A. Effect of pH on rheological and filtration properties of water-based drilling fluid based on bentonite. Sustainability 2019, 11, 6714. [Google Scholar] [CrossRef] [Green Version]
- Ewy, R.T.; Morton, E.K. Wellbore-Stability Performance of Water-Based Mud Additives. SPE Drill. Completion 2009, 24, 390–397. [Google Scholar] [CrossRef]
- Zhang, J.; Chenevert, M.E.; Al-Bazali, T.; Sharma, M.M. A New Gravimetric-Swelling Test for Evaluating Water and Ion Uptake in Shales. In Proceedings of the SPE Annual Technical Conference and Exhibition, Houston, TX, USA, 26–29 September 2004. [Google Scholar]
- Rojas, J.C.; Clark, D.E.; Zhang, J. Stressed Shale Drilling Strategy-Water Activity Design Improves Drilling Performance. In Proceedings of the SPE Annual Technical Conference and Exhibition, San Antonio, TX, USA, 24–27 September 2006. [Google Scholar]
- Han, G.; Timms, A.; Henson, J.; Aziz, I.A. Wellbore stability study: Lessons and learnings from a tectonically active field. In Proceedings of the Asia Pacific Oil and Gas Conference & Exhibition, Jakarta, Indonesia, 4–6 August 2009. [Google Scholar]
- Song, J.; Yuan, Y.; Gu, S.; Yang, X.; Yue, Y.; Cai, J.; Jiang, G. 2D numerical simulation of improving wellbore stability in shale using nanoparticles based drilling fluid. Energies 2017, 10, 651. [Google Scholar] [CrossRef] [Green Version]
- Gholami, R.; Elochukwu, H.; Fakhari, N.; Sarmadivaleh, M. A review on borehole instability in active shale formations: Interactions, mechanisms and inhibitors. Earth-Sci. Rev. 2018, 177, 2–13. [Google Scholar] [CrossRef] [Green Version]
- Darwesh, A.; Rasmussen, T.M.; Al-Ansari, N. Wiper Trips Effect on Wellbore Instability Using Net Rising Velocity Methods. Open Pet. Eng. J. 2018, 11, 14–28. [Google Scholar] [CrossRef]
- Anderson, R.L.; Ratcliffe, I.; Greenwell, H.C.; Williams, P.A.; Cliffe, S.; Coveney, P.V. Clay swelling—A challenge in the oilfield. Earth-Sci. Rev. 2010, 98, 201–216. [Google Scholar] [CrossRef]
- Aftab, A.; Ismail, A.R.; Ibupoto, Z.H. Enhancing the rheological properties and shale inhibition behavior of water-based mud using nanosilica, multi-walled carbon nanotube, and graphene nanoplatelet. Egypt. J. Pet. 2017, 26, 291–299. [Google Scholar] [CrossRef] [Green Version]
- May, P.; Deville, J.; Miller, J.; Burrows, K. Environmentally Acceptable Shale Inhibitors for High Performance Water-Based Muds. In Proceedings of the International Petroleum Technology Conference, Dhahran, Saudi Arabia, 13–15 January 2020. [Google Scholar]
- Amanullah, M. Screening and Evaluation of Some Environment-Friendly Mud Additives to Use in Water-Based Drilling Muds. In Proceedings of the SPE E & P Environmental and safety conference, Galveston, TX, USA, 5–7 March 2007. [Google Scholar]
- Ghaleh, S.P.; Khodapanah, E.; Tabatabaei-Nezhad, S.A. Experimental evaluation of thiamine as a new clay swelling inhibitor. Pet. Sci. 2020, 17, 1616–1633. [Google Scholar] [CrossRef]
- Al-Hameedi, A.T.; Alkinani, H.H.; Dunn-Norman, S.; Alashwak, N.A.; Alshammari, A.F.; Alkhamis, M.M.; Albazzaz, H.F.; Mutar, R.A.; Alsaba, M.T. Environmental friendly drilling fluid additives: Can food waste products be used as thinners and fluid loss control agents for drilling fluid? In Proceedings of the SPE Symposium: Asia Pacific Health, Safety, Security, Environment and Social Responsibility, Kuala Lumpur, Malaysia, 23–24 April 2019.
- Al-Hameedi, A.T.; Alkinani, H.H.; Dunn-Norman, S.; Alkhamis, M.M.; Feliz, J.D. Full-set measurements dataset for a water-based drilling fluid utilizing biodegradable environmentally friendly drilling fluid additives generated from waste. Data Brief 2020, 28, 104945. [Google Scholar] [CrossRef]
- Yalman, E.; Depci, T.; Federer-Kovacs, G.; Al Khalaf, H. A New Eco-Friendly and Low Cost Additive in Water-Based Drilling Fluids. Rud.-Geološko-Naft. Zb. 2021, 36, 5. [Google Scholar] [CrossRef]
- Zhang, L.; Wu, X.; Sun, Y.; Cai, J.; Lyu, S. Experimental study of the pomelo peel powder as novel shale inhibitor in water-based drilling fluids. Energy Explor. Exploit. 2020, 38, 569–588. [Google Scholar] [CrossRef]
- Al-Hameedi, A.T.; Alkinani, H.H.; Dunn-Norman, S.; Alkhamis, M.M.; Alshammari, A.F.; Al-Alwani, M.A.; Mutar, R.A. Controlling Drilling Fluid Properties Using Bio-Degradable Environmental Friendly Additives: Comparison between Conventional Chemical (PAC-LV) and Eco-Friendly Drilling Fluid Additives. In Proceedings of the 53rd US Rock Mechanics/Geomechanics Symposium, New York, NY, USA, 23–26 June 2019. [Google Scholar]
- Al-Hameedi, A.T.; Alkinani, H.H.; Dunn-Norman, S.; Al-Alwani, M.A.; Al-Bazzaz, W.H.; Alshammari, A.F.; Albazzas, H.W.; Mutar, R.A. Experimental investigation of bio-enhancer drilling fluid additive: Can palm tree leaves be utilized as a supportive eco-friendly additive in water-based drilling fluid system? J. Pet. Explor. Prod. Technol. 2020, 10, 595–603. [Google Scholar] [CrossRef] [Green Version]
- Ghaderi, S.; Haddadi, S.A.; Davoodi, S.; Arjmand, M. Application of sustainable saffron purple petals as an eco-friendly green additive for drilling fluids: A rheological, filtration, morphological, and corrosion inhibition study. J. Mol. Liq. 2020, 315, 113707. [Google Scholar] [CrossRef]
- Al-Saba, M.T.; Amadi, K.W.; Al-Hadramy, K.O.; Dushaishi, M.F.; Al-Hameedi, A.; Alkinani, H. Experimental investigation of bio-degradable environmental friendly drilling fluid additives generated from waste. In Proceedings of the SPE International Conference and Exhibition on Health, Safety, Security, Environment, and Social Responsibility, Abu Dhabi, United Arab Emirates, 16–18 April 2018. [Google Scholar]
- Al-Hameedi, A.T.; Alkinani, H.H.; Dunn-Norman, S.; Hamoud, Z.A. Investigation Study of the Effectiveness of Eggshells Powder as a Multifunctional Eco-Friendly Additive in Water-Based Fluid. In Proceedings of the 54th US Rock Mechanics/Geomechanics Symposium, Golden, CO, USA, 28 June–1 July 2020. [Google Scholar]
- ISO 10414-1; Recommended Practice for Field Testing Water-Based Drilling Fluids. API Recommended Practice 13B-1; American Petroleum Institute: Washington, DC, USA, 2003.
- Permeability Plugging Tester Instruction Manual; Version 5.0; OFI Testing Equipment, Inc.: Houston, TX, USA, 2015.
- Medved, I.; Gaurina-Međimurec, N.; Mavar, K.N.; Mijić, P. Waste mandarin peel as an eco-friendly water-based drilling fluid additive. Energies 2022, 15, 2591. [Google Scholar] [CrossRef]
- Ojha, P.; Karki, T.B.; Sitaula, R. Physio-chemical and functional quality evaluation of mandarin peel powder. J. Agric. Sci. Tech. 2016, 18, 575–582. [Google Scholar]

Publisher’s Note: MDPI stays neutral with regard to jurisdictional claims in published maps and institutional affiliations. |
© 2022 by the authors. Licensee MDPI, Basel, Switzerland. This article is an open access article distributed under the terms and conditions of the Creative Commons Attribution (CC BY) license (https://creativecommons.org/licenses/by/4.0/).