Featured Application
Malignant and benign thyroid nodules classification.
Abstract
A rapid classification method was developed for the malignant and benign thyroid nodules with ultrasound guided-fine needle aspiration biopsy (FNAB) samples. With probe electrospray ionization mass spectrometry, the mass-scan data of FNAB samples were used as datasets for machine learning. The patients were marked as malignant (98 patients), benign (110 patients) or undetermined (42 patients) by experienced doctors in terms of ultrasound, the B-Raf (BRAF) gene, and cytopathology inspections. Pairwise coupling was performed on 163 ions to generate 3630 ion ratios as new features for classifier training. With the new features, the performance of the multilayer perception (MLP) classifier is much better than that with the 163 ions as features directly. After training, the accuracy of the MLP classifier is as high as 92.0%. The accuracy of the single-blind test is 82.4%, which proved the good generalization ability of the MLP classifier. The overall concordance is 73.0% between prediction and six-month follow-up for patients in the undetermined group. Especially, the classifier showed high accuracy for the undetermined patients with suspicious for papillary carcinoma diagnosis (90.9%). In summary, the machine learning method based on FNAB samples has potential for real clinical applications.
1. Introduction
Ultrasound-guided fine needle aspiration biopsy (FNAB) is usually performed on patients with thyroid nodules, which are clinically suspicious, or ultrasound features suggestive of malignancy [1,2]. Cytopathological analysis would determine the malignancy of thyroid nodules, which is the major reference for clinical treatment but is powerless for some special cases. For instance, the follicular neoplasm is usually determined to be malignant, but the majority are benign after ectomy [3]. Some reactive nuclear changes observed in the follicular cell or the Hürthle cell groups infiltrated by lymphocytes can mimic papillary thyroid carcinoma (PTC) [4]. The efficacy of sampling may also affect cytopathological diagnosis, and “insufficient cellularity” appears frequently even for some nodules with sizes >1 cm. In addition, cytopathological analysis was time- and labor- consuming. All the above defects and difficulties urged a new, fast, efficient, and accurate method for the determination of nodule malignancy.
In recent decades, machine learning has liberated doctors from repetitive and heavy diagnostic work. Images from magnetic resonance, ultrasonic, and cytopathology are common objects for machine learning [5,6,7]. However, the quality of images would be affected by an ambient electromagnetic field and patient-related factors that could cause misdiagnosis. Mass spectrometry can measure disease-related substances, providing mass number, intensity, and structure information that can also be used as features for machine learning. Probe electrospray ionization tandem mass spectrometry (PESI-MS), as an ambient ionization mass spectrometry, could directly measure the extractions of tissue lesions that do not need complex pretreatment. In the last decade, PESI-MS and machine learning had already been used for the classification and diagnosis of many diseases. Previously, Takeda and coauthors reported the clinical probability of PESI-MS for the diagnosis of malignant tumors [8]. Recently, they successfully classified high-cholesterol-diet-induced and genetic-lipoprotein-receptor-deficiency-caused atherosclerosis with serum samples [9] and classified cancerous and non-cancerous breast nodules in terms of breast core needle biopsy samples with an accuracy rate of 100% [10]. The Davoli group developed a PESI-MS based machine learning method to differentiate hepatocellular carcinoma and mass-forming cholangiocarcinoma from normal and adjacent tissues, with an overall diagnostic accuracy over 94% in both random forest and support vector machine algorithms [11]. Chung et al. developed a fast-diagnostic method for detecting pancreatic cancer with peripheral blood samples [12], which indicates malignant features of pancreatic cancer can be acquired from serum but not directly from the foci of patients. However, PESI-MS-based machine learning has not been used for the malignancy prediction of thyroid nodules.
This study aims to develop a PESI-MS-based machine learning method to classify malignant and benign thyroid nodules with ultrasound-guided FNAB samples, which were collected from patients in the China–Japan Friendship Hospital. The FNAB samples were measured with PESI-MS, and the mass-scan dataset was used for machine learning. Finally, a fast, easier, and more accurate machine learning method was developed.
2. Materials and Methods
2.1. Patients
The study was approved by the Ethics Committee of the China–Japan Friendship Hospital (2019-103-K71). From February to October in 2021, 267 FNAB samples were collected from the Department of Endocrinology, the Department of Ultrasound, and the Department of Intervention in the China–Japan Friendship Hospital. The patients had been fully informed about the risk of FNAB and signed the Informed Consent Form before sampling. For each patient, one more FNAB was performed to acquire samples for the PESI-MS measurement.
2.2. Cytopathology and BRAF Gene Detection
All the 267 patients accepted BRAF V600E gene detection and cytopathology detection. After FNAB, the samples were kept in either cell preservation solution or saline water for cytopathology and BRAF V600E detection, respectively. The experiment and diagnosis methods of gene and cytopathology are shown in Method S 1.1 and S 1.2 in the supporting information.
2.3. The Scheme of PESI-MS-Based Machine Learning
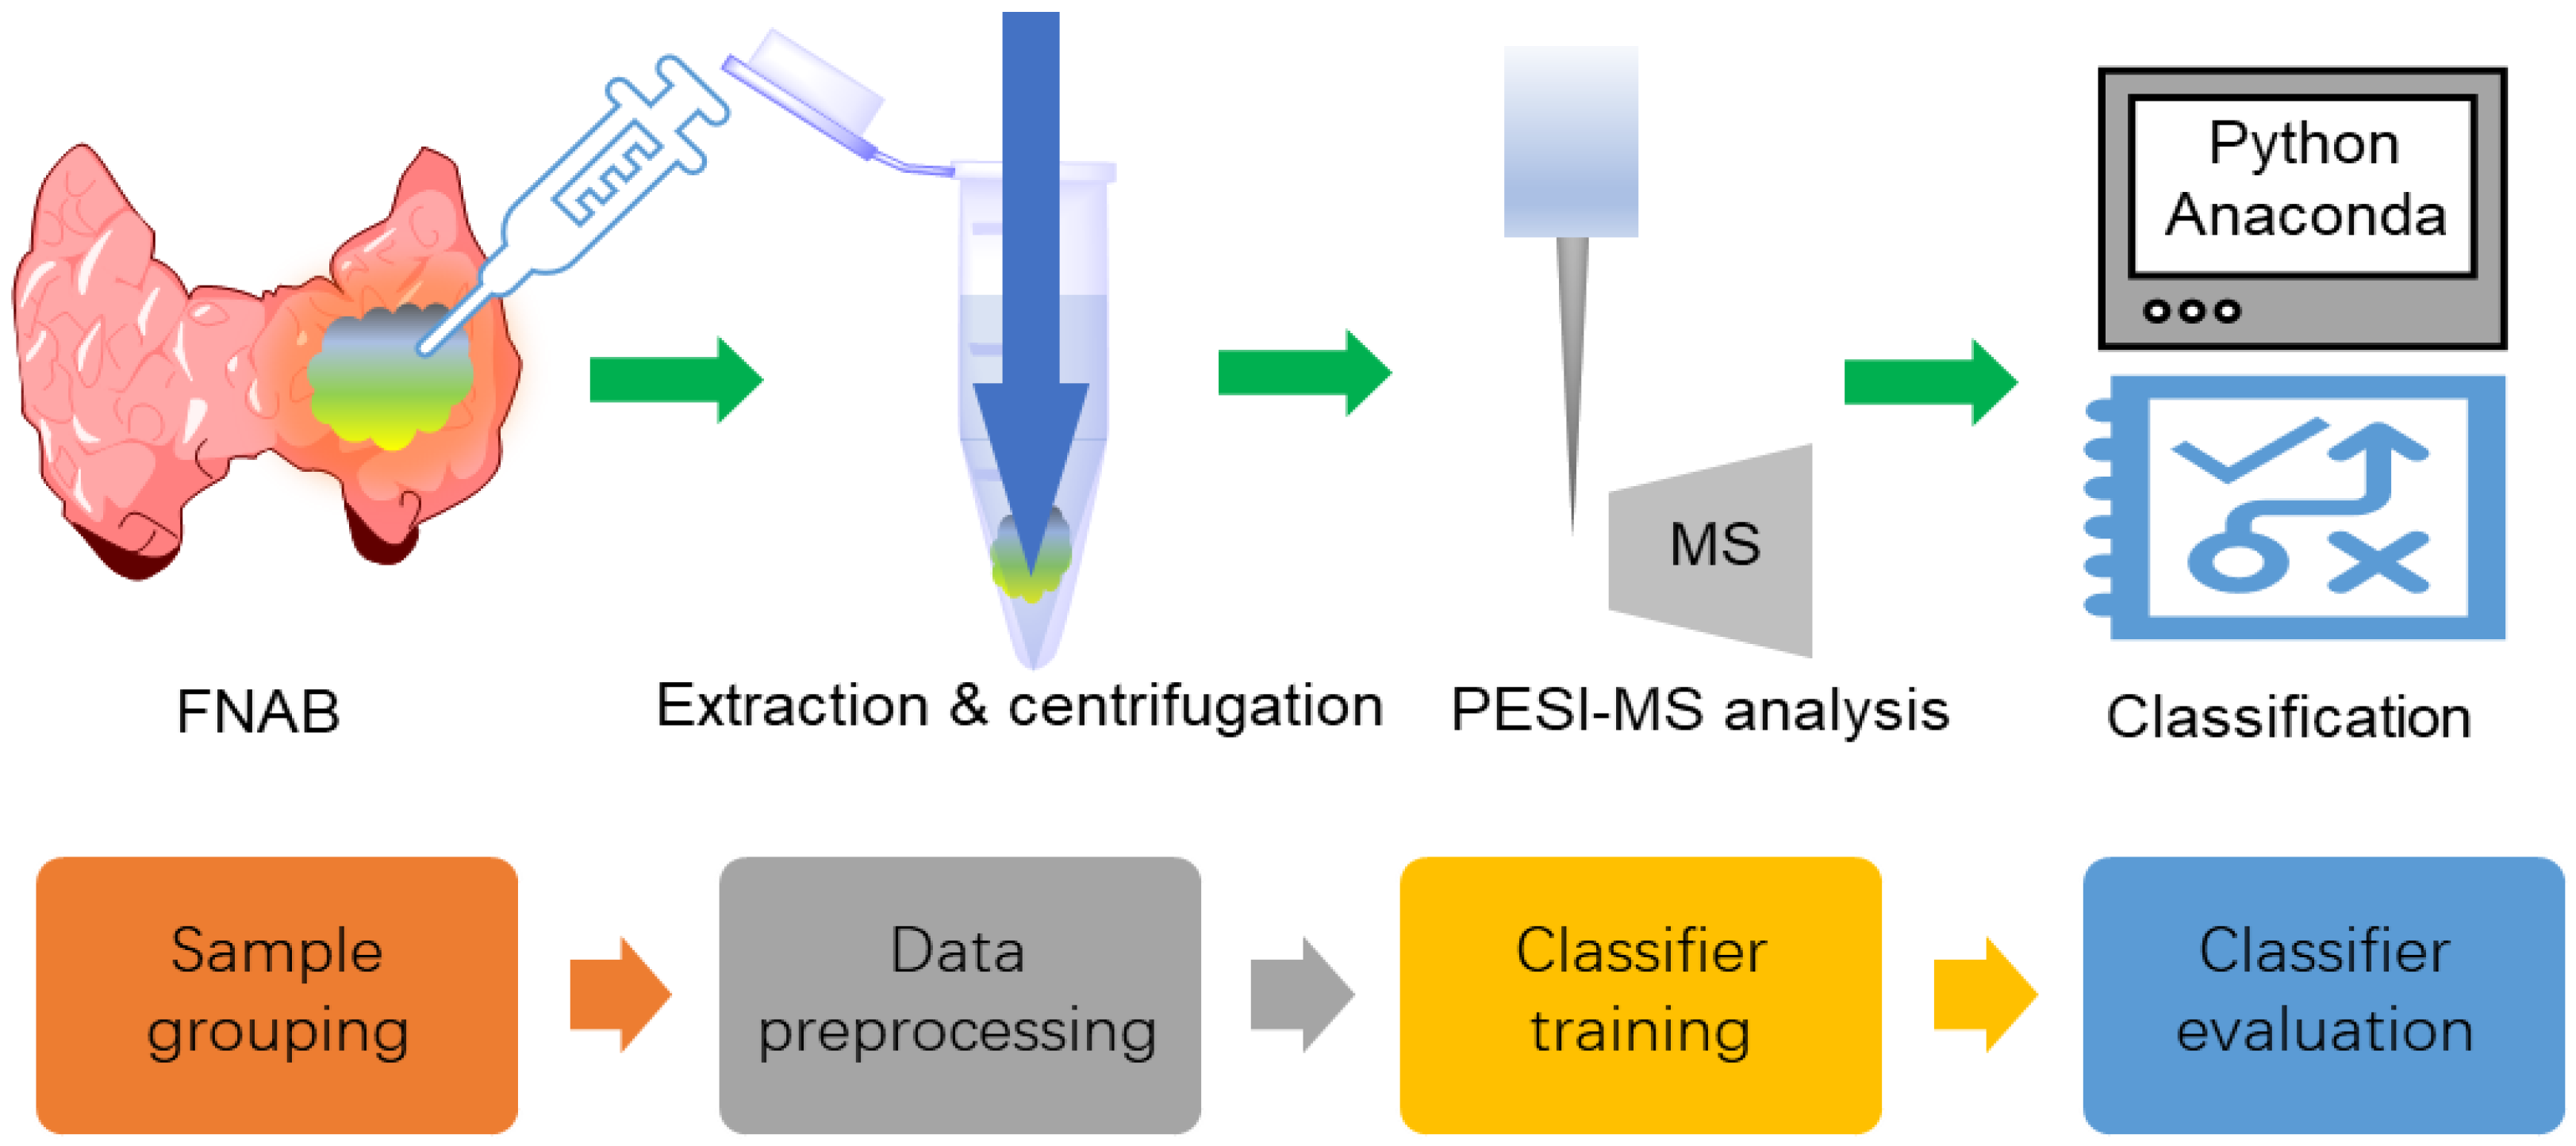
The experimental and machine learning protocols with FNAB samples are shown in Figure 1, which is similar to the reported works [10,11]. After FNAB, the samples were pretreated and then measured with PESI-MS. The obtained mass-scan dataset was grouped and used for machine learning. Data preprocessing was used to produce data suitable for classifier training. Model training was performed to obtain a classifier that was able to discriminate malignant from benign nodules.

Figure 1.
The experimental and machine learning protocols with the FNAB samples.
2.4. Patient Grouping
Two hundred and sixty-seven patients were marked as ‘malignant’ (98), ‘benign’ (110), or ‘undetermined’ (42), considering ultrasound, cytopathology, or BRAF gene diagnosis. The patients marked malignant or benign were used for the classifier training. In addition, 17 patients participated in the single-blind test.
2.5. PESI-MS Measurement
After FNAB, each sample was kept in a sterile vial containing 0.2 mL of EtOH/H2O mixture in a ratio of 1:1 and immediately stored at 4 °C until use. The preparation of samples was performed similarly as previously described [10,11]. Briefly, the samples were ultrasonicated for 1 min, vortexed for 10 s, and then subjected to centrifugation at 12,000× g round per minute for 5 min. The supernatant was diluted 2-fold with ethanol–water (50/50, v/v), and 9 μL of the resultant solution was added on a sample plate for PESI-MS measurement. The PESI-MS measurement was conducted by DPiMS-8060 that was equipped with a probe electrospray ionization source and a triple quadrupole mass spectrometer (Shimadzu, Kyoto, Japan). Both positive and negative ion scan mode were performed using the parameters listed in Table 1. Finally, it was found that 163 ions were constantly detected in all samples (with 95% detection rate). These data were used for the following machine learning process.

Table 1.
The measurement conditions.
2.6. Data Preprocessing
The missing value interpolation and data normalization were performed with a home-developed Python program on an Anaconda Jupyter Notebook (version 6.3.0). The missing value interpolation was performed with a mean interpolation method. Then, data normalization was performed with the ‘L2′ method, where the intensity of each ion was divided by the square root of the sum of the squares of the intensity of all the ions. Afterwards, pairwise coupling was performed on the 163 ions, and totally 13,203 new features could be obtained. From these features, a two-tail t-test was performed and new features with p < 0.05 were selected (total 3630 features) by Excel software. Principle component analysis (PCA), PLSRegression (PLS), and T-distributed stochastic neighbor embedding (TSNE) were used to obtain components for the classifier training.
2.7. Classifier Training
The classifier was trained with three established methods: the support vector machine (SVM), random forest (RF), and multilayer perceptron (MLP) methods. For the method comparison, the samples were split with the random state of 169, the training and test set ratio was 8:2, and 9 components were used. Sensitivity, specificity, accuracy, and cross-validation were calculated for each classifier. Sensitivity, specificity, and accuracy were calculated for each classifier. Sensitivity = TP/(TP + FN); specificity = TN/(TN + FP); and accuracy = (TP + TN)/(TP + FN + FP + TN), where TP, TN, FP, and FN represented true positive, true negative, false-positive, and false negative, respectively. Three-fold cross-validation was used to evaluate the stability of the trained classifier, where the training set was divided into three groups; any two groups were used to train the classifier, and the other one was used to evaluate the trained classifier.
2.8. Classifier Evaluation
The classifier was first evaluated with a single-blind test containing 17 patients. The diagnosis results were unknown to the classifier trainers. Their malignancy predictions were compared with clinical diagnosis, and the concordance was calculated to evaluate the generalization ability of the trained classifier.
Then, the classifier was used to predict the malignancy of patients in undetermined group (42 patients). Patient follow-up was performed for these patients. A final clinical diagnosis was made according to the follow-up, cytopathology, BRAF gene, and ultrasound features. In detail, Benign: (1) the clinical treatment was ultrasound recheck after 3–6 months; (2) the ultrasound recheck indicates low risk; and (3) reported benign after surgery. Malignancy: reported malignancy after surgery. Suspicious for malignancy: (1) BRAF (+), no recheck or surgery; (2) the ultrasound recheck is high-risk; (3) the cytopathologic recheck is suspicious for malignancy or malignancy; (4) a reported borderline tumor after surgery. The concordance of classifier prediction with the final diagnosis was calculated. Because the classifier could only provide a benign or malignant mark, when calculating the concordance of prediction with a final diagnosis, suspicious for malignancy was treated as malignant.
3. Results
3.1. Patient Grouping
The 267 patients were divided into three groups according to the diagnosis of ultrasonic image grading, cytopathology, and BRAF gene detection results (Table 2).
Table 2.
The grouping criteria and statistics.
3.2. PESI-MS Spectra
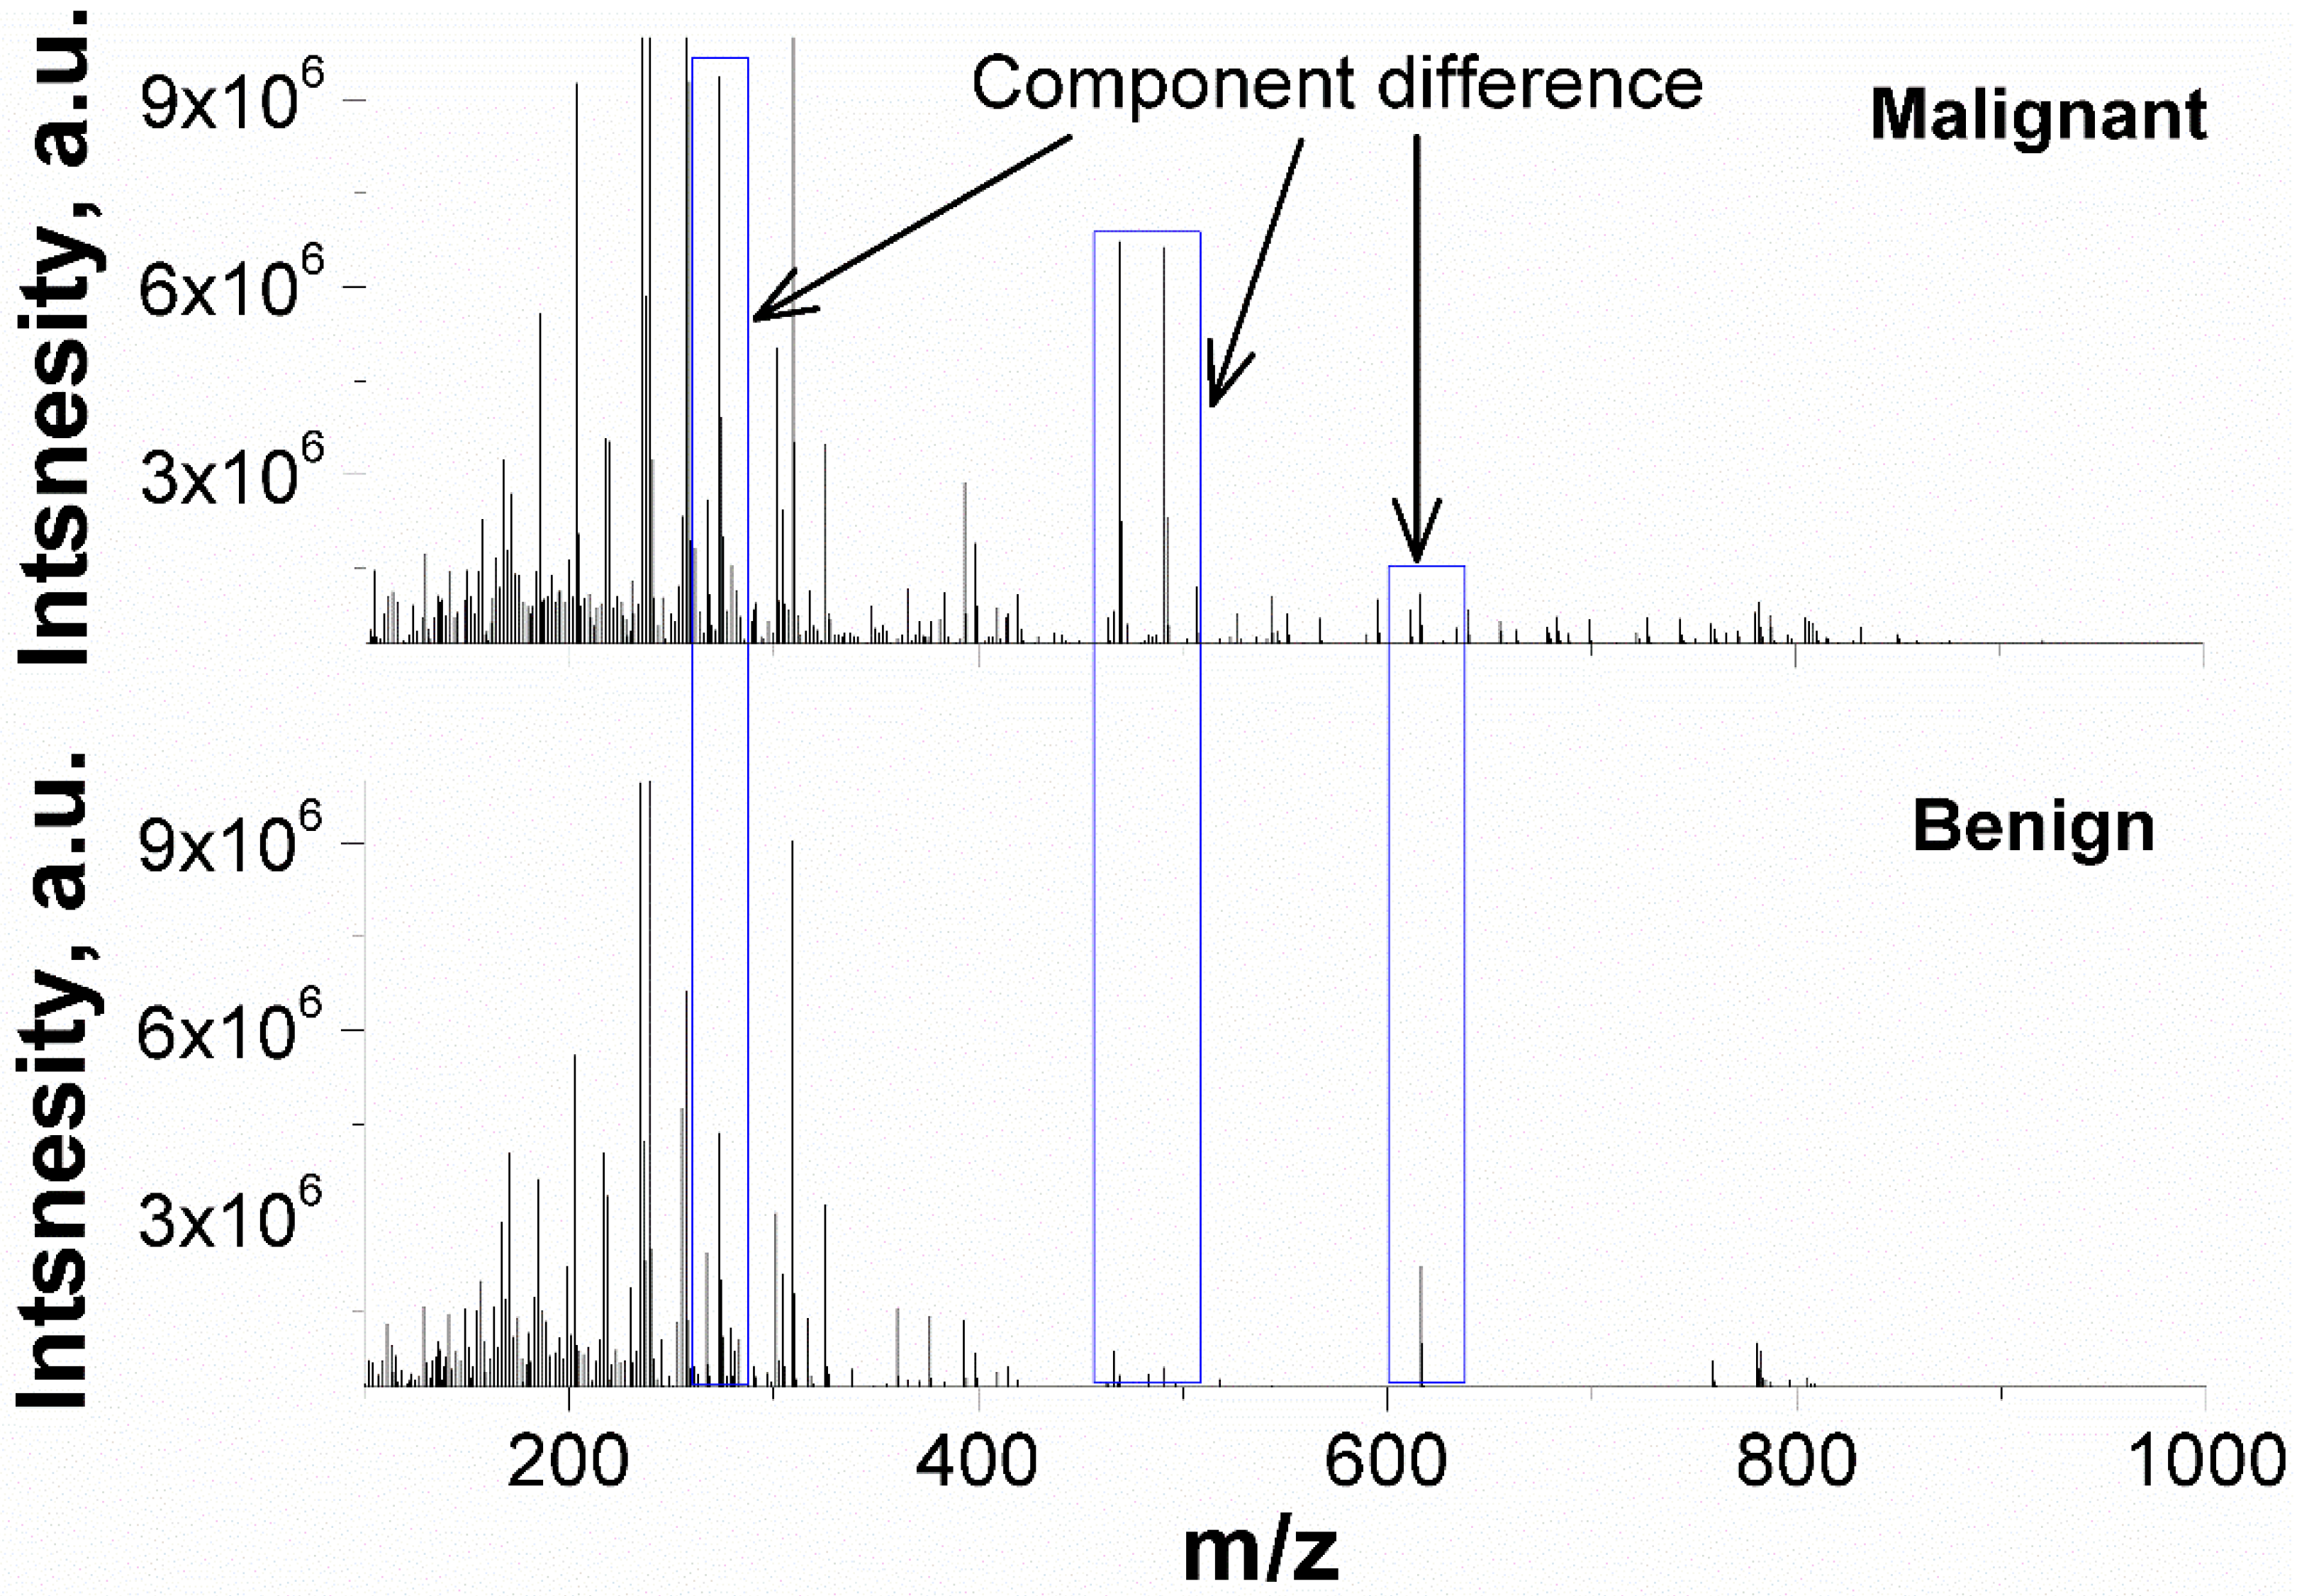
The representative PESI-MS spectra of malignant and benign nodule extractions were illustrated in Figure 2. The FNAB samples exhibit a cluster of peaks at m/z 200–400, and several minor peaks from m/z 400 to m/z 1000 are also observed. The ion intensity is group-dependent. For instance, the intensity of m/z 471 and m/z 491 is over 106 in malignant nodules but is lower in benign ones.
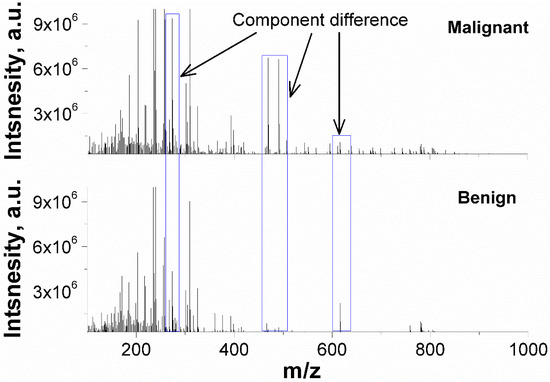
Figure 2.
Representative PESI-MS spectra of malignant and benign nodules in positive mass mode.
3.3. Features Selection
At the beginning, the 163 ions were directly used as features for classifier training. Each ion represents a compound and had a detection rate over 95% in malignant group. Table 3 listed the accuracy, sensitivity, specificity, and cross-validation of the trained classifiers. The accuracy of classifiers is from 66.0–80.0%, the sensitivity from 66.7–74.1%, and the specificity from 65.2–87.0%. The highest accuracy is 80.0% with the random forest (RF) method.
Table 3.
The accuracy, sensitivity, specificity, and cross-validation of classifiers.
Afterwards, 13,203 new features were generated from the 163 ions by pairwise coupling, and 3630 features were used for classifier training. The accuracy of classifiers is from 74.0–92.0%, the sensitivity from 63.0–88.9%, and the specificity from 87.0–95.7%. The use of new features significantly increased the performance of the MLP and SVM classifiers.
3.4. Data Decompostion
Data decomposition was performed with three methods: principle component analysis (PCA), PLS-regression (PLS), and t-distributed stochastic neighbor embedding (TSNE). Figure 3 illustrated the score plots of PCA, TSNE, and PLS, and corresponding violin plots of PCA (5 illustrated), TSNE (2 illustrated), and PLS (5 illustrated) components. Clearly, PLS decomposition could provide better separation for the malignant and benign samples.
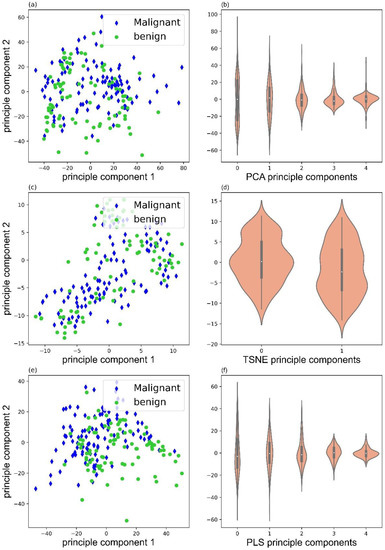
Figure 3.
Score plots of PCA (a), TSNE (c), and PLS (e), and violin plots of PCA (b), TSNE (d), and PLS (f) components.
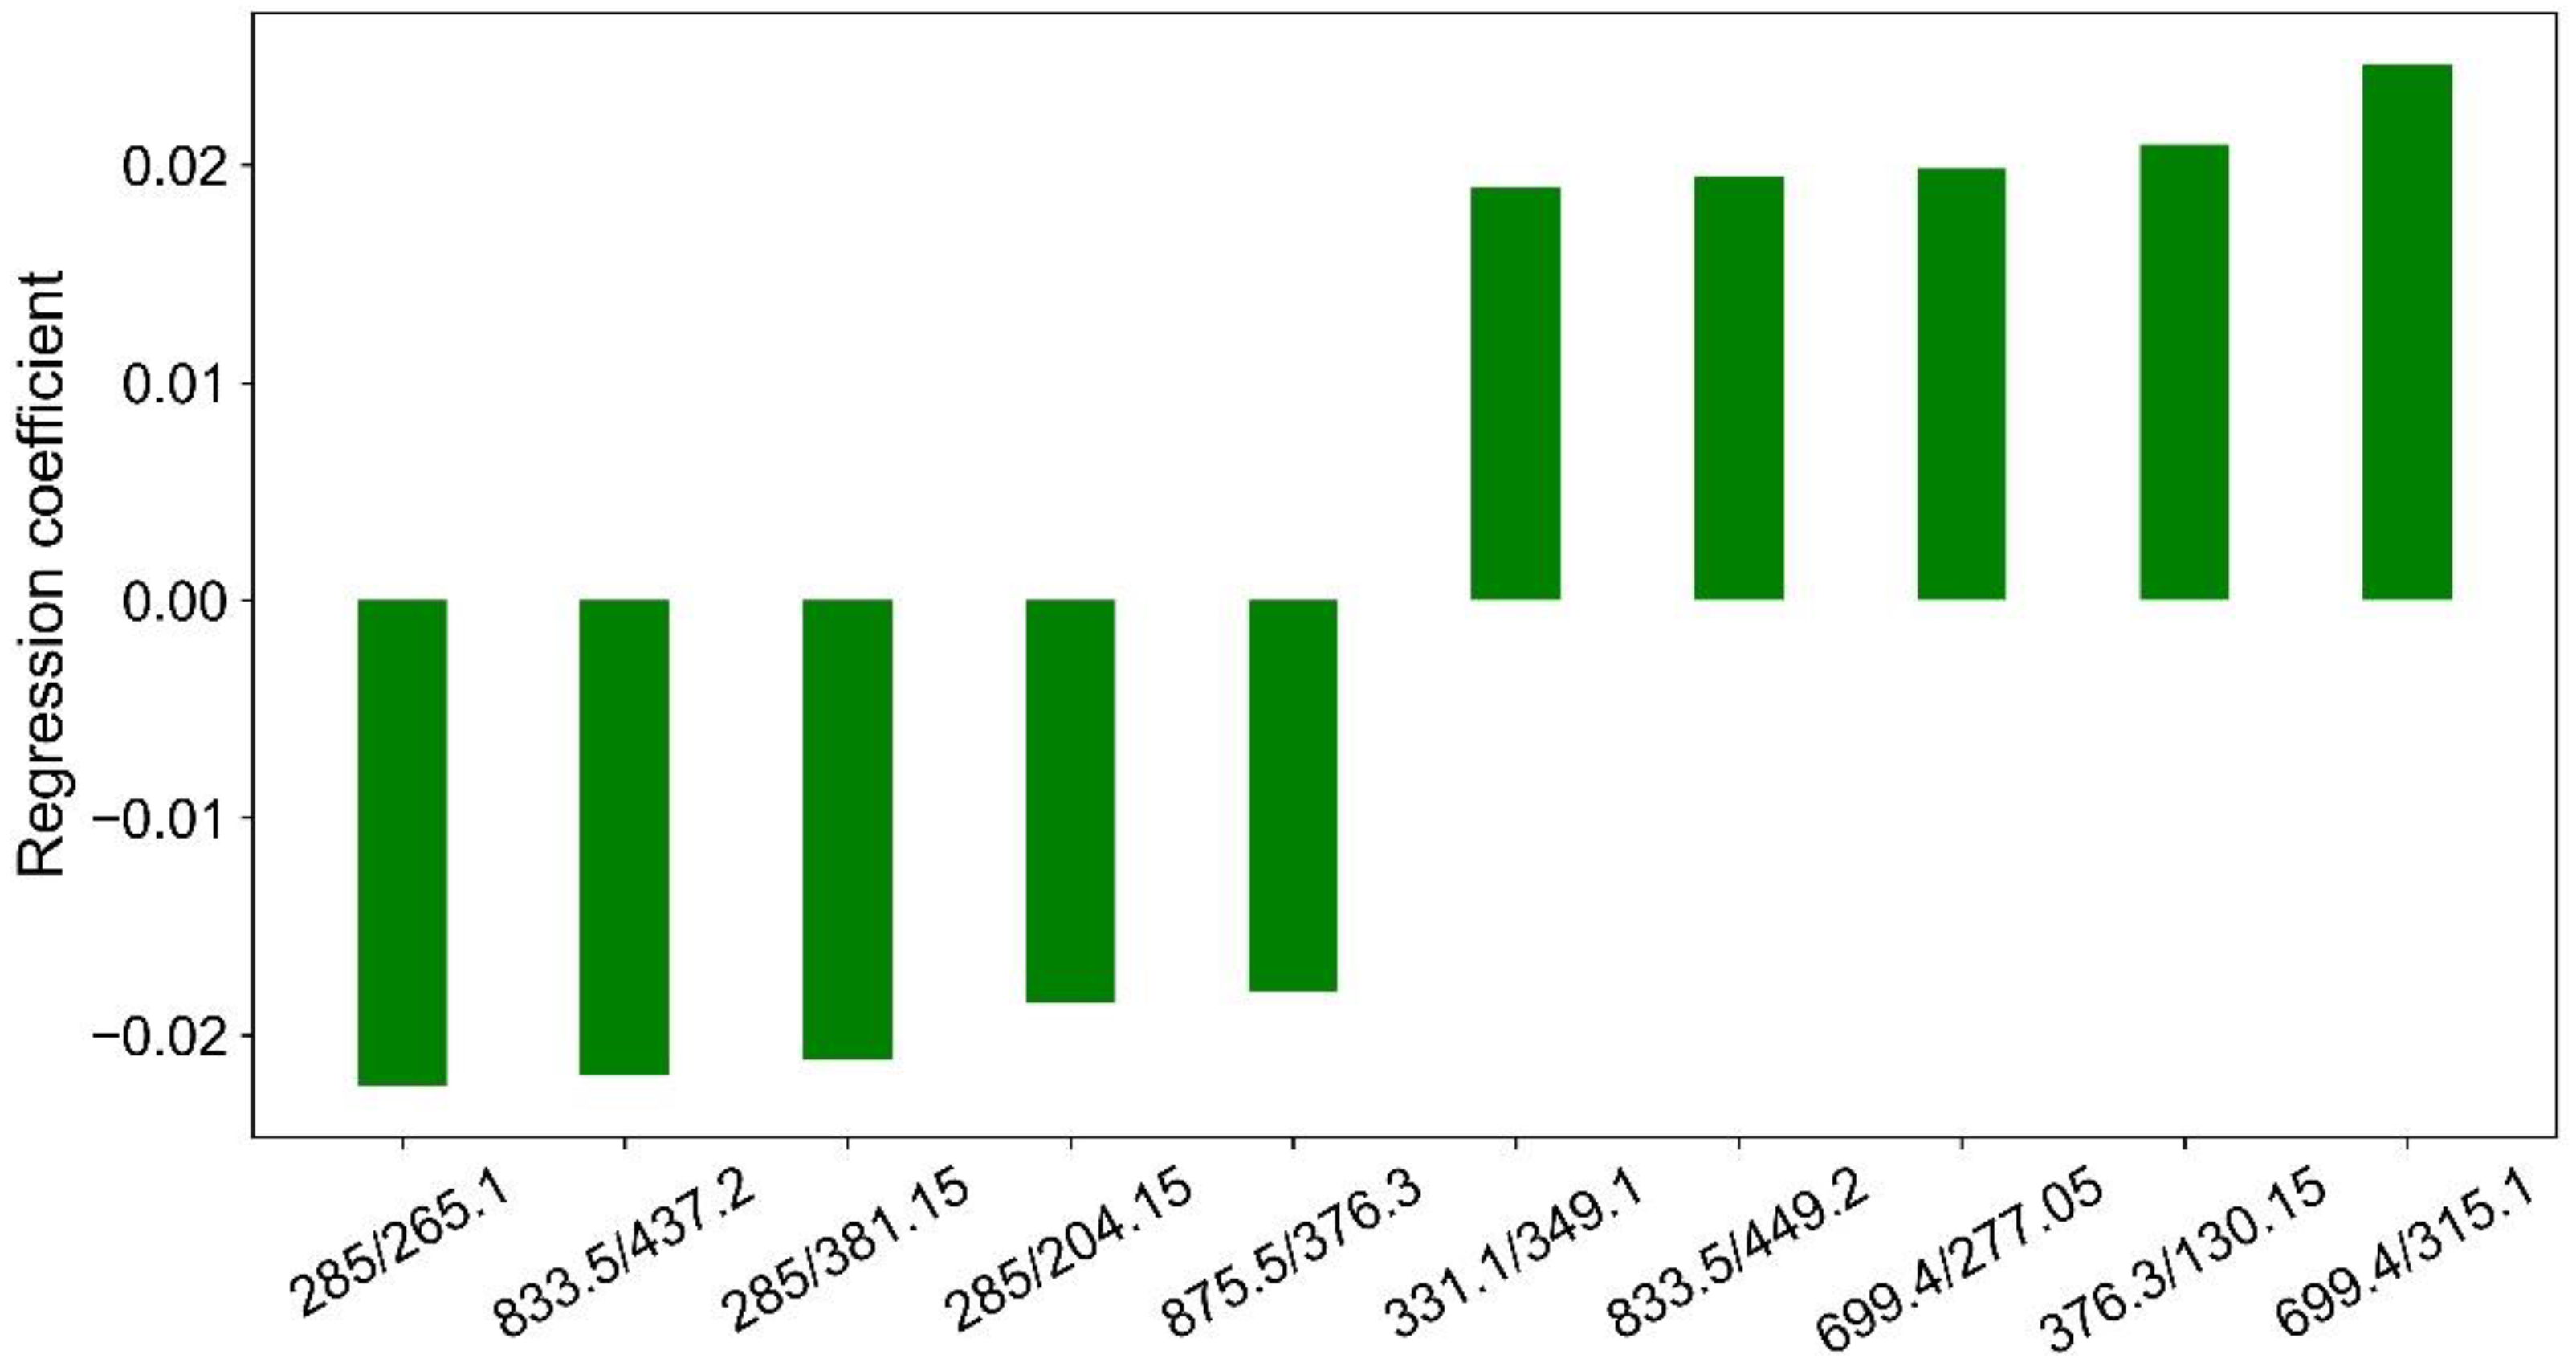
The contribution of each ion ratio to the separation of malignant and benign nodules can be approximated with Y = AX. Figure 4 illustrates 10 major features that contribute the most to the separation of malignant and benign nodules by PLS decomposition.
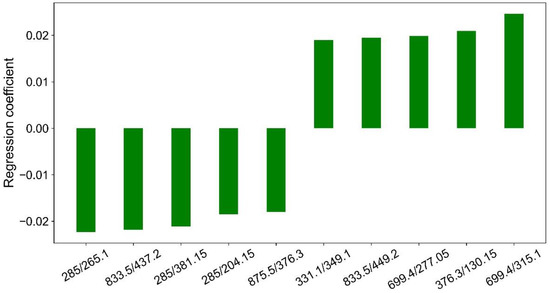
Figure 4.
Regression coefficients of 10 major features by PLS decomposition.
3.5. Classifier Optimizaion
The classifier was trained with the SVM, RF, and MLP methods. After training with the 3630 new features, it is found that the MLP classifier obtained the best accuracy of 92.0%, which is much better than the SVM classifier (84.0%) and the RF classifier (74.0%). Consequently, the MLP classifier was further optimized.
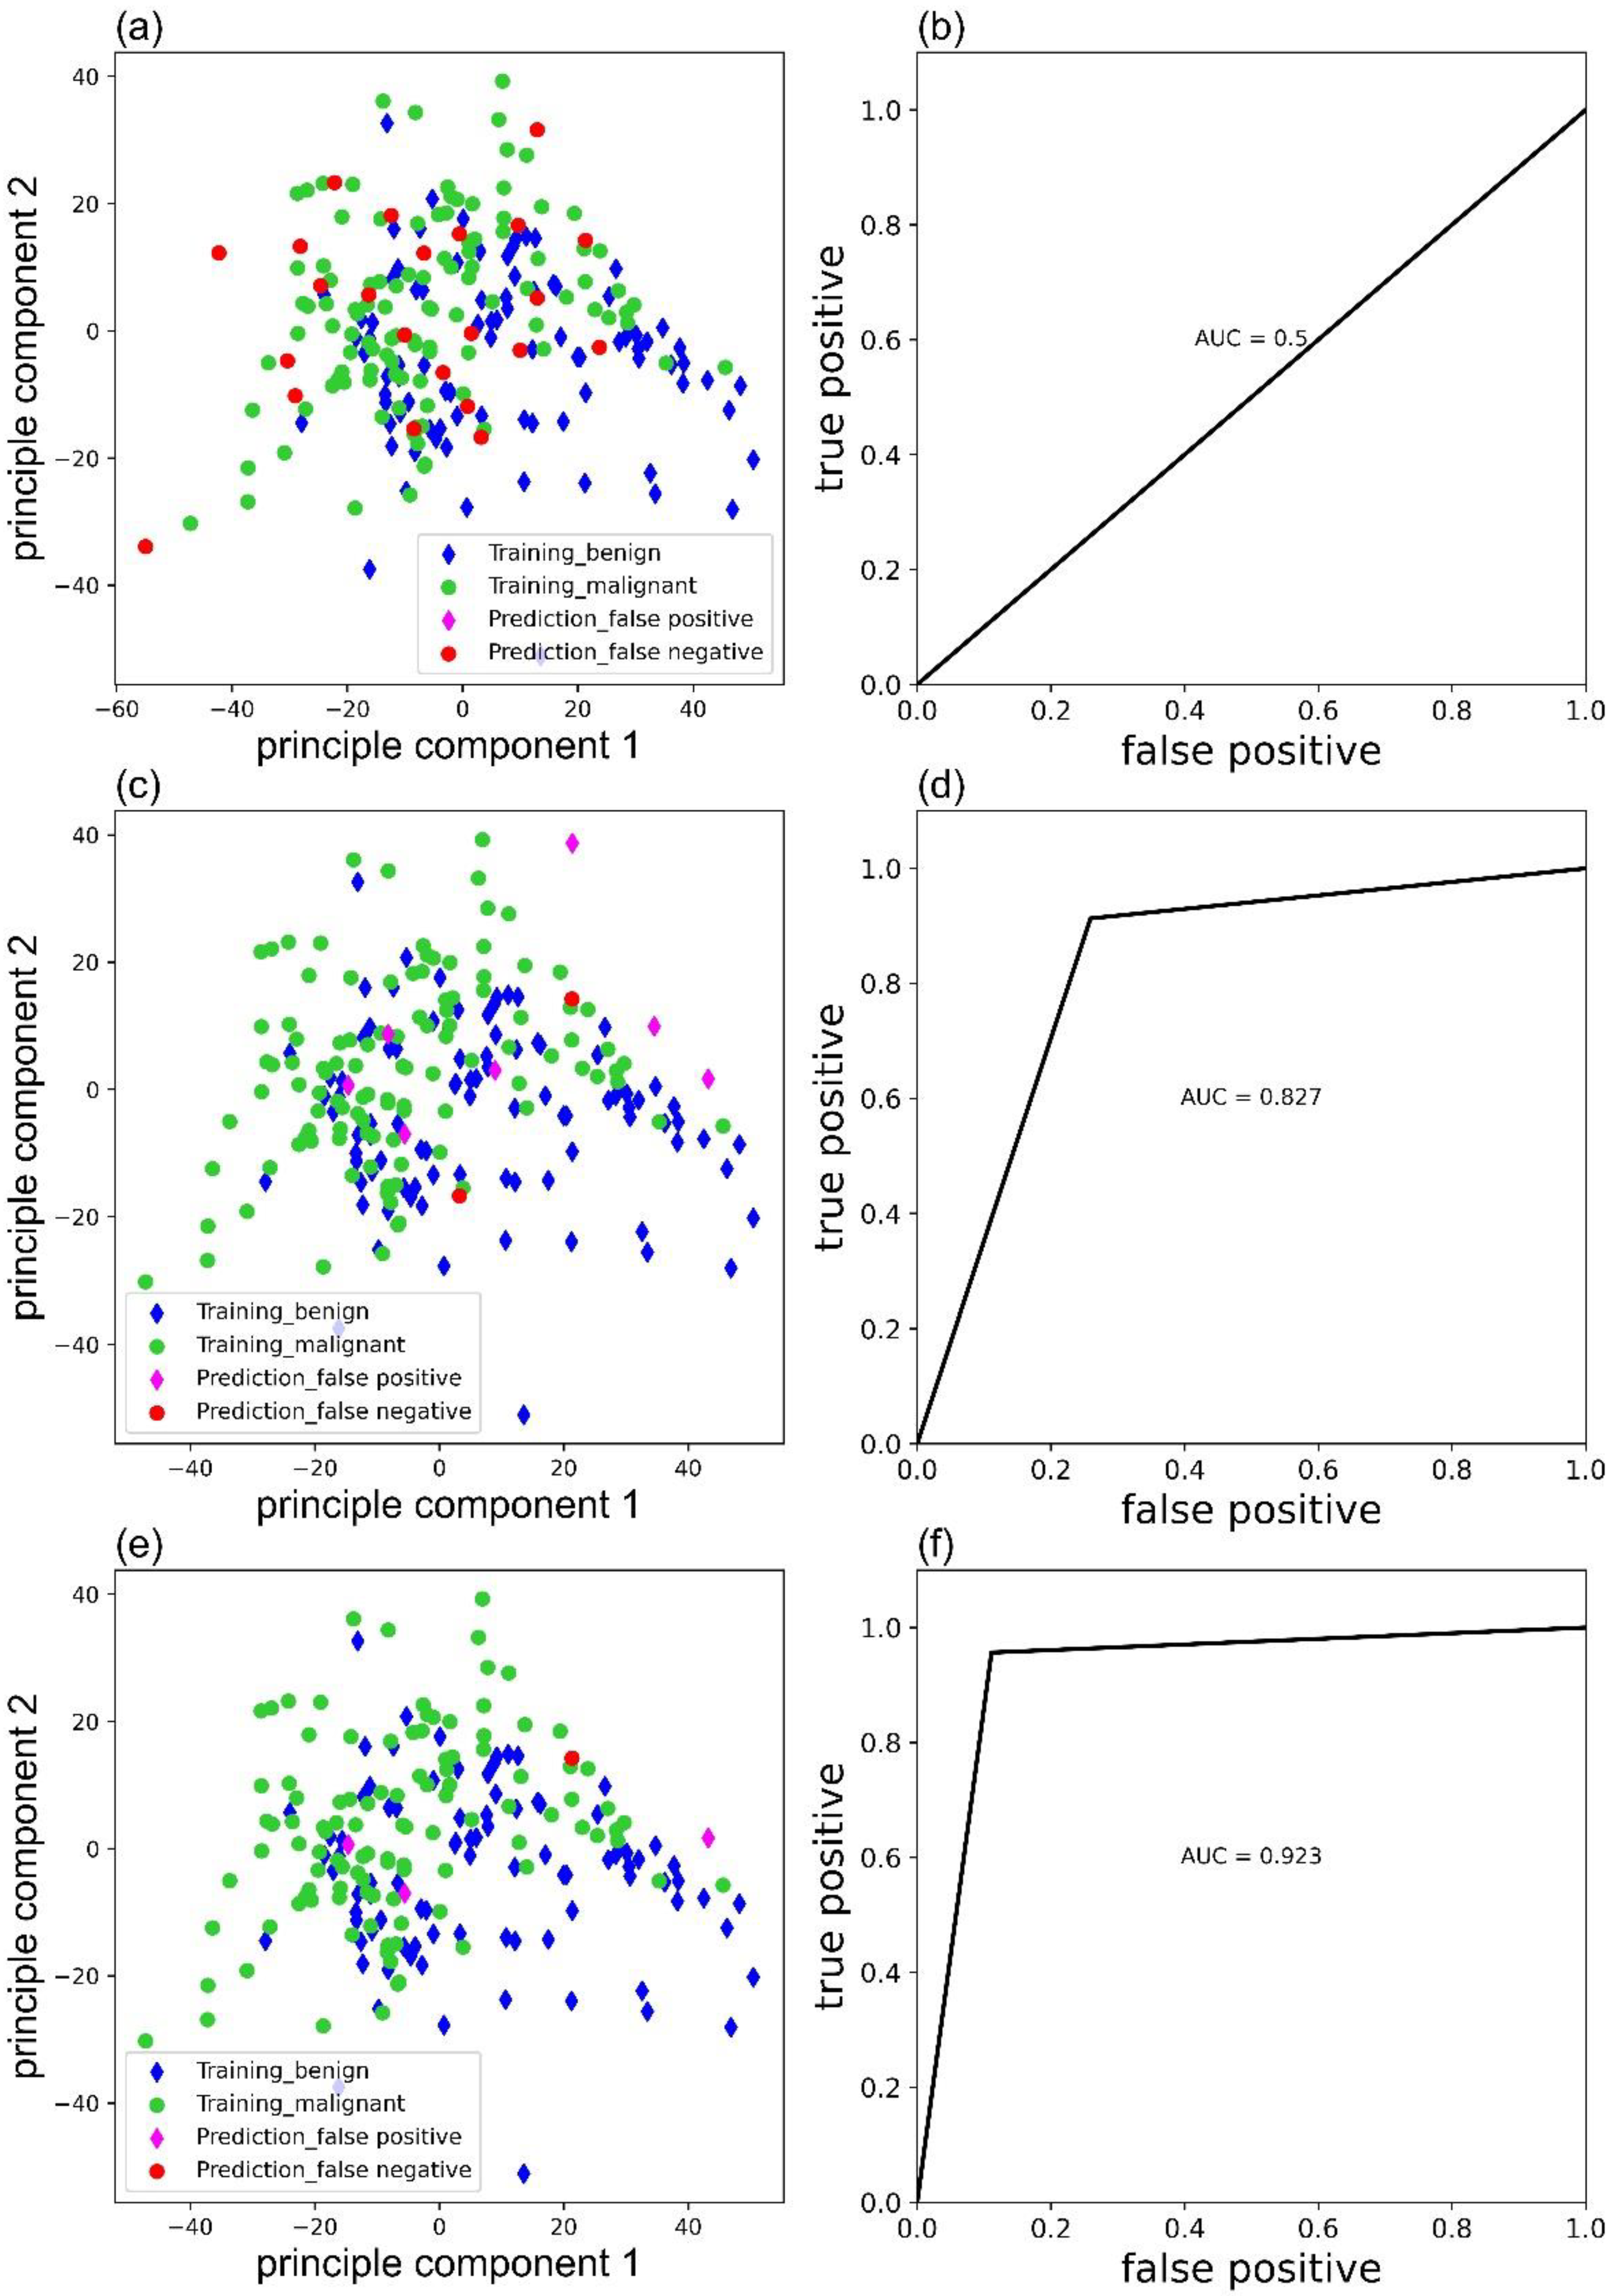
Weight parameters would affect the accuracy of the MLP classifier. Figure 5 exhibited the false predictions ((a), (c), (e)), and corresponding receiver operating characteristic (ROC) curves ((b), (d), (f)) of MLP classifier trained with ‘sgd’, ‘adam’, and ‘lbfgs’ as solver, respectively. Clearly, the MLP classifier with ‘lbfgs’ as the solver performs the best and only has four false predictions.

Figure 5.
False predictions of the MLP classifier trained with ‘sgd’ (a), ‘adam’ (c), and ‘lbfgs’ (e) as solver and corresponding ROC curves (b), (d) and (f).
3.6. Single-Blind Test
A total of 17 patients participated in the single-blind test, and the patient information was listed in Table S1. Before a single-blind test, the MLP classifier was trained based on all the malignant (98) and benign (110) samples. In general, three false-positive predictions were made by MLP classifier with an accuracy of 82.4% (14/17), which is comparable with the accuracy during model optimization.
3.7. Prediction of Undetermined Patients
A total of 42 patients participated in the single-blind test, and 5 patients could not be contacted by telephone follow-up. The patient information and prediction by the classifier were listed in Table S2. The general concordance between prediction and follow-up was 73.0% (27/37). In the 37 undetermined patients, 11 were diagnosed as undetermined significance (follicular lesion or atypia), 11 as suspicious for papillary carcinoma, 13 as insufficient cellularity, and 2 with others by cytopathology. The corresponding prediction accuracy was 72.7% (8/11), 90.9% (10/11), 61.5% (8/13), and 50.0% (1/2), respectively.
4. Discussion
4.1. The Scheme of PESI-MS Based Machine Leaning
FNAB samples has long been used for the malignancy determination of thyroid nodules, followed by cytopathology and mutation gene detection. In this study, the sample pretreatment followed the instructions of clinical samples for PESI-MS analysis [13] but was slightly modified. The pretreatment time is around 7 min (2 min extraction, vortex, and 5 min centrifugation) for one sample, which is very fast and efficient compared with the pretreatment and analysis of traditional cytopathology or the BRAF gene method (at least half to one hour). The obtained extractions of FNAB samples could be directly measured without further pretreatment. For the PESI-MS analysis, 9 μL of the sample was directly put on the sample plate, and several dozens of repetitions and hundreds of mass peaks were obtained within 1 min. The repetitions guaranteed the accuracy of the malignancy prediction. The hundreds of mass peaks include substances abundant in either malignant or benign nodules, which could be used as features for machine learning, as was done in previous reports [14,15].
Machine learning is widely used for the malignancy determination of thyroid nodules; however, most of the studies deal with images of cytopathology [16,17]. Conversely, Galli developed a machine learning method with FNAB samples to discriminate between malignant and benign thyroid nodules. After pretreatment, 43 cytological smears were directly analyzed with MALDI imaging with an accuracy of 81.8% after feature selection [18]. With a LC tandem Q Exactive Hybrid Quadrupole-Orbitrap mass spectrometer (LC-QTRAP), Sun analyzed peptides from prototypic proteins in thyroid tissue cores, and in terms of machine learning, the classification accuracy is over 90% for the classification of malignant and benign nodules [19]. Although the accuracy is acceptable, the sample analysis of MALDI imaging and LC-QTRAP is complicated, time-consuming, and costly. In this study, PESI-MS was firstly used to analyze thyroid FNAB samples with a dataset containing 267 patients. PESI-MS is less complicated and more cost-effective than MALDI imaging and LC-QTRAP. In addition, the number of patients in the dataset, to the best of our knowledge, is also the largest mass spectra dataset of thyroid FNAB samples. In general, PESI-MS based machine leaning is much easier, faster, and more cost-effective than traditional and reported methods to discriminate between malignant and benign thyroid nodules.
4.2. Feature Selection
Feature selection is the key step before machine learning. Primarily, it was found that 163 ions were frequently detected (a 95% detection rate in malignant FNAB samples), and they were directly used as features for classifier training. The highest accuracy is 80.0%, obtained by an RF classifier with a sensitivity and a specificity of 74.1% and 87.0%, respectively. However, the accuracy, sensitivity, and specificity are not as high as the reported values, due to the poor homogeneity of the FNAB samples.
Using the ion ratio is one way to eliminate the inhomogeneity of the clinical samples. For instance, Nakamura reported the ability of the amyloid-β precursor protein (APP) 669-711/amyloid-β (Aβ) 1-42 and Aβ 1-40/Aβ 1-42 ratios, and their composites, to predict individual brain amyloid-β-positive or -negative status [20]. Rathbone found that immunoglobulin κ:λ ratios in cerebrospinal fluid determined at the time of diagnostic lumbar puncture could predict MS disease progression and may be useful prognostic markers for early therapeutic stratification [21]. Rabizadeh showed that the LDL-C/apolipoprotein B (Apo B) ratio may be considered as an indicator of coronary heart disease independent of the ASCVD risk score in patients with type 2 diabetes [22].
However, no ion ratios were reported to homogenize the FNAB samples. Pairwise coupling will not ignore any potential ion ratios, and, consequently, 13,203 new features were generated from the 163 ions. However, the number of the new features was too large; therefore, a t-test was carried out to select features for classifier training (p < 0.05 between malignant and benign group, total 3630 features). With these new features, although the accuracy and sensitivity of the RF classifier decreased, the accuracy of the SVM and MLP classifiers improved by 12.0% and 26.0%, the specificity improved by 21.8% and 30.5%, and the sensitivity improved by 3.7% and 22.2%, respectively. Especially, the MLP classifier had an accuracy of 92.0%, which is comparable with the hepatic tumor (94%) [11], breast cancer (100%) [10], and pancreatic cancer classification (91.2%) [12]. The high accuracy, sensitivity, and specificity obtained proved that pairwise coupling was an effective way to eliminate the inhomogeneity of the FNAB samples.
4.3. Data Decomposition and Classifier Optimization
Either the 163 ions or the 3630 new features are too large for classifier training. Data decomposition could eliminate the ‘curse of dimensionality’ by generating a reasonable number of components. Three decomposition methods were compared: PCA, TSNE, and PLS. PCA is a widely used and unsupervised decomposition method that is suitable for group separation with significant different features. TSNE is also an unsupervised decomposition method, but it can only generate two or three components. PLS is a supervised decomposition method that keeps the features with the most variance and considers features that are relevant to predict the target. In our study, PLS decomposition can separate the malignant and benign groups better than the other two. The individual difference is significant in patients. Therefore, a supervised machine learning method (PLS) should work better than the unsupervised one.
Major features contributed most to the separation of malignant and benign nodules by PLS decomposition were illustrated in Figure 4. Clearly, m/z 285 was present three times in the 10 ion ratios, and m/z 833.5 and m/z 699.4 were present twice in the 10 ion ratios. They could be good internal standards for the generation of ions ratios for the separation of malignant and benign nodules. However, they are still unknown substances, and further studies must be carried out to identify their structures.
Training methods and parameters produced classifiers with different performances. Three common training methods were applied to train classifiers: the support vector machine (SVM), random forest (RF), and multilayer perceptron (MLP) methods. With the 163 ions as features, RF performed better than SVM and MLP. In comparison, SVM and MLP performed better than RF with the 3630 new features. From an application point of view, the MLP method performs the best, and its parameters optimization were conducted. The solver of weight optimization is one of the key parameters of the MLP classifier. The weight optimization solvers include ‘sgd’, ‘adam’, and ‘lbfgs’. The best performance was obtained with ‘lbfgs’ as the solver, and it has been announced that the solver ‘adam’ works well on relatively large datasets (with thousands of training samples or more). For small datasets, ‘lbfgs’ can converge faster and perform better [23].
4.4. Single-Blind Test
For the single-blind test, patients in malignant (98) and benign groups (110) were used to train the MLP classifier. After training, pathologists initiated a single-blind test, including 17 patients with definite malignant or benign diagnosis. The accuracy of the MLP classifier obtained an accuracy of 82.4% (14/17) that is comparable with the accuracy during model optimization and proved the good generalization ability of the trained classifier.
4.5. Prediction of Undetermined Samples
Although not trained by undetermined patients, the MLP classifier was used to determine their malignancy, and the predictions were compared with 6-month follow-up results. For the undetermined patients, no clear and definite diagnosis could be provided by the traditional cytopathology and BRAF gene detection. In comparison, the PESI-MS-based machine learning strategy shows the potential for their malignancy determination.
The 37 undetermined patients can be divided into four groups: the patients marked as suspicious for papillary carcinoma, undetermined significance, insufficient cellularity, and others. For the patients marked with suspicious for papillary carcinoma, the classifier could correctly predict their malignancy with an accuracy of 90.9%. For the patients marked with insufficient cellularity, the accuracy was as low as 61.5%. This is probably because most of the FNAB could provide enough thyroid lesions for either microscopy observation or mass measurement. Resampling or the changing of sampling position should be considered for FNAB. For the prediction of patients marked with undetermined significance, the accuracy is 72.7%, which is not as satisfactory as that of the patients marked with suspicious for papillary carcinoma (90.9%). Probably, a better classifier could be trained when enough undetermined samples were accumulated with reliable follow-up results in the future.
4.6. Deficiencies and Expectations
In this study, only 267 patients were involved in the development of classifier training and evaluation. Meanwhile, the FNAB samples were obtained by a few doctors in the Department of Endocrinology, the Department of Ultrasound, and the Department of Intervention in the China–Japan Friendship Hospital. Not only the numbers of the FNAB samples but more departments and hospitals should participate in the development of machine learning methods and validate the developed classifiers.
5. Conclusions
A fast diagnosis method for thyroid nodules was developed with the PESI-MS based machine learning and fine needle biopsy samples. In total, 267 patients contributed to the development of the machine learning method. The inhomogeneity of ultrasound guided-fine needle aspiration biopsy (FNAB) samples had a negative effect on the malignancy determination. Fortunately, it can be overcome with 3630 new features for classifier training, which were generated from 163 ions by a pairwise-coupling method. m/z 285, m/z 833.5, and m/z 699.4 could be good internal standards to eliminate the inhomogeneity of the FNAB samples. For the principle components, PLS is better than PCA and TSNE to separate malignant and benign samples. For the classifier training, MLP is better than SVM and RF, considering both prediction accuracy and cross-validation. The single-blind test with 17 patients had an accuracy of 82.4%, which proved the good generalization ability of the MLP classifier. The malignancy prediction of the undetermined patients had a concordance of 73.0% between prediction and 6-month follow-up. The classifier showed high accuracy for the undermined patients with suspicious for papillary carcinoma diagnosis (90.9%). Although the low prediction accuracy is not satisfying for patients with undetermined significance and an insufficient cellularity diagnosis in undetermined group, the improvement of FNAB or the development of a new classifier would be effective ways to improve the prediction accuracy. In addition, for each FNAB sample, only 10 min is needed to determine its malignancy, which is much easier and faster than traditional cytopathology and BRAF gene diagnosis. In summary, a promising auxiliary diagnosis technique was developed for the malignancy determination of thyroid nodules.
Supplementary Materials
The following supporting information can be downloaded at: https://www.mdpi.com/article/10.3390/app12115364/s1, the detailed cytopathology (Method S1.1) and the BRAF V600E gene (Method S1.2) detection procedures; Table S1 single-blind test, and Table S2 the MLP prediction of the undetermined patients.
Author Contributions
Conceptualization, D.Z., X.L. and L.C.; methodology, Z.C., Y.W. and L.Z.; software, Z.C. and L.Z.; validation, Z.C., Y.W. and Y.L. (Yajuan Lei); formal analysis, Z.C., Y.W. and Y.L. (Yao Liu); investigation, Z.C. and Y.W.; resources, Y.W., D.Z., J.L. and J.D.; data curation, R.J., Y.L. (Yao Liu) and Y.W.; writing—original draft preparation, Z.C. and Y.W.; writing—review and editing, D.Z., X.L. and L.C.; visualization, Z.C.; supervision, D.Z. and X.L.; project administration, Y.L. (Yajuan Lei); and funding acquisition, D.Z., Y.L. (Yajuan Lei) and X.L. All authors have read and agreed to the published version of the manuscript.
Funding
This research received no external funding.
Institutional Review Board Statement
The study was conducted in accordance with the Declaration of Helsinki and approved by the Ethics Committee of the China–Japan Friendship Hospital (2019-103-K71 and 8 August 2019).
Informed Consent Statement
Informed consent was obtained from all the subjects involved in the study.
Data Availability Statement
The data that support the findings of this study are available upon reasonable request.
Conflicts of Interest
The authors declare no conflict of interest.
References
- Todsen, T.; Bennedbæk, F.N.; Kiss, K.; Hegedüs, L. Ultrasound-Guided Fine-Needle Aspiration Biopsy of Thyroid Nodules. Head Neck 2021, 43, 1009–1013. [Google Scholar] [CrossRef] [PubMed]
- Dong, Y.J.; Mao, M.J.; Zhan, W.W.; Zhou, J.Q.; Zhou, W.; Yao, J.J.; Hu, Y.Y.; Wang, Y.; Ye, T.J. Size and Ultrasound Features Affecting Results of Ultrasound-Guided Fine-Needle Aspiration of Thyroid Nodules. J. Ultrasound Med. 2018, 37, 1367–1377. [Google Scholar] [CrossRef] [PubMed] [Green Version]
- Baloch, Z.W.; Fleisher, S.; LiVolsi, V.A.; Gupta, P.K. Diagnosis of “Follicular Neoplasm”: A Gray Zone in Thyroid Fine-Needle Aspiration Cytology. Diagn. Cytopathol. 2002, 26, 41–44. [Google Scholar] [CrossRef] [PubMed]
- Baloch, Z.W.; LiVolsi, V.A. Cytologic and Architectural Mimics of Papillary Thyroid Carcinoma: Diagnostic Challenges in Fine-Needle Aspiration and Surgical Pathology Specimens. Pathol. Patterns Rev. 2006, 125, S135–S144. [Google Scholar] [CrossRef]
- Zhang, H.; Zhao, C.; Guo, L.; Li, X.; Luo, Y.; Lu, J.; Xu, H.B.T. Diagnosis of Thyroid Nodules in Ultrasound Images Using Two Combined Classification Modules. In Proceedings of the 12th International Congress on Image and Signal Processing, BioMedical Engineering and Informatics, (CISP-BMEI), Suzhou, China, 19–21 October 2019. [Google Scholar]
- Saito, A.; Toyoda, H.; Kobayashi, M.; Koiwa, Y.; Fujii, H.; Fujita, K.; Maeda, A.; Kaneoka, Y.; Hazama, S.; Nagano, H.; et al. Prediction of Early Recurrence of Hepatocellular Carcinoma after Resection Using Digital Pathology Images Assessed by Machine Learning. Mod. Pathol. 2021, 34, 417–425. [Google Scholar] [CrossRef]
- Wang, H.; Song, B.; Ye, N.; Ren, J.; Sun, X.; Dai, Z.; Zhang, Y.; Chen, B.T. Machine Learning-Based Multiparametric MRI Radiomics for Predicting the Aggressiveness of Papillary Thyroid Carcinoma. Eur. J. Radiol. 2020, 122, 108755. [Google Scholar] [CrossRef] [Green Version]
- Mandal, M.K.; Yoshimura, K.; Chen, L.C.; Yu, Z.; Nakazawa, T.; Katoh, R.; Fujii, H.; Takeda, S.; Nonami, H.; Hiraoka, K. Application of Probe Electrospray Ionization Mass Spectrometry (PESI-MS) to Clinical Diagnosis: Solvent Effect on Lipid Analysis. J. Am. Soc. Mass Spectrom. 2012, 23, 2043–2047. [Google Scholar] [CrossRef] [Green Version]
- Johno, H.; Yoshimura, K.; Mori, Y.; Kimura, T.; Niimi, M.; Yamada, M.; Tanigawa, T.; Fan, J.; Takeda, S. Detection of Potential New Biomarkers of Atherosclerosis by Probe Electrospray Ionization Mass Spectrometry. Metabolomics 2018, 14, 38. [Google Scholar] [CrossRef]
- Iwano, T.; Yoshimura, K.; Inoue, S.; Odate, T.; Ogata, K.; Funatsu, S.; Tanihata, H.; Kondo, T.; Ichikawa, D.; Takeda, S. Breast Cancer Diagnosis Based on Lipid Profiling by Probe Electrospray Ionization Mass Spectrometry. Br. J. Surg. 2020, 107, 632–635. [Google Scholar] [CrossRef] [Green Version]
- Giordano, S.; Takeda, S.; Donadon, M.; Saiki, H.; Brunelli, L.; Pastorelli, R.; Cimino, M.; Soldani, C.; Franceschini, B.; Di Tommaso, L.; et al. Rapid Automated Diagnosis of Primary Hepatic Tumour by Mass Spectrometry and Artificial Intelligence. Liver Int. 2020, 40, 3117–3124. [Google Scholar] [CrossRef]
- Chung, W.Y.; Correa, E.; Yoshimura, K.; Chang, M.C.; Dennison, A.; Takeda, S.; Chang, Y.T. Using Probe Electrospray Ionization Mass Spectrometry and Machine Learning for Detecting Pancreatic Cancer with High Performance. Am. J. Trans. Res. 2020, 12, 171–179. [Google Scholar]
- Takeda, S.; Yoshimura, K.; Tanihata, H. Sample Preparation for Probe Electrospray Ionization Mass Spectrometry. J. Vis. Exp. 2020, 156, e59942. [Google Scholar] [CrossRef] [PubMed]
- Fukuhara, S.; Iwasaki, E.; Iwano, T.; Machida, Y.; Tamagawa, H.; Kawasaki, S.; Seino, T.; Yokose, T.; Endo, Y.; Yoshimura, K.; et al. New Strategy for Evaluating Pancreatic Tissue Specimens from Endoscopic Ultrasound-Guided Fine Needle Aspiration and Surgery. JGH Open 2021, 5, 953–958. [Google Scholar] [CrossRef] [PubMed]
- Kiritani, S.; Yoshimura, K.; Arita, J.; Kokudo, T.; Hakoda, H.; Tanimoto, M.; Ishizawa, T.; Akamatsu, N.; Kaneko, J.; Takeda, S.; et al. A New Rapid Diagnostic System with Ambient Mass Spectrometry and Machine Learning for Colorectal Liver Metastasis. BMC Cancer 2021, 21, 262. [Google Scholar] [CrossRef] [PubMed]
- Sanyal, P.; Dr, T.M.; Barui, S.; Das, A.; Gangopadhyay, P. Artificial Intelligence in Cytopathology: A Neural Network to Identify Papillary Carcinoma on Thyroid Fine-Needle Aspiration Cytology Smears. J. Pathol. Inform. 2018, 9, 38. [Google Scholar] [CrossRef] [PubMed]
- Elliott Range, D.D.; Dov, D.; Kovalsky, S.Z.; Henao, R.; Carin, L.; Cohen, J. Application of a Machine Learning Algorithm to Predict Malignancy in Thyroid Cytopathology. Cancer Cytopathol. 2020, 128, 287–295. [Google Scholar] [CrossRef] [PubMed]
- Galli, M.; Zoppis, I.; de Sio, G.; Chinello, C.; Pagni, F.; Magni, F.; Mauri, G. A Support Vector Machine Classification of Thyroid Bioptic Specimens Using MALDI-MSI Data. Adv. Bioinform. 2016, 2016, 3791214. [Google Scholar] [CrossRef] [Green Version]
- Sun, Y.; Selvarajan, S.; Zang, Z.; Liu, W.; Zhu, Y.; Zhang, H.; Chen, H.; Cai, X.; Gao, H.; Wu, Z.; et al. Protein Classifier for Thyroid Nodules Learned from Rapidly Acquired Proteotypes. medRxiv 2020. [Google Scholar] [CrossRef]
- Nakamura, A.; Kaneko, N.; Villemagne, V.L.; Kato, T.; Doecke, J.; Doré, V.; Fowler, C.; Li, Q.X.; Martins, R.; Rowe, C.; et al. High Performance Plasma Amyloid-β Biomarkers for Alzheimer’s Disease. Nature 2018, 554, 249–254. [Google Scholar] [CrossRef]
- Rathbone, E.; Durant, L.; Kinsella, J.; Parker, A.R.; Hassan-Smith, G.; Douglas, M.R.; John Curnow, S. Cerebrospinal Fluid Immunoglobulin Light Chain Ratios Predict Disease Progression in Multiple Sclerosis. J. Neurol. Neurosurg. Psychiatry 2018, 89, 1044–1049. [Google Scholar] [CrossRef]
- Rabizadeh, S.; Rajab, A.; Mechanick, J.I.; Moosaie, F.; Rahimi, Y.; Nakhjavani, M.; Esteghamati, A. LDL/Apo B Ratio Predict Coronary Heart Disease in Type 2 Diabetes Independent of ASCVD Risk Score: A Case-Cohort Study. Nutr. Metab. Cardiovasc. Dis. 2021, 31, 1477–1485. [Google Scholar] [CrossRef] [PubMed]
- Kingma, D.P.; Ba, J.L. Adam: A Method for Stochastic Optimization. In Proceedings of the 3rd International Conference on Learning Representations, ICLR 2015-Conference Track Proceedings, San Diego, CA, USA, 7–9 May 2015. [Google Scholar]

Publisher’s Note: MDPI stays neutral with regard to jurisdictional claims in published maps and institutional affiliations. |
© 2022 by the authors. Licensee MDPI, Basel, Switzerland. This article is an open access article distributed under the terms and conditions of the Creative Commons Attribution (CC BY) license (https://creativecommons.org/licenses/by/4.0/).