Reportability Tool Design: Assessing Grouping Schemes for Strategic Decision Making in Maintenance Planning from a Stochastic Perspective
Abstract
:Featured Application
Abstract
1. Introduction
- Definition and formulation of KPI;
- Analysis of capabilities and limitation of Power BI;
- Python script analysis, measurement, and integration with PBI;
- Reporting tool design and implementation.
1.1. Literature Review
1.1.1. Grouping Strategy under Preventive Maintenance
- Long-term planning, covering a horizon of several years;
- Medium-term planning, covering horizons from approximately one month to a year;
- Short-term planning, covering daily and weekly horizons.
- Stationary models used in stable situations where the planning horizon may even be infinite;
- Dynamic models wherein planning and its rules may change over the horizon according to short-term data.
1.1.2. Maintenance Performance Indicators
- Asset development;
- Organisation and management;
- Performance management;
- Maintenance efficiency.
1.1.3. Microsoft Power BI (PBI)
2. Methodology
2.1. Set Definition
2.2. Expected Risk
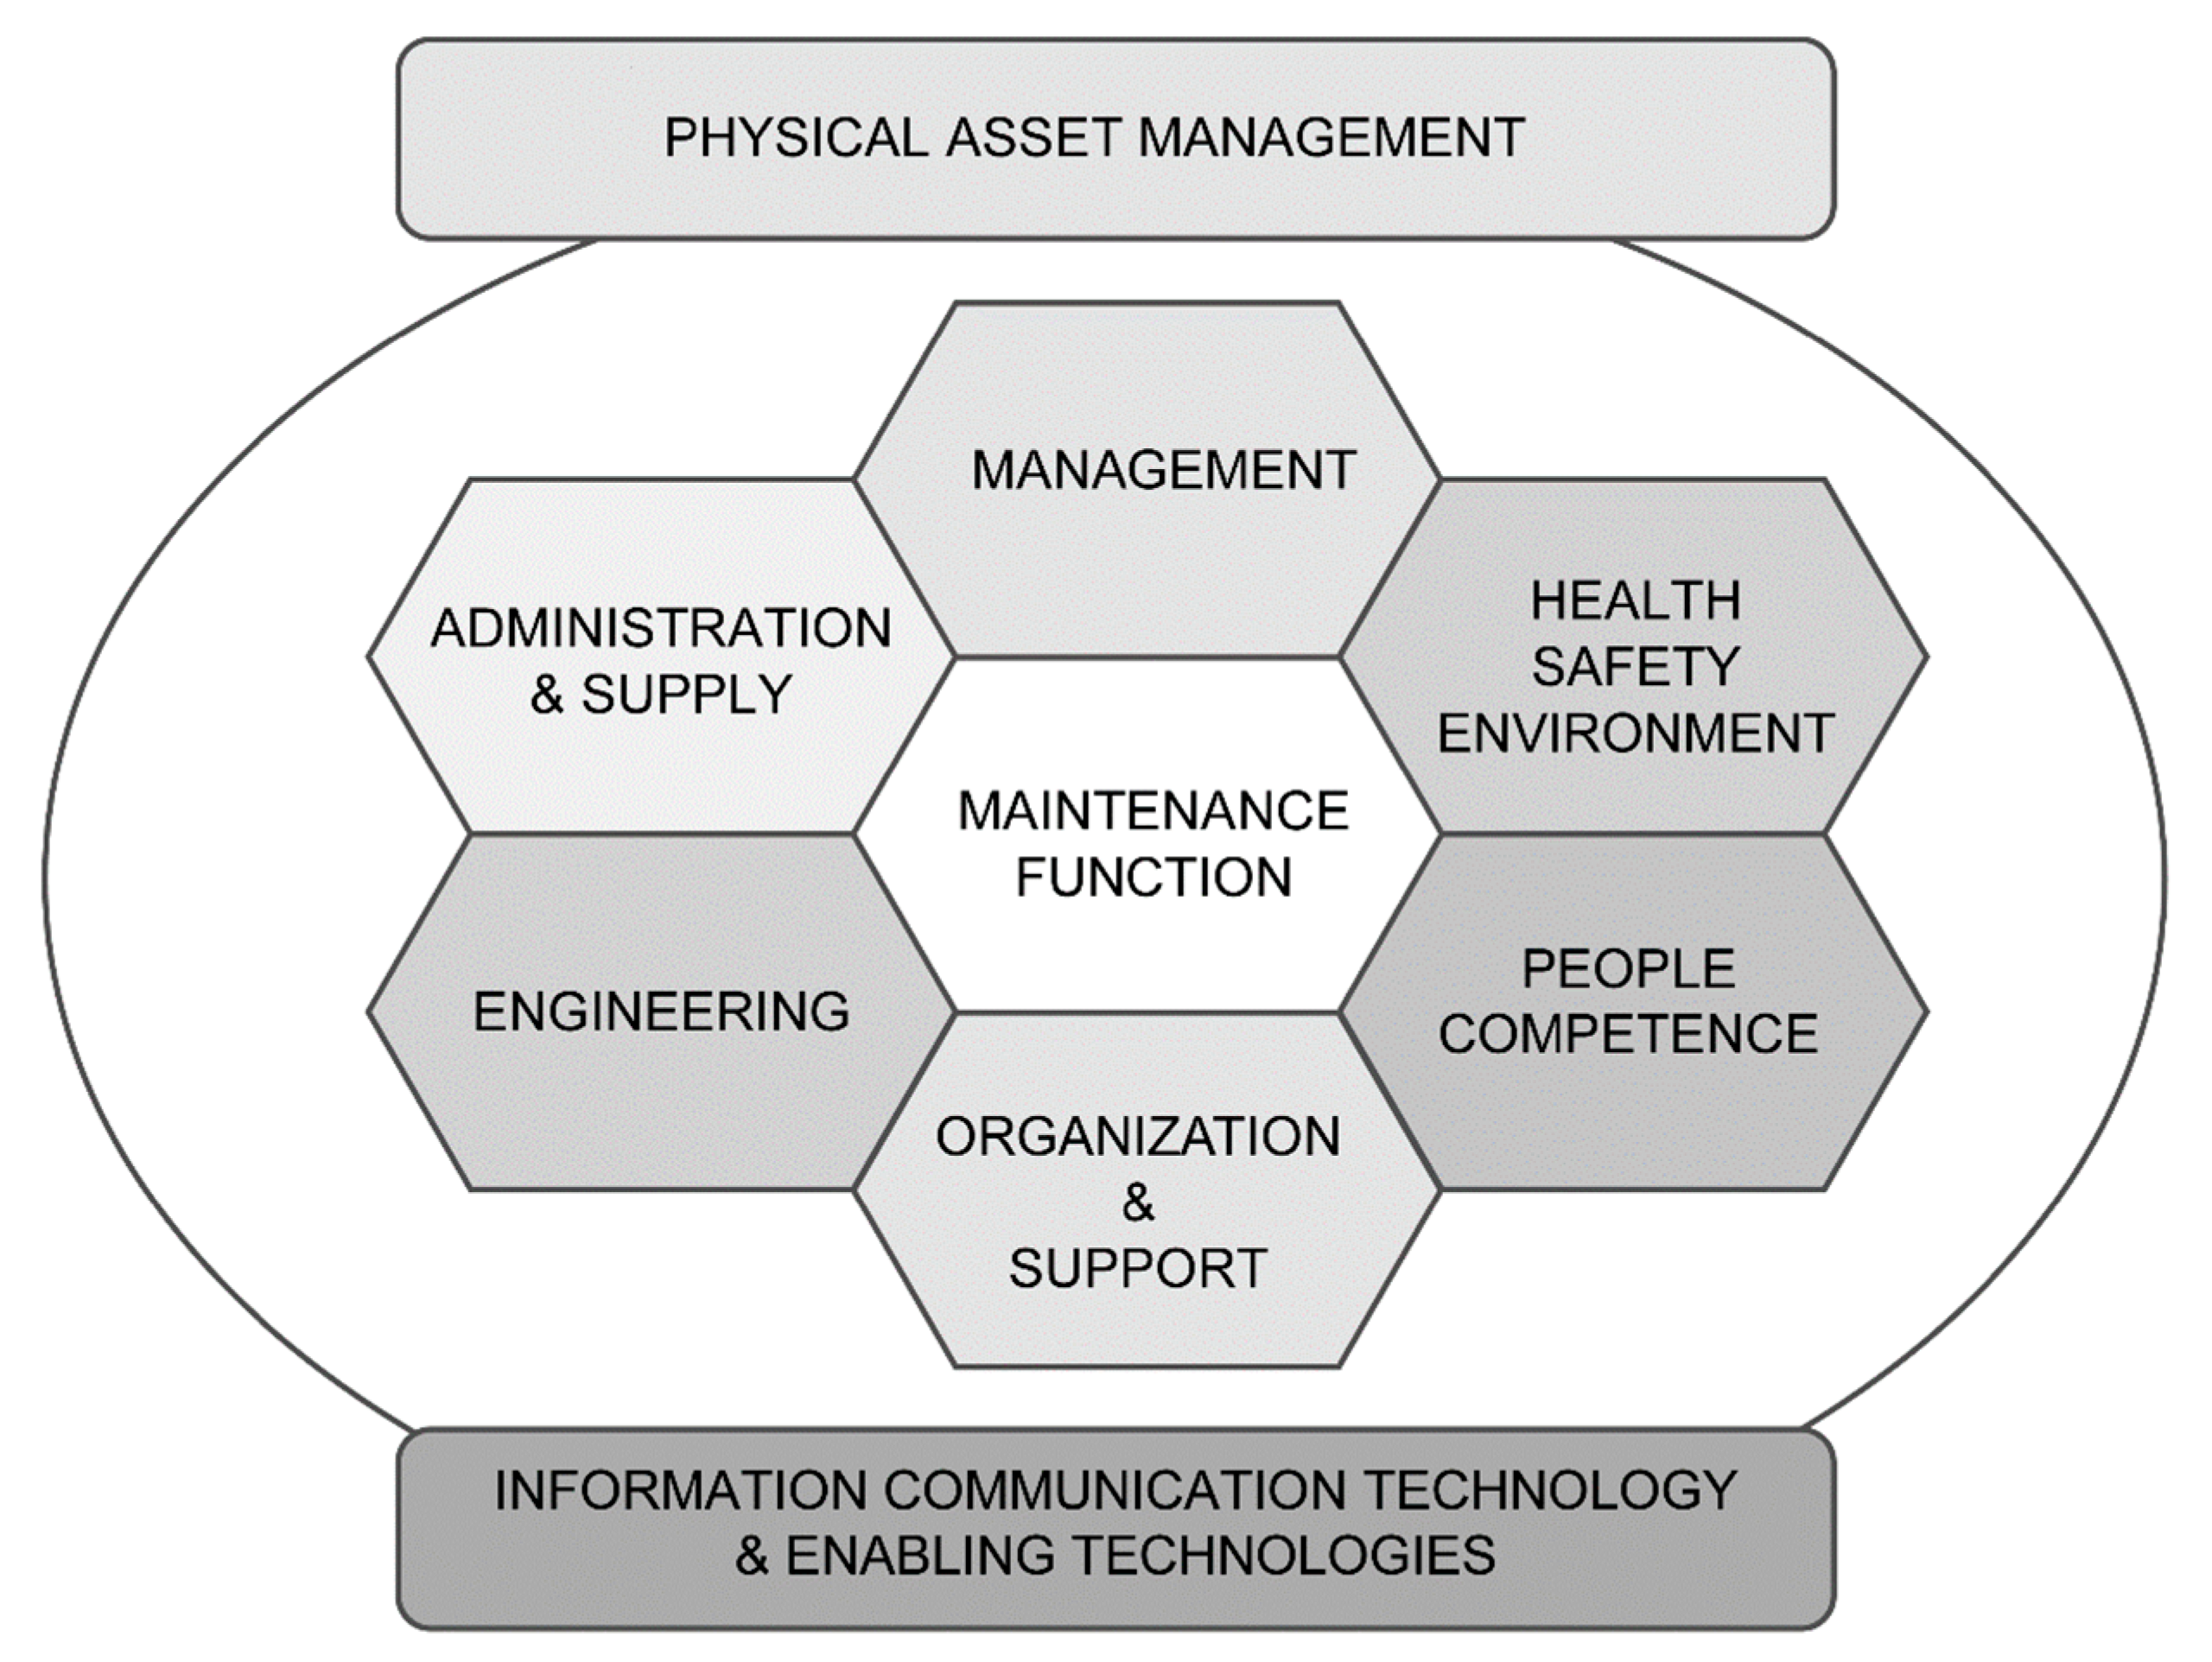
2.3. Definition and Formulation of KPI
- KPIs for “maintenance within physical asset management”;
- KPIs for the sub-function of “maintenance management”;
- KPIs for the sub-function of “maintenance engineering”;
- KPIs for the sub-function of “organisation and support”;
- KPIs for the sub-function “administration and supply”.
2.3.1. KPIs for “Maintenance within Physical Asset Management”
2.3.2. KPIs for Sub-Function “Maintenance Management”
2.3.3. KPIs for Sub-Function “Maintenance Engineering”
2.3.4. KPIs for Sub-Function “Organisation and Support”
2.3.5. KPIs for Sub-Function “Administration and Supply”
2.4. Instance Definition
- The mean time for a corrective maintenance intervention () is 10% of the periodicity of the activity;
- The workforce needed for an activity (ri) is 10 times the duration of the activity;
- The cost of the unemployed useful life of the asset (culi) and cost of corrective intervention (cci) are set to 100 and 1000, respectively, for all activities.
2.5. Report Design
- Overview: This section is divided into a left side and a right side. Both sides show the main indicators for the decision maker. On the left side, it is possible to observe the behaviour of availability, number of stoppages, mean failure risk and, inefficiency cost for any chosen tolerance. On the right side, it is possible to observe the variation of the left-side indicators, considering the difference between a 0% tolerance scenario and a chosen scenario.
- Best Performing Strategies: This section shows the strategies that perform best with respect to availability, number of stoppages, and failure risk.
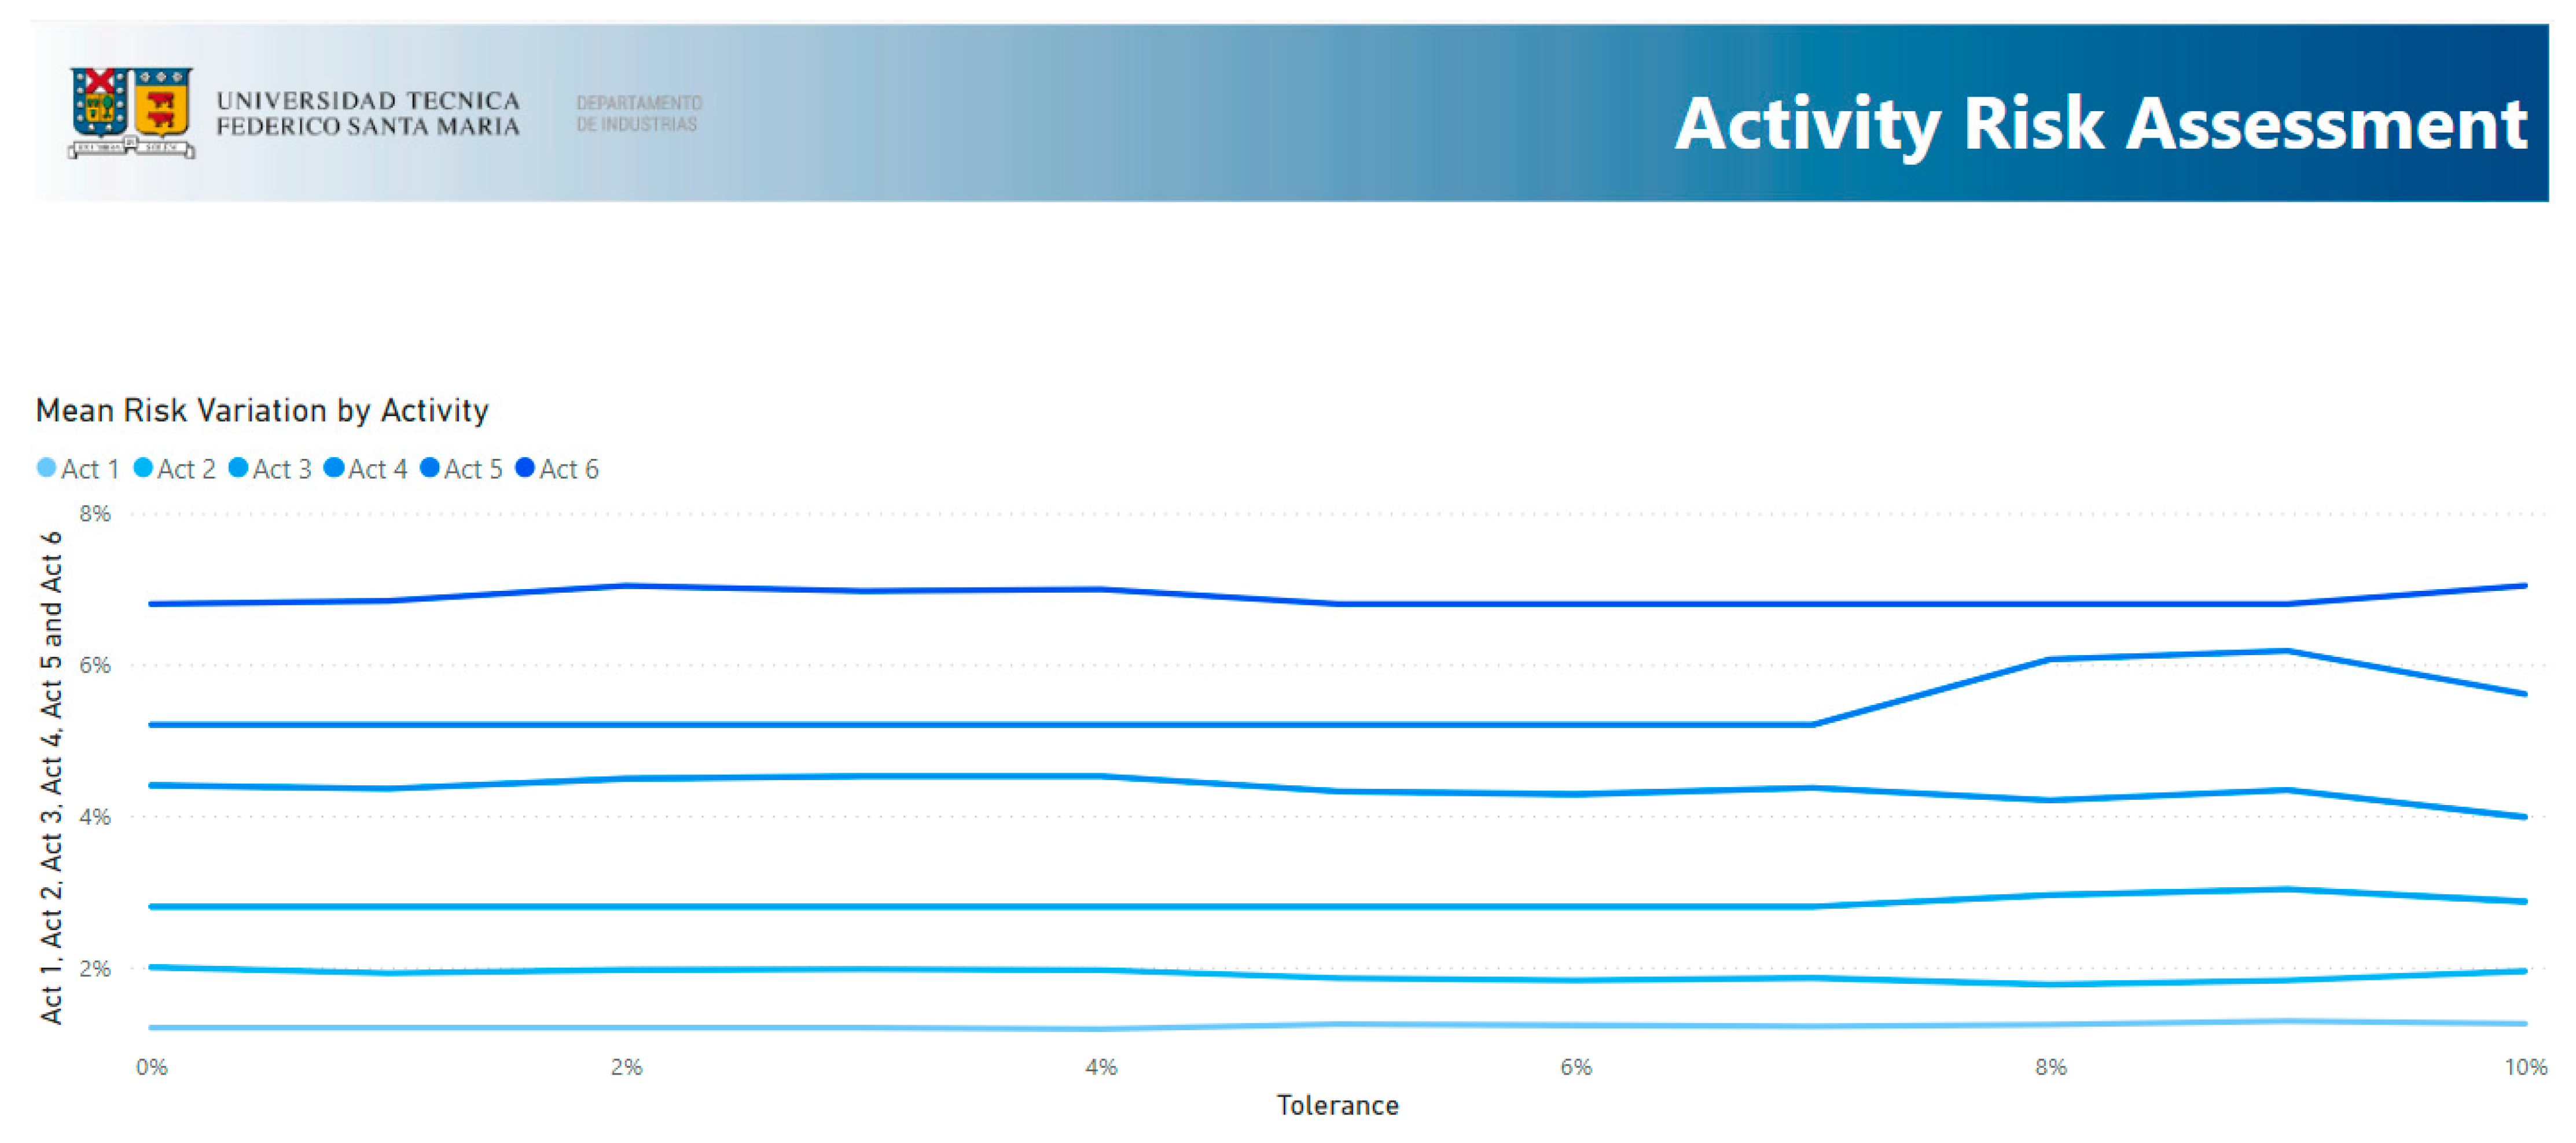
- Activity Risk Assessment: This section shows the mean failure risk for each activity and tolerance.
- Physical Asset Management: This section shows the variation of the mean failure risk regarding the 0% strategy.
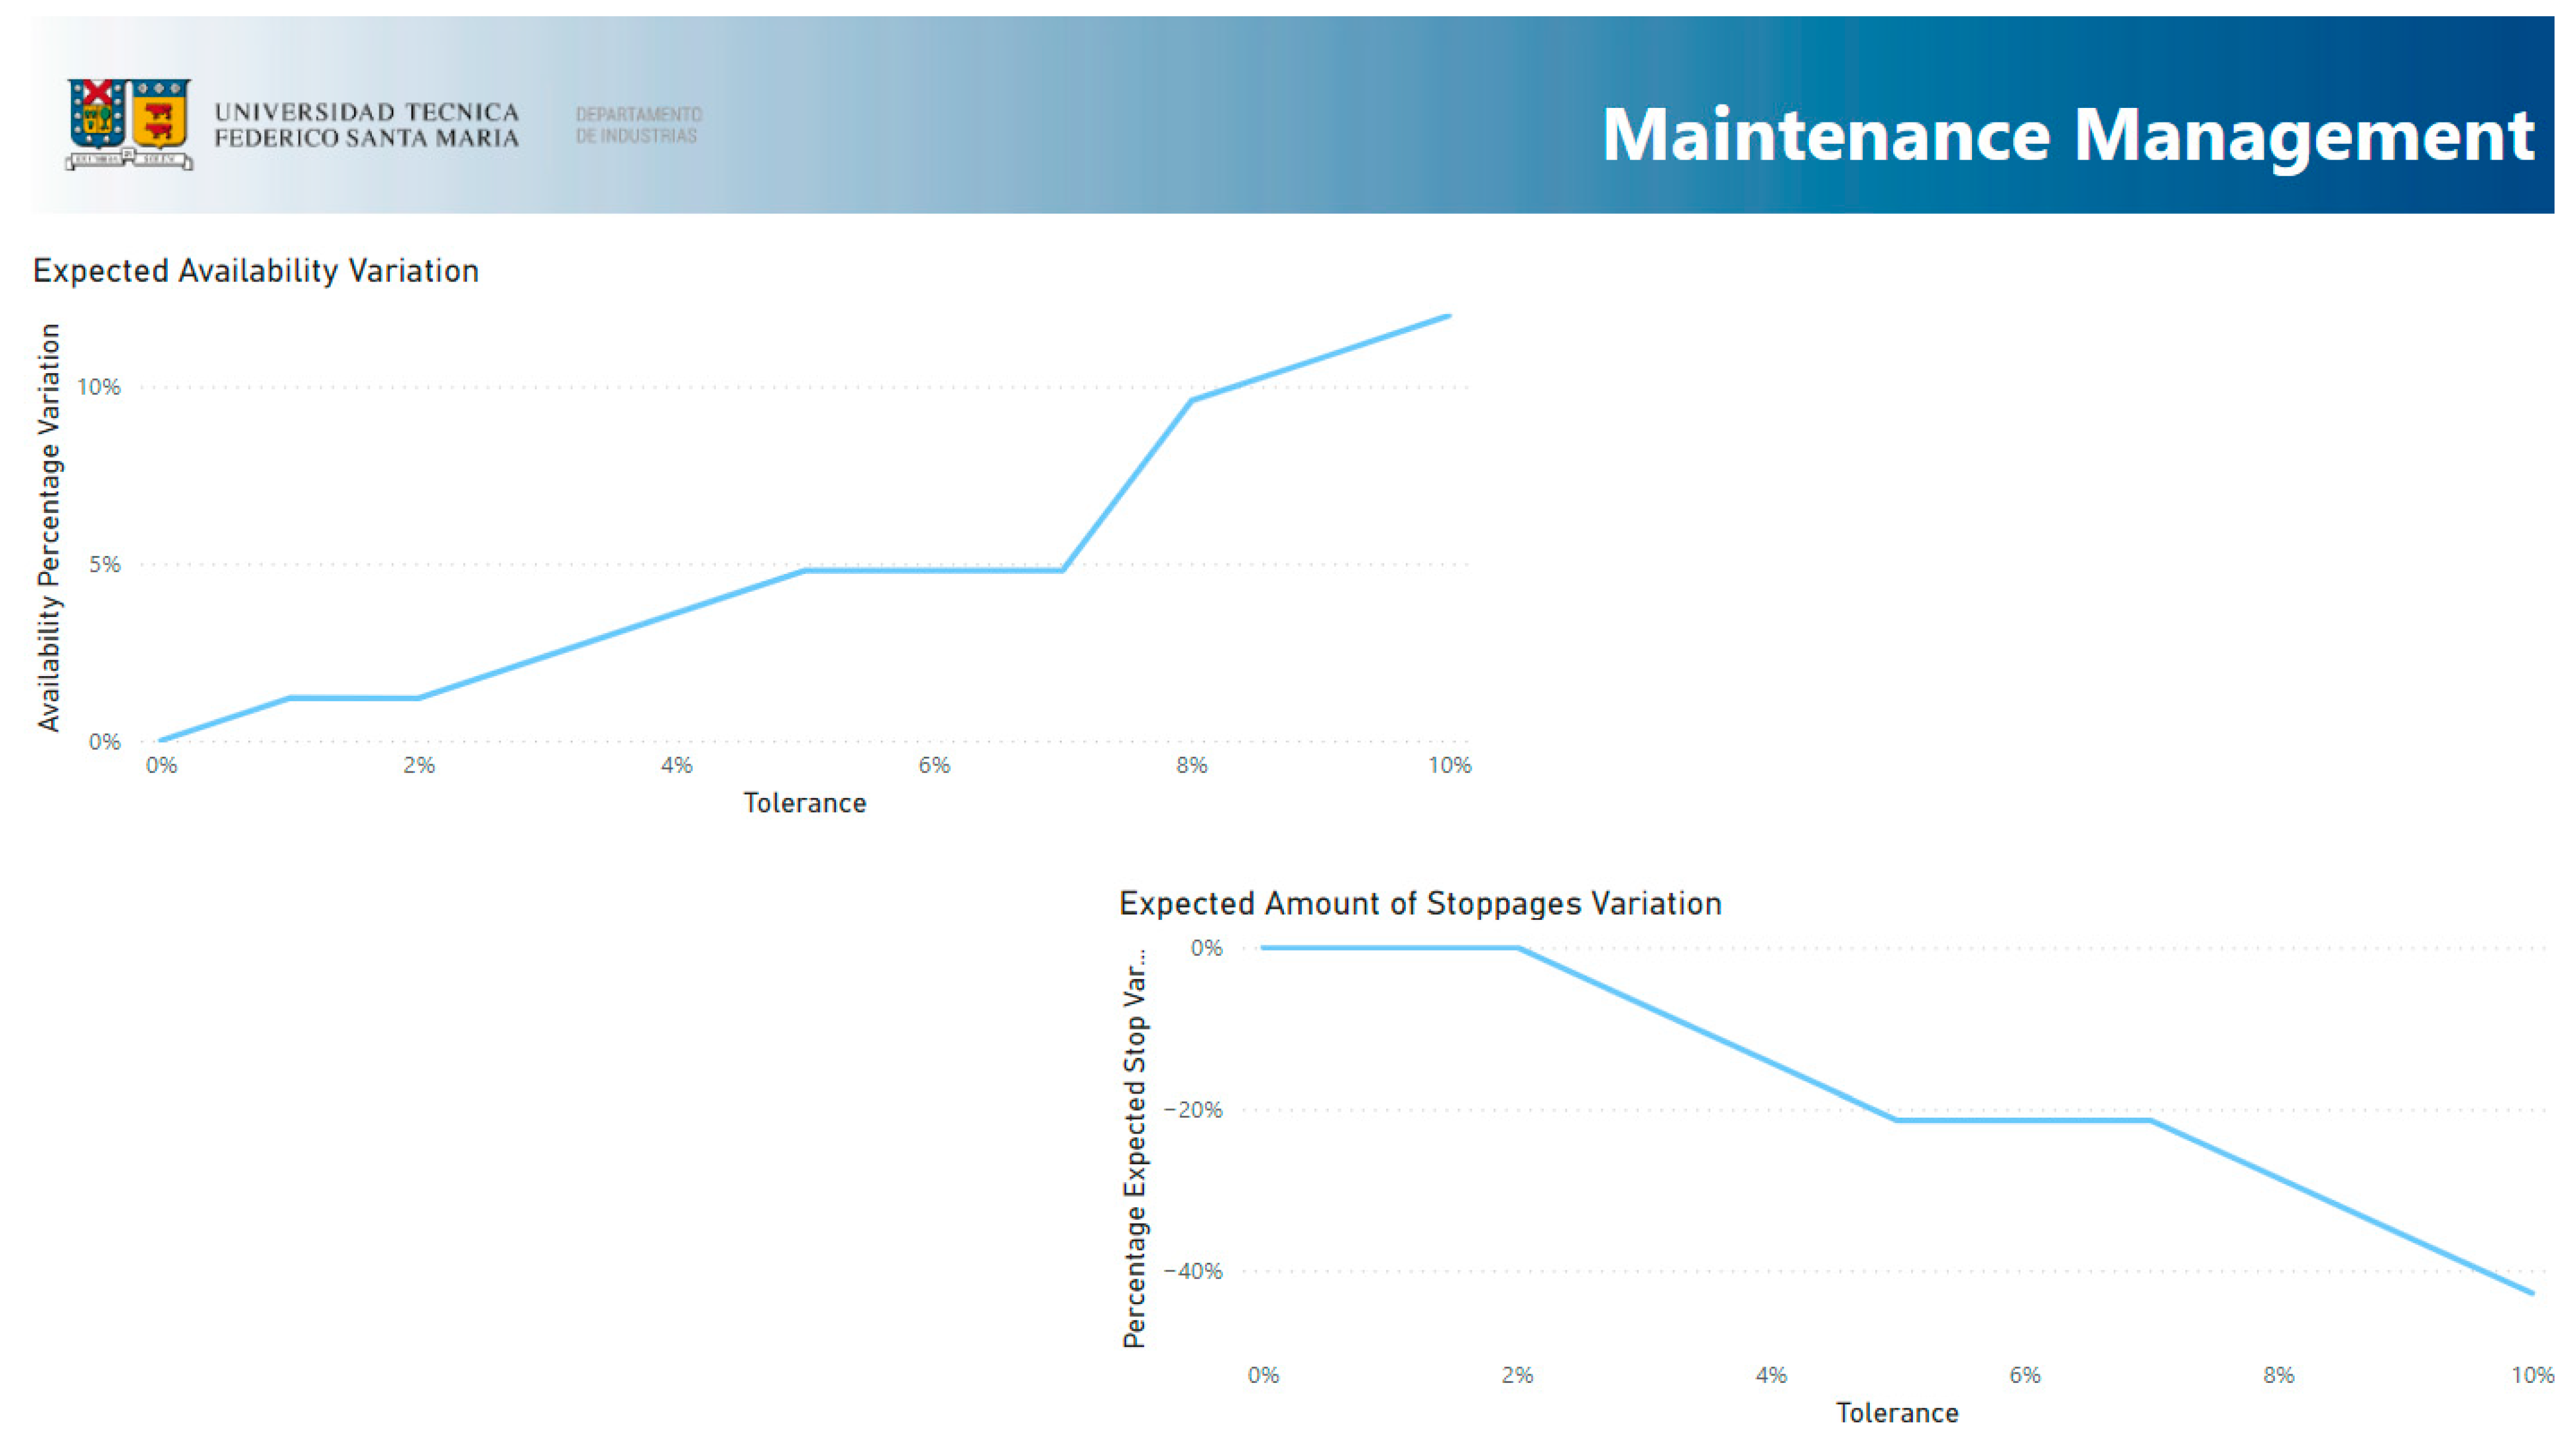
- Maintenance Management: This section shows the availability variation and stoppage variation regarding the 0% strategy.
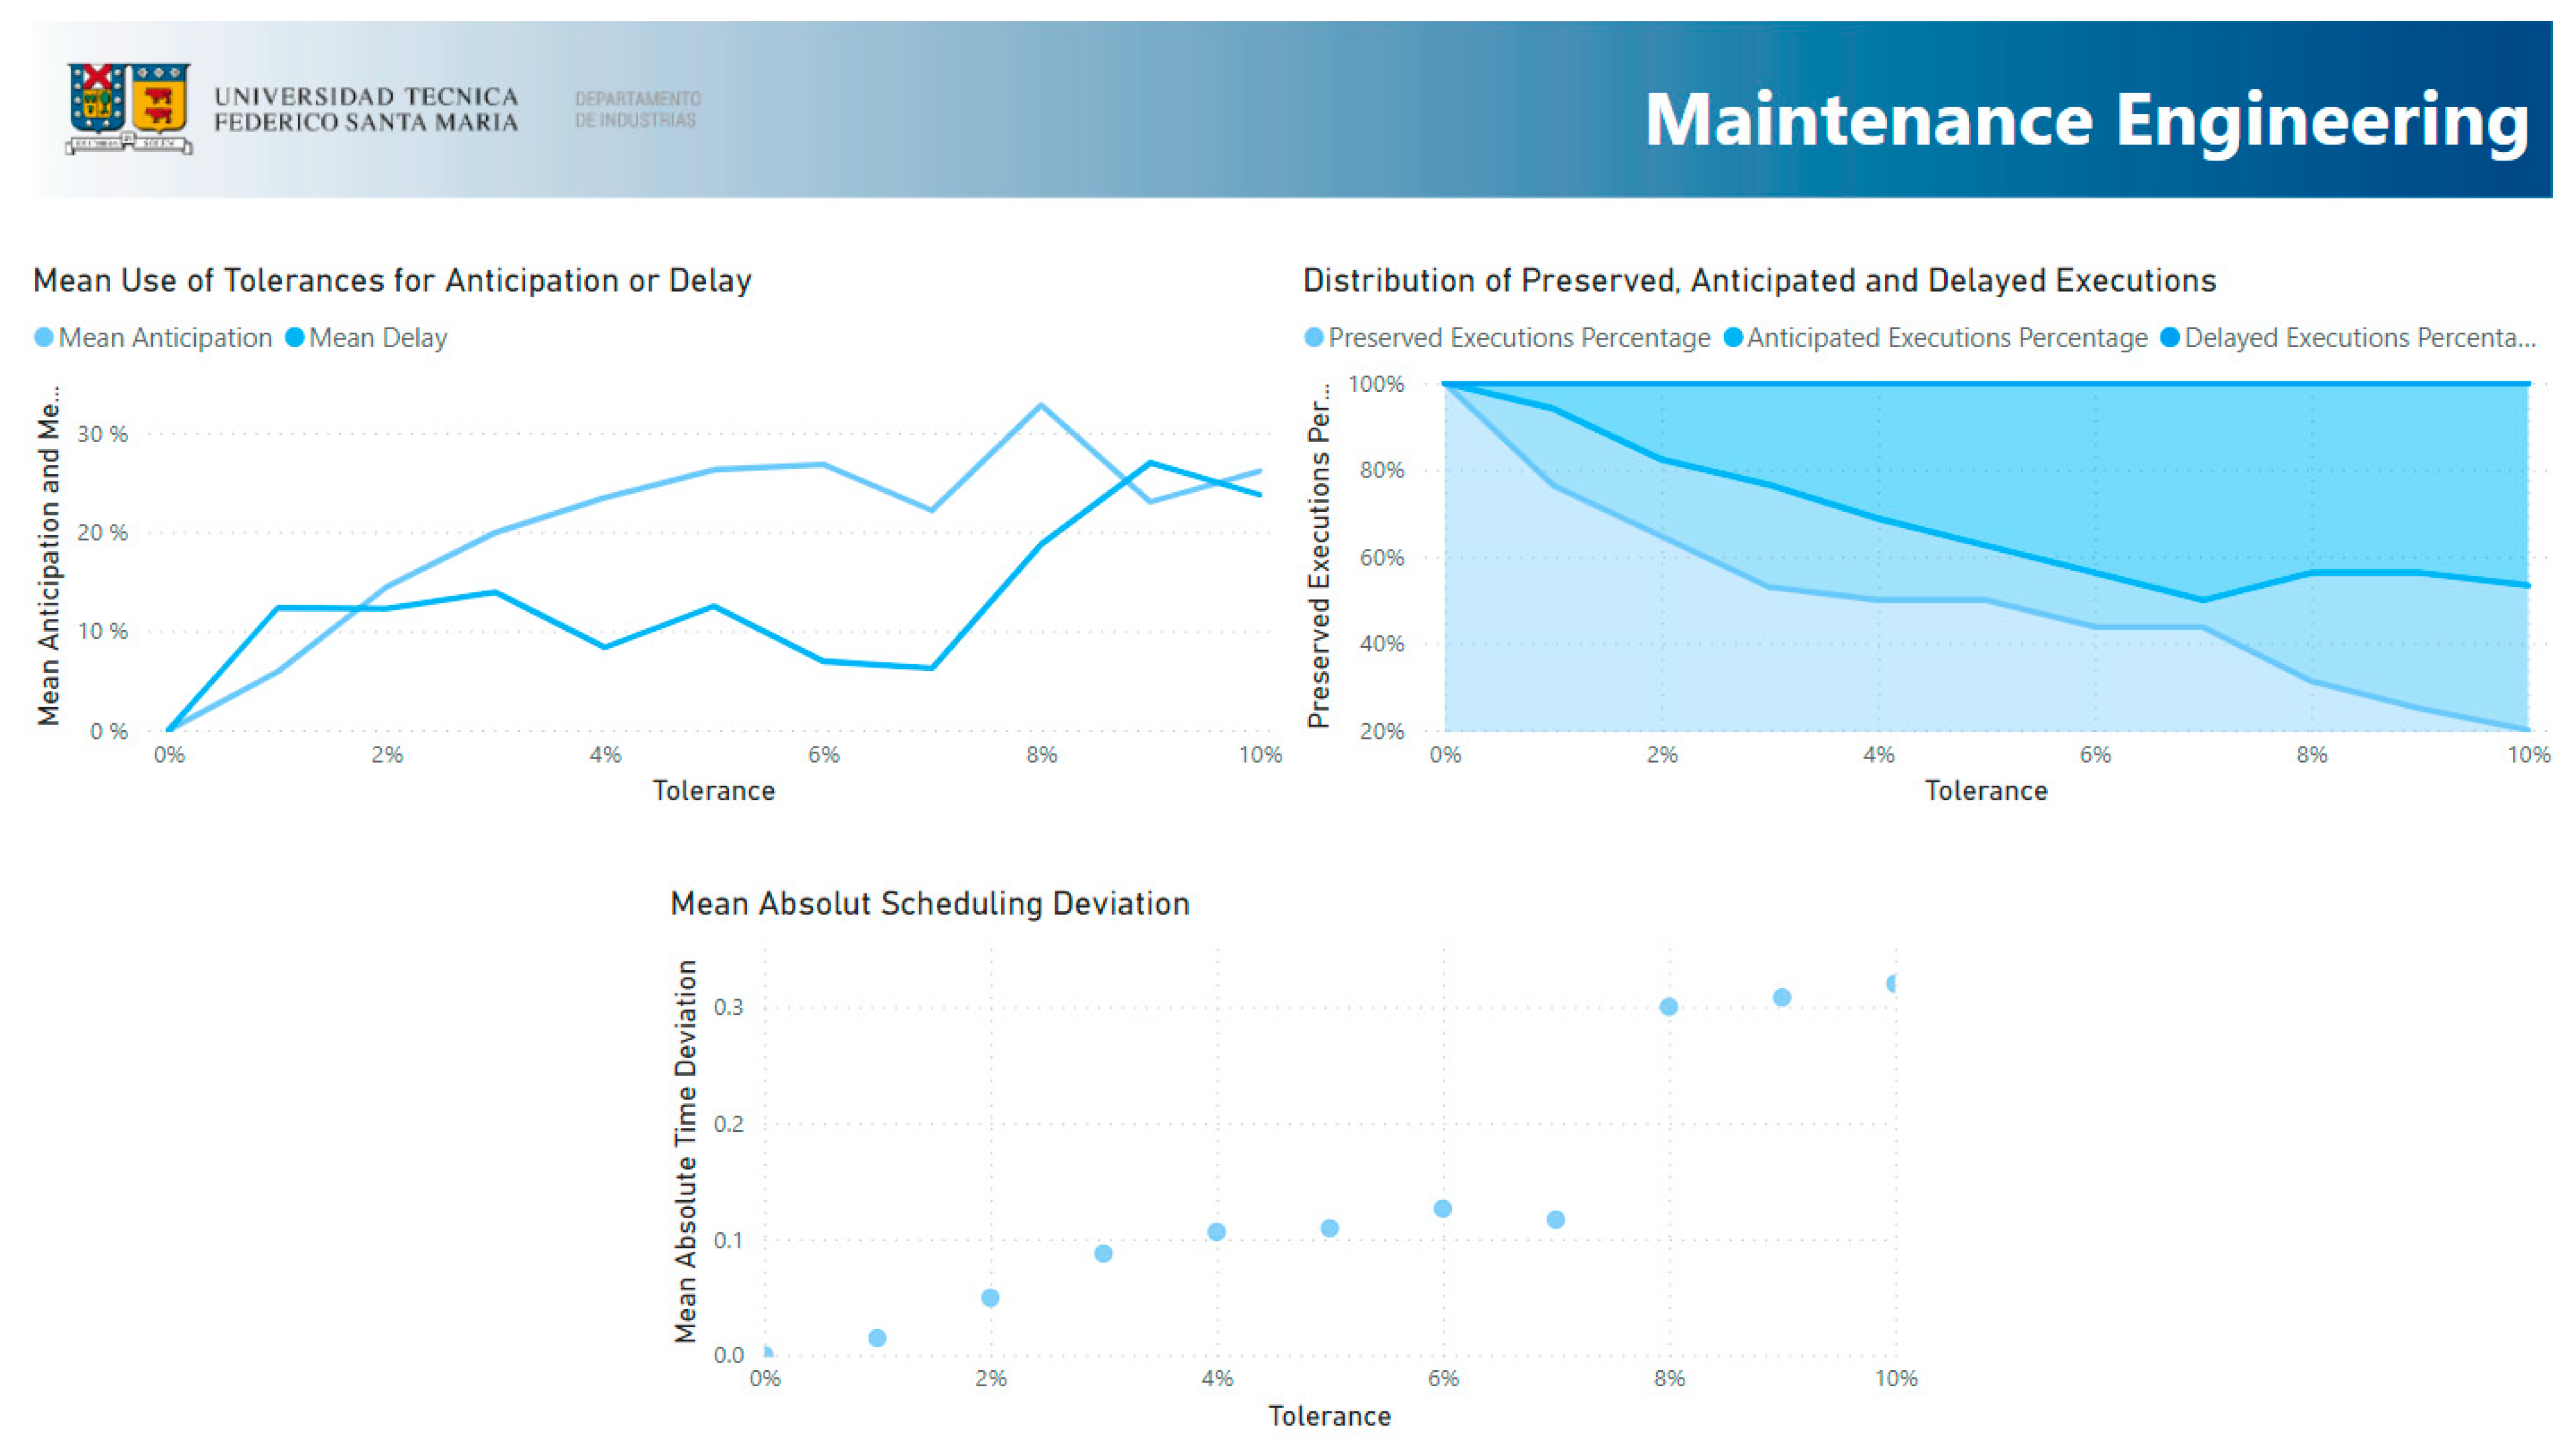
- Maintenance Engineering: This section presents the legacy indicators from the original algorithm and the deviation of the scheduling regarding the 0% strategy.
- Organisation and Support: This section presents a workforce balance of all time horizons, allowing the decision maker to choose and compare between tolerances with respect how human resources are employed. It also presents the mean workforce load for the chosen tolerance.
- Administration and Supply: The final section presents the inefficiency deviation, relative strategy cost, and the mean time between orders for each strategy.
3. Results and Discussion
3.1. Overview
3.2. Best-Performing Strategies
3.3. Activity Risk Assessment
3.4. Physical Asset Management
3.5. Maintenance Management
3.6. Maintenance Engineering
3.7. Organisation and Support
3.8. Administration and Supply
4. Conclusions
Author Contributions
Funding
Institutional Review Board Statement
Informed Consent Statement
Data Availability Statement
Conflicts of Interest
References
- de Jonge, B.; Scarf, P.A. A Review on Maintenance Optimization. Eur. J. Oper. Res. 2020, 285, 805–824. [Google Scholar] [CrossRef]
- Kristjanpoller, F.; Cárdenas-Pantoja, N.; Viveros, P.; Mena, R. Criticality Analysis Based on Reliability and Failure Propagation Effect for a Complex Wastewater Treatment Plant. Appl. Sci. 2021, 11, 10836. [Google Scholar] [CrossRef]
- Kristjanpoller, F.; Viveros, P.; Cárdenas, N.; Pascual, R. Assessing the Impact of Virtual Standby Systems in Failure Propagation for Complex Wastewater Treatment Processes. Complexity 2021, 2021, 9567524. [Google Scholar] [CrossRef]
- Pandey, M.; Zuo, M.J.; Moghaddass, R. Selective Maintenance Scheduling over a Finite Planning Horizon. Proc. Inst. Mech. Eng. Part O J. Risk Reliab. 2016, 230, 162–177. [Google Scholar] [CrossRef]
- Do, P.; Barros, A. Maintenance Grouping Models for Multicomponent Systems. In Mathematics Applied to Engineering; Elsevier: London, UK, 2017; pp. 147–170. [Google Scholar]
- Ding, S.-H.; Kamaruddin, S. Maintenance Policy Optimization—Literature Review and Directions. Int. J. Adv. Manuf. Technol. 2014, 76, 1263–1283. [Google Scholar] [CrossRef]
- Viveros, P.; Mena, R.; Zio, E.; Campos, S. Optimal Grouping and Scheduling of Preventive Maintenance Activities. In Proceedings of the 30th European Safety and Reliability Conference and the 15th Probabilistic Safety Assessment and Management Conference, Venice, Italy, 1–5 November 2020; Baraldi, P., Di Maio, F., Zio, E., Eds.; Research Publishing Services: Venice, Italy, 2020; pp. 2915–2922. [Google Scholar]
- Mena, R.; Viveros, P.; Zio, E.; Campos, S. An Optimization Framework for Opportunistic Planning of Preventive Maintenance Activities. Reliab. Eng. Syst. Saf. 2021, 215, 107801. [Google Scholar] [CrossRef]
- Viveros, P.; Mena, R.; Zio, E.; Miqueles, L.; Kristjanpoller, F. Integrated Planning Framework for Preventive Maintenance Grouping: A Case Study for a Conveyor System in the Chilean Mining Industry. Proc. Inst. Mech. Eng. Part O J. Risk Reliab. 2021, 1748006X2110537. [Google Scholar] [CrossRef]
- Wu, S. Preventive Maintenance Models: A Review. In Replacement Models with Minimal Repair; Springer: London, UK, 2011; Volume 43, pp. 129–140. [Google Scholar]
- Blanchard, B.S.; Blyler, J.E. System Engineering Management; John Wiley & Sons, Inc.: Hoboken, NJ, USA, 2016; ISBN 9781119178798. [Google Scholar]
- Tarelko, W. Control Model of Maintainability Level. Reliab. Eng. Syst. Saf. 1995, 47, 85–91. [Google Scholar] [CrossRef]
- Al-Turki, U.M. Maintenance Planning and Scheduling. In Handbook of Maintenance Management and Engineering; Springer: London, UK, 2009; pp. 237–262. [Google Scholar]
- Nicolai, R.P.; Dekker, R. Optimal Maintenance of Multi-Component Systems: A Review. In Complex System Maintenance Handbook; Springer: London, UK, 2008; Volume 8, pp. 263–286. [Google Scholar]
- Tsang, A.H.C. Strategic Dimensions of Maintenance Management. J. Qual. Maint. Eng. 2002, 8, 7–39. [Google Scholar] [CrossRef]
- Kumar, U.; Galar, D.; Parida, A.; Stenström, C.; Berges, L. Maintenance Performance Metrics: A State-of-the-Art Review. J. Qual. Maint. Eng. 2013, 19, 233–277. [Google Scholar] [CrossRef] [Green Version]
- Parida, A.; Kumar, U.; Galar, D.; Stenström, C. Performance Measurement and Management for Maintenance: A Literature Review. J. Qual. Maint. Eng. 2015, 21, 2–33. [Google Scholar] [CrossRef]
- Eckerson, W.W. Performance Dashboards; Eckerson, W.W., Ed.; Wiley: Hoboken, NJ, USA, 2012; ISBN 9780470589830. [Google Scholar]
- Shohet, I.M. Key Performance Indicators for Strategic Healthcare Facilities Maintenance. J. Constr. Eng. Manag. 2006, 132, 345–352. [Google Scholar] [CrossRef]
- Wireman, T. Developing Performance Indicators for Managing Maintenance; Industrial Press: New York, NY, USA, 2005; ISBN 0831131845. [Google Scholar]
- Lynch, R.L.; Cross, K.F. Measure Up-The Essential Guide to Measuring; Mandarin: London, UK, 1991. [Google Scholar]
- Parida, A. Study and Analysis of Maintenance Performance Indicators (MPIs) for LKAB: A Case Study. J. Qual. Maint. Eng. 2007, 13, 325–337. [Google Scholar] [CrossRef] [Green Version]
- Anggradewi, P.; Aurelia; Sardjananto, S.; Ekawati, A.D. Improving Quality in Service Management through Critical Key Performance Indicators in Maintenance Process: A Systematic Literature Review. Qual.-Access Success 2019, 20, 72–79. [Google Scholar]
- Stefanovic, M.; Nestic, S.; Djordjevic, A.; Djurovic, D.; Macuzic, I.; Tadic, D.; Gacic, M. An Assessment of Maintenance Performance Indicators Using the Fuzzy Sets Approach and Genetic Algorithms. SAGE J. 2015, 231, 15–27. [Google Scholar] [CrossRef]
- Microsoft What Is Power BI?—Power BI|Microsoft Docs. Available online: https://docs.microsoft.com/en-us/power-bi/fundamentals/power-bi-overview%0Ahttps://docs.microsoft.com/en-us/power-bi/fundamentals/power-bi-overview%0Ahttps://docs.microsoft.com/fi-fi/power-bi/fundamentals/power-bi-overview (accessed on 9 November 2021).
- BS-EN 15341:2019; Maintenance—Maintenance Key Performance Indicators. British Standard Institute: British, UK, 2019; ISBN 978 0 580 97964 4.
- UNE-EN 17007:2018; Maintenance Process and Associated Indicators. Asociación Española de Normalización (UNE): Madrid, Spain, 2017.


| 1 | 3 | 0.2 |
| 2 | 5 | 1 |
| 3 | 7 | 0.5 |
| 4 | 11 | 1.5 |
| 5 | 13 | 1.1 |
| 6 | 17 | 1.3 |
| 1 | 2 | 0 | 15 |
| 2 | 2 | 0 | 25 |
| 3 | 2 | 0 | 35 |
| 4 | 2 | 0 | 55 |
| 5 | 2 | 0 | 65 |
| 6 | 2 | 0 | 85 |
| 500 | 1000 |
| 1 | 0.3 | 2 | 100 | 1000 |
| 2 | 0.5 | 10 | 100 | 1000 |
| 3 | 0.7 | 5 | 100 | 1000 |
| 4 | 1.1 | 15 | 100 | 1000 |
| 5 | 1.3 | 11 | 100 | 1000 |
| 6 | 1.7 | 13 | 100 | 1000 |
Publisher’s Note: MDPI stays neutral with regard to jurisdictional claims in published maps and institutional affiliations. |
© 2022 by the authors. Licensee MDPI, Basel, Switzerland. This article is an open access article distributed under the terms and conditions of the Creative Commons Attribution (CC BY) license (https://creativecommons.org/licenses/by/4.0/).
Share and Cite
Viveros, P.; Pantoja, N.C.; Kristjanpoller, F.; Mena, R. Reportability Tool Design: Assessing Grouping Schemes for Strategic Decision Making in Maintenance Planning from a Stochastic Perspective. Appl. Sci. 2022, 12, 5386. https://doi.org/10.3390/app12115386
Viveros P, Pantoja NC, Kristjanpoller F, Mena R. Reportability Tool Design: Assessing Grouping Schemes for Strategic Decision Making in Maintenance Planning from a Stochastic Perspective. Applied Sciences. 2022; 12(11):5386. https://doi.org/10.3390/app12115386
Chicago/Turabian StyleViveros, Pablo, Nicolás Cárdenas Pantoja, Fredy Kristjanpoller, and Rodrigo Mena. 2022. "Reportability Tool Design: Assessing Grouping Schemes for Strategic Decision Making in Maintenance Planning from a Stochastic Perspective" Applied Sciences 12, no. 11: 5386. https://doi.org/10.3390/app12115386
APA StyleViveros, P., Pantoja, N. C., Kristjanpoller, F., & Mena, R. (2022). Reportability Tool Design: Assessing Grouping Schemes for Strategic Decision Making in Maintenance Planning from a Stochastic Perspective. Applied Sciences, 12(11), 5386. https://doi.org/10.3390/app12115386


