Article

Stress Optimization of Vent Holes with Different Shapes Using Efficient Switching Delayed PSO Algorithm

1
School of Aerospace Engineering, Xiamen University, Xiamen 361102, China
2
National Key Laboratory of Science and Technology on Helicopter Transmission, AECC Hunan Aviation Powerplant Research Institute, Zhuzhou 412002, China
*
Author to whom correspondence should be addressed.
Appl. Sci. 2022, 12(11), 5395; https://doi.org/10.3390/app12115395
Submission received: 13 April 2022 / Revised: 21 May 2022 / Accepted: 23 May 2022 / Published: 26 May 2022
(This article belongs to the Special Issue Aircrafts Reliability and Health Management)

Abstract

:
An effective integrated design optimization method is developed to reduce the maximum von Mises stress around vent holes of a high-pressure turbine sealing disk. It mainly includes four different shape designs (circular, elliptical, race-track, and four-arc) for holes, an updated self-developed modelling and meshing tool, an APDL-based strength analysis, and a self-proposed efficient switching delayed particle swarm optimization (SDPSO) algorithm. The main idea of SDPSO is: (1) by evaluating an evolutionary factor and utilizing a probability transition matrix, a non-homogeneous Markov chain is determined and auto-updated in each generation; (2) the evolutionary factor and the Markov chain are used to adaptively select the inertia weight, acceleration coefficients, and delayed information to adjust the particle’s velocity. The performance of SDPSO is evaluated through two benchmark optimization problems with constraints. The results show that SDPSO is superior to two well-known PSO algorithms in optimization capability, numerical robustness, and convergence speed. Furthermore, SDPSO is used for the stress optimization of vent holes with four different shapes. The results show that: (1) SDPSO is suitable and valuable for practical engineering optimization problems with constraints; (2) the developed integrated design optimization method is effective and advanced for reducing the maximum von Mises stress around the vent holes; and (3) the four-arc hole has more tremendous advantages in reducing the maximum von Mises stress, followed by the elliptical hole, the race-track hole, and the circular hole.

1. Introduction

Vent holes, pin holes, bolt holes, and other holes are widely distributed in aero-engines, airplanes, automobiles, ships, and other mechanical products. The shapes of these holes may be different because of the diversity of service requirements. Circular holes are the most common, and complex shapes such as elliptical and polygonal holes are also widely used. Due to sudden changes in geometry and load, the areas near the holes are prone to stress concentration [1], which may become a potential inducement to reduce the product’s overall life. Especially for the high-temperature components of an aero-engine, the alternating loads at high temperatures make it easy to produce fatigue cracks in the high-stress areas around the holes [2,3]. These cracks may extend to nearby load-bearing structures and eventually lead to structural failure. Therefore, it is essential to obtain an accurate stress distribution near the holes.
The stress distribution around the holes has been extensively studied by analytical methods [4,5], finite element methods (FEM) [6], and experimental methods [7,8,9]. Guan et al. [10] introduced a general shear–stress solution to the anti-plane problem of an arbitrarily shaped hole that was reinforced with a functionally graded layer in a homogenous plate. Shang et al. [11] investigated the high-temperature tensile behavior for film-hole plates and found that the strain distribution obtained in situ by the digital image correlation technique exhibits an X-like concentration around the hole. The FEM-based simulation was also conducted to explain the in-situ experimental results. Using a self-developed theoretical model, Duan et al. [12] investigated the circular hole–edge stress concentration of the long glass fiber reinforced polypropylene composite. The corresponding physical tests were also conducted under tensile loading monitored by a digital image correlation system. The results showed that the theoretical predictions agree well with the experimental results. The analytical methods mainly utilize the theory of complex variable functions and the conformal mapping technique to obtain the stress distribution of a rectangular or infinite plate with holes [10]. It may be insufficient to deal with the holes with complex shapes or particular positions in practical engineering structures with advanced materials [13,14]. The experimental methods could measure the stress results closest to the actual situation. However, the operation procedure is complex and inconvenient for newcomers, and the test cost is relatively high and unbearable for most design tasks. With the rapid development of computing technology, the accuracy and efficiency of FEM have been continuously improved and recognized by academia and industry [15].
The FEM-based optimization has become popular in the shape optimization of holes to reduce the stress concentration with the help of numerical optimization techniques [16,17]. Park et al. [18] carried out a FEM-based optimization for the shape and pattern of holes and slits of a brake disk, which minimizes the concentrated stress and simultaneously improves the cooling performance. Han et al. [19] proposed an equilibrium multi-objective optimization model with self-regulated weighting factors for the optimum design of a non-circular clearance hole on the front flange of a turbine disk. The stress decrease around the hole and the minimal hole’s profile variation were considered in the equilibrium design. Chen et al. [20] optimized a uniaxial symmetry non-circular bolt clearance hole on the turbine disk based on FEM by selecting the maximum first principal stress as the objective function. The results showed that the stress concentration is relieved, and the maximum first principal stress and the maximum von Mises stress on the critical area are reduced by 30.39% and 25.34%, respectively. The author of [21] proposed a four-arc hole design method for vent holes and adopted the traditional Multi-Island Genetic Algorithm to optimize them. The results showed that the maximum von Mises stress is reduced to 963.435 MPa. These studies mainly focus on the shape design of holes and have achieved good results, but the selection and discussion of optimization algorithms are relatively few. Actually, the optimization algorithm has a significant impact on the final scheme. An appropriate optimization algorithm will help designers get a good design scheme at a fast speed.
Nowadays, swarm intelligence has been widely used to find globally optimal solutions to optimization problems, such as the genetic algorithm (GA) [22,23], the artificial bee colony algorithm (ABC) [24], and the particle swarm optimization (PSO) [25]. In contrast to various evolutionary techniques, PSO is regarded as one of the best-accepted techniques that are cheap in time consumption and simple for implementation. However, the classical PSO algorithm has the defects of poor local search ability and low search efficiency. To improve the performance of PSO, an adaptive PSO algorithm based on an evolutionary factor has been proposed by Zhan et al. [26]. It could adaptively control the PSO’s parameters, including the inertia weight and other parameters. Moreover, the author developed a novel switching delayed PSO (SDPSO) algorithm based on the adaptive switching strategy and the delayed information [27]. It dramatically improves the search efficiency and convergence speed of the PSO algorithm. However, the conclusions were obtained only through five simple unconstrained functions. The application of SDPSO in practical constrained engineering problems has not been investigated.
An industrial high-pressure turbine (HPT) sealing disk was initially designed with seventy-five circular vent holes, where severe stress concentration occurs. To handle the stress concentration and reduce the maximum von Mises stress of the initial circular vent holes, this paper attempts to redesign and optimize the shape of the vent holes. Different from the existing studies, an effective integrated design optimization method is developed. The main contribution of this paper is: (1) developing an effective integrated design optimization method for the shape design of vent holes of the HPT sealing disk to reduce the maximum von Mises stress; (2) optimizing and comparing different shapes of vent holes, and analyzing and finding out the best design scheme to meet the needs of industrial design; and (3) investigating the practicality of SDPSO in engineering optimization problems with constraints.

2. Vent Holes of HPT Sealing Disk

The HPT sealing disk is a crucial component of an aero-engine. It could prevent the high-temperature gas from entering the disk cavity and affecting the service life of the HPT disk. The main reason is that the typical structures on it, such as vent holes, regulate the cooling airflow in each chamber. The vent holes are located at the outlet of the pre-swirl nozzle, which is also a vital component of the pre-swirl system. Numerous studies have shown that the vent holes’ radial position and total area could significantly affect the pre-swirl system’s aerodynamic and heat transfer performance [28,29]. The vent holes are obviously significant, yet the harsh working environment of high temperatures and high rotational speeds make them bear large and complex mechanical and thermal loads. The sudden change of the cross-section of the holes easily causes severe stress concentration. The areas around the vent holes are thus easy to fail and belong to the hazardous strength regions. It can be seen that the design of vent holes is a complex multi-disciplinary and multi-part collaborative task.
An HPT sealing disk was initially designed with seventy-five circular vent holes, of which the total area is s t . This scheme fully meets the pre-swirl system’s aerodynamic and heat transfer performance requirements yet violates the strength requirements. Figure 1 shows the von Mises stress distribution of the single-hole sector sub-model of the HPT sealing disk [21]. We can see that the severe stress concentration happens around the vent holes, and the maximum von Mises stress is much greater than the yield strength of the selected material.

3. Methods

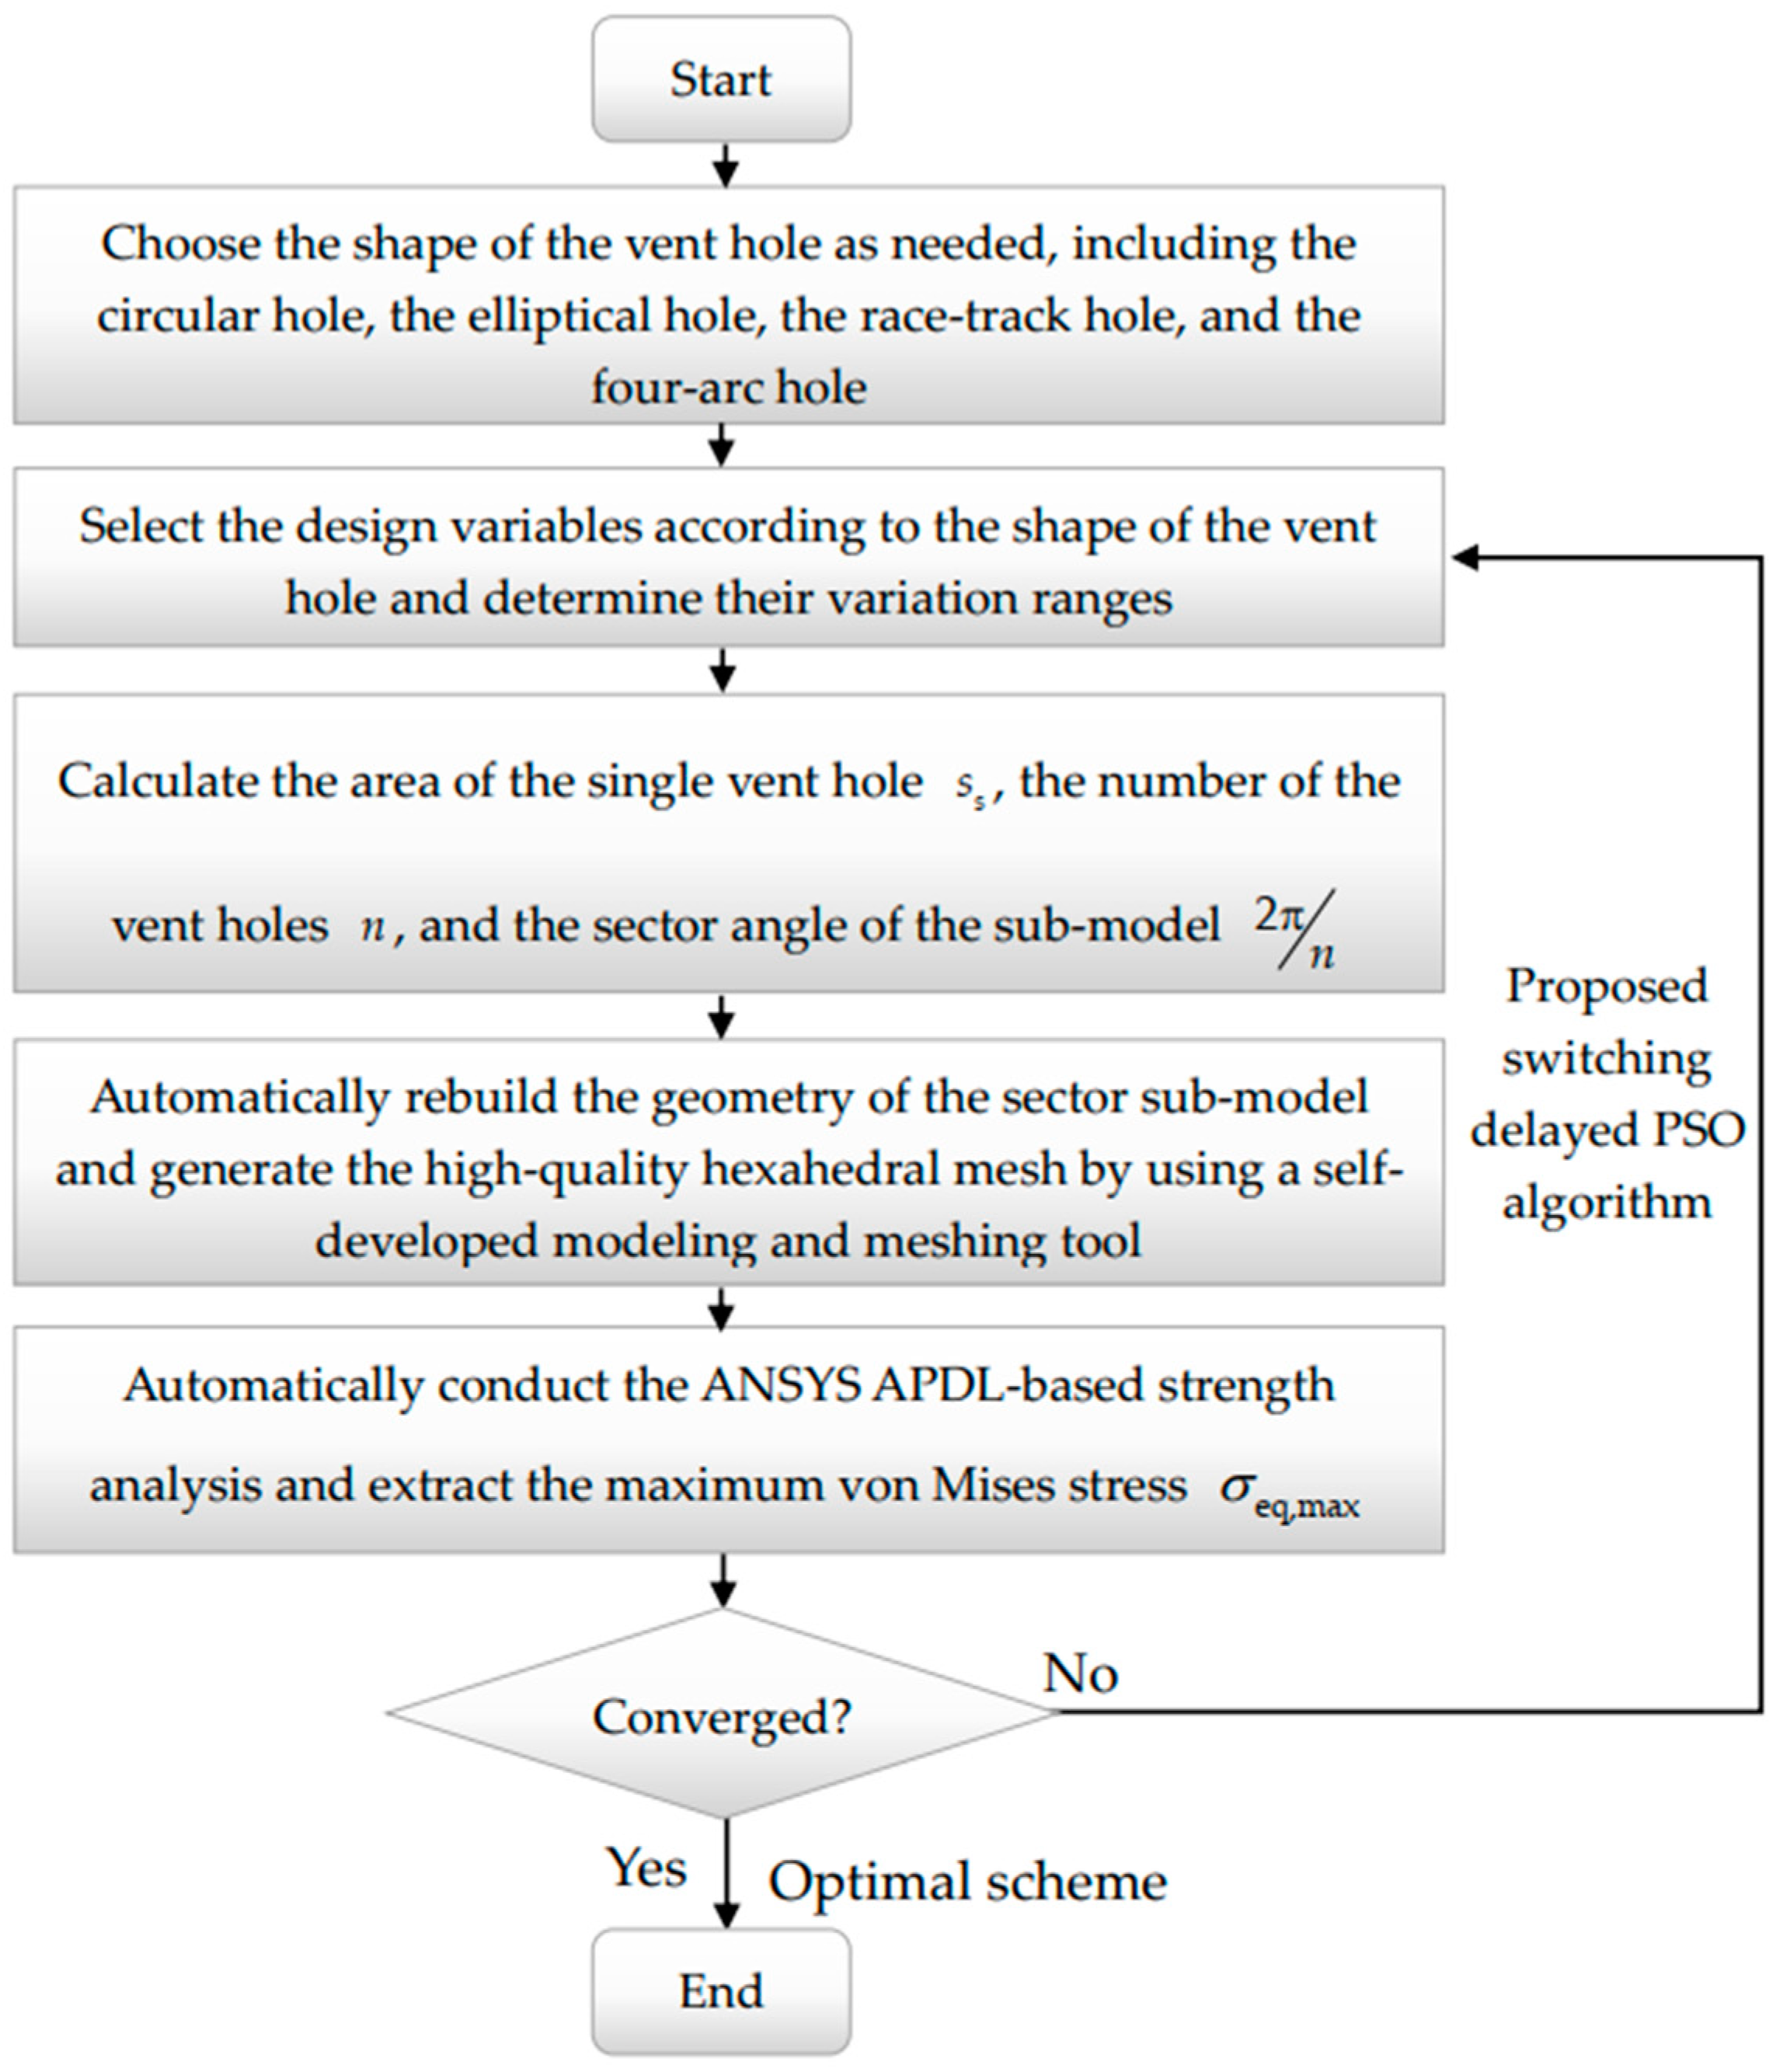
3.1. Integrated Design Optimization Method

To reduce the computational cost of the FEM-based optimization, this paper selects the cyclically symmetric sector sub-model of the studied HPT sealing disk as the analytical model, as shown in Figure 2. The sub-model was proposed by the author, and its effectiveness has been validated [21]. To fully consider the pre-swirl system’s aerodynamic and heat transfer performance requirements, the vent holes’ total area and radial position are strictly limited to a small variation range. In optimization, the vent hole is located in the blue area in Figure 2. To be noted, the area of the single vent hole is changed in optimization. The number of the vent holes n and the sector angle of the sub-model are changed accordingly. The change of the discrete quantity n may lead to some difficulties in geometric modelling, mesh generation, and finite element analysis. These difficulties are solved by using the developed integrated design optimization method. Figure 3 shows the flowchart of the integrated design optimization method, which mainly includes four different shape designs (circular, elliptical, race-track, and four-arc) for holes, an updated self-developed modelling and meshing tool, an APDL-based strength analysis, and a self-proposed efficient SDPSO algorithm. The details are introduced as follows:
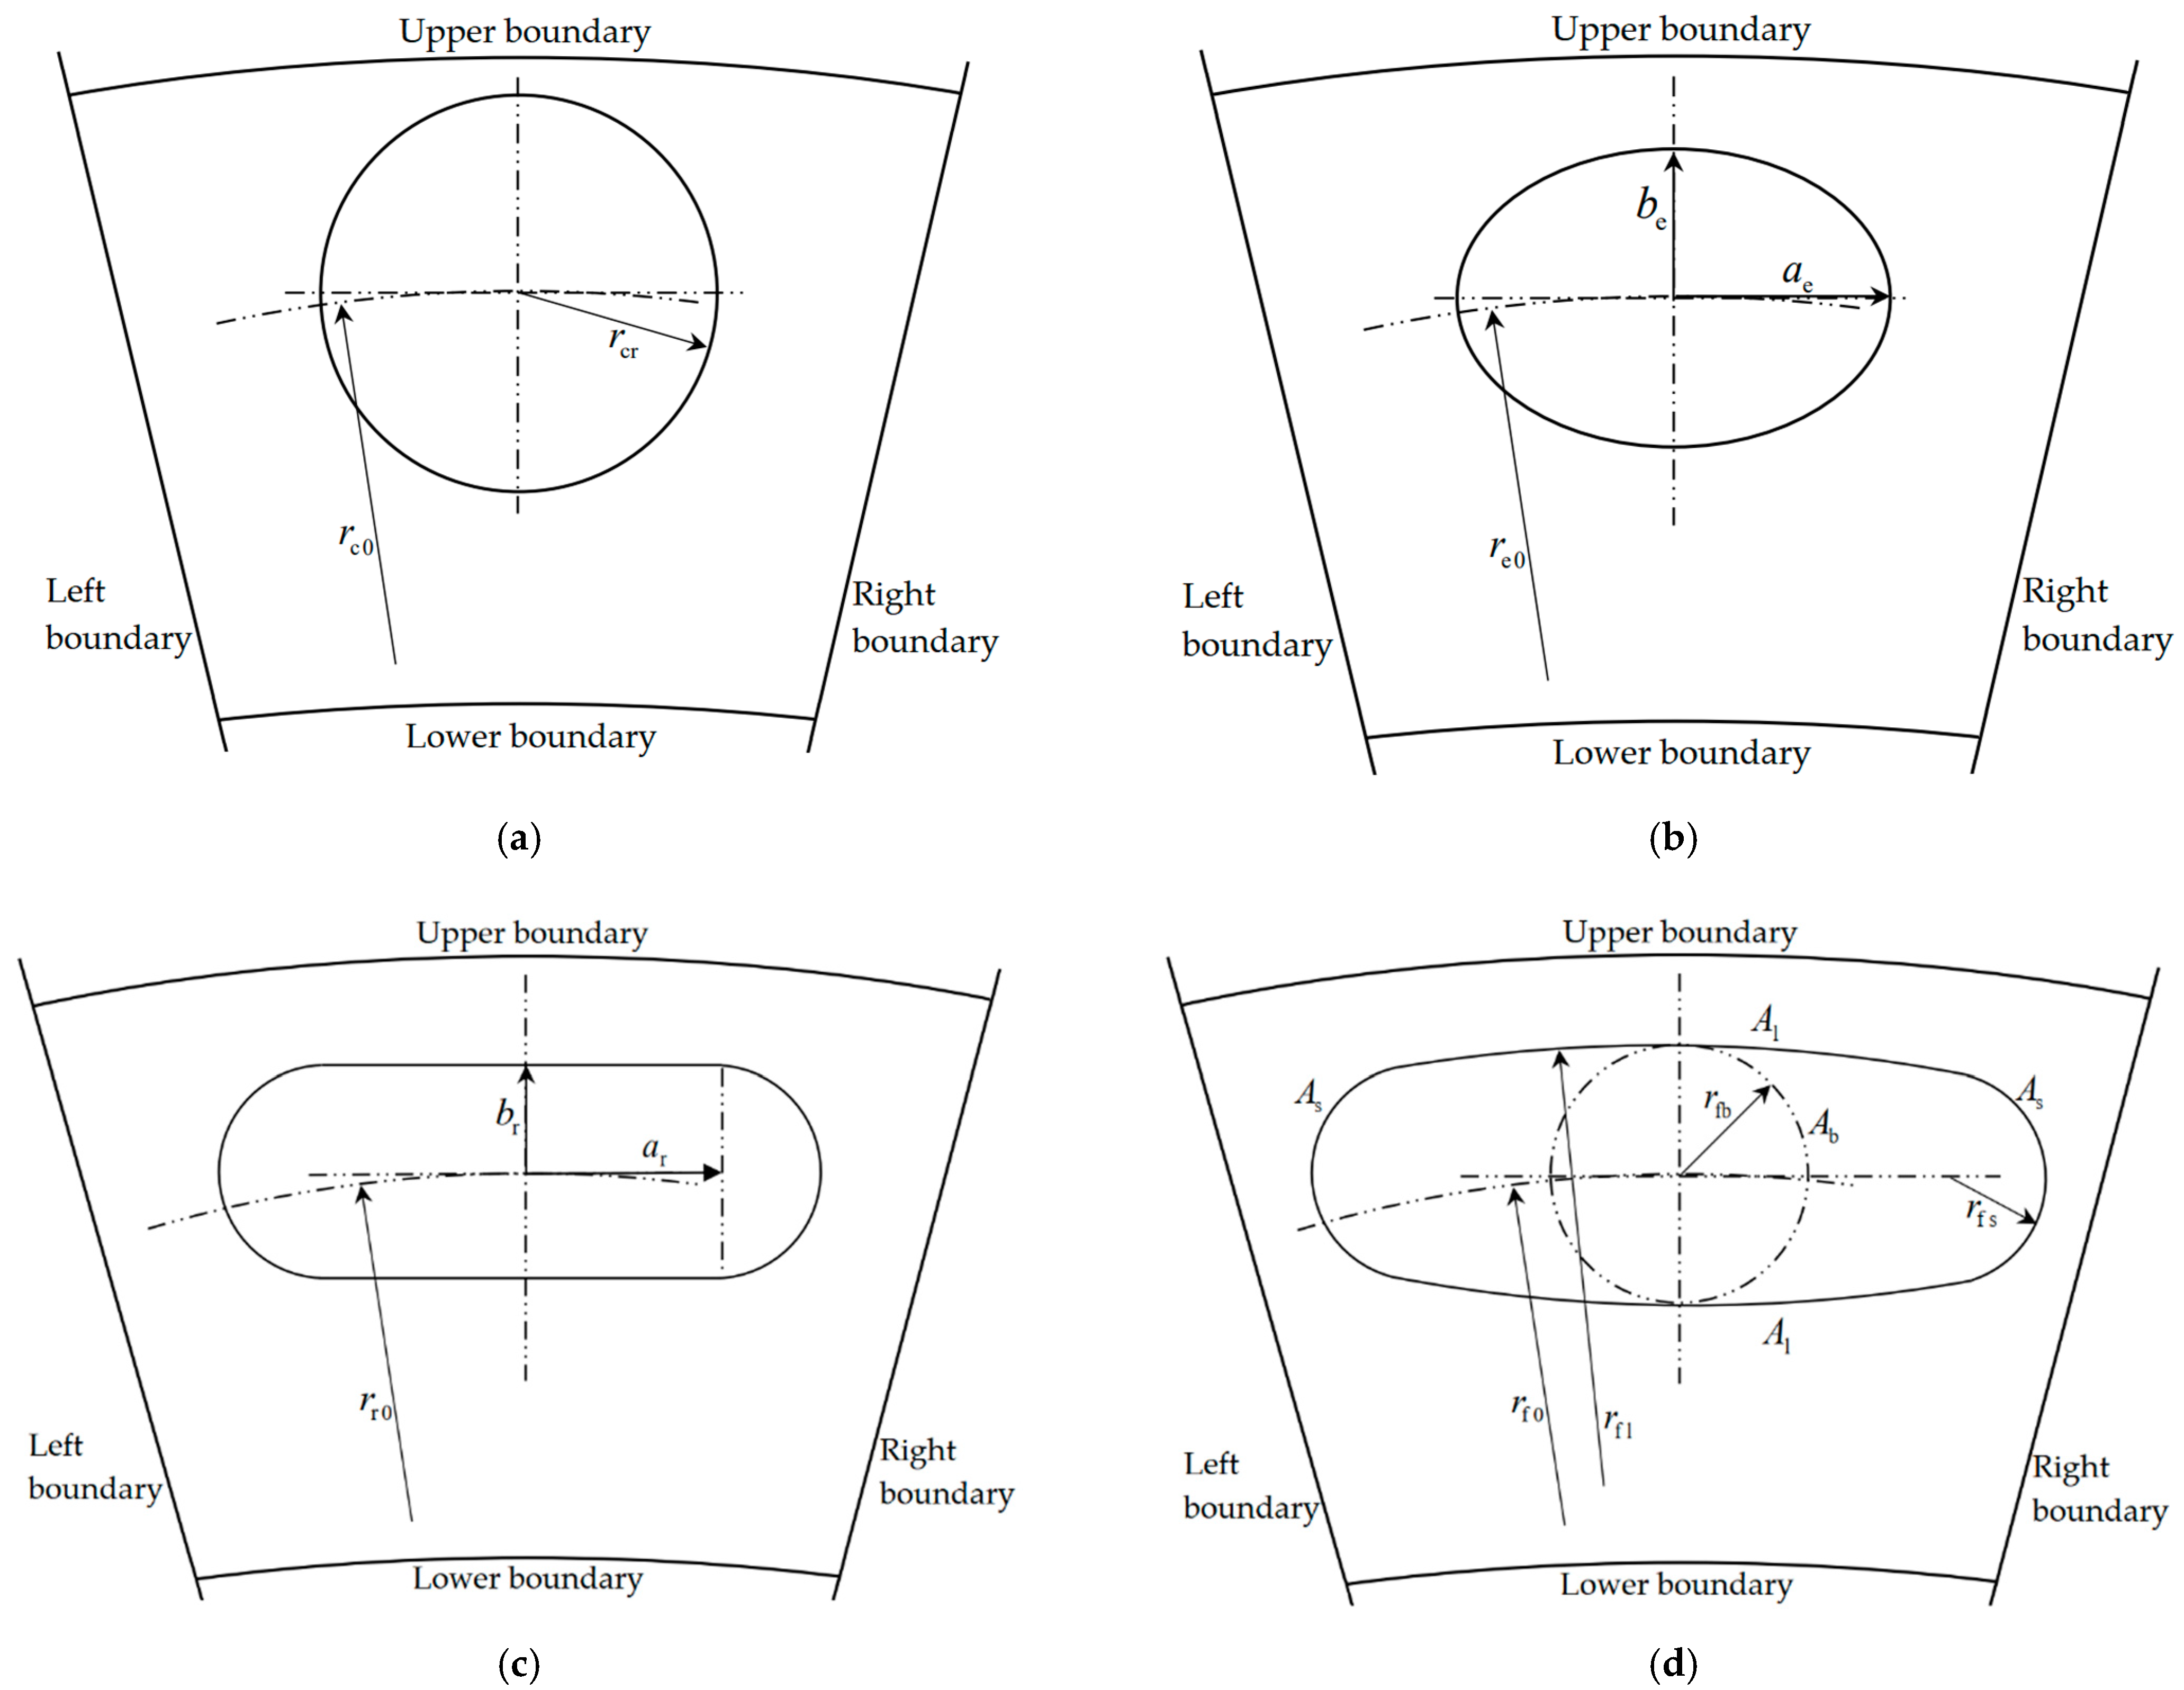
  • Choose the shape of the vent hole as needed. This paper provides four different shape designs for the vent hole, namely the circular hole, the elliptical hole, the race-track hole, and the four-arc hole [21], as shown in Figure 4. The holes are described in a cylindrical coordinate system, where r represents the radial direction, θ represents the circumferential direction, and z represents the axial direction. The shape and position of the circular hole are determined by the center ( r c 0 , θ c 0 = 0 , z c 0 = 0 ) and the radius r cr ; while that of the elliptical hole are determined by the center ( r e 0 , θ e 0 = 0 , z e 0 = 0 ) , the axis a e , and the axis b e ; that of the race-track hole are determined by the center ( r r 0 , θ r 0 = 0 , z r 0 = 0 ) , the side a r , and the side b r . The four-arc hole is biaxial symmetric and consists of four smoothly connected arcs. The large arc A l is tangent to both the small arc A s and the basic circle A b . The shape and position of the four-arc hole are determined by the center ( r f 0 , θ f 0 = 0 , z f 0 = 0 ) , the radius of the basic circle r fb , the radius of the large arc r fl , and the radius of the small arc r fs .
  • Select the design variables according to the shape of the vent hole and determine their variation ranges. For the circular hole, the two parameters r c 0 and r cr are chosen as the design variables. For the elliptical hole, the three parameters r e 0 , a e , and b e are chosen as the design variables. For the race-track hole, the three parameters r r 0 , a r , and b r are chosen as the design variables. For the four-arc hole, the four parameters r f 0 , r fb , r f l , and r fs are chosen as the design variables [21]. The variation ranges of these parameters are determined based on the upper and lower boundaries of the blue design region in Figure 2.
  • Calculate the area of the single vent hole s s , the number of the vent holes n , and the sector angle of the sub-model 2 π n . The areas of the single circular hole, the single elliptical hole, the single race-track hole, and the single four-arc hole are denoted as s cs , s es , s rs , and s fs , respectively. Their analytical expressions are derived for the convenience of calculating the number of the vent holes.
    { s cs = π r cr 2 s es = π a e b e s rs = 4 a r b r + π b r 2 s fs = 2 ( arccos r fl r fb r fl r fs ) × ( r fl 2 r fs 2 ) + π r fs 2 2 ( r fl r fb ) × ( r fl r fs ) 2 ( r fl r fb ) 2
    Considering the total area of the newly designed vent holes (namely n × s s ) is limited between s t , low and s t , up , the number of the vent holes n is calculated.
    n = ceil ( s t , low s s )
    where ceil ( ) denotes a function that rounds the variable to the nearest integer greater than or equal to it. Accordingly, the limitation to the total area could be transformed as follows:
    n × s s s t , up
    Then, the sector angle 2 π n is calculated and used to determine the geometry of the single-hole sector sub-model in combination with the design variables of the vent hole.
  • Automatically rebuild the geometry of the sector sub-model and generate the high-quality hexahedral mesh by using an updated self-developed modelling and meshing tool. The automatic geometry reconstruction and the high-quality mesh regeneration are two core technologies of the FEM-based optimization. To ensure high robustness, flexibility, and computational accuracy, the author develops a convenient and unified modelling and meshing tool by using Tck/Tk Scripts. Based on the original version [21], the current tool is extended to deal with four different shape designs for the vent holes. The geometry of the whole-ring sub-model with no vent hole is constructed in advance. Once the shape and parameters of the vent holes are determined, the single-hole sector sub-model will be built and partitioned into four revolving or extruding bodies. The 2D high-quality quadrilateral elements are then generated on the source faces of the regular bodies. The mapping/sweeping method is used to generate the 3D high-quality hexahedral mesh for the four regular bodies by mapping or sweeping the quadrangle mesh to the target faces. Particularly, the “trajectory mesh” along the sweeping direction is constructed to solve the mesh compatibility problem between neighboring bodies. Figure 5 shows the automatically generated high-quality hexahedral mesh models for the single-hole sector sub-model with the different shapes of the vent holes. We can see that the mesh quality in the areas around the vent holes of the different shapes are consistent and high. It can avoid the influences of mesh schemes on the stress distribution around the vent holes with different shapes.
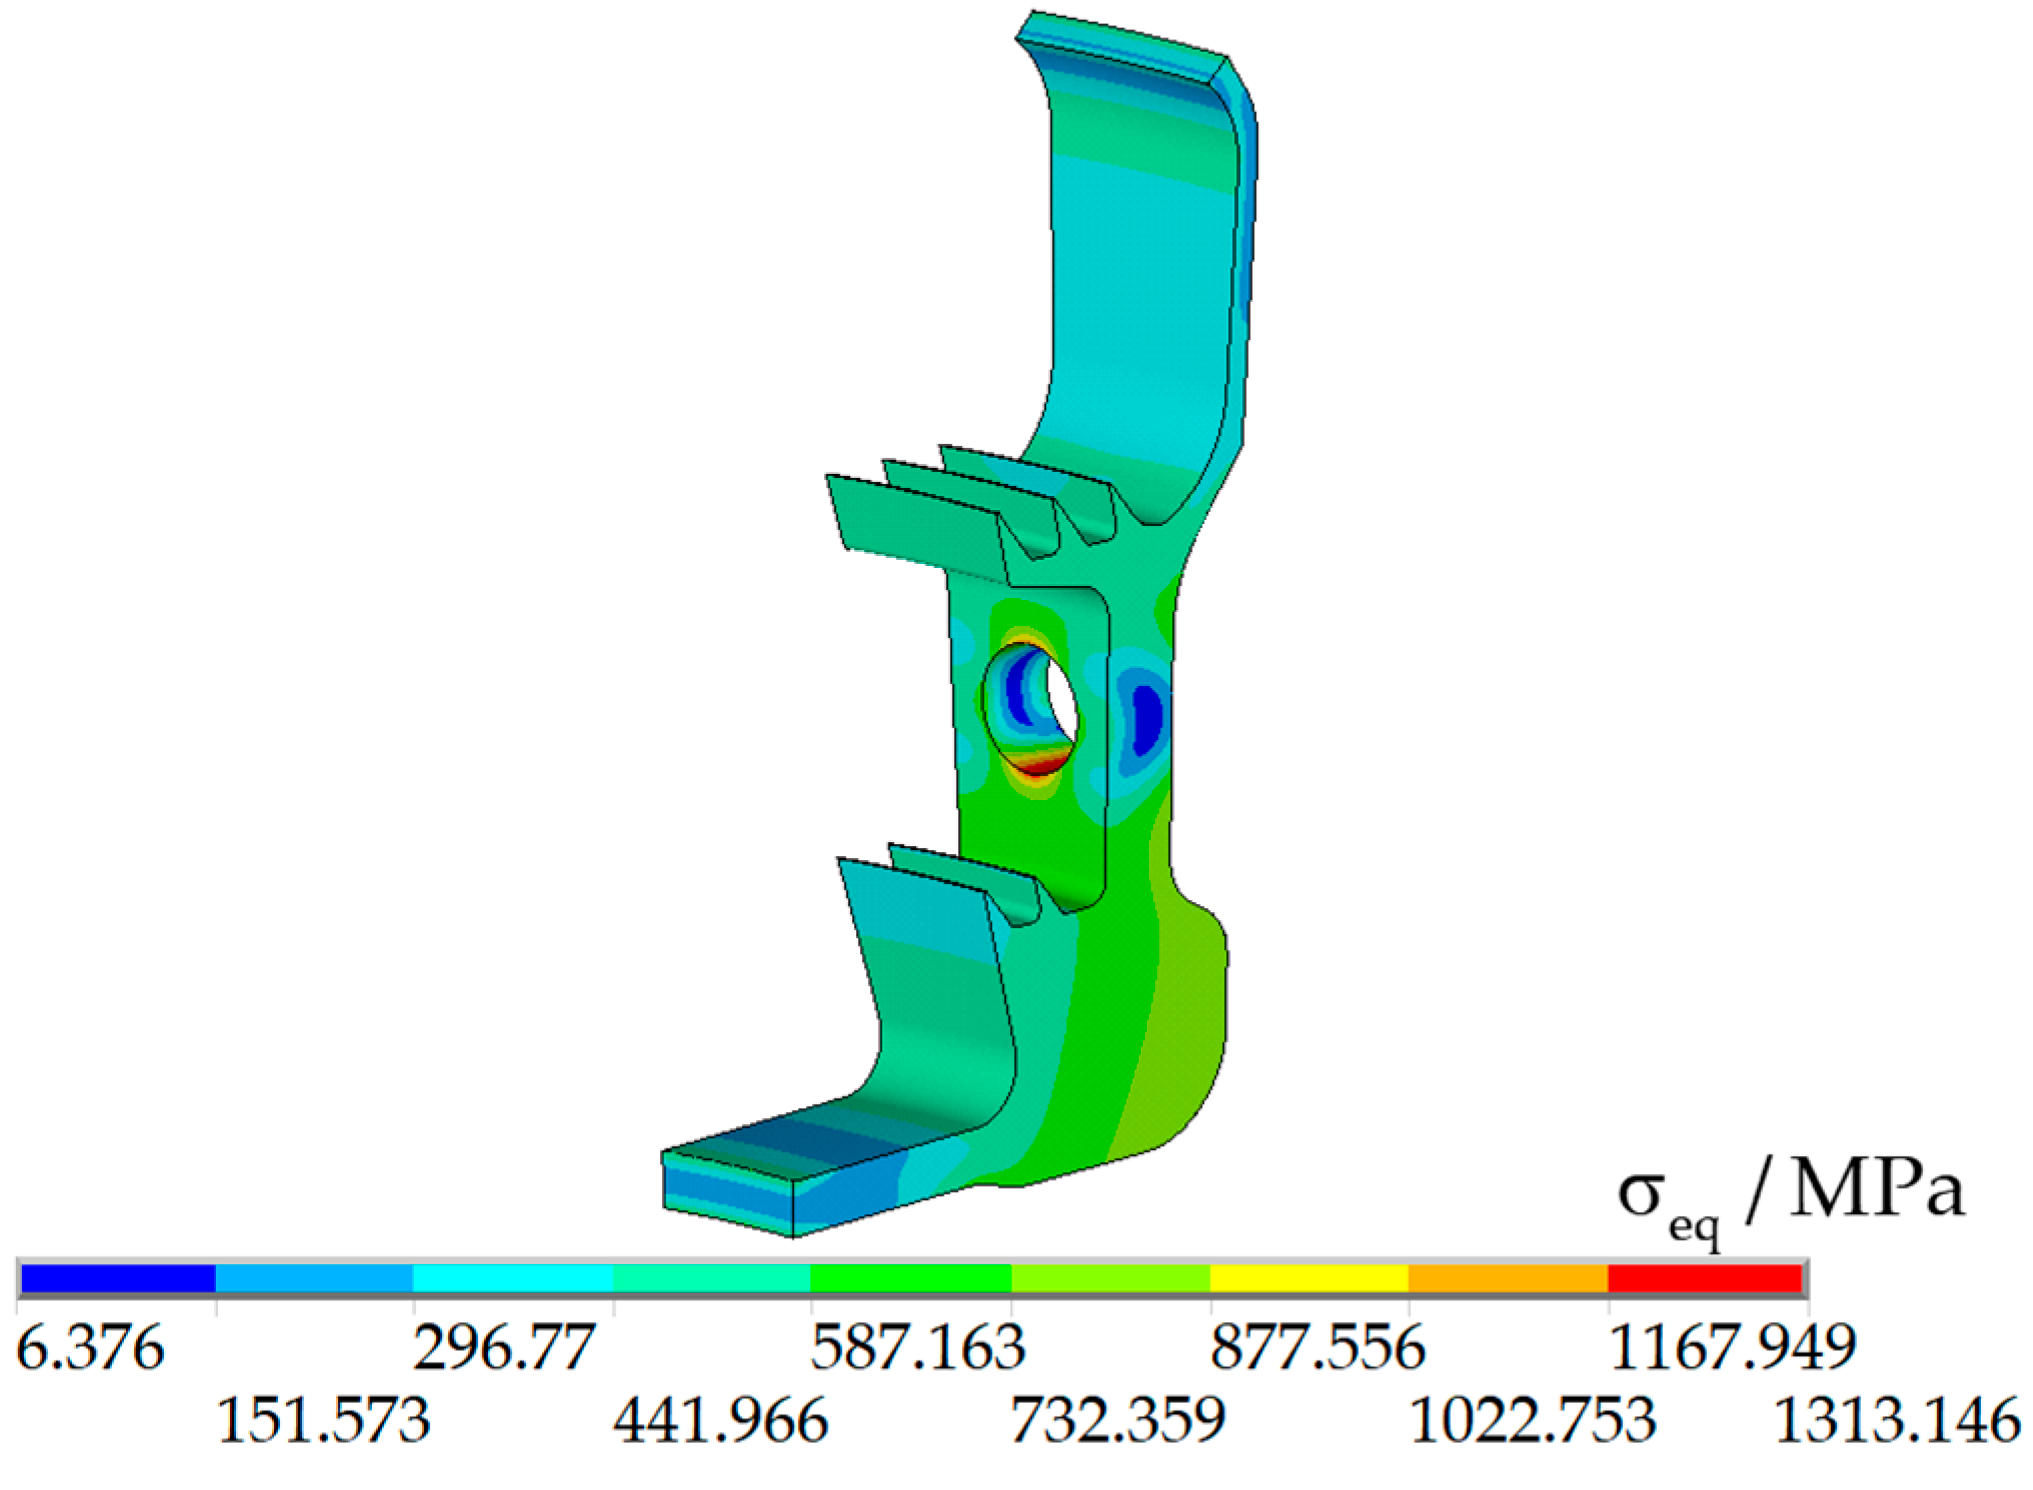
  • Automatically conduct the ANSYS APDL-based strength analysis and extract the maximum von Mises stress σ eq , max . FGH96 is selected as the material, which has excellent thermal stability and endurance strength at high temperatures. The 3D 20-node SOLID 186 is selected as the computational element type of the sector sub-model. To impose the displacement boundary conditions, the coordinate systems of all the nodes of the sector sub-model are rotated into the cylindrical coordinate systems. The cyclic symmetry conditions are imposed on both sides of the sector sub-model. According to the variable dimension sub-model method developed by the author [21], the displacement boundary conditions are applied to the cut-boundary locations of the sub-model. The centrifugal, thermal, and aerodynamic loads are applied according to the actual working environment. Notably, the temperature field and the aerodynamic pressure are determined according to the analysis results of the heat transfer and aerodynamic disciplines.
  • Check whether the optimization is converged. If not, the proposed SDPSO will be employed to find a new design scheme, and Step 2 to Step 5 will be repeated. If yes, the iteration will be terminated, and the optimal scheme will be obtained.

3.2. Optimization Model

The maximum von Mises stress σ eq , max of the sector sub-model of the studied HPT sealing disk is selected as the objective. According to the above discussions, the optimization models of the four different shapes of vent holes could be expressed as follows:
  • Optimization model of the circular vent hole:
    min : σ eq , max w . r . t . : r cr , r c 0 s . t . : { 2 r cr 8 216 + r cr r c 0 232 r cr n × s cs s t , up
    There are some couplings between the variation ranges of r cr and r c 0 in Equation (4), which will make the optimization process difficult to run. An ingenious transformation in Equation (5) is employed to obtain a decoupled optimization model, as shown in Equation (6).
    { r cr , s = r cr 5 3 r c 0 , s = r c 0 224 8 r cr
    min : σ eq , max w . r . t . : r cr , s , r c 0 , s s . t . : { 1 r cr , s 1 1 r c 0 , s 1 n × s cs s t , up
  • Optimization model of the elliptical vent hole:
    min : σ eq , max w . r . t . : a e , b e , r e 0 s . t . : { 2 a e 8 2 b e 8 216 + b e r e 0 232 b e n × s es s t , up
    There are some couplings among the variation ranges of a e , b e , and r e 0 in Equation (7), which will make the optimization process difficult to run. An ingenious transformation in Equation (8) is employed to obtain a decoupled optimization model, as shown in Equation (9).
    { a e , s = a e 5 3 b e , s = b e 5 3 r e 0 , s = r e 0 224 8 b e
    min : σ eq , max w . r . t . : a e , s , b e , s , r e 0 , s s . t . : { 1 a e , s 1 1 b e , s 1 1 r e 0 , s 1 n × s es s t , up
  • Optimization model of the race-track vent hole:
    min : σ eq , max w . r . t . : a r , b r , r r 0 s . t . : { 0 a r 10 2 b r 8 216 + b r r r 0 232 b r n × s rs s t , up
    There are some couplings among the variation ranges of a r , b r , and r r 0 in Equation (10), which will make the optimization process difficult to run. An ingenious transformation in Equation (11) is employed to obtain a decoupled optimization model, as shown in Equation (12).
    { a r , s = a r 5 5 b r , s = b r 5 3 r r 0 , s = r r 0 224 8 b r
    min : σ eq , max w . r . t . : a r , s , b r , s , r r 0 , s s . t . : { 1 a r , s 1 1 b r , s 1 1 r r 0 , s 1 n × s rs s t , up
  • Optimization model of the four-arc vent hole:
    min : σ eq , max w . r . t . : r fb , r fl , r fs , r f 0 s . t . : { 3 r fb 8 10 r fl 50 2 r fs r fb 0.3 216 + r fb r f 0 232 r fb n × s fs s t , up
    There are some couplings among the variation ranges of r fb , r fl , r fs , and r f 0 in Equation (13), which will make the optimization process difficult to run. An ingenious transformation in Equation (14) is employed to obtain a decoupled optimization model, as shown in Equation (15) [21].
    { r fb , s = r fb 5.5 2.5 r fl , s = r fl 30 20 r fs , s = 2 ( r fs 2 ) r fb 2.3 1 r f 0 , s = r f 0 R L 8 8 r fb
    min : σ eq , max w . r . t . : r fb , r fl , r fs , r f 0 s . t . : { 1 r fb , s 1 1 r fl , s 1 1 r fs , s 1 1 r f 0 , s 1 n × s fs s t , up

3.3. Optimization Algorithm

3.3.1. PSO

The PSO algorithm is a new swarm intelligence algorithm proposed by Kennedy and Eberhart in 1995 to simulate the foraging behavior of birds in nature [30]. In PSO, particles in a swarm are produced in a d-dimensional space. The position of each particle in the population represents a candidate solution of the corresponding optimization problem. Different particles cooperate and compete to realize the search process in the optimization space and find out the optimal solution to the problem. The position of the optimal particle is finally obtained through a continuous iterative update of velocity. The velocity and position of the ith particle are represented by v i ( t ) = ( v i 1 ( t ) , v i 2 ( t ) , , v id ( t ) ) and x i ( t ) = ( x i 1 ( t ) , x i 2 ( t ) , , x id ( t ) ) , where t and d denote the number of iterations and the dimension of the optimization problem, respectively. The velocity of the ith particle in the t+1th iteration, v i ( t + 1 ) , is updated by using three vectors: (1) v i ( t ) , the velocity of the ith particle in the tth iteration; (2) p i = ( p i 1 , p i 2 , , p id ) , the best position pbest in the history of the ith particle; and (3) p g = ( p g 1 , p g 2 , , p gd ) , the best position gbest of the whole swarm in history.
The renewal equation of v i ( t + 1 ) is as follows [27]:
v i ( t + 1 ) = w v i ( t ) + c 1 r 1 ( p i ( t ) x i ( t ) ) + c 2 r 2 ( p g ( t ) x i ( t ) )
where w is the inertia weight; c 1 and c 2 are the acceleration coefficients that are called the cognitive and social parameters, respectively; and r 1 and r 2 are two random numbers that are between intervals [0, 1].
Accordingly, the position of the ith particle is updated as follows:
x i ( t + 1 ) = x i ( t ) + v i ( t + 1 )

3.3.2. SDPSO

For high-dimensional or multi-modal problems, PSO is easy to converge prematurely. The particle swarm falls into a local optimum at this moment, reducing the swarm’s diversity. To prevent the premature convergence of PSO, the author proposes a new switching delayed PSO (SDPSO) by adaptively adjusting the particle’s velocity with a Markov chain and an evolutionary factor [27]. Moreover, the particle’s velocity in the current iteration is also adjusted by the delayed information of pbest founded by itself and gbest in the whole swarm according to the evolutionary states.
The renewal equation could be written as follows [27]:
v i ( t + 1 ) = w ( t ) v i ( t ) + c 1 ( ξ ( t ) ) r 1 ( p i ( t - τ 1 ( ξ ( t ) ) ) x i ( t ) ) + c 2 ( ξ ( t ) ) r 2 ( p g ( t τ 2 ( ξ ( t ) ) ) x i ( t ) )
where c 1 ( ξ ( t ) ) and c 2 ( ξ ( t ) ) represent the acceleration coefficients, and τ 1 ( ξ ( t ) ) and τ 2 ( ξ ( t ) ) represent the delay constants. The four parameters are determined by a non-homogeneous Markov chain ξ ( t ) ( t 0 ) . The value of the Markov chain is selected in finite state space S = { 1 , 2 , 3 , 4 } by using a probability transition matrix ( t ) = ( π ij ( t ) ) N × N , where π ij ( t ) is the transition rate from i to j, namely,
π ij = P { ξ = j | ξ = i } , i , j = 1 , 2 , 3 , 4 .
To be noted, π ij ( t ) 0 and j = 1 N π ij ( t ) = 1 .
The searching process of SDPSO is divided into four states, namely convergence, exploration, exploitation, and jumping out, which are represented by ξ ( t ) = 1 , ξ ( t ) = 2 , ξ ( t ) = 3 , ξ ( t ) = 4 in the Markov chain, respectively.
The value of ξ ( t ) is first selected according to an evolution factor E f .
ξ ( t ) = { 1 , 0 E f < 0.25 , 2 , 0.25 E f < 0.5 3 , 0.5 E f < 0.75 , 4 , 0.75 E f < 1 ,
The evolution factor E f is defined as follows:
E f = D g D min D max D min
where D i = 1 s j = 1 s k = 1 d ( x i k x j k ) 2 represents the average distance between the ith particle and other particles in the swarm; s represents the size of the swarm; D min and D max represent the minimum and maximum average distance in the swarm; and D g represents the average distance between the globally best particle and other particles in the swarm.
The value of ξ ( t ) is then randomly changed based on the probability transition matrix, given as follows:
= ( χ 1 χ 0 0 1 χ 2 χ 1 χ 2 0 0 1 χ 2 χ 1 χ 2 0 0 1 χ χ )
where χ is set to be 0.9 in this paper.
The tendency of the inertia weight w is the same as the evolution factor E f . It is defined as follows:
w ( t ) = 0.5 E f + 0.4 , E f [ 0 , 1 ]
The initial values of the acceleration coefficients c 1 and c 2 are set to 0.9. In subsequent iterations, they are automatically adjusted according to the evolutionary states given in Table 1 [27].
The delayed information of pbest and gbest are also utilized to update the velocity based on the evolutionary state. The strategies for selecting the delayed information are summarized in Table 2 [27], where the delay constants τ 1 ( ξ ( t ) ) and τ 2 ( ξ ( t ) ) are selected randomly; denotes the floor function that returns the nearest integer less than or equal to the variable; and rand denotes the random function that returns a single uniformly distributed random number between 0 and 1.

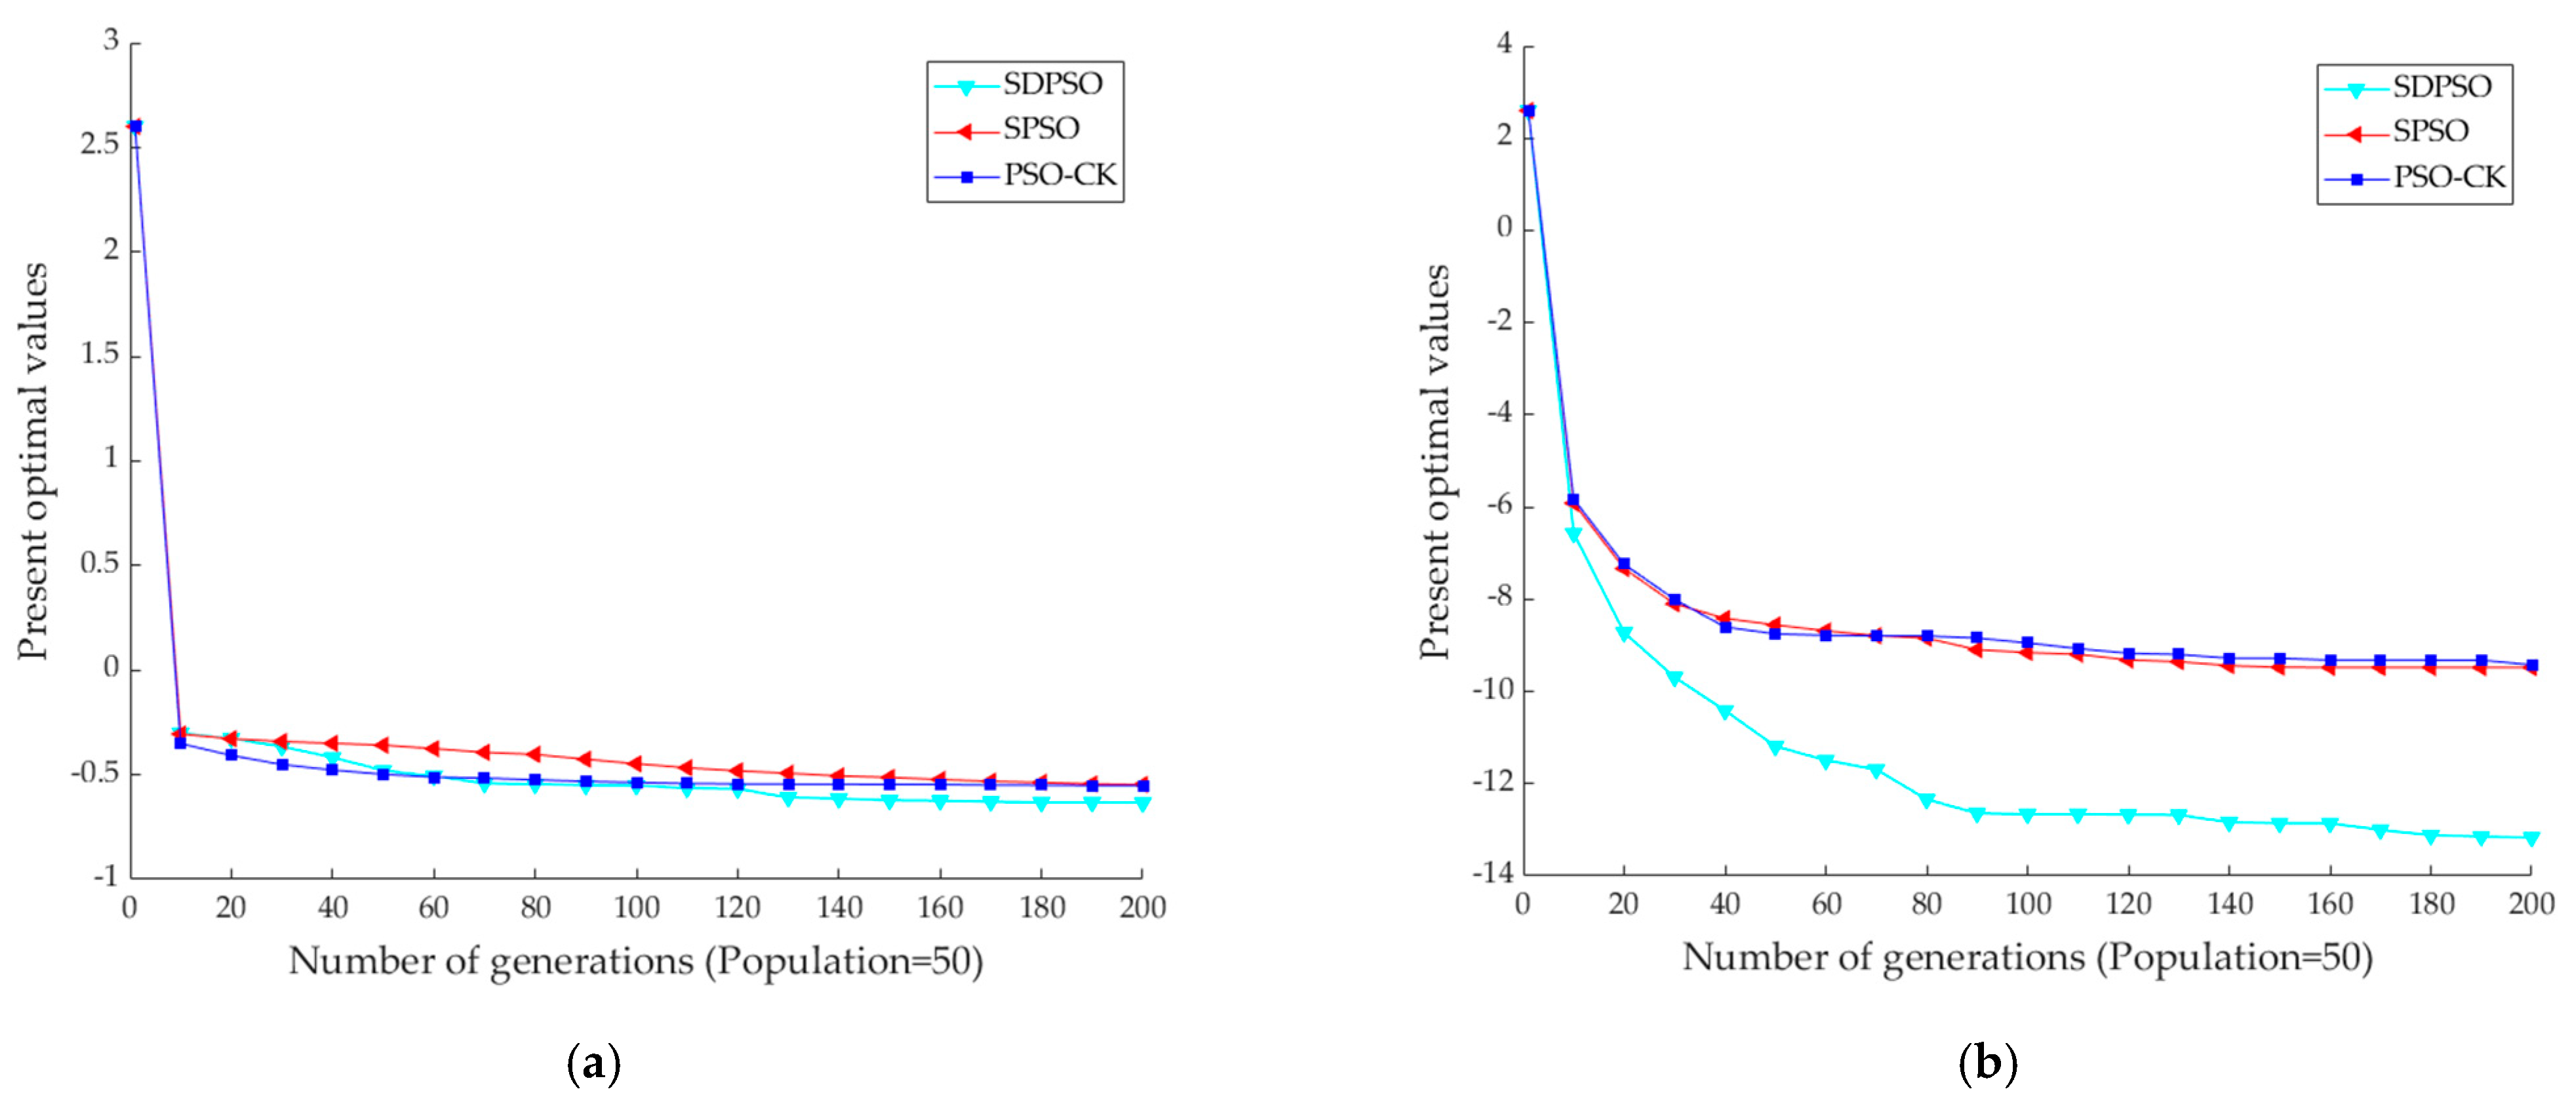
3.3.3. Performance Comparison

The performance of SDPSO and several PSO variants have been compared through five unconstrained benchmark functions by the author [27]. Considering that the stress optimization for vent holes has a constraint on the total area, this paper selects two new benchmark optimization problems with constraints to evaluate the performance of SDPSO and two other classic PSO variants, namely PSO-CK and SPSO [31]. The two benchmark optimization problems (BOP) are taken from Mallipeddi et al. [32] and Liang et al. [33] and defined as follows:
  • BOP1: 10-dimensional optimization problem
    min : f ( x ) = | i = 1 10 cos 4 ( z i ) 2 i = 1 10 cos 2 ( z i ) i = 1 D i z i 2 | w . r . t . : x i , i = 1 , 2 , , 10 s . t . : { g 1 = 0.75 i = 1 10 z i 0 g 2 = i = 1 10 z i 75 0 x [ 0 , 10 ] 10
    where z = x o , o = [0.03085872, −0.07863229, 0.04865115, −0.06908983, −0.08791854, 0.08898264, 0.07414324, −0.08652759, −0.02061653, 0.05558611];
  • BOP2: 13-dimensional optimization problem
    min : f ( x ) = 5 i = 1 4 x i 5 i = 1 4 x i 2 i = 5 13 x i w . r . t . : x i , i = 1 , 2 , , 13 s . t . : { g 1 = 2 x 1 + 2 x 2 + x 10 + x 11 10 0 g 2 = 2 x 1 + 2 x 3 + x 10 + x 12 10 0 g 3 = 2 x 2 + 2 x 3 + x 11 + x 12 10 0 g 4 = 8 x 1 + x 10 0 g 5 = 8 x 2 + x 11 0 g 6 = 8 x 3 + x 12 0 g 7 = 2 x 4 x 5 + x 10 0 g 8 = 2 x 6 x 7 + x 11 0 g 9 = 2 x 8 x 9 + x 12 0 0 x i 1 ( i = 1 , , 9 ) 0 x i 100 ( i = 10 , 11 , 12 ) 0 x 13 1
The parameters of the two benchmark optimization problems are set as follows: the particle number s = 50 and the maximum generation number tmax = 200. The three optimization algorithms (PSO-CK, SPSO, and SDPSO) are repeated 25 times for each benchmark optimization problem to reduce the randomness, respectively.
Figure 6 shows the boxplots of the optimal values of the 25 repetitions obtained by PSO-CK, SPSO, and SDPSO for BOP1 and BOP2, respectively. The boxplots provide a graphical depiction of how the optimal values vary over the 25 repetitions. We can see that: (1) for the two benchmark optimization problems, the optimal values obtained by SDPSO are significantly lower than those obtained by PSO-CK and SPSO. (2) The variation of the optimal values of the 25 repetitions obtained by SDPSO is also smaller than that obtained by PSO-CK and SPSO.
The actual mean, minimum, and standard deviation values of the optimal values of 25 repetitions obtained by PSO-CK, SPSO, and SDPSO for each benchmark optimization problem are shown in Table 3. The bold values in the table indicate the best results among the three optimization algorithms. From Table 3, we can see that: (1) all the bold values are distributed in the column of SDPSO. That is, the optimization capability of SDPSO is better than that of PSO-CK and SPSO. (2) When considering the minimum optimal values of 25 repetitions, both BOP1 and BOP2 show that SDPSO performs better than PSO-CK and SPSO. That is, SDPSO has a more significant potential to find the globally optimal solution. (3) When considering the standard deviation of the optimal values of the 25 repetitions, the two problems show that SDPSO is more robust than PSO-CK and SPSO.
Figure 7 shows the convergence history of the mean of the present optimal values of the 25 repetitions obtained by the three optimization algorithms, respectively. We can see that SDPSO could find better results with a faster convergence speed when compared with PSO-CK and SPSO.
In summary, SDPSO is superior to PSO-CK and SPSO in optimization capability, numerical robustness, and convergence speed for optimization problems with constraints. It has a more significant potential to find the globally optimal solution.

4. Results and Discussion

To investigate the engineering practicality of SDPSO and reduce the maximum von Mises stress of the initial circular vent holes, the optimizations of vent holes with four different shapes are conducted. Considering that the computational cost of the FEM-based optimization is expensive, the particle number and the maximum generation number of SDPSO are set to 20 and 50, respectively.
Figure 8 shows the convergence history of the optimization objectives (maximum von Mises stress) of the four different shapes of vent holes. It can be seen that: (1) The optimizations for the four different shapes of vent holes converge quickly, and the four corresponding optimal schemes that satisfy the predefined constraints and possess the minimum σ eq , max are obtained. That is, the proposed SDPSO is an efficient algorithm for the stress optimization of vent holes. It is suitable and valuable for practical engineering optimization problems with constraints. (2) Compared with the initial circular scheme, the maximum von Mises stresses of the four optimal schemes corresponding to the different shapes of the vent holes are significantly reduced. That is, the developed integrated design optimization method is effective and advanced for reducing the maximum von Mises stress around the vent holes. (3) Among the four optimal schemes, the maximum von Mises stress of the four-arc scheme is the minimum. That is, the four-arc hole has more tremendous advantages in reducing the maximum von Mises stress of the vent holes, followed by the elliptical hole, the race-track hole, and the circular hole.
Table 4 shows the details of the initial circular scheme, optimal circular scheme, optimal elliptical scheme, optimal race-track scheme, and optimal four-arc scheme. From it, we can see that: (1) Compared with the initial circular scheme, the total area of the vent holes corresponding to the four optimal schemes are strictly limited to a small variation range, yet the number of the vent holes change significantly. Remarkably, the number of holes corresponding to the optimal circular scheme increases from 75 to 124. (2) The maximum von Mises stresses of the optimal circular, elliptical, race-track, and four-arc schemes are reduced from 1313.146 MPa to 1145.819 MPa, 1031.590 MPa, 1042.111 MPa, and 927.395 MPa, respectively. Remarkably, the maximum von Mises stress of the optimal four-arc scheme is reduced by 29.376%. Obviously, the four-arc hole performs best, followed by the elliptical hole, the race-track hole, and the circular hole.
Figure 9 shows the von Mises stress distribution of the initial circular scheme, optimal circular scheme, optimal elliptical scheme, optimal race-track scheme, and optimal four-arc scheme. Combining Table 4 and Figure 9, we can see that: (1) The high-stress area of the initial circular scheme is only distributed on the lower sides of the hole. In contrast, the high-stress areas of the four optimal schemes are distributed around the holes. That is, the von Mises stress distribution of the four optimal schemes are more uniform than that of the initial circular scheme. (2) For the optimal circular scheme, the radius r cr is reduced from 5.800 to 4.507, and the radial position r c 0 is increased from 225.360 to 227.493. It increases the von Mises stress on the left and right sides of the hole and decreases the stress on the bottom and top sides. (3) For the optimal elliptical scheme, the axis a e is increased to 8.000 and the axis b e is reduced to 4.733. It also increases the von Mises stress on the left and right sides of the hole and decreases the stress on the bottom and top sides. (4) For the optimal race-track scheme, the side a r is increased to 1.923 and the side b r is reduced to 4.198. It significantly decreases the von Mises stress on the bottom and top sides of the hole. However, the stresses at the connections of the straight lines and arcs are increased. (5) For the optimal four-arc scheme, the radius of the basic circle r fb is approximately equal to the radius r cr of the optimal circular scheme. However, the radius of the large arc r fl is large enough. It significantly reduces the stresses on the bottom and top sides of the hole. Additionally, the smooth transitions between the large and small arcs reduce the stresses at the connections. Therefore, the maximum von Mises stress of the optimal four-arc scheme is significantly reduced, and the high-stress areas are fairly well-distributed around the vent hole.
Figure 10 shows the von Mises stress distribution along the edges of the vent holes of the initial circular scheme and four optimal schemes, respectively. Table 5 lists the maximum, minimum, mean, and range (difference between the maximum and minimum values) values of the von Mises stresses along the edges of the vent holes of the five schemes. Combining Figure 9 and Figure 10 and Table 5, we can see that: (1) Compared with the initial circular scheme, the maximum von Mises stresses of the optimal circular, elliptical, race-track, and four-arc schemes are significantly reduced by 13.469%, 18.906%, 18.079%, and 27.097%. (2) The minimum von Mises stresses of the optimal circular, elliptical, race-track, and four-arc schemes are increased by 4.528%, 21.319%, 22.973%, and 40.187%, respectively. (3) The mean von Mises stresses of the optimal circular, elliptical, race-track, and four-arc schemes only change slightly. (4) The range values of the optimal circular, elliptical, race-track, and four-arc schemes are significantly reduced by 27.445%, 50.147%, 49.962%, and 79.352%. (5) Obviously, the von Mises stress distribution along the edges of the vent holes of the four optimal schemes are more uniform than that of the initial circular scheme. Remarkably, the optimal four-arc scheme is the most uniform and performs the best, followed by the optimal elliptical scheme, the optimal race-track scheme, and the optimal circular scheme. (6) The more uniform the von Mises stresses around the vent holes, the less the stress concentration and the smaller the maximum von Mises stress.
Figure 11 shows the radial and circumferential stress distribution of the initial circular and four optimal schemes. Combining Figure 9 and Figure 11, we can see that: (1) For all the five schemes, the high-radial-stress areas are distributed on the left and right sides of the hole, while the high-circumferential-stress areas are distributed on the bottom and top sides of the hole. (2) The maximum radial stress is much less than the maximum circumferential stress for the initial circular scheme. However, the maximum radial stresses are close to the maximum circumferential stresses for the four optimal schemes. (3) For all the five schemes, the maximum von Mises stresses are close to the larger values of the maximum radial stress and the maximum circumferential stress. (4) The reason for the better performance of the four optimal schemes is: by changing the shapes and corresponding design parameters of the vent holes, the maximum radial stress is adjusted to be close to the maximum circumferential stress, and, accordingly, the maximum von Mises stresses at the left and right sides of the hole are adjusted to be approximately equal to those at the bottom and top sides. It could reduce the stress concentration and achieve uniform stress distribution.
In summary, SDPSO is suitable and valuable for the stress optimization of vent holes with constraints. The developed integrated design optimization method is effective and advanced for reducing the maximum von Mises stress around the vent holes. Remarkably, the adopted four-arc hole has more tremendous advantages in reducing the maximum von Mises stress, followed by the elliptical hole, the race-track hole, and the circular hole.

5. Conclusions

To reduce the maximum von Mises stress around the vent holes of a high-pressure turbine sealing disk, this paper developed an effective integrated design optimization method, which mainly includes four different shape designs (circular, elliptical, race-track, and four-arc) for holes, an updated self-developed modelling and meshing tool, an APDL-based strength analysis, and a self-proposed efficient SDPSO algorithm. The main idea of SDPSO is: (1) by evaluating an evolutionary factor and utilizing a probability transition matrix, a non-homogeneous Markov chain is determined and auto-updated in each generation; and (2) the evolutionary factor and the Markov chain are used to adaptively select the inertia weight, acceleration coefficients, and delayed information to adjust the particle’s velocity. Two benchmark optimization problems with constraints were selected to compare the performance of SDPSO and two popular PSO algorithms (PSO-CK and SPSO). Furthermore, SDPSO was used for the stress optimization of vent holes with four different shapes. From the results of this study, some findings could be summarized as follows:
  • For the two benchmark optimization problems, SDPSO is superior to PSO-CK and SPSO in optimization capability, numerical robustness, and convergence speed. SDPSO has a more significant potential to find the globally optimal solution.
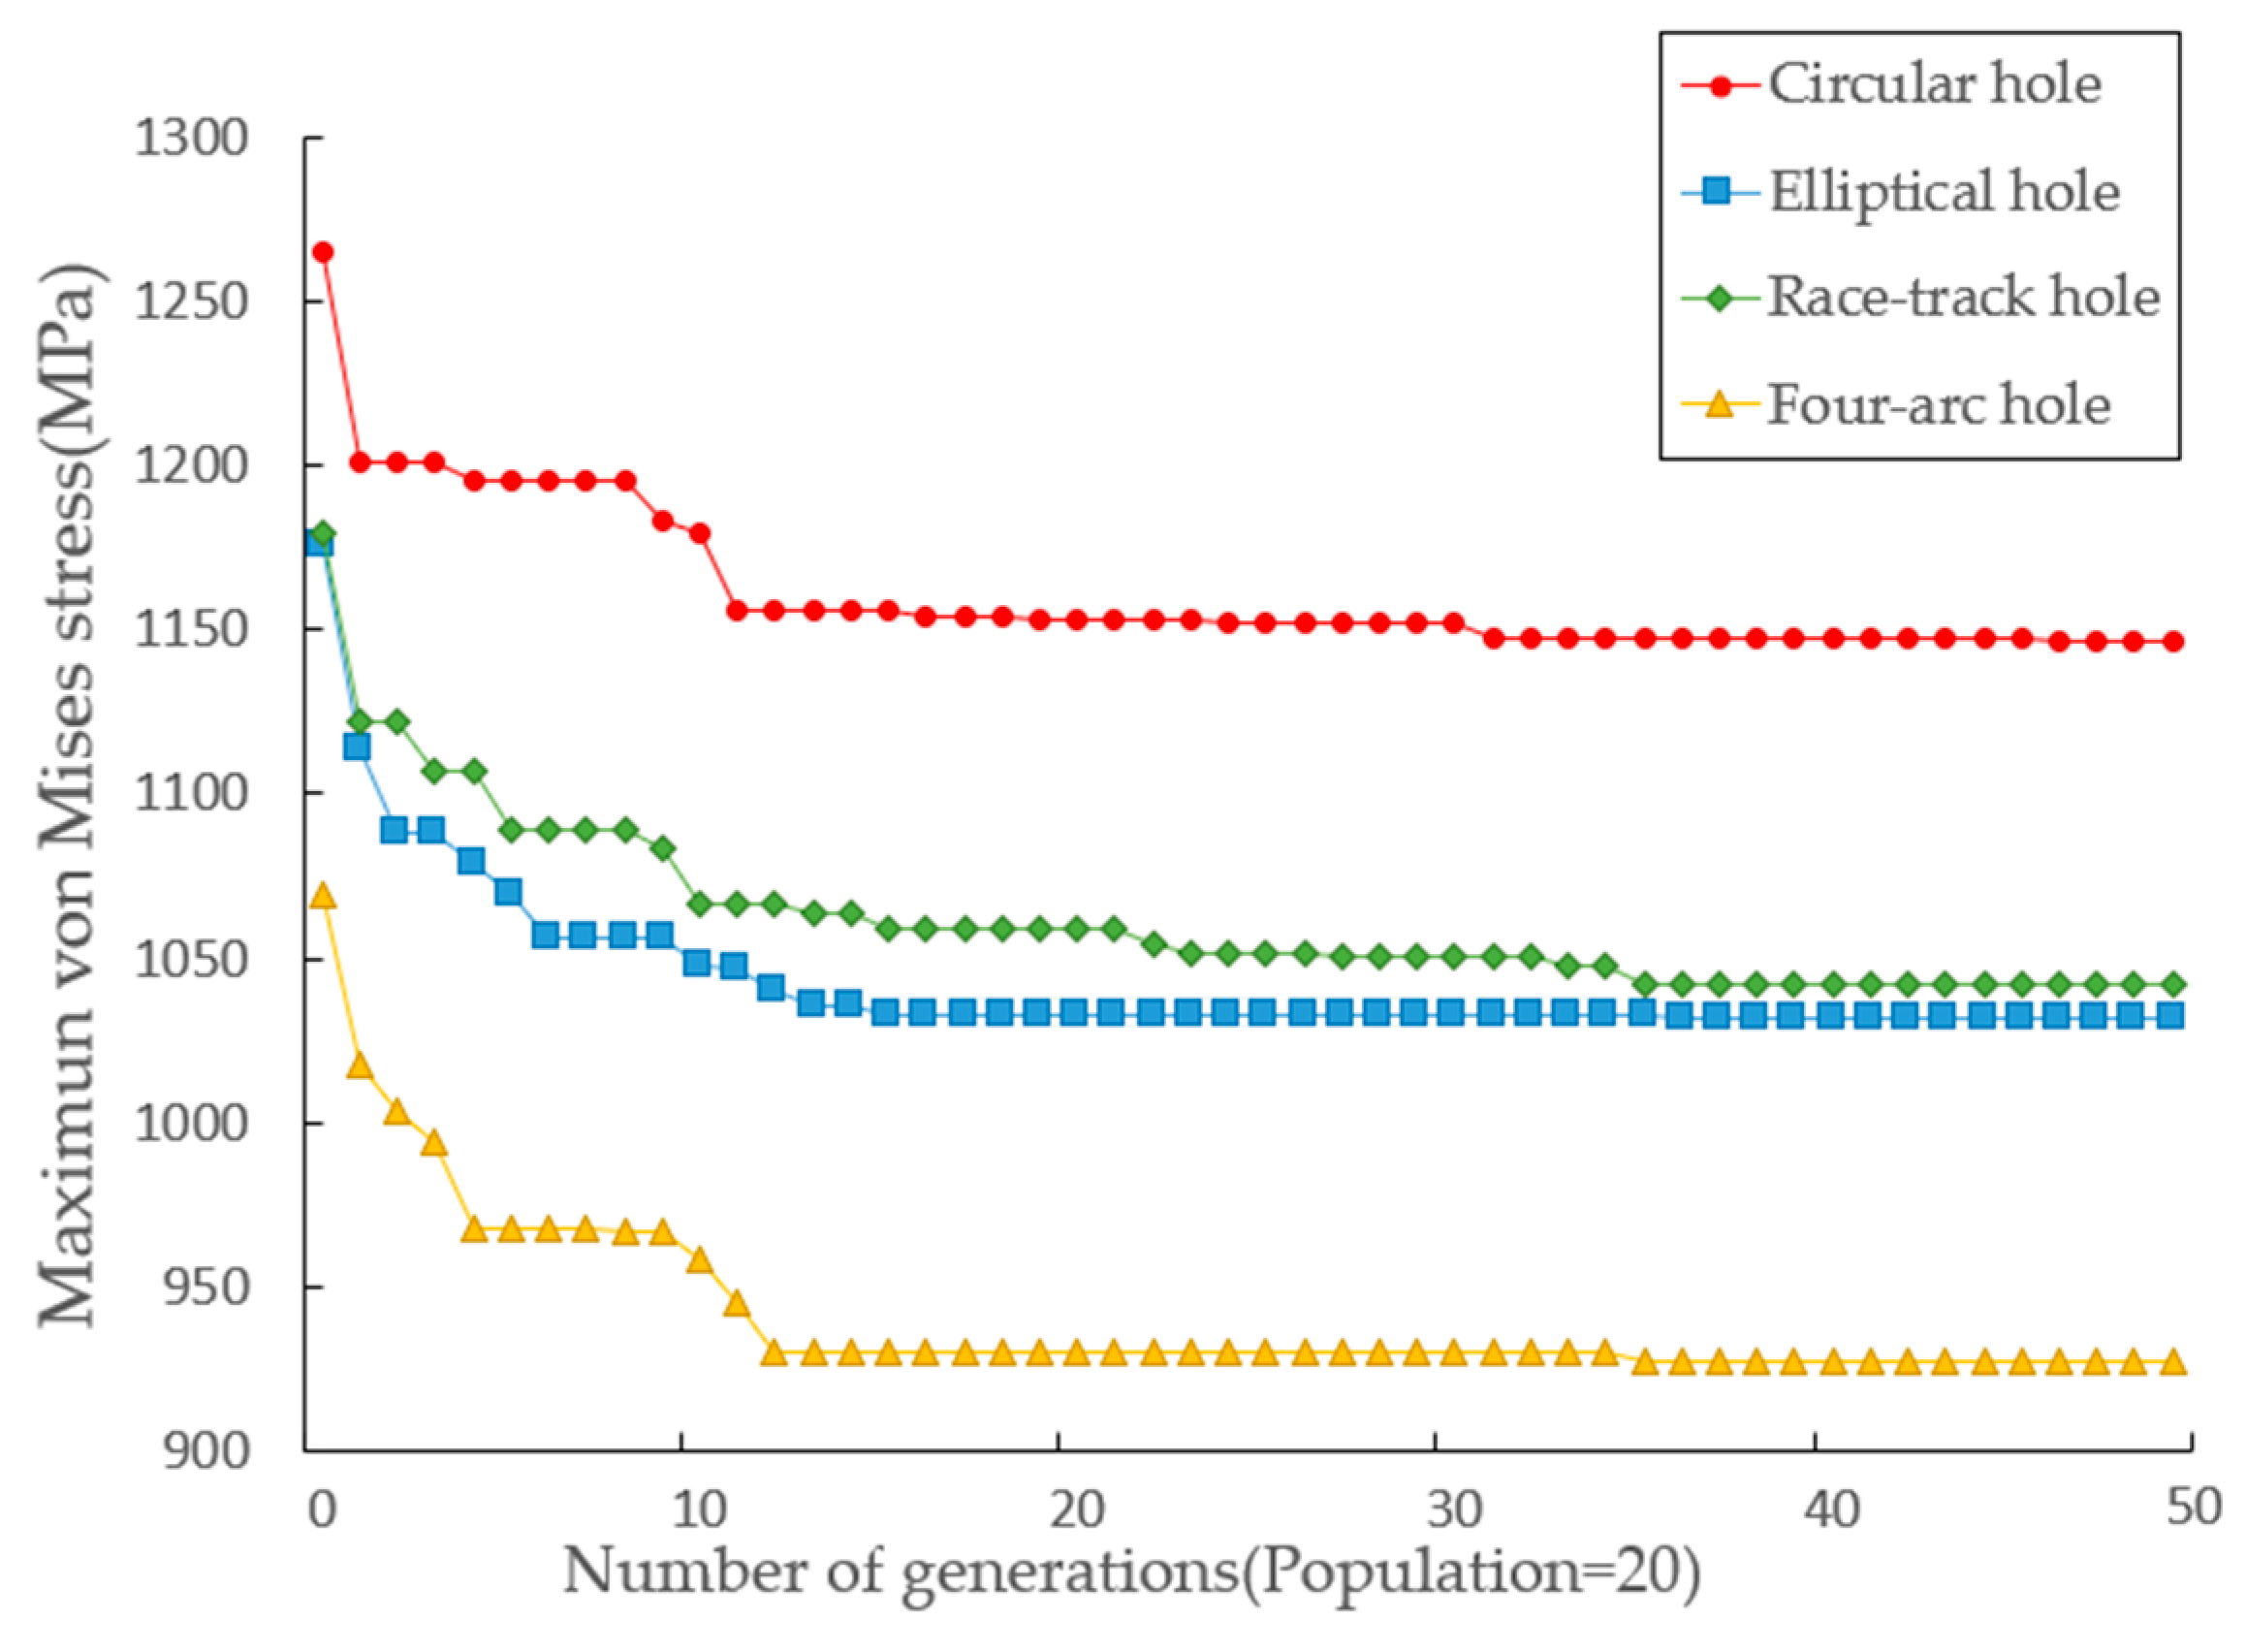
  • The optimizations for the vent holes with four different shapes converge quickly. SDPSO is suitable and valuable for the stress optimization of vent holes. It is an efficient algorithm for practical engineering optimization problems with constraints.
  • Compared with the initial circular scheme, the maximum von Mises stresses of the optimal circular, elliptical, race-track, and four-arc schemes are reduced from 1313.146 MPa to 1145.819 MPa, 1031.590 MPa, 1042.111 MPa, and 927.395 MPa, respectively. Remarkably, the maximum von Mises stress of the optimal four-arc scheme is reduced by 29.376%. It could be concluded that the developed integrated design optimization method is effective and advanced for reducing the maximum von Mises stress around the vent holes. Particularly, the adopted four-arc hole has more tremendous advantages in reducing the maximum von Mises stress, followed by the elliptical hole, the race-track hole, and the circular hole.
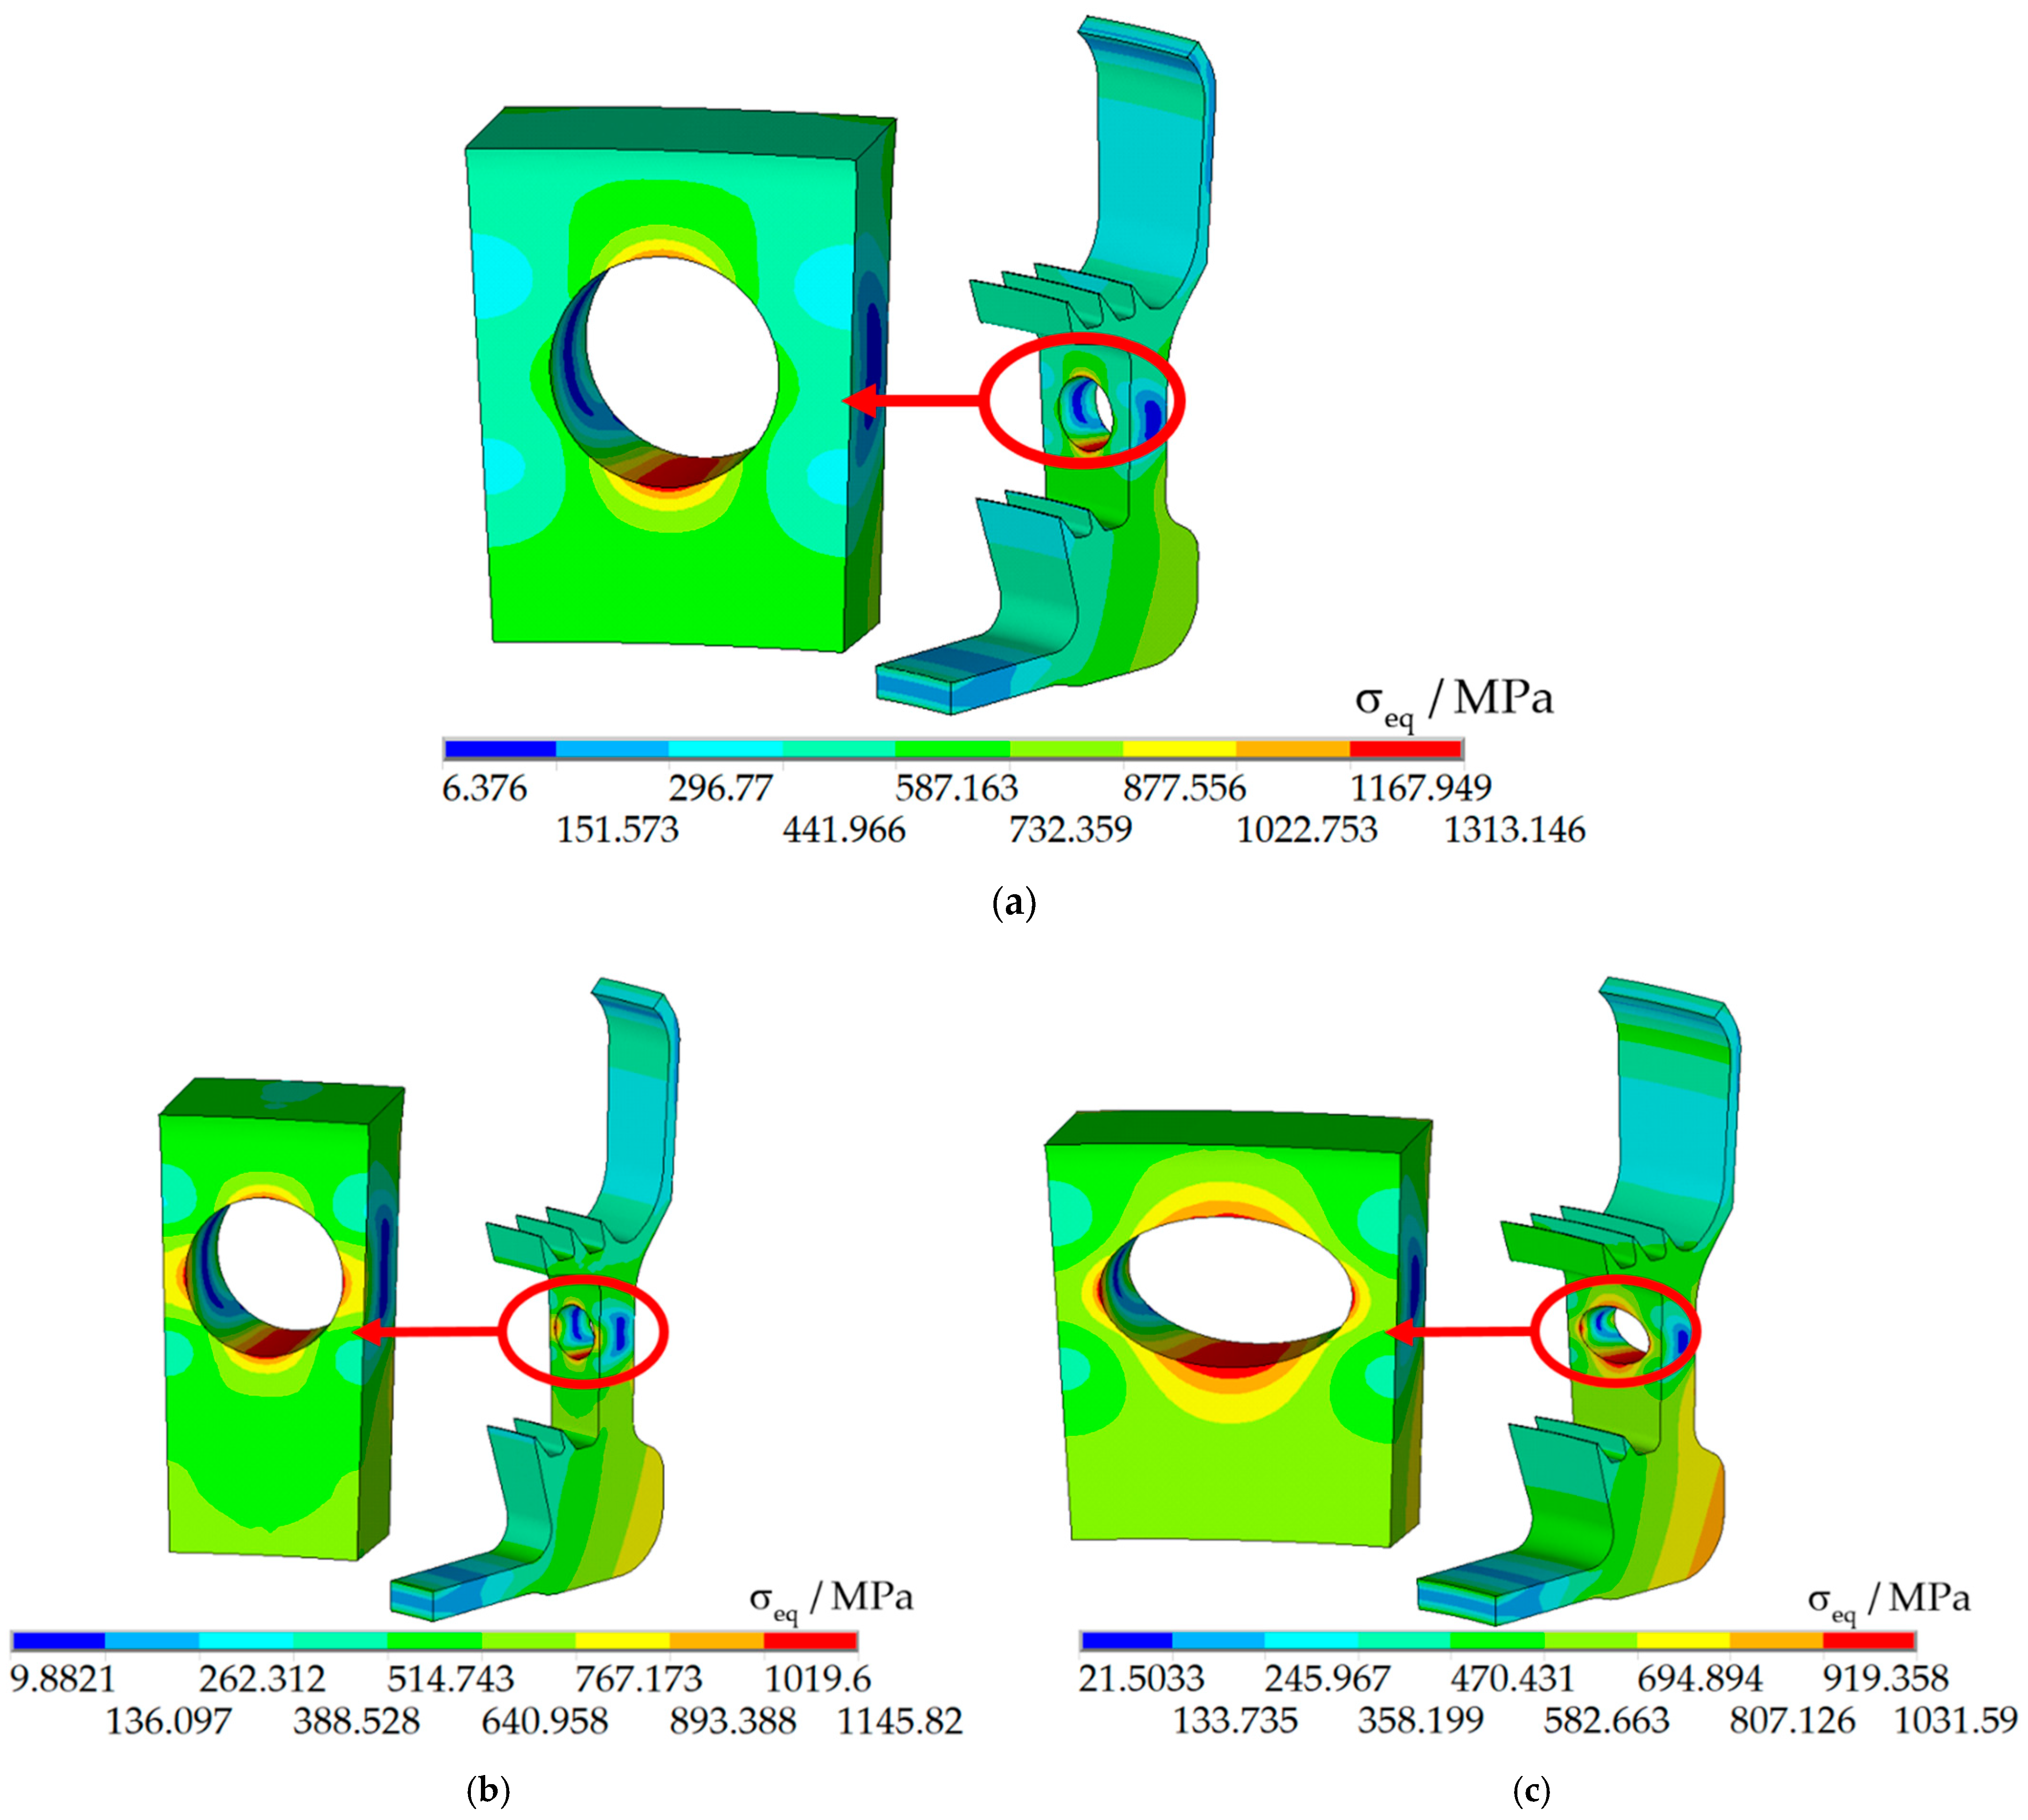
  • The von Mises stress distribution along the edges of the vent holes of the four optimal schemes are more uniform than that of the initial circular scheme. Remarkably, the optimal four-arc scheme is the most uniform and performs the best, followed by the optimal elliptical scheme, the optimal race-track scheme, and the optimal circular scheme. It could be concluded that the more uniform the von Mises stresses around the vent holes, the less the stress concentration and the smaller the maximum von Mises stress.
  • By changing the shapes and corresponding design parameters of the vent holes, the maximum radial stress is adjusted to be close to the maximum circumferential stress, and, accordingly, the maximum von Mises stresses at the left and right sides of the hole are adjusted to be approximately equal to those at the bottom and top sides. It could reduce the stress concentration and achieve a uniform stress distribution.

Author Contributions

Conceptualization, C.Y. and N.Z.; methodology, C.Y. and N.Z.; software, W.H., Y.Y., H.D. and D.S.; validation, W.H., Y.Y., H.D. and D.S.; formal analysis, C.Y. and N.Z.; investigation, W.H., Y.Y., H.D. and D.S.; resources, C.Y. and N.Z.; data curation, W.H., Y.Y., H.D. and D.S.; writing—original draft preparation, C.Y. and N.Z.; writing—review and editing, C.Y.; visualization, W.H., Y.Y., H.D. and D.S.; supervision, C.Y. and N.Z.; project administration, C.Y. and N.Z.; funding acquisition, C.Y. All authors have read and agreed to the published version of the manuscript.

Funding

This research was co-supported by the National Natural Science Foundation of China (No. 52005421, No. 62073271), the Natural Science Foundation of Fujian Province of China (No. 2020J05020), the National Science and Technology Major Project (No. J2019-I-0013-0013), the Fundamental Research Funds for the Central Universities (No. 20720210090), and the Project funded by the China Postdoctoral Science Foundation (No. 2020M682584, No. 2021T140634).

Institutional Review Board Statement

Not applicable.

Informed Consent Statement

Not applicable.

Data Availability Statement

Data sharing not applicable.

Conflicts of Interest

The authors declare no conflict of interest.

References

  1. Murru, P.T.; Rajagopal, K.R. Stress concentration due to the presence of a hole within the context of elastic bodies. Mater. Des. Processing Commun. 2021, 3, e219. [Google Scholar] [CrossRef]
  2. Shlyannikov, V.; Sulamanidze, A.; Yarullin, R. Fatigue and creep-fatigue crack growth in aviation turbine disk simulation models under variable amplitude loading. Eng. Fail. Anal. 2021, 131, 105886. [Google Scholar] [CrossRef]
  3. Bazvandi, H.; Poursaeidi, E. Effect of additional holes on crack propagation and arrest in gas turbine casing. Eng. Fail. Anal. 2020, 111, 104443. [Google Scholar] [CrossRef]
  4. Patel, A.; Desai, C.K. Stress concentration around an elliptical hole in a large rectangular plate subjected to linearly varying in-plane loading on two opposite edges. Theor. Appl. Fract. Mech. 2020, 106, 102432. [Google Scholar] [CrossRef]
  5. Yang, Y.; Cheng, Y.; Zhu, W. Stress concentration around a rectangular cuboid hole in a three-dimensional elastic body under tension loading. Arch. Appl. Mech. 2018, 88, 1229–1241. [Google Scholar] [CrossRef]
  6. Ozkan, M.T.; Erdemir, F. Determination of theoretical stress concentration factor for circular/elliptical holes with reinforcement using analytical, finite element method and artificial neural network techniques. Neural Comput. Appl. 2021, 33, 12641–12659. [Google Scholar] [CrossRef]
  7. Ghuku, S.; Saha, K.N. An experimental study on stress concentration around a hole under combined bending and stretching stress field. Procedia Technol. 2016, 23, 20–27. [Google Scholar] [CrossRef] [Green Version]
  8. Trukhanov, A.V.; Trukhanov, S.V.; Kostishyn, V.G.; Panina, L.V.; Korovushkin, V.V.; Turchenko, V.A.; Vinnik, D.A.; Yakovenko, E.S.; Zagorodnii, V.V.; Launetz, V.L.; et al. Correlation of the atomic structure, magnetic properties and microwave characteristics in substituted hexagonal ferrites. J. Magn. Magn. Mater. 2018, 462, 127–135. [Google Scholar] [CrossRef]
  9. Trukhanov, S.V.; Trukhanov, A.V.; Kostishyn, V.G.; Panina, L.V.; Turchenko, V.A.; Kazakevich, I.S.; Trukhanov, A.V.; Trukhanov, E.L.; Natarov, V.O.; Balagurov, A.M. Thermal evolution of exchange interactions in lightly doped barium hexaferrites. J. Magn. Magn. Mater. 2017, 426, 554–562. [Google Scholar] [CrossRef]
  10. Guan, Y.; Li, Y. Stress concentration and optimized analysis of an arbitrarily shaped hole with a graded layer under anti-plane shear. Appl. Sci. 2018, 8, 2619. [Google Scholar] [CrossRef] [Green Version]
  11. Shang, Y.; Zhang, H.; Hou, H.; Ru, Y.; Pei, Y.; Li, S.; Gong, S.; Xu, H. High temperature tensile behavior of a thin-walled Ni based single-crystal superalloy with cooling hole: In-situ experiment and finite element calculation. J. Alloys Compd. 2018, 782, 619–631. [Google Scholar] [CrossRef]
  12. Duan, S.; Zhang, Z.; Wei, K.; Wang, F.; Han, X. Theoretical study and physical tests of circular hole-edge stress concentration in long glass fiber reinforced polypropylene composite. Compos. Struct. 2020, 236, 111884. [Google Scholar] [CrossRef]
  13. Almessiere, M.A.; Slimani, Y.; Algarou, N.A.; Vakhitov, M.G.; Klygach, D.S.; Baykal, A.; Zubar, T.I.; Trukhanov, S.V.; Trukhanov, A.V.; Attia, H.; et al. Tuning the Structure, Magnetic, and High Frequency Properties of Sc-Doped Sr0.5Ba0.5ScxFe12-xO19/NiFe2O4 Hard/Soft Nanocomposites. Adv. Electron. Mater. 2022, 8, 2101124. [Google Scholar] [CrossRef]
  14. Almessiere, M.A.; Algarou, N.A.; Slimani, Y.; Sadaqat, A.; Baykal, A.; Manikandan, A.; Trukhanov, S.V.; Trukhanov, A.V.; Ercan, I. Investigation of exchange coupling and microwave properties of hard/soft (SrNi0.02Zr0.01Fe11.96O19)/(CoFe2O4) × nanocomposites. Mater. Today Nano 2022, 18, 100186. [Google Scholar] [CrossRef]
  15. Gunwant, D. Stress Concentration Studies in Flat Plates with Rectangular Cut-Outs Using Finite Element Method. Int. J. Math. Eng. Manag. Sci. 2019, 4, 66–76. [Google Scholar] [CrossRef]
  16. Das, R.; Jones, R. Damage tolerance based design zoptimization of a fuel flow vent hole in an aircraft structure. Struct. Multi-Discip. Optim. 2009, 38, 245–265. [Google Scholar] [CrossRef]
  17. Krishnapillai, K.; Jones, R.; Peng, D. Three-dimensional fatigue-based structural design zoptimization of fuel flow vent holes. Eng. Fail. Anal. 2009, 16, 371–390. [Google Scholar] [CrossRef]
  18. Park, S.; Lee, K.; Kim, S.; Kim, J. Brake-disc holes and slit shape design to improve heat dissipation performance and structural stability. Appl. Sci. 2022, 12, 1171. [Google Scholar] [CrossRef]
  19. Han, J.; Guo, H. An equilibrium multi-objective optimum design for non-circular clearance hole of disk with discrete variables. Chin. J. Aeronaut. 2018, 31, 247–254. [Google Scholar] [CrossRef]
  20. Chen, Q.; Guo, H.; Zhang, C.; Liu, X. Structural optimization of uniaxial symmetry non-circular bolt clearance hole on turbine disk. Chin. J. Aeronaut. 2014, 27, 1142–1148. [Google Scholar] [CrossRef] [Green Version]
  21. Yan, C.; Zhu, J.; Shen, X.; Fan, J.; Jia, Z.; Chen, T. Structural design and optimization for vent holes of an industrial turbine sealing disk. Chin. J. Aeronaut. 2020, 34, 265–277. [Google Scholar] [CrossRef]
  22. Restrepo-Cuestas, B.J.; Montano, J.; Ramos-Paja, C.A.; Trejos-Grisales, L.A.; Orozco-Gutierrez, M.L. Parameter estimation of the bishop photovoltaic model using a genetic algorithm. Appl. Sci. 2022, 12, 2927. [Google Scholar] [CrossRef]
  23. Fei, C.-W.; Li, H.; Lu, C.; Han, L.; Keshtegar, B.; Taylan, O. Vectorial surrogate modeling method for multi-objective reliability design. Appl. Math. Model. 2022, 109, 1–20. [Google Scholar] [CrossRef]
  24. Ztürk, Ş.; Ahmad, R.; Akhtar, N. Variants of Artificial Bee Colony algorithm and its applications in medical image processing. Appl. Soft Comput. 2020, 97, 106799. [Google Scholar] [CrossRef]
  25. Imran, M.; Hashim, R.; Khalid, N.E.A. An overview of particle swarm optimization variants. Procedia Eng. 2013, 53, 491–496. [Google Scholar] [CrossRef] [Green Version]
  26. Zhan, Z.; Zhang, J.; Li, Y.; Chung, H. Adaptive particle swarm optimization. IEEE Trans. Syst. Man Cybern B 2009, 39, 1362–1381. [Google Scholar] [CrossRef] [PubMed] [Green Version]
  27. Zeng, N.; Wang, Z.; Zhang, H.; Alsaadi, F.E. A novel switching delayed pso algorithm for estimating unknown parameters of lateral flow immunoassay. Cogn. Comput. 2016, 8, 143–152. [Google Scholar] [CrossRef] [Green Version]
  28. Kakade, V.U.; Lock, G.D.; Wilson, M.; Owen, J.M.; Mayhew, J.E. Effect of location of nozzles on heat transfer in pre-swirl cooling systems. J. Turbomach. 2011, 133, 394–399. [Google Scholar] [CrossRef]
  29. Wu, C.; Vaisman, B.; McCusker, K. CFD analyses of HPT blade air delivery system with and without impellers. In Proceedings of the ASME 2011 Turbo Expo: Turbine Technical Conference and Exposition, Vancouver, BC, Canada, 6–10 June 2011; pp. 883–892. [Google Scholar]
  30. Kennedy, J.; Eberhart, R. Particle swarm optimization. In Proceedings of the ICNN′95-International Conference on Neural Networks, Perth, WA, Australia, 27 November 27–1 December 1995; Volume 4, pp. 1942–1948. [Google Scholar]
  31. Tang, Y.; Wang, Z.; Fang, J.-A. Parameters identification of unknown delayed genetic regulatory networks by a switching particle swarm optimization algorithm. Expert Syst. Appl. 2011, 38, 2523–2535. [Google Scholar] [CrossRef] [Green Version]
  32. Mallipeddi, R.; Suganthan, P.N. Problem Definitions and Evaluation Criteria for the CEC 2010 Competition on Constrained Real-Parameter Optimization; Nanyang Technological University: Singapore, 2010; p. 24. [Google Scholar]
  33. Liang, J.J.; Runarsson, T.P.; Mezura-Montes, E.; Clerc, E.; Suganthan, P.N.; Coello, C.A.C.; Deb, K. Problem definitions and evaluation criteria for the CEC 2006 special session on constrained real-parameter optimization. J. Appl. Mech. 2006, 41, 8–31. [Google Scholar]
Figure 1. Von Mises stress distribution of the single-hole sector sub-model of the HPT sealing disk.
Applsci 12 05395 g001
Figure 2. Cyclically symmetric sector sub-model of the studied HPT sealing disk.
Applsci 12 05395 g002
Figure 3. Flowchart of the developed integrated design optimization method.
Applsci 12 05395 g003
Figure 4. Schematics of four different shape designs for the vent hole. (a) Circular hole; (b) Elliptical hole; (c) Race-track hole; and (d) Four-arc hole.
Applsci 12 05395 g004
Figure 5. High-quality hexahedral mesh models for the single-hole sector sub-model with different shapes of vent holes.
Applsci 12 05395 g005
Figure 6. Boxplots of the optimal values of 25 repetitions obtained by PSO-CK, SPSO, and SDPSO, respectively, for each benchmark optimization problem. (a) BOP1; (b) BOP2.
Applsci 12 05395 g006
Figure 7. Convergence history of the mean of the present optimal values of the 25 repetitions obtained by PSO-CK, SPSO, and SDPSO, respectively. (a) BOP1; (b) BOP2.
Applsci 12 05395 g007
Figure 8. Convergence history of the optimization objectives (maximum von Mises stress) of the four different shapes of vent holes.
Applsci 12 05395 g008
Figure 9. Von Mises stress distribution of the initial circular and four optimal schemes. (a) Initial circular scheme; (b) Optimal circular scheme; (c) Optimal elliptical scheme; (d) Optimal race-track scheme; (e) Optimal four-arc scheme.
Applsci 12 05395 g009aApplsci 12 05395 g009b
Figure 10. Von Mises stress distribution along the edges of the vent holes of the initial circular and four optimal schemes.
Applsci 12 05395 g010
Figure 11. Radial and circumferential stress distribution of the initial circular and four optimal schemes. (a) Radial stress distribution of the initial circular scheme; (b) Circumferential stress distribution of the initial circular scheme; (c) Radial stress distribution of the optimal circular scheme; (d) Circumferential stress distribution of the optimal circular scheme; (e) Radial stress distribution of the optimal elliptical scheme; (f) Circumferential stress distribution of the optimal elliptical scheme; (g) Radial stress distribution of the optimal race-track scheme; (h) Circumferential stress distribution of the optimal race-track scheme; (i) Radial stress distribution of the optimal four-arc scheme; and (j) Circumferential stress distribution of the optimal race-track scheme.
Applsci 12 05395 g011aApplsci 12 05395 g011b
Table 1. Strategies for selecting c 1 and c 2 .
StateMode c 1 c 2
Convergence ξ ( t ) = 1 22
Exploitation ξ ( t ) = 2 2.11.9
Exploration ξ ( t ) = 3 2.21.8
Jumping-out ξ ( t ) = 4 1.82.2
Table 2. Strategies for selecting delayed information and parameters.
StateModepbestgbest τ 1 ( ξ ( t ) ) τ 2 ( ξ ( t ) )
Convergence ξ ( t ) = 1 p i ( t ) p g ( t ) 00
Exploitation ξ ( t ) = 2 p i ( t τ 1 ( ξ ( t ) ) ) p g ( t ) t · r a n d 0
Exploration ξ ( t ) = 3 p i ( t ) p g ( t τ 2 ( ξ ( t ) ) ) 0 t · r a n d
Jumping-out ξ ( t ) = 4 p i ( t τ 1 ( ξ ( t ) ) ) p g ( t τ 2 ( ξ ( t ) ) ) t · r a n d t · r a n d
Table 3. Mean, minimum, and standard deviation values of the optimal values of 25 repetitions, obtained by PSO-CK, SPSO, and SDPSO for each benchmark optimization problem, respectively.
ProblemsCriteriaPSO-CKSPSOSDPSO
BOP1Mean−0.5513−0.5469−0.6344
Minimum−0.6675−0.6586−0.6684
Std.Dev0.05780.06020.0195
BOP2Mean−9.4227−9.4800−13.1658
Minimum−12.00−12.00−14.4300
Std.Dev2.08892.06401.3983
Table 4. Details of the initial circular scheme, optimal circular scheme, optimal elliptical scheme, optimal race-track scheme, and optimal four-arc scheme.
SchemesDesign Variables (mm)Number of Vent HolesMaximum Von MISES Stress (MPa)Difference of Maximum Von Mises Stress
Initial circular scheme r cr ------ r c 0 751313.1460
5.800225.360
Optimal circular scheme r cr ------ r c 0 1241145.819−12.697%
4.507227.493
Optimal elliptical scheme a e b e --- r e 0 661031.590−21.409%
8.0004.733227.267
Optimal race-track scheme a r b r --- r r 0 901042.111−20.640%
1.9234.198227.801
Optimal four-arc scheme r fb r fs r fl r f 0 56927.395−29.376%
4.5043.72524.840227.496
Table 5. Maximum, minimum, mean, and range (difference between the maximum and minimum values) values of the von Mises stress along the edges of the vent holes of the initial circular and four optimal schemes.
SchemesMaximum (MPa)Difference Minimum
(MPa)
Difference Mean (MPa)Difference Range
(MPa)
Difference
Initial circular scheme1272.0980556.0800818.125---716.018---
Optimal circular scheme1100.762−13.469%581.2584.528%847.9703.648%519.505−27.445%
Optimal elliptical scheme1031.590−18.906%674.63221.319%859.0425.001%356.958−50.147%
Optimal race-track scheme1042.111−18.079%683.83122.973%858.0254.877%358.280−49.962%
Optimal four-arc scheme927.396−27.097%779.55040.187%858.5014.935%147.846−79.352%
Publisher’s Note: MDPI stays neutral with regard to jurisdictional claims in published maps and institutional affiliations.

