1. Introduction
Laser repair based on the principle of direct energy deposition (DED) is a branch of metal additive manufacturing technology that has wide application potential in the aerospace, automobile and ship industries [
1]. Compared with traditional repair technologies (welding, thermal spraying, etc.), laser repair has many advantages such as small heat affected zone on the component, little warpage and distortion of the substrate, and excellent metallurgical bonding between the cladding material and the substrate [
2].
During laser repair, a molten pool is formed on the surface of the substrate using a high-power laser beam as the heat source. Simultaneously, metal powder is introduced into the molten pool through a synchronous powder feeding system. Due to the high temperature, the surface of the substrate and metal powder melt together and generate metallurgical bonding [
3]. By moving the laser beam, the molten pool moves back and forth on the surface of the substrate, which makes the temperature of the repaired component change dynamically, leading to a complex thermal history. Available results have shown that the thermal history of a component has a significant influence on the homogeneity of the microstructure and final mechanical properties of the components [
4,
5,
6]. Therefore, online deformation measurement during the repair process is essential for understanding the evolution mechanism of stress and deformation in laser repair [
7].
As a new optical measurement method, the sampling moiré proposed by Morimoto can realize phase analyses using a single grating image by digital phase-shifting [
8]. It has been proven that the sampling moiré method has the advantages of a simple operation and low requirement for specimen grating frequency. Therefore, sampling moiré has been popularized and applied in the fields of real-time deformation measurement of materials and structures in different scales [
9,
10,
11,
12,
13]. However, extreme environments such as ultra-high temperature, strong laser radiation and metal powder splashing exist during laser repair, which make impacts on the imaging process [
14], bringing great challenges for the measurement of sampling moiré method.
In order to enable the application of sampling moiré in laser repair environment, in this paper, an online deformation measurement system based on orthogonal sampling moiré is developed, which is applied to measure the deformation field of the substrate during laser repair. In the measurement, laser repair is performed on a cantilever beam substrate, the size of which is properly designed to make the deformation within the measurement range of sampling moiré. Then, high temperature resistant grating is etched on the side surface of the cantilever by laser milling. Grating images are recorded by an optical imaging system, in which a group of filter components are designed to obtain images with high signal-to-noise ratio. Finally, the deformation field of the substrate during laser repair is calculated with the orthogonal sampling moiré method. The result shows that the scanning path in the repair process has a significant influence on the distribution of residual deformation, which offers a reference for optimizing the parameters of laser repair performed in the repair process.
2. Principle of Deformation Measurement with Orthogonal Sampling Moiré
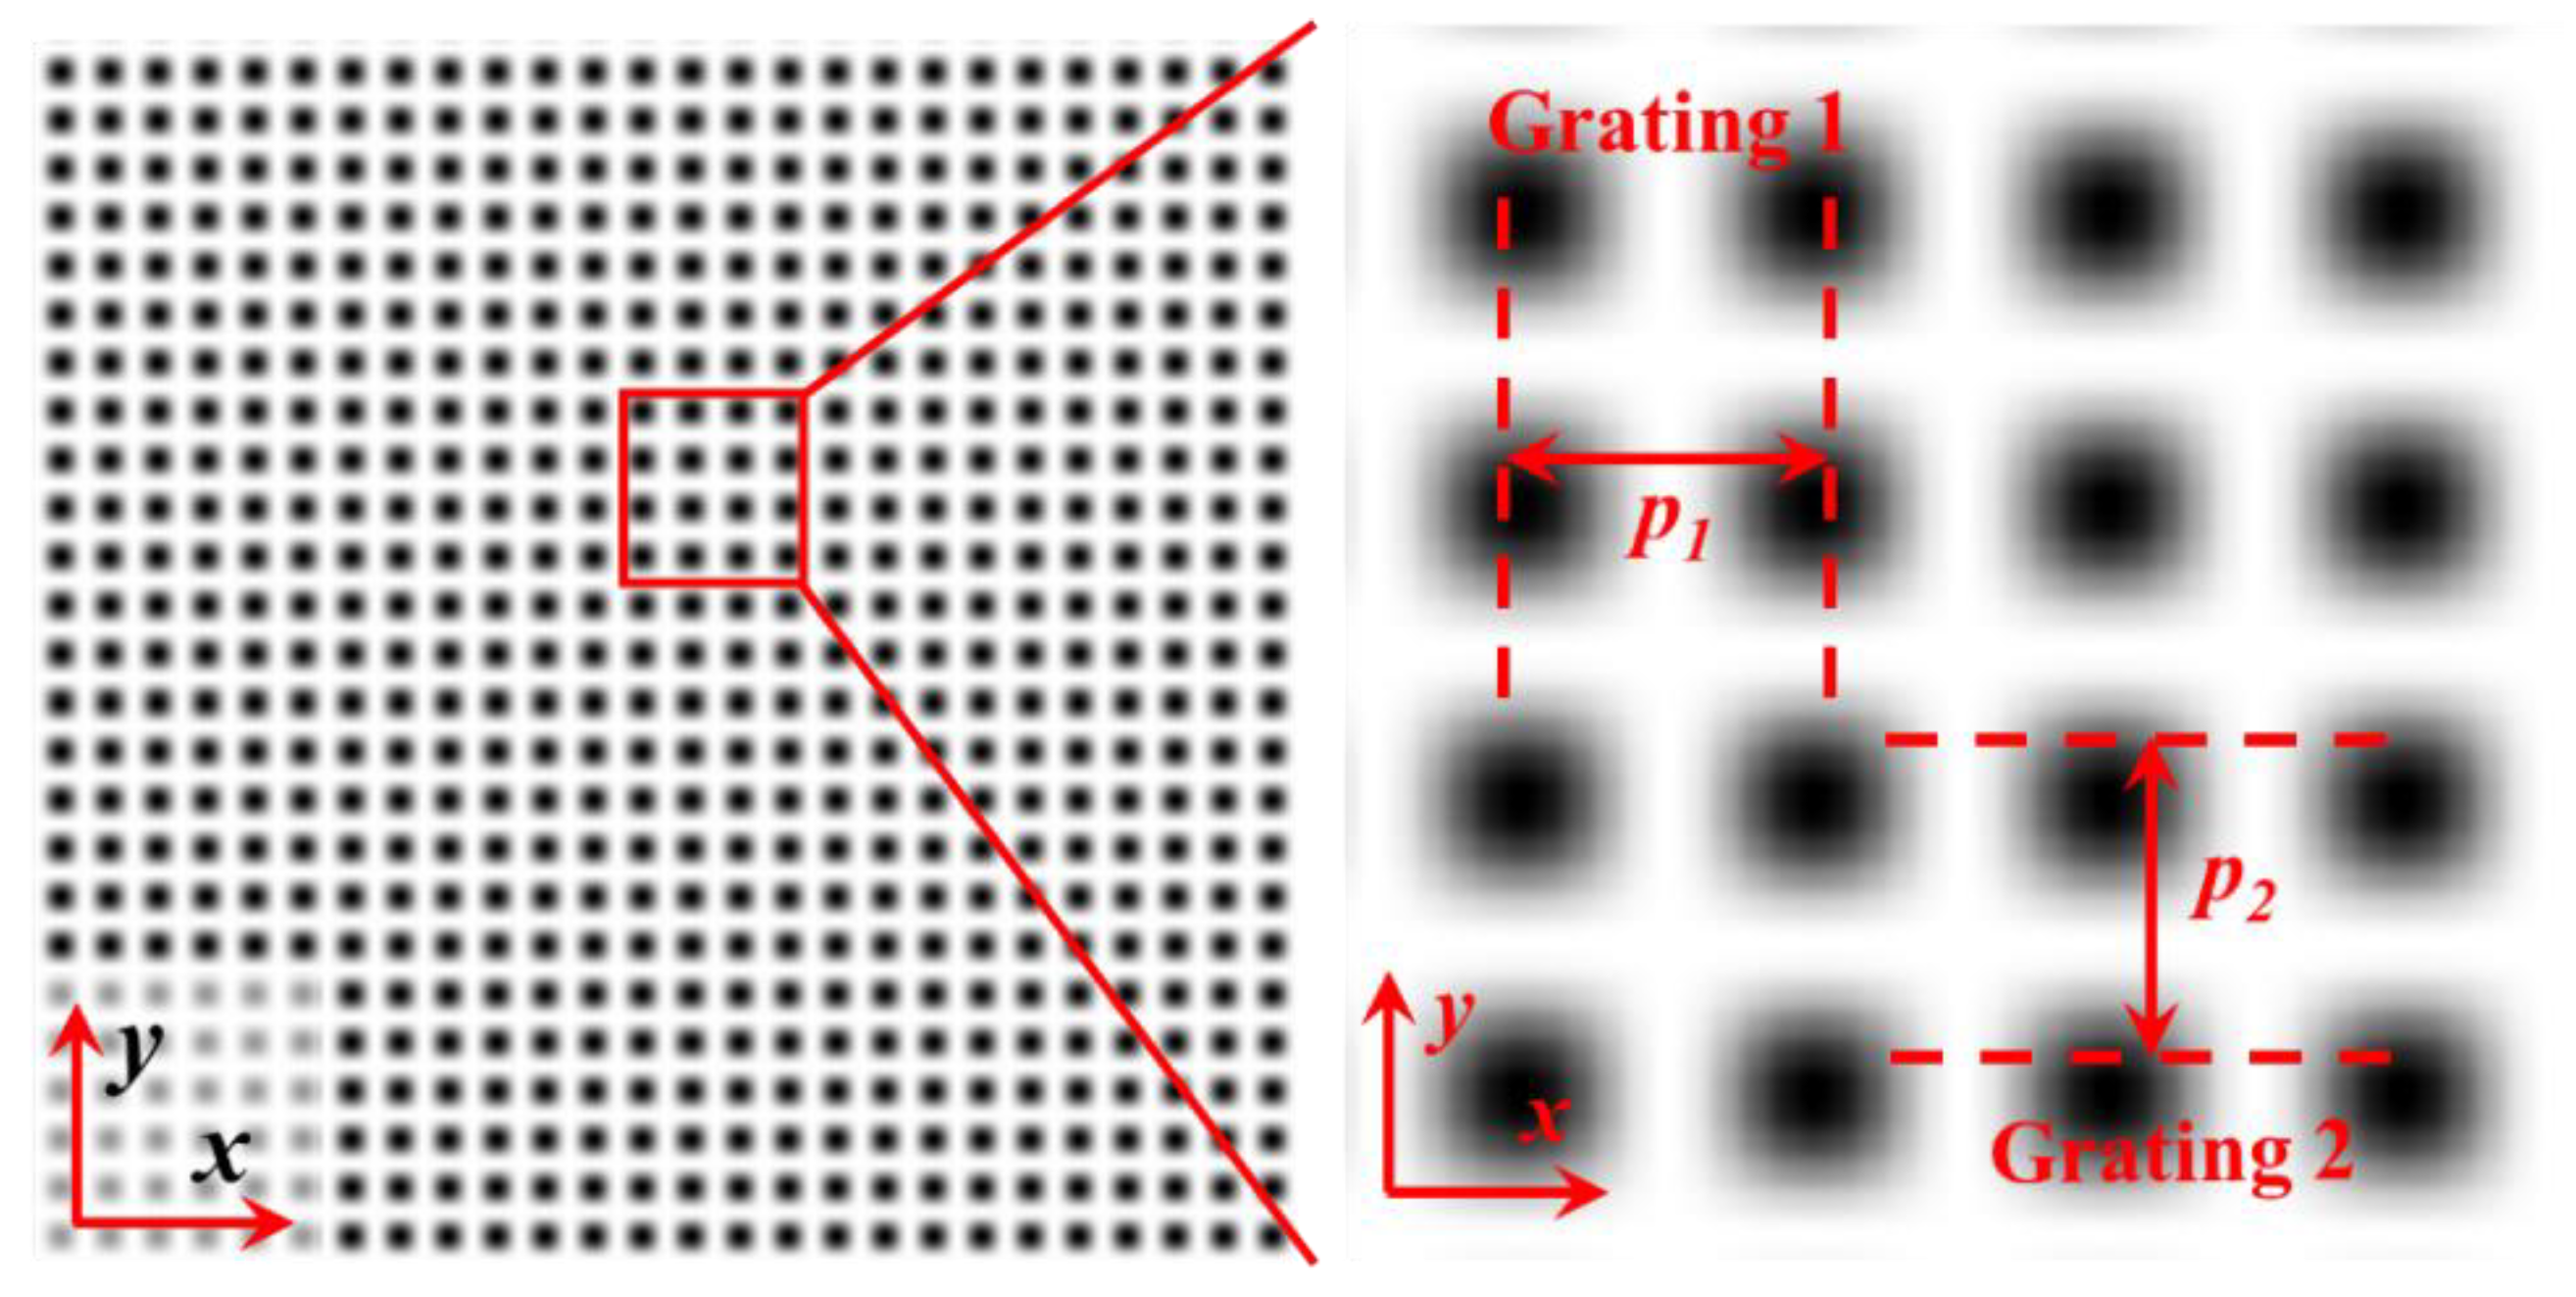
In two-dimensional deformation measurement, orthogonal grid lines instead of unidirectional grid lines are needed. As shown in
Figure 1, orthogonal grid lines can be obtained by superposing two mutually perpendicular one-directional gratings, which have two perpendicular main directions. In this case, the gray scale of orthogonal grating can be expressed as follows [
15]:
where
Ib1 and
Ib2 are the background light intensity of the two grid lines, respectively, and
Ia1 and
Ia2 are the modulation amplitude of the two grating images.
The orthogonal grating is sampled in the
x and
y directions simultaneously at regular intervals based on the sampling spacing. Then, sampling moiré can be obtained by connecting sampling points through interpolation. The phase of the moiré pattern can be shifted by moving the location of the sample point. The phase-shifted sampling results can be expressed as follows [
16]:
where
A =
Ib1Ib2,
B =
Ia1Ib2,
C =
Ia2Ib1,
D =
Ia1Ia2/2,
ps1 and
ps2 represent the sampling spacing in
x and
y direction, and
i and
j represent the moving distance of sampling points in
x and
y direction, respectively. (
i = 0, 1, ···,
ps1 − 1,
j = 0, 1, ···,
ps2 − 1).
It can be seen from Equation (2) that there are four kinds of phase-shifted frequencies after orthogonal sampling: (1/
ps1, 0), (0, 1/
ps2), (1/
ps1, 1/
ps2) and (1/
ps1, −1/
ps2). Since the sampling in the
x and
y directions are independent of each other, the phase shifts in the two directions are independent of each other. Therefore, the phase distribution of a moiré pattern in different directions can be calculated by discrete Fourier transform, the relevant formula of which can be expressed as follows [
16]:
where
is the
x-direction phase of the moiré pattern and
is the
y-direction phase of the moiré pattern. According to Equation (3), the processing process and results of the orthogonal sampling moiré method are shown in
Figure 2.
It can be seen from the results that the phase of moiré pattern in two directions obtained by orthogonal sampling is completely separated without interference of grid lines in other directions. Compared with the traditional filtering method, orthogonal sampling directly processes the orthogonal grating image without filtering, which has higher efficiency.
For the gratings before and after deformation, phase-shifted orthogonal sampling is carried out to compute the phase of moiré pattern. Suppose that
and
are the phases in
x and
y directions before deformation,
and
are the phases in
x and
y directions after deformation, and
is the grating period; then, the displacement field can be obtained through Equation (4) [
16]:
3. Online Measurement System of Substrate Deformation in Laser Repair
In this paper, laser repair is carried out on the upper surface of a stainless-steel cantilever beam, as shown in
Figure 3 [
17,
18]. The laser wavelength is 1064 nm with a fixed power of 1100 W, and the beam diameter is 2–3 mm. During the repair process, nickel base alloy powder is introduced into the molten pool and finally forms a cladding layer. In order to realize deformation measurement, the high temperature resistant orthogonal grating is etched on the side of the cantilever beam by laser milling with the technique in Reference [
19]. During laser repair, the substrate deforms together with the grating, images of which are recorded by a CCD camera at all times. Finally, the displacement fields in two directions are calculated with the orthogonal sampling moiré method based on the grating images.
However, the extreme environment during repair process brings many interferences, causing great challenges to optical measurement. In repair process, the power of laser can reach 800–1500 W, acting on the area with a diameter of 2–5 mm to produce ultra-high temperature metal powder splashing everywhere, which can influence the image quality. Moreover, relevant research shows that the local molten pool can reach a high temperature of nearly 3000 °C [
20], which is also a challenge for optical measurement.
As shown in
Figure 4, if the traditional image acquisition method is adopted, then the CCD camera is used to take photos directly during the repair process and the image obtained is inferior, with the influencing factors of imaging quality including overexposure, high-temperature radiation, glare and splashing powder. By shortening the exposure time, changing to a smaller aperture and adjusting the position of lens, the interference caused by glare and splashing powder can be removed. However, the overexposure of the laser area and the high-temperature radiation still interfere with the imaging quality.
Referring to the combination of blue light illumination and blue light narrow-band filter used in high-temperature deformation measurements [
21,
22], two high-power blue LED lamps were used for illumination and a group of filter components for laser repair environment was designed. As shown in
Figure 5, the filter group was composed of neutral attenuator, a narrow-band blue light filter and a 1064 nm cut-off filter, wherein a 1% neutral attenuator uniformly reduces the light intensity of all bands to 1%. The blue light filter only allows the light in the blue light band to pass through, and the 1064 nm cut-off filter rejects light above 950 nm.
Among the three filters, a 1% neutral attenuator can solve the problem of overexposure effectively; the blue light filter can filter out most of the interference light and only allow the light reflected by the grating, which is illuminated by the blue LED, to pass through; and the 1064 nm cut-off filter can reject laser light with wavelengths of 1064 nm. The effects of different filter combinations are shown in
Figure 6. It is found in
Figure 6b that, without the cut-off filter, the intensity of laser light is strong, resulting in overexposure around the molten pool. Thus, it is necessary to add a cut-off filter for the laser wavelength (1064 nm) to prevent the light in this band. In addition, it is found that, in some cases, the light is reflected between the three filters, resulting in ghosting. Through testing, the problem can be eliminated by slight rotation of the filters.
Since the neutral filter will reduce the gray level of the image, the cantilever needs to be illuminated by the high-power blue light source. The high-power blue LED lamps, CCD camera and designed filter group compose the optical imaging system, which is used to capture the deformed grating images during the repair process, as shown in
Figure 3. Additionally, the system parameters are set as follows: the LED light source power is 200 W; the camera resolution is fixed up to 2448 × 2048 pixels; and the frame rate is configured as 5–15 frames per second.
The deformed grating pattern recorded in the repair process is shown in
Figure 7. It can be seen that the gray scale of the image is uniform and that the interferences of laser repair environment has been suppressed. It should be noted that, although the grating has a binary color distribution physically, its gray scale distribution is close to sinusoidal curve by moving CCD to acquire defocus images [
23]. Part of the grating pattern (line segment AB in
Figure 7) is intercepted and the sinusoidal function is fitted according to its gray distribution, which is
. From the fitting results, it can be seen that the gray value of the image in line segment AB coincides well with the sinusoidal curve, proving that, under the prepared orthogonal grating and imaging system, the gray level of grating image presents sinusoidal distribution, which can meet the needs of online measurements of laser repair.
It should also be noticed that the imaging system contains only one CCD, which means only 2D deformation in a plane can be measured. Three-dimensional deformation on the complex geometry can be measured based on binocular vision if two CCDs are used, which is not discussed in the paper. Moreover, the displacement measurement range of sampling moiré method is generally 0.5–1.5 times the grating period [
24]. Thus, the deformation of the cantilever beam should not be too large and exceed the measurement range.
4. Results and Discussion
During laser repair, laser power, spot size and scanning speed affect the laser fluence input into the substrate. In addition, factors such as scanning path affect the thermal history in the process of repair and further result in different deformation and stress distribution [
25]. In this paper, the impacts of scanning path and speed are studied; as shown in
Figure 8, three scanning speeds of 5 mm/s, 10 mm/s and 15 mm/s are set for the four scanning paths. The width of a single cladding channel is about 3 mm, and the spacing between each cladding channel is 2 mm.
Of the three different scanning velocities, the energy fluence is the highest when the laser moves at the speed of 5 mm/s. Additionally, the cantilever beam components after cladding in this case are shown in
Figure 9. It can be seen that, even at the maximum energy fluence, the orthogonal grid lines on the side of the cantilever beam are still high-contrast, which proves the reliability of the prepared high-temperature grating.
The cladding results of four scanning paths at different scanning speeds are shown in
Figure 10. Although the substrates after cladding with different repair parameters have nearly equivalent mass, the characteristics of deformation field vary a lot. In particular, when scanning along the
y direction, it can be clearly seen that the slower the scanning speed is, the greater the warping deflection at the end of the cantilever beam is. However, this phenomenon is not evident when scanning along the
x direction, which reflects the different stress distribution on the substrate under different scanning paths, resulting in different residual deformations. The details will be further discussed through the displacement and strain analysis below.
4.1. Unidirectional Scanning in y Direction
In a y-direction unidirectional scanning period, the laser is excited and moves towards the y-direction, while the component is heated. After arriving at the end, the laser returns according to the original path without being emitted, while the component is cooled. Additionally, the progress repeats until the cladding is completed.
Under the unidirectional scanning path in the
y direction, the cladding results corresponding to different scanning speeds are shown in
Figure 11a. Set the end of the cantilever beam as the measuring point to obtain the evolution of the displacement in the
x and
z directions during the repair process, as shown in
Figure 11b. In the image coordinates, the downward direction of
z is positive and the right direction of
x is positive. It can be seen that the scanning speed has a great influence on the
z-direction displacement of the measuring point and that the absolute value of
z-direction displacement increases along with the scanning speed decreases.
It can also be seen from the curve in
Figure 11b that the absolute value of displacement in the
z direction continues to increase in the periodic fluctuation during the cladding process. It should be noted that, when the absolute value of displacement in the
z direction decreases in a single cycle, it corresponds to the time when the laser acts on the surface of the component (as shown in
Figure 11c). This is because when the laser acts on the surface of the component, an area of large positive strain is generated around the molten pool at the upper end of the component due to thermal expansion, making the cantilever beam displaced downward. When the laser is removed and the molten pool is cooled and solidified, the positive strain in the molten pool decreases and the cantilever moves upward.
The distribution of equivalent strain and the main direction of strain at the beginning and end of repair are calculated, as shown in
Figure 12a. It can be found that a concentration of strain exists around the molten pool during repair; after repair, the residual deformation presents the form of upward bending. Select four points A, B, C and D along the length of the cantilever beam, and draw the variation curve of the equivalent strain of these four points with time, as shown in
Figure 12b. It can be found that the slower the printing speed is, the greater the deformation becomes; in the initial stage of scanning, when the cladding area gradually moves to the right, the equivalent strain of the four points increases linearly with different slopes; and when the cladding zone passes through points A, B, C and D in turn, the equivalent strain of each point reaches its maximum value in turn and remains unchanged. This is because, when scanning in the
y direction, the beam is thermally expanded and the equivalent strain increases linearly at the beginning. However, once the molten pool passes through a certain point in the
x direction, it will not ever return, and then, the equivalent strain at this point remains constant.
4.2. Serpentine Scanning in y Direction
Under the serpentine scanning path in the
y direction, the laser sustainedly acts on the surface of the component along a
y-direction serpentine path. Additionally, the cladding results corresponding to different scanning speeds are shown in
Figure 13a. Similar to unidirectional scanning in the
y direction, in serpentine scanning, as the scanning speed decreases, the absolute value of the displacement of the end of the cantilever beam increases. The difference is that the laser continues cladding under the serpentine scanning path, resulting in no periodic distribution of the displacement curve. During the cladding process, the
z-direction displacement curve first increases in the positive direction and then continues to increase in the negative direction, while the
x-direction displacement increases positively, indicating the continuous thermal expansion of the cantilever beam in the
x-direction.
The distribution of the equivalent strain and the main direction of strain at the beginning and end of printing are calculated, as shown in
Figure 14a. Additionally, the curves of the equivalent strain of the four points over time are shown in
Figure 14b. It can be found that the slower the printing speed, the larger the equivalent strain becomes. Similar to the unidirectional scan in the
y direction, the equivalent strain of each point reaches its respective maximum value in order from left to right and then remains unchanged. The difference lies in the continuous cladding of the laser in the serpentine scanning path and the periodic fluctuation of the equivalent strain curve being smaller.
4.3. Unidirectional Scanning in x Direction
Under the unidirectional scanning path in the
x direction, the cladding results are shown in
Figure 15a. Compared with the unidirectional scanning results in the
y direction, on the one hand, the unidirectional scanning in the
x direction also shows that, when the scanning speed decreases, the displacement of the cantilever beam tends to be larger. On the other hand, the displacement under the unidirectional scanning in the
x-direction is smaller than the result of the unidirectional scanning in the
y-direction, but in a single cycle, the displacement in the
z-direction changes more widely. From the results in
Figure 15c, when the laser acts on the surface of the component, the cantilever beam is displaced downward. During the cooling stage, the displacement direction of the cantilever beam turns upward.
The distribution of the equivalent strain and the main direction of strain at the beginning and the end of printing are shown in
Figure 16a. Additionally, the curves of the equivalent strain of four points over time are shown in
Figure 16b. It can be found that the slower the laser moves, the larger the equivalent strain is. During the repairing progresses, the equivalent strain at the four points increases simultaneously and linearly with different slopes until the end of the printing. This is because, when scanning along the
x direction, the molten pool will repeatedly pass through each point in the
x direction of the beam, and the strain of each point will be repeatedly affected by the molten pool, so it increases at the same time until the end of printing.
4.4. Serpentine Scanning in x Direction
The cladding results corresponding to different scanning speeds under the serpentine scanning path in the
x direction are shown in
Figure 17a. Although the laser continues to act on the surface of the component in the serpentine scanning, there is still a heat dissipation time for the component due to the long scanning path in the
x direction, resulting in the periodicity of the displacement curve in
Figure 17b. Compared with
Figure 15b, when scanning in the unidirectional mode, the curves are more compact under the serpentine scanning, indicating that the deformation results under different scanning speeds are closer. Furthermore, under the serpentine scanning, the laser continuously excites the component to accumulate the heat of the component, which leads to a larger final residual deformation.
The distribution of equivalent strain and the main direction of strain at the beginning and end of printing are shown in
Figure 18a. Additionally, the variation curves of equivalent strain with time are shown in
Figure 18b. Similar to unidirectional scanning, with the progress of scanning, the equivalent strain of the four points increases linearly with different slopes at the same time until the end of printing. The difference is that there is a cooling process in unidirectional scanning. Thus, during the cooling period, the equivalent strain changes greatly and the curve fluctuates regularly. However, when scanning in serpentine paths, the laser continues to excite the substrate. Therefore, the fluctuation is not obvious, although it still shows periodic changes due to laser scanning back and forth.
The above comparison results show that the scanning form of unidirectional or serpentine has little influence on the residual deformation of the component. However, the residual deformation after scanning along the x direction varies a lot from scanning along the y direction. When scanning is performed along the x direction of the cantilever beam, the residual deformation can be up to twice that along the y direction. In addition, it is shown that the lower the speed of the laser scanning is, the more severe the deformation is.

