1. Introduction
The epidemic of cardiovascular disease (CVD) has shifted from high-income countries to parts of the developing world. More than three-quarters of deaths from cardiovascular disease occur in low-income countries [
1]. In the case of cardiovascular disease, correct diagnosis at an early stage is very important. Therefore, a fast and effective diagnostic technique must be given precisely and accurately. One of the pathological measures to diagnose cardiovascular disease is an electrocardiogram (ECG). ECG is the process of recording the electrical activity of the heart over a period of time. The ECG signal consists of P, QRS, T, and U components, known as features [
2].
Many studies have been conducted related to ECG signal. The most popular one is to classify cardiovascular disease from ECG using artificial intelligence. One of approach is the utilization of machine learning algorithm. Most machine learning approaches involve three phases such as preprocessing, feature extraction, and feature normalization [
3]. However, such approach needs a prior knowledge to determine the feature. In addition the extracted feature sometimes not suitable for different classification task in ECG.
In recent years deep learning, part of machine learning, has gained popularity due to its high performance and effectiveness. Deep learning techniques outperform conventional machine learning techniques by extracting the necessary features from the raw data [
4]. It has less processing and high accuracy compared to traditional methods. One of deep learning method that can process an ECG signal is Convolutional Neural Networks (CNN). This method have been used to classify heart rate, including detection of Myocardial Infarction (MI) disease [
5]. MI refers to myocardial necrosis caused by acute and persistent ischemia and hypoxia in the coronary arteries [
6]. MI is more common in the elderly, but more and more young people are suffering from MI due to high pressure, fast-paced and unhealthy lifestyles. The heart produces a change in potential with each beating cycle [
7]. A fast, simple, non-invasive electrocardiogram is widely used in the diagnosis of MI.
In a study conducted by Nurmaini, et al. [
8], the proposed 1D-CNN approach was used to detect AF disease with 13 layers and 10-fold cross validation. To remove noise, eight levels of DWT decomposition were used with Symlet5. In this study, researchers used four data sets, such as MIT-BIH Atrial Fibrillation, Physionet Atrial Fibrillation, MIT-BIH Malignant Ventricular Ectopy, and from hospitals in Indonesia. With 9 s of signal segmentation and a combination of DWT and 1D-CNN to detect/classify AF, it allows the model to automatically extract features from the ECG signal and helps improve final classification performance.
Another study conducted by Bologlu [
9], proposed a CNN architecture to classify 10 MI classes on 12 leads ECG signals without feature extraction. The dataset used is the ECG Physiobank (PTB) dataset. The result of this research is that the highest classification performance is in lead v4 with an accuracy of 99.78%. However, this study only utilize 12 leads from 15 leads. The remain three leads (vx, vy and vz) are the frank leads which are needed to detect STEMI condition from ECG signal. Moreover, the proposed architecture in [
8] are quite complex with 6 layers of convolutional layers, resulting a high computational cost.
Research conducted by Vogiatzis et al. [
10] on the importance of 15 leads ECG signal versus 12 leads ECG signal in improving the diagnostic accuracy of Acute Myocardial Infarction (AMI). The purpose of this study was to examine the usefulness of the 15-lead ECG signal in treating chest pain patients, especially if the 12 lead ECG signal could not diagnose AMI. The results showed that the 12 lead ECG signal was diagnostic of ST-elevation AMI (STEMI) in 158 patients (Group A, 84.5%) who immediately underwent reperfusion therapy. On the other hand, posterior lead interpretation was applied to 28 patients (Group B, 15.1%) for the diagnosis of STEMI requiring reperfusion therapy. In clinical practice, 15 leads ECG leads have better diagnoses in STEMI condition than the 12 leads ECG signal which was not conclusive (OR = 2.43,
p = 0.04). It can be concluded that the use of 15 lead ECG signals contributes to a faster and more accurate diagnosis of STEMI, especially in the Emergency Unit.
The study of 15 ECG leads was also conducted by Brady [
11]. The study aimed to investigate the diagnostic and therapeutic impact of 15 ECG leads (15EKG) in the Emergency Department (ED) for patients suffering from chest pain (CP). The study design was a prospective use of 15 ECG with real-time physician survey and retrospective comparison with 12 ECG leads (12EKG). The result of this study is that of the 15 ECG cases, 81% have completed the doctor’s survey and showed that the results of the diagnosis and management of ACIS were not changed by 15 ECGs. However, clinicians feel that the 15 ECG provides a more complete anatomical picture of ACIS especially the description of myocardial injury without changing the ED diagnosis, ED-based therapy, or hospital disposition in adult CP patients. The investigators suggest conducting further studies to identify a subset of patients who might benefit from a 15EKG.
Another study was carried out by Syndrome [
12], which was designed to evaluate ST-segment deviation of the posterior lead ECG in ACS patients at Beheshti Hospital in 2002. This study was conducted on 347 ACS patients admitted to the Emergency Department. Diagnosed on 15 ECG leads (12 standard ECG leads with an additional three leads (V7-V8-V9)) and performed statistical analysis, calculated percentage sensitivity, odds ratios, 95% confidence interval. The results showed that 15 lead ECG provides increased sensitivity in detecting ST-segment deviation in AMI and unstable angina.
This study performs 10 MI classes classification using 1D-CNN on 15 leads ECG leads. Moreover, in order to get better performance a framework based on 1D-CNN architecture was develop. In order to reduce the computational complexity and cost, the proposed CNN architecture was constructed using two convolutional layers. Moreover, 700 nodes of ECG signal are used to provide a better feature representative. Based on the description above, this research and the proposed method provide new contributions as follows:
In measuring and evaluating the proposed method, we will analyze the performance of the model based on the values of accuracy, sensitivity, specificity, precision, and F1 score. With a detailed approach and to describe the proposed methods and contributions, this paper is structured as follows: In
Section 2, we present the proposed materials and methods for ECG imaging in identifying MI. In
Section 3, we present the results of applying the method. In
Section 4. we present a discussion. Finally,
Section 5 draws conclusions from the process and the results obtained.
3. Results
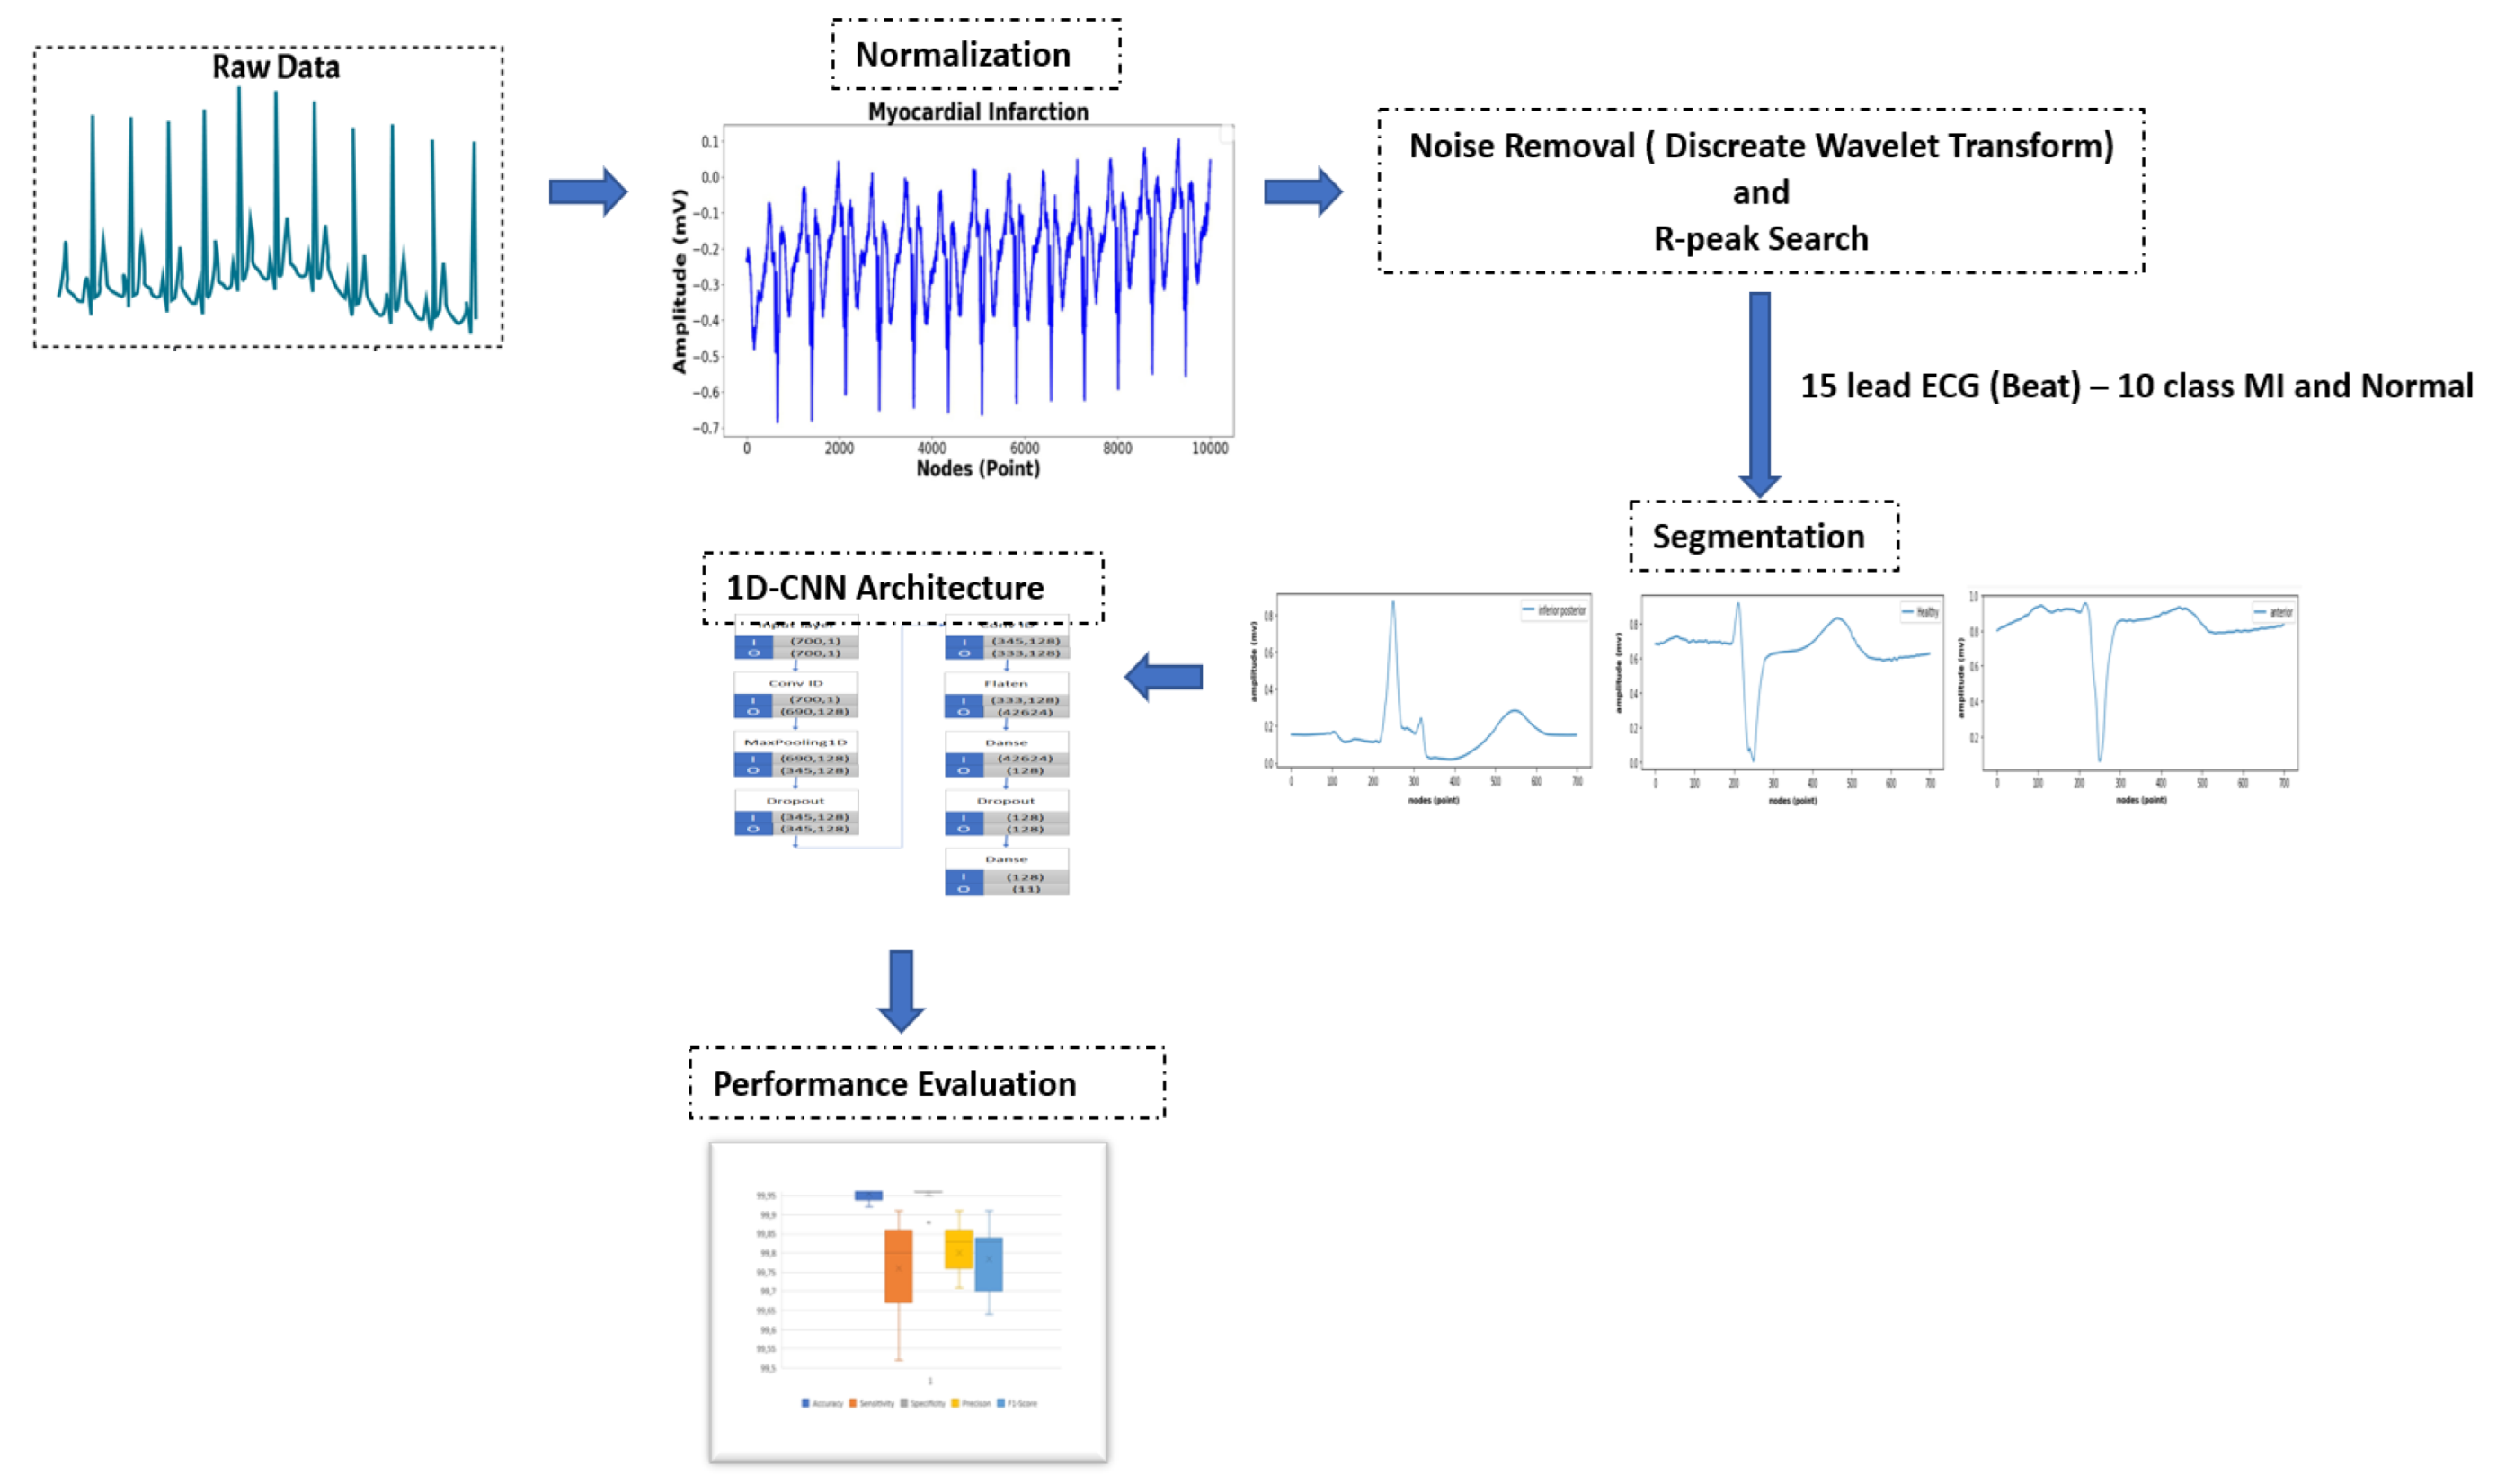
Experimental studies for all MI and normal classes in 15 leads were carried out separately using the same 1D-CNN architecture, without changing the model parameters with the modified data set and the implemented application. In model evaluation, all ECG signals from all leads were partitioned 70% for training, 15% for validation and 15% for testing. Keras library is used with Adam optimizer algorithm and cross loss entropy function. The 1D-CNN model was individually trained for all ECG signals across all MI classes in 15 leads over a 50 epoch period.
Table 2 shows a detailed specification of each parameter of the 1D-CNN architecture layer.
The model successfully completed the learning process for all ECG signals in a short time (50 epochs). During the training phase, no overfitting problems occurred in the 1D-CNN model. After the training phase, the proposed 1D-CNN model was applied to the test data.
The 1D-CNN architectural model is built to provide optimized ECG signal recognition performance of all ECG leads. The proposed architecture only has 2 convolution layers. This due to we want to avoid the vanishing gradient problem. Besides in every convolutional layer we generate 128 unique features from ECG signal. Moreover, we use single stride to generate more unique and detailed feature. Moreover, we also use dropout layer in fully connected layer to avoid overfitting. The block representation of proposed 1D-CNN model is summarized in
Figure 4.
ECG signals 10 MI and Normal class with 700 samples are input into this model layer. They pass through hierarchically arranged convolution layers and turn into feature maps of different sizes. In this model, the dropout technique is used to avoid overfitting while the model is in training. The model will check all training data at each epoch and the model will record training data if the selected epoch number is too large.
Table 3 show the performance of the trained 1D-CNN model at the end of the 50th epoch on test data in 15 ECG leads. The proposed 1D-CNN model recognizes test data for all vector groupings in all MI and Normal classes with a testing accuracy of more than 99.5% for each ECG lead.
From
Table 3, it can be seen that the highest classification performance results for the 10 MI classes and normal classes is in lead v2 with a testing accuracy value of 99.87% while the lowest accuracy level is in lead aVR with an accuracy of 99.58%. Moreover, the test set performance was slightly better than train set performance was due to the number of test set is lower than train set. This resulting training data more vary than testing data, makes the model covers the distribution on test data. Hence, the testing data has a slightly better performance compared to training data. In addition the detailed Graph of Training and Validation (Accuracy and Loss) for v2 leads was displayed on
Figure 5.
A confusion matrix is a detailed tabulation that describes the classification results in a model. From the results of the confusion matrix in lead v2 (
Figure 6), it shows that the model built has a very good accuracy value in almost all MI classes. The CNN model used recognizes well (100%) in classes A, AL, IP, L, P, and PL, while the normal class has a value of 99.94% with only one data having an error in labeling. In general, the proposed CNN model is tested using test data with several test values such as accuracy, sensitivity, specificity, precision, and F1-score. The performance results obtained were above 99.9% for accuracy and specificity and ranged from 99.5% to above 99.9% for sensitivity, precision, and F1 score (
Figure 7). The model with the highest accuracy was chosen as the best model for this study from all the models analyzed.
Table 4 shows the performance result values for accuracy, sensitivity, specificity, precision, and F1-score in 15 ECG leads and
Table 5 shows the performance matrix values for 10 MI and normal classes.
The performance results (%) for each of the 15 ECG leads are presented in
Table 4. The best average accuracy value for all MI and Normal classes is in lead v2 with a value of 99.98%. Likewise, the best values for sensitivity, specificity, precision, and F1-score are in lead v2 with values of 99.91%, 99.99%, 99.91% and 99.91%. More details on the values of accuracy, sensitivity, specificity, precision, and F1-score for each MI class and normal in each lead.
In
Table 5, the MI class accuracy value which has the lowest value is AS class (99.80%) and the best MI class accuracy value that reaches 100% is A, H, IP, IPL, L, P, and PL classes. Similarly, the sensitivity value was obtained from the test data for all MI and normal classes. The lowest sensitivity value is PL class (98.28%) and the highest sensitivity value is in almost all MI classes (100%) except AL (99.80%) and IL (99.85%) on all ECG signals in all leads. The CNN model can recognize MI class with a high sensitivity value of 99.80% for all leads. In other words, the proposed model is good for heterogeneity in all ECG segments. For the specificity value, the lowest value is below 99.85% in the PL class (98.92%), while the highest value of 100% specificity is in almost all MI classes and normal except for class I (99.99%). For precision, the highest value is in almost all MI and normal classes, while the lowest precision value is in the PL class (99.15%). For F1-Score, the highest score of 100% is in class A, H, IP, IPL, L, P, and PL, while the lowest score is in class AL (98.97%).
Based on the accuracy, sensitivity, specificity, precision, and F1-score, the diagnostic test is found to be able to identify patients with MI disease with great relevance. The highest values of accuracy, sensitivity, specificity, precision, and F1-score for 10 MI classes and normal in 15 leads are at the maximum values of 99.98%, 99.91%, 99.99%, 99.91, and 99.91%. Meanwhile, the lowest values of accuracy, sensitivity, specificity, precision, and F1-score are 99.92%, 99.52%, 99.88%, 99.45%, and 99.64%. The evaluation results above shows that the proposed CNN model is able to classify MI disease very well for 10 classes of MI and normal in 15 ECG leads.
4. Discussion
Many literatures describe approaches to MI signal classification. The difference in the number of MI classes used as well as the number of leads used must be taken into account when comparing the performance of each.
Table 6 presents some of the published research results for the current approach.
Research Acharya et al. [
19], detected MI and Normal for 12 lead ECG signals with KNN classification and achieved 98.74% performance on lead v3. Kumar et al. [
16], classified MI and Normal classes for 12 ECG lead signals with the LS-SVM classification. The results obtained are 99.31% accuracy in lead ii. Dohare et al. [
20], achieved an accuracy of 98.33% using the SVM classification to distinguish MI from healthy classes. Bologlu et al. [
9], used CNN model 10 layer to classify 10 MI and Normal classes on the 12 lead ECG signals. The model output obtained reaches a performance of 99.78%. Han et al. [
21], used ML–ResNet for the diagnosis of 6 classes of MI and normal with an accuracy of 99.72% and an F1-score of 99.67%. Dey et al. [
22] classified 12 ECG signal leads for MI and Non MI classes using CNN and bi LSTM models and the performance evaluation results obtained were 99.246%. While Yadav et al. [
4] classified MI and Normal classes for 12 lead ECG signals with the CNN model which achieved an accuracy of 99.82%. Research Li [
23], proposed an automatic MI detection model SLC-GAN which synthesizes single ECG data with high morphological similarity through Generative Aversive Network (GAN). MI detection is automated using the Convolutional Neural Network (CNN) with the original ECG data and the synthetic ECG from the GAN. Empirical results show that the SLC-GAN method performs very well compared to other MI classification methodologies on single lead ECG from PTB Diagnostic ECG Database. The MI SLC-GAN classification accuracy reaches 99.06% with 5-fold cross validation. For our proposed model, we use a 15 lead ECG signal with 1D-CNN architecture for 10 MI and Normal classes.
In
Table 6, it can be seen that the MI classification problem can be proposed as a binary classification problem, namely distinguishing ECG signals for Normal and MI classes. The difference between this study and previous studies (1,2,3,5,6,7) lies not only in the number of MI classes used, but also in the number of ECG signal leads. All previous studies generally used 12 standard leads, while this study used 15 ECG signals (12 standard leads and 3 frank leads). It can be seen that the performance results for 3 lead franks (vx, vy, vz) reached an average accuracy of 99.97%, 99.96% and 99.93% and an average sensitivity of 99.76%, 99.80% and 99.52% (
Table 4). From the performance results, it can be seen that the three leads (vx, vy, vz) were able to give the best contribution to the classification performance for 10 MI and Normal classes.
Research conducted by Baloglu et al. [
8], using the same number of MI and Normal classes as this study. The difference lies in the segmentation for the length of the ECG signal (Baloglu [
8] 651 pulse samples, while for this study using a longer signal of 700 pulse samples/signal modified with a duration of 0.7 s) which causes a difference in the number of beats produced. Another difference lies in the number of layers of the CNN architecture and the size of the kernel used. Baloglu [
8] used 10 CNN layers while this study used 8 CNN layers. A smaller number of layers will reduce the computational load on the CNN architecture used so that the computing process can be faster. The difference in kernel size results in the difference in the size of the detected features. The result of this research is that the performance value obtained is better than previous studies. The advantage of this study is that the proposed 1D-CNN method on 15 leads of ECG signals successfully distinguishes 10 types of MI and normal signals with a classification performance of more than 99.9%.


