Article

Novel Approach Using Risk Analysis Component to Continuously Update Collaborative Robotics Applications in the Smart, Connected Factory Model

1
Functional Materials & Manufacturing Processes, Technology Department, Siemens Aktiengesellschaft, D-81739 Munich, Germany
2
Human-Centered Assistive Robotics (HCR), Department of Electrical and Computer Engineering, Technical University of Munich (TUM), D-80333 Munich, Germany
3
Business Unit Robotic Systems, Fraunhofer Institute for Factory Operation and Automation IFF, D-39106 Magdeburg, Germany
4
School of Industrial Engineering, Eindhoven University of Technology, De Zaale, NL-5600 MB Eindhoven, The Netherlands
5
Automation Technology and Mechanical Engineering, Faculty of Engineering and Natural Sciences, Tampere University, FI-33014 Tampere, Finland
6
Autonomous Systems, Technische Universität Wien (TU Wien), AT-1040 Vienna, Austria
7
Institute of Robotics and Mechatronics, German Aerospace Center (DLR), D-82234 Wessling, Germany
*
Author to whom correspondence should be addressed.
Appl. Sci. 2022, 12(11), 5639; https://doi.org/10.3390/app12115639
Submission received: 9 March 2022 / Revised: 21 May 2022 / Accepted: 28 May 2022 / Published: 1 June 2022
(This article belongs to the Special Issue Design and Application of Collaborative Robotics)

Abstract

:

Featured Application

Digital risk analysis of collaborative robotics applications, featuring connections with manufacturing execution systems to support change management.

Abstract

Building on the idea of Industry 4.0, new models of the highly connected factory that leverage factory-generated data to introduce cost-effective automation and involve the human worker for creating higher added value are possible. Within this context, collaborative robots are becoming more common in industry. However, promises regarding flexibility cannot be satisfied due to the challenging process of ensuring human safety. This is because current regulations and standards require updates to the risk assessment for every change to the robotic application, including the parts involved, the robotic components, and the type of interaction within the workspace. This work presents a novel risk analysis software tool that was developed to support change management for adaptive collaborative robotic systems in the connected factory model. The main innovation of this work is the tool’s ability to automatically identify where changes have been made to components or processes within a specific application through its integration with a connected factory architecture. This allows a safety expert to easily see where updates to the risk assessment are required, helping them to maintain conformity with the CE marking process despite frequent changes. To evaluate the benefits of this tool, a user study was performed with an exemplary use-case from the SHOP4CF project. The results show that this newly developed technology for risk assessment has better usability and lower omission errors when compared to existing methods. Therefore, this study underlines the need for tools that can help safety engineers cope with changes in flexible robotics applications and reduce omission errors.

1. Introduction

The manufacturing domain is constantly presented with challenges due to increasing demands for mass customization and leads to a production referred to as “high-mix low-volume” (HMLV) [1]. The fourth industrial revolution, also known as Industry 4.0 (I4.0), promises to solve these challenges through the extraction of information from the production data created by interconnected processes. More specifically, an I4.0 factory will be a pluralism of interconnected processes that stem from new forms of collaboration, such as: machine-to-machine, machine-to-human, and human-to-human [2]. These processes will receive information on ways to efficiently perform manufacturing through the analysis of the production data [3]. Specific examples of the advantages given by the adoption of I4.0 principles can be found in [4]. However, I4.0 concepts are slow to be adopted by European small and medium-sized enterprises (SMEs) [5], especially in the context of robotics [6]. Therefore, ways to further expand their adoption are necessary.
Human–robot collaboration (HRC), a form of human–machine interaction, is one of the I4.0 areas where adoption is limited. HRC is often implemented to make use of the cognitive abilities of humans to augment machines, executing repetitive or physically strenuous tasks. However, ensuring safety is often a barrier to more widespread usage [7]. This is because changes to an application require review, and possibly an update, to the risk analysis, depending on the significance of the change. While a program can be automatically generated to adapt to new parts that are to be manipulated, risk analysis is completely manually generated at this time and requires the oversight of a safety expert. Therefore, in this paper, a methodology and a software component (i.e., risk analysis tool) to mitigate this issue are presented.
The main innovation of this work is the risk analysis tool and its integration within the overall connected factory architecture. This integration means that it can automatically identify where changes to components or processes within a specific collaborative robot (cobot) application have been made. In case of changes to the application that could potentially require an update to the risk analysis documentation (as part of the CE marking process), only the changed areas are highlighted. This allows the safety expert to easily see where updates to the risk assessment are required. The overall proposed workflow still requires a human safety expert to review all the changes to the risk analysis and evaluate whether the risks have changed; however, by marking all changes, the burdensome task of searching and finding these areas is eliminated. The authors believe that this is a particularly useful tool that can be used in industry in the near future.
To present the main innovation of this tool, this article is structured as follows. Initially, an introduction of the state-of-the-art methods of risk analysis in collaborative robotics applications, as well as of smart factories for HMLV productions, is given in Section 1.1 and Section 1.2. Second, the overall architecture proposed by the EU-funded project, SHOP4CF (https://shop4cf.eu/ (accessed on 5 January 2022)) for smart factories of the future, is outlined in Section 2, highlighting specific software components used for process modeling and risk analysis documentation, and for connecting these with a high-level manufacturing execution system (MES). Third, an exemplary use-case, developed within the project to illustrate how the components work in practice and to provide a comparison of the proposed methods against traditional methods through a user test, is presented in Section 3 and Section 4. Finally, the main findings and future directions are summarized in Section 5 and Section 6.

1.1. Smart Factory and Collaborative Robots

One of the most challenging scenarios that the smart factory will face is enabling a quick response to volatile markets through the production of small product batches containing highly customized products. Recent I4.0 technologies and concepts can be used to achieve this goal. For example, data-driven approaches can enable manufacturing and assembly systems to quickly switch between variant parts and products [8]. Additionally, collaborative robots can be employed in assembly tasks to assist humans [9,10]. Despite these possibilities, achieving lean manufacturing in HMLV environments is still a complex and on-going research topic [11].
Should the smart factory utilize collaborative robots, several barriers hindering their adoption need to be addressed [12]. When integrating cobots in scenarios with high variance, differences in design, configuration, and safety settings are necessary. For example, depending on the objects to be manipulated, different end-effectors (EE) and picking strategies might be required [13,14,15]. Consequently, different programming strategies [16] or types of collaboration, such as the ones shown in Figure 1, might be necessary. Furthermore, the human collaborating with the robot might have different requirements in terms of ergonomic needs and workplace safety [17]. This list of differences can become quite long. Therefore, we see that a robotic (collaborative) application meant to address the HMLV challenge will feature high variability in terms of tools, hardware, and software. Thus, being able to track all these components and perform a proper safety analysis, considering time constraints, can be challenging.

1.2. Risk Analysis and Risk Assessment for Collaborative Robotics Applications

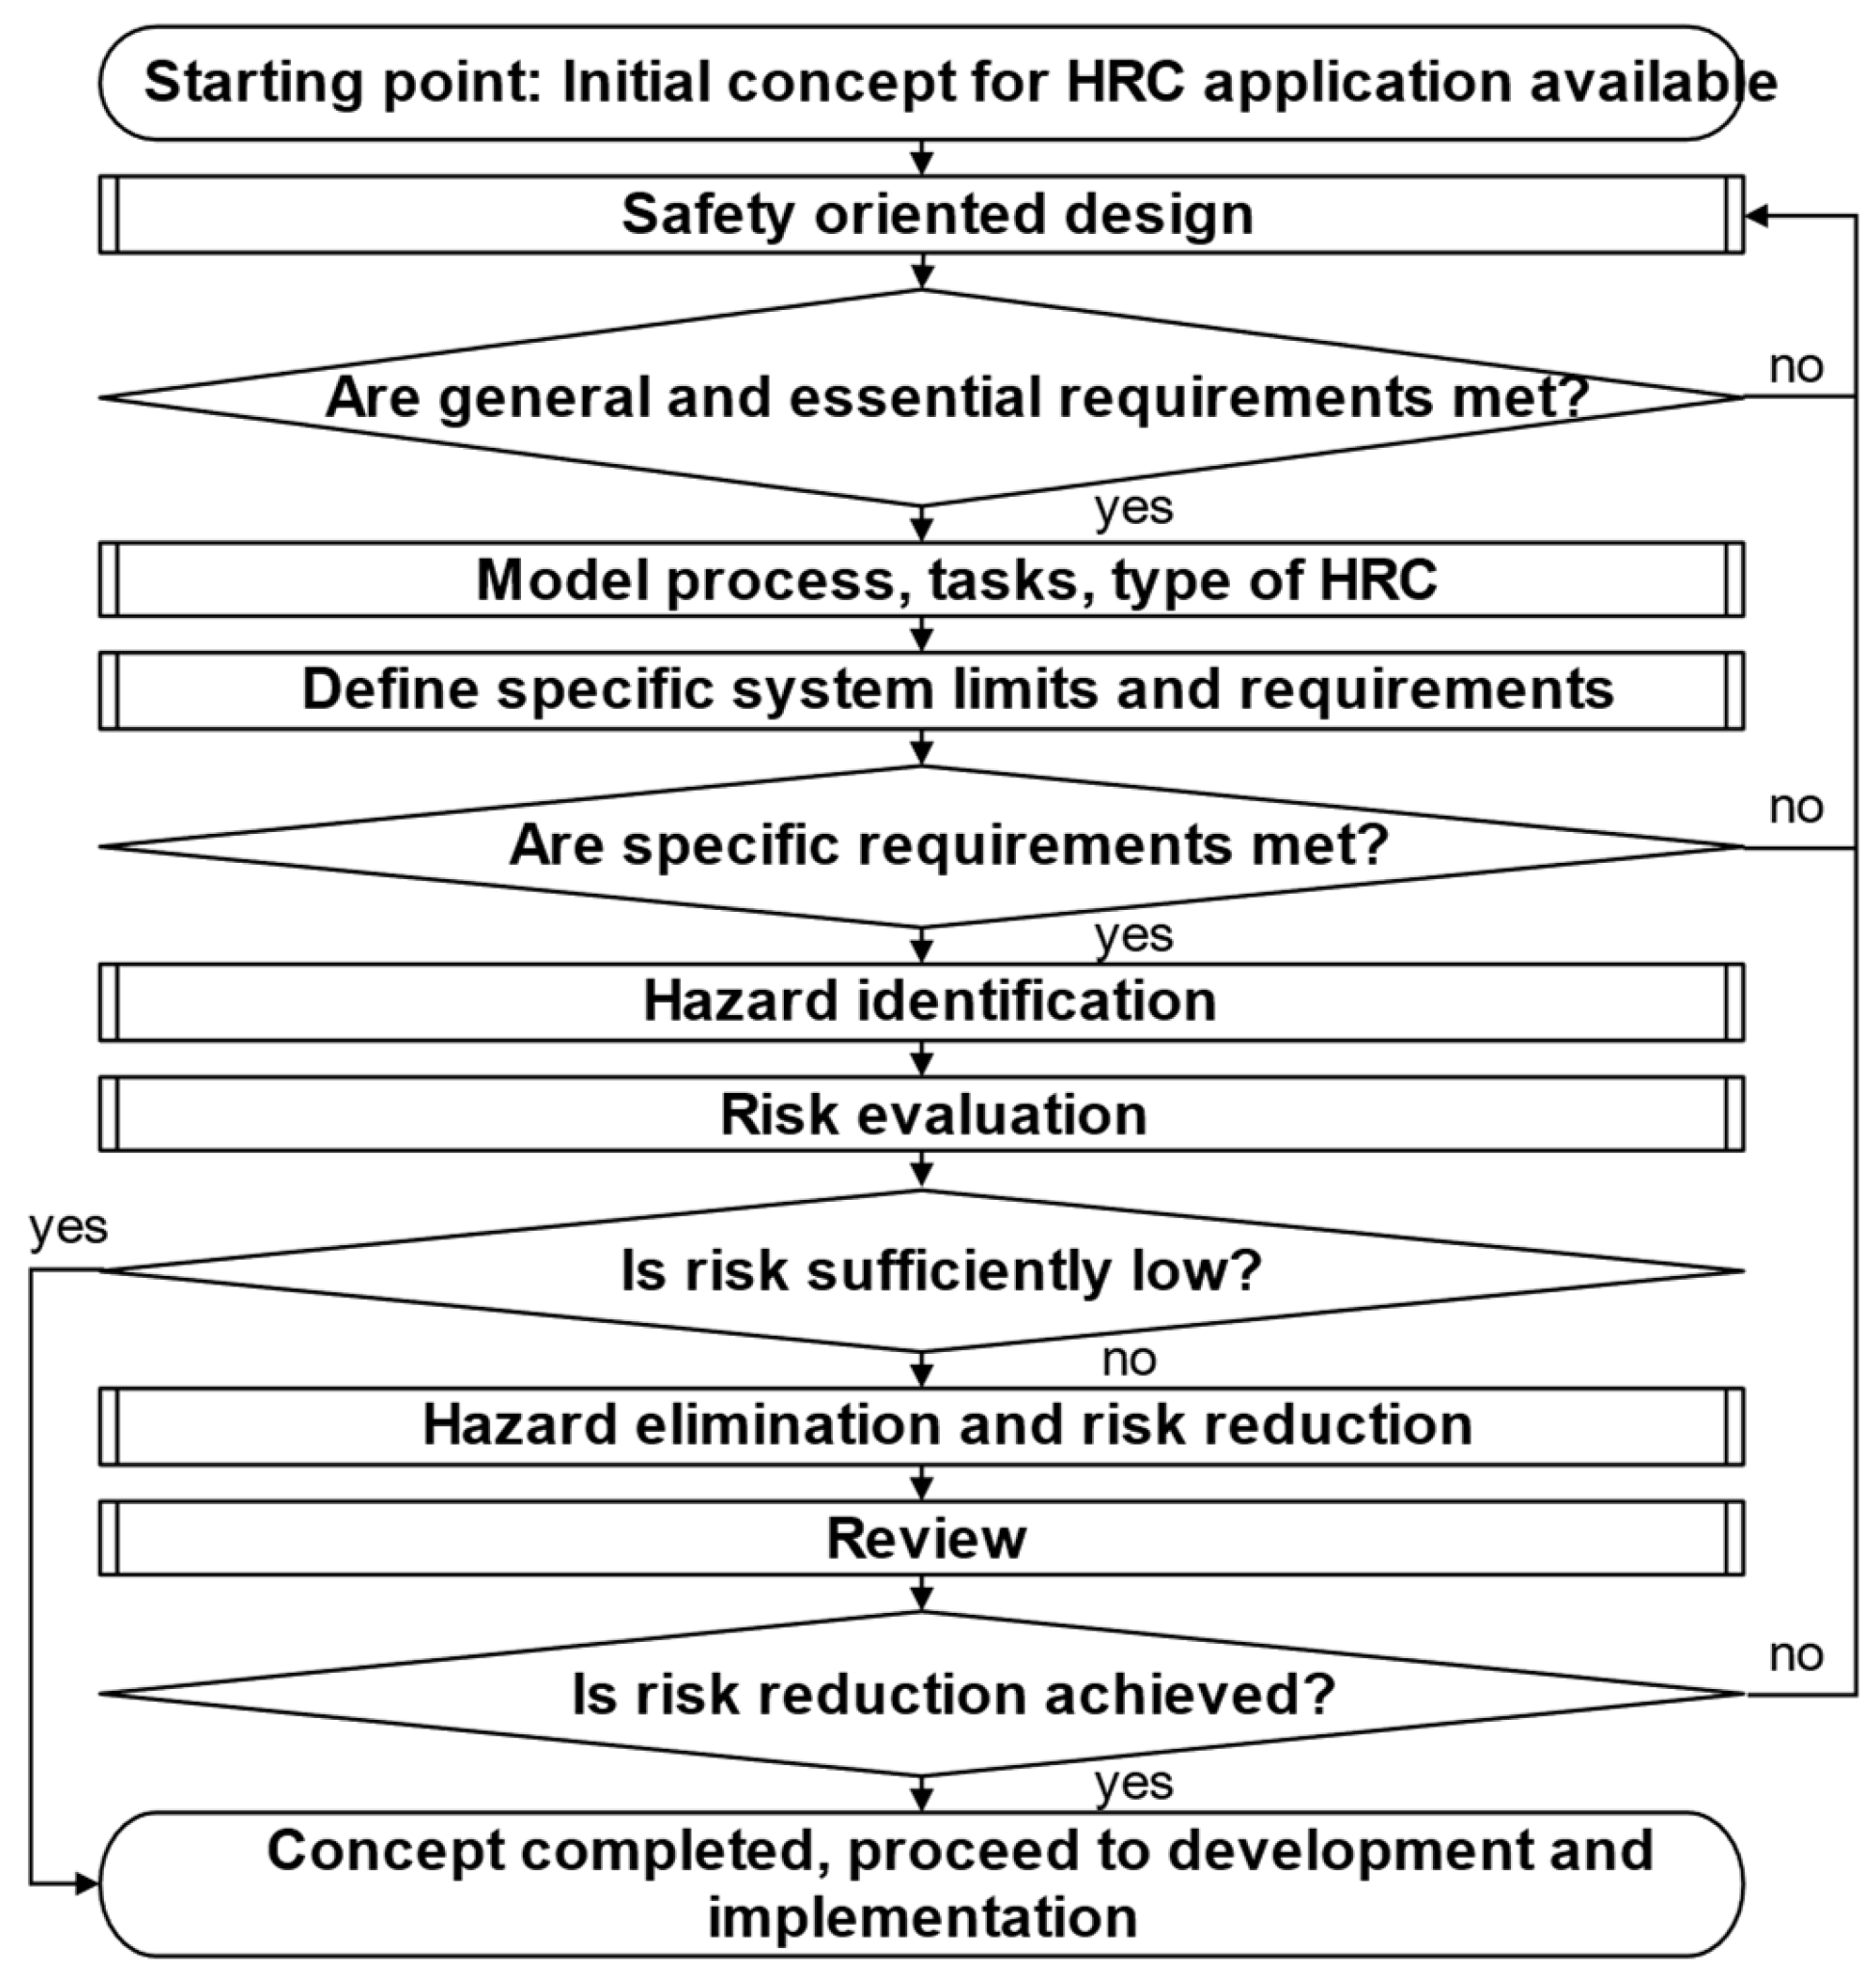
Given the flexible nature of freely programmable robots with their ability to change tooling and manipulated parts, as well as the various types of interactions possible with humans sharing the workspace, a risk analysis is typically required to identify possible hazards, estimate the risks to human health and safety, and identify suitable risk mitigation strategies [19]. This is executed according to the ISO12100:2010 “Safety of machinery–General principles for design–Risk assessment and risk reduction” standard [20]. The risk analysis and the evaluation of the risks (which, in this combination are also known as the risk assessment) are conducted by a safety expert, who receives support from the mechanical and electrical engineers responsible for various aspects of designing the HRC application. In addition to simple methods for documenting a risk assessment, such as in a spreadsheet (such as the one documented in this work), there are several commercially available software systems to support the safety expert in performing a risk assessment (https://www.ibf.at/en/ce-software-safexpert/ (accessed on 5 January 2022)). These software programs focus on documenting hazards, estimated risks, and risk mitigation methods, as illustrated in Figure 2. Newer methods from research [21,22,23,24] focus on automated methods to simplify the overall risk analysis process for collaborative robots. Other studies focus on methods to support non-experts in evaluating the effectiveness of risk mitigation measures [25]. The authors in [26] surveyed safety experts researching this area and identified a need for new software tools that balance ease of use with advanced capabilities for automatic hazard identification and risk assessment. Nevertheless, they expressed the opinion that a risk assessment tool cannot fully replace a human expert, especially with regard to liability and responsibility. While a risk assessment is usually executed when designing and commissioning a new HRC application, it is often overlooked in industry that, according to the machinery directive [27], any significant modification to the HRC application requires an update to the risk assessment. In this context, a substantial modification has been performed when the change leads to new hazards and associated risks that cannot be sufficiently mitigated with existing or simple safeguards [28]. Many HRC applications are delivered to an end-user by a contractor and/or system integrator and, at least in Europe, it is not legally binding to deliver a copy of the original risk assessment as part of the overall documentation to the end-user. Even if documentation of a risk assessment is available, it is often not in an electronic form that can be edited. This makes the task of determining whether a change should be considered a significant modification difficult. To the best of the authors’ knowledge, there are no commercially available risk analysis software tools that directly connect with factory information systems (e.g., MES) to perform the risk assessment and support change management. Therefore, the authors see a clear gap in the state-of-the-art methods and tools that help human experts update and maintain risk assessments of collaborative robotics applications, which are highly flexible and change often. By including human experts in the loop, such a system can be used in industry immediately and without hesitancy, as the responsibility for the decisions remain with a human expert.

2. Proposed Smart Factory Methods and Methodology

This section describes the methodology followed to address the issue of risk analysis in cases of frequent changes in a collaborative application. First, Section 2.1 describes the SHOP4CF architecture. Then, Section 2.2 describes the adopted data modeling approach. Finally, Section 2.3 and Section 2.4 describe the developed components for risk analysis based on the architecture and modeling. The architecture, the data modeling approach, and the manufacturing execution system components are all enabling technologies, without which the risk analysis component would not be able to function. While these systems and technologies are not the main focus of this article or the evaluation, the authors feel that their description is useful for the reader to understand the overall context of the risk analysis component and the peripheral systems involved for proper utilization.

2.1. Overall Architecture and Data Models

To address some of the challenges faced by SMEs, the EU-funded Smart Human Oriented Platform for Connected Factories (SHOP4CF) project was created. SHOP4CF aims to create a unique infrastructure for the convenient deployment of human-centric industrial applications. In the project, a team of twenty partners developed a comprehensive software platform containing a wide range of components that cover a broad spectrum of industrial requirements, especially in the context of flexible and data-rich manufacturing.
SHOP4CF aims to find the right balance between the cost-effective automation of repetitive tasks and the involvement of human workers in areas such as adaptability, creativity, and agility, where they create the greatest added value. Furthermore, the project pursues a highly connected factory model to exploit the benefits of all data generated within a factory. The SHOP4CF approach builds on existing work, including the HORSE (http://horse-project.eu/ (accessed on 4 March 2022)) project and the L4MS (http://www.l4ms.eu/ (accessed on 4 March 2022)) project on smart logistics for manufacturing. Initially, the HORSE consortium designed, developed, deployed, and tested the HORSE framework—a reference architecture for cyber-physical systems that integrate smart technologies and provide manufacturing operations management in hybrid-actors settings [29]. The framework is a modular architecture with clear subsystems and interfaces at several levels of aggregation, resulting from a structured, hierarchical system design based on theoretical principles and guidelines [30]. From a functional high-level perspective, it distinguishes between manufacturing activities taking place in a work cell and activities in a production area or even site (across work cells). This distinction is depicted with two levels, global and local. There is also a clear distinction of phases, one regarding design of manufacturing activities (e.g., modeling and parameterization) and one regarding executions of manufacturing activities (e.g., actual product manufacturing)—i.e., the design and execution phases. Following, the L4MS project was a four-year project with the goal to create a one-stop shop for manufacturing SMEs to help them digitalize intra-factory logistics. This was achieved by Open Platform for Innovations in Logistics (OPIL) [31], an open Internet of Things (IoT) platform with different enablers and the common aim of simplifying the development of customized logistics solutions. The OPIL reference architecture consists of three layers: the IoT nodes layer (L1), which is the layer where software components interact with the physical world using well-established technologies (e.g., robot operating system (ROS)); the cyber-physical middleware layer (L2), which allows interoperability among components of the platform and with external ones; and the software systems layer (L3), which consists of software components developed specifically for the logistics sector.
A similar approach was adopted in SHOP4CF. The platform aspect of the architecture represents the organization, from the functional perspective, of the software and hardware necessary for the software components to be operational. Its top-level logical view is illustrated in Figure 3.
The software layer consists of SHOP4CF components, the middleware, containers (i.e., OS-level virtualization), and third-party information systems (i.e., external to SHOP4CF, such as MES, as discussed in Section 2.4) which may exist on a shop floor. The hardware layer consists of servers. In addition, cyber-physical systems and IoT devices of a shop floor may belong to both layers. Regarding the middleware, the chosen platform is FIWARE, as in the L4MS project, due to its open-source capabilities and wide support from other European projects (https://www.fiware.org/about-us/impact-stories/ (accessed on 14 January 2022)). FIWARE focuses on management of context information—i.e., the current state of the surrounding real world, understood as the state of relevant physical and virtual objects (for instance, a virtual object may be a manufacturing task to be executed). The use of context information helps in developing and representing information used in a smart factory use-case. SHOP4CF components exchange information via the FIWARE middleware whenever possible. Only connections that have real-time constraints are organized directly between two involved components (or between a component and IoT), as the FIWARE middleware does not guarantee response times for real-time systems [33].
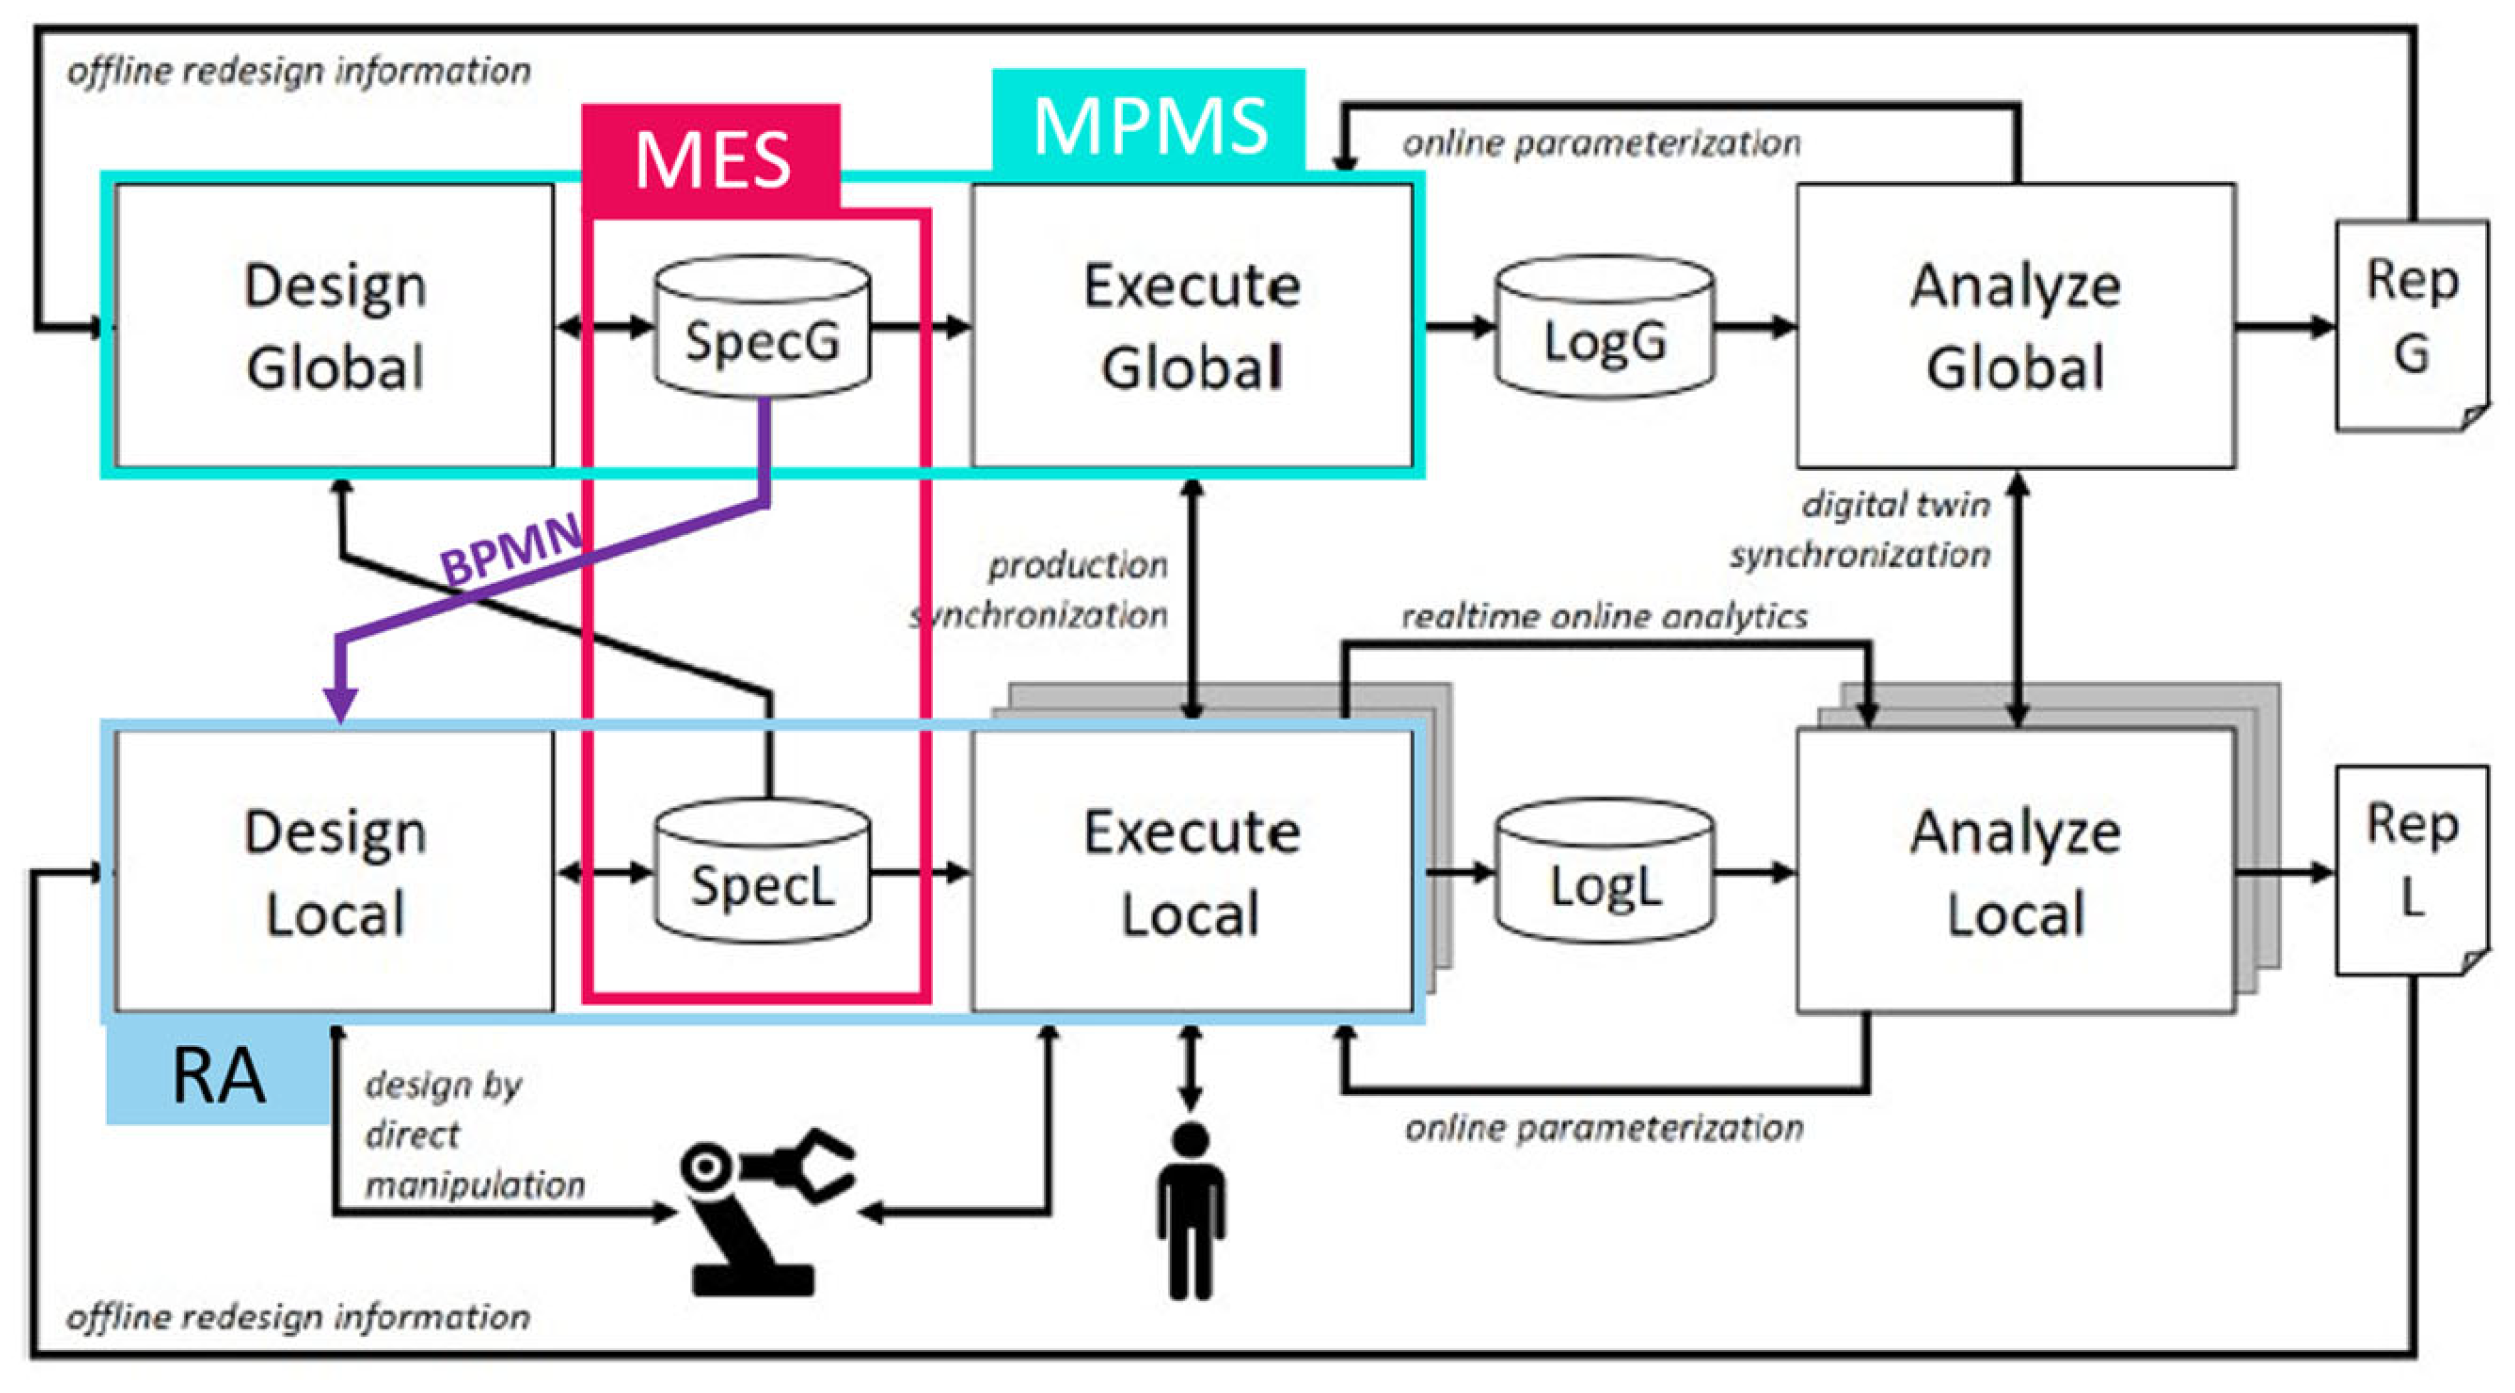
To address the focus on data-rich manufacturing environments, the SHOP4CF architecture explicitly adds analytics functionality, in addition to the design and execution functionalities of the previous frameworks, to the SHOP4CF platform. Thus, it consists of six main modules, for which interaction through interfaces are shown on the high-level logical software architecture in Figure 4.
Each of the components built within the project realizes a (sub)set of six main modules. Manufacturing scenarios that require specific functionalities are then addressed by an integrated set of components, for which interoperability is secured by the well-defined interfaces of the architecture and the data models. Considering the use-case in this work, the SHOP4CF architecture can be used as follows: a manufacturing process management component (MPMS) [34] covers the design global through process modeling and the execute global through automated process enactment; MES forwards the order information of a modeled process and conveys the information stored in the local and global datastores (DB), which are labeled as SpecG and SpecL in Figure 4. Finally, a risk analysis tool covers the design local by providing safety requirements for the processes that have to be executed. These requirements are incorporated into the process modeling, so that the subsequent actual execution of the activities is safe. This scenario is elaborated in the next sections once details of the components have been presented.
With respect to data modeling, the focus is on the interoperability among components (i.e., the information exchanged between components) and not on the way that a specific component translates and uses that information internally. By following the well-established formal approach from [35], data requirements are translated to concept data models, consisting of definitions of data entities, their attributes, and the relationships between entities. Then, by applying technical constraints (i.e., concrete technical data format) and considering both existing FIWARE data models and the ISA-95 standard [36] specific SHOP4CF, data models are defined (https://shop4cf.github.io/data-models/ (accessed on 14 January 2022)). Within these data models, of utmost importance in this use-case, are the entities known as process definition and process. The process definition, also similar to the process segment of the ISA-95, is a definition describing the necessary steps to achieve a certain goal related to an order (e.g., assemble a door). The process, also similar to the operations segment or operations definition, is a definition describing the steps that should be performed to achieve a certain goal considering specific parameters (e.g., assemble a black door with black windows) and involved resources. These data models can be used to refer to a process and its parametrization. For example, if a process involves a collaborative robot, safety should be proven considering the parametrized process (i.e., type of robot).

2.2. BPMN Modeling

Product variety, stemming from customization and personalization trends, imposes variety on production equipment and processes [37]. Moreover, the introduction of novel technologies and the increased collaboration between humans and robots result in more complex manufacturing and assembly operations. Flexible modeling is thus imperative for tackling production complexity. The process models should allow for clear definitions of tasks, their detailed sequence with interdependencies, visual expressiveness, optimized allocation of resources, and automated enactment. In manufacturing, various modeling notations have been used, such as value stream mapping (VSM) [38], integration definition (IDEF) [39], and unified modeling language (UML) [40]. In recent efforts, the widely adopted business process model and notation (BPMN) [41] has seen increasing interest for modeling manufacturing processes. While IDEF, VSM, and UML satisfy most of the requirements mentioned above, BPMN also shows an important advantage with its execution semantics [42]. Moreover, BPMN can be used as a common language for integration of business and manufacturing processes [43,44].
BPMN is the de facto standard for business process modeling; however, it requires extensions to support manufacturing processes in which physical entities are included (in comparison to business processes where information processing is dominant). A few extensions have already been proposed with the focus on including physical objects and activities in the models [45], or on modeling IoT-aware processes [46,47,48].
With respect to modeling of HRC applications (e.g., product assembly), BPMN is still a promising candidate. Schönberger et al. [49] used BPMN in a new approach called human—robot time and motion (HRTM) for modeling collaborative tasks. HRTM combines the methods time measurement (MTM) approach, which is used for modeling the working steps of human workers, and the robot time and motion (RTM) approach, which is used for modeling the working steps of robots. Froschauer et al. [50] extended HRTM by combining it with ADAPT [51], a universal modeling approach that allows a shift of programming complexity from the end-user to a modeling expert. However, the modeled BPMN workflows do not include an automatic trigger for robots to perform the corresponding command at the right time. Moreover, in a recent work [52], a digital worker assistance system based on BPMN was presented. The notation was used to enable non-professionals to create adaptive task-sharing processes between human workers and cobots.
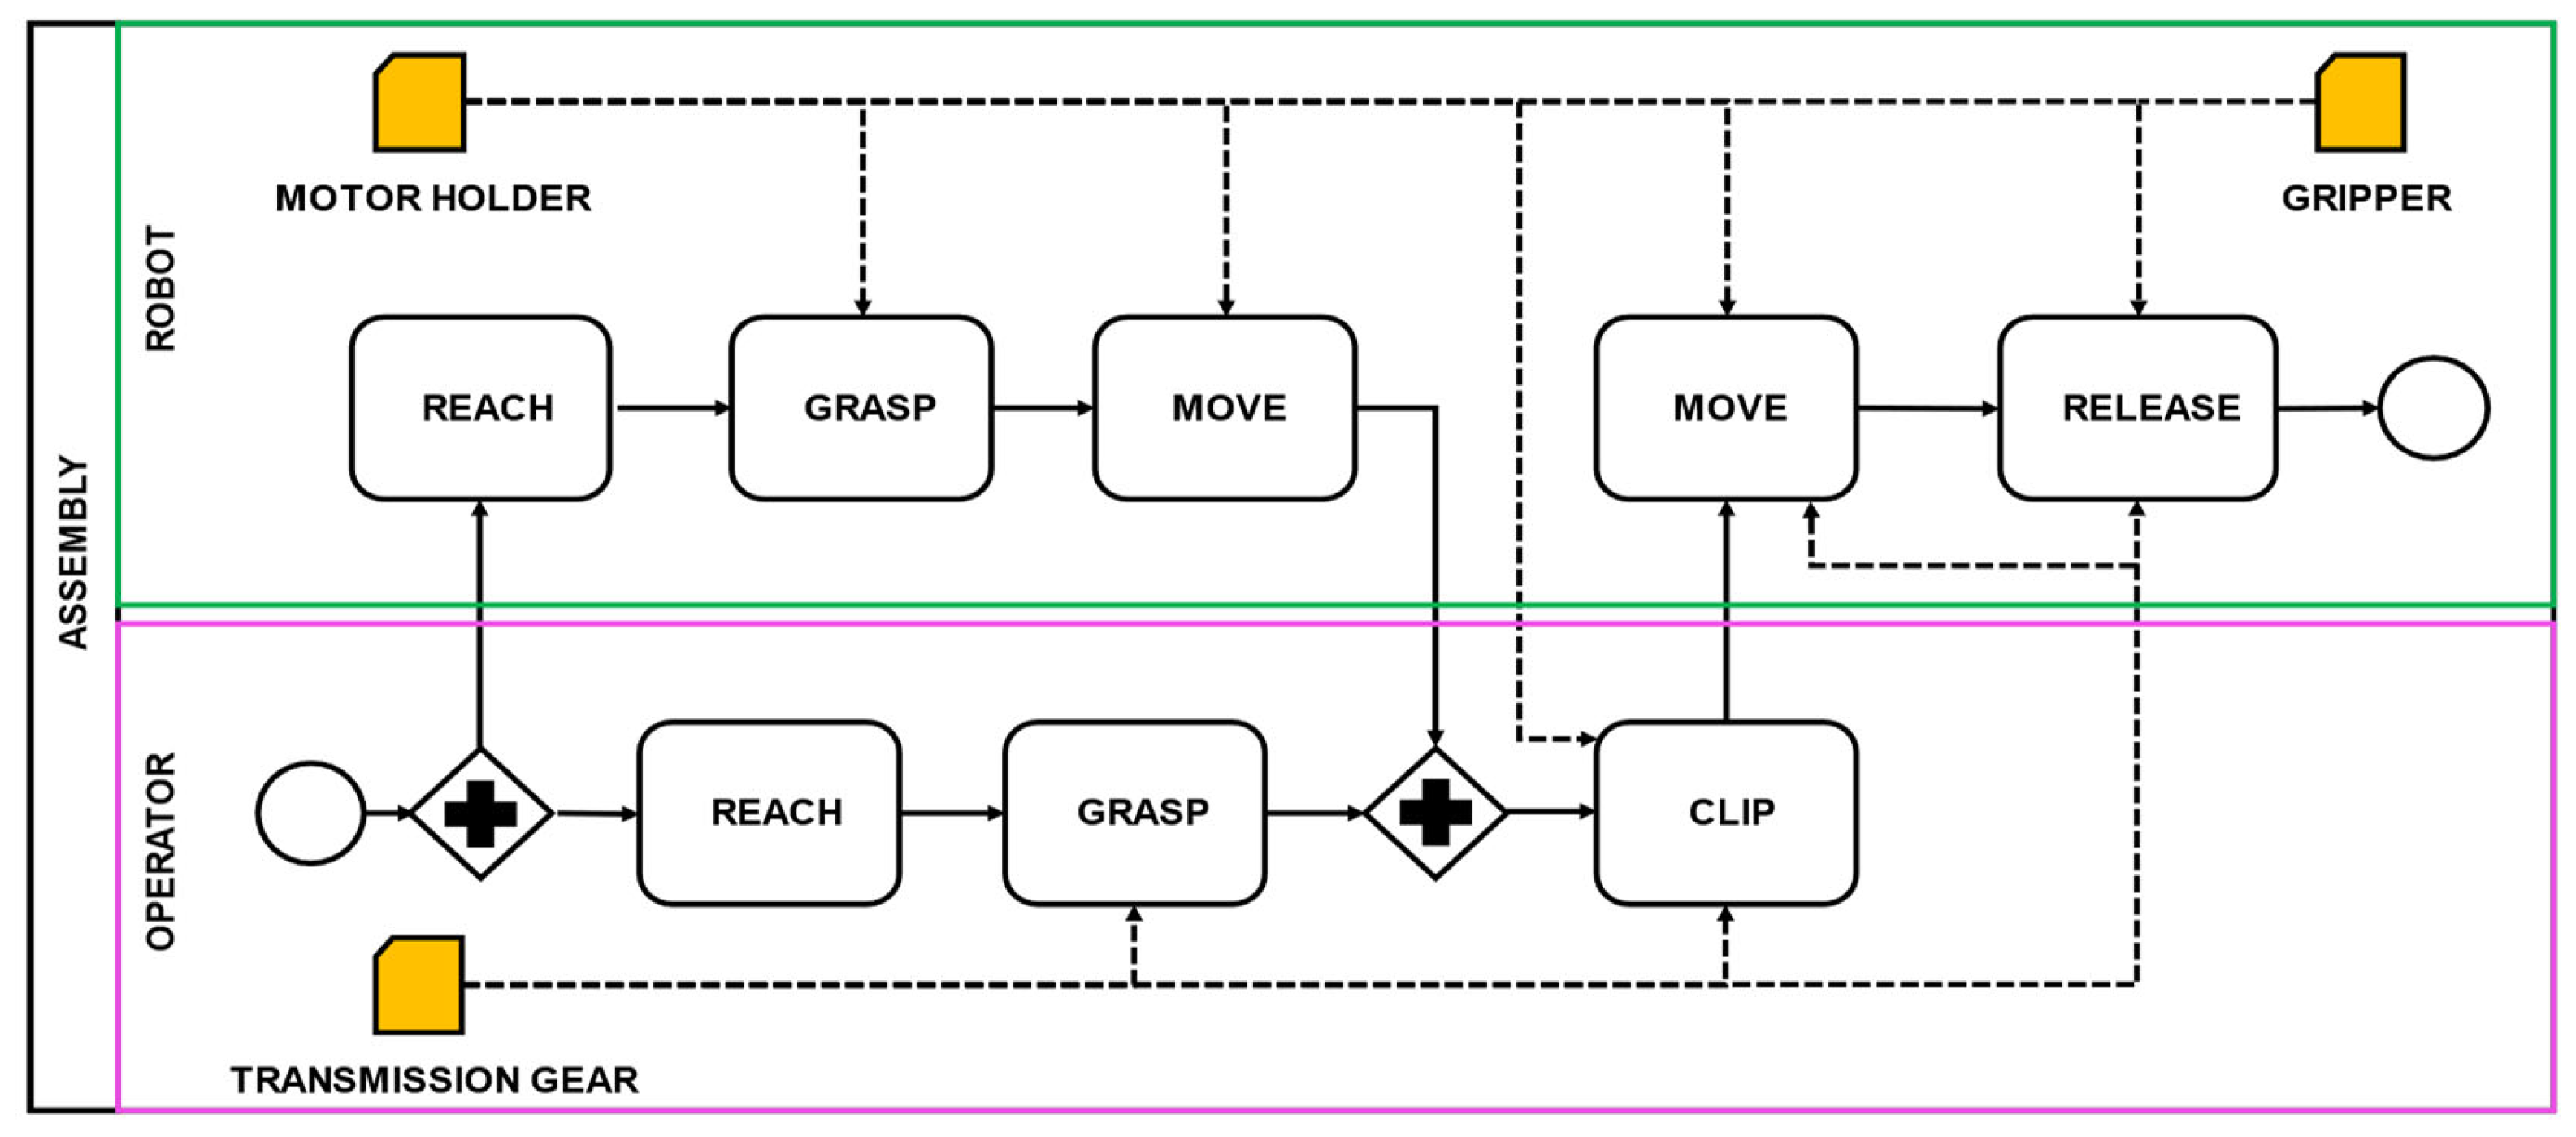
Considering the advantages that BPMN can bring, and a collaborative use-case, a similar approach to [50] was employed in this work and in the SHOP4CF consortium. However, some additions were added. Froschauer et al. [50] proposed to model a collaborative task by using two pools (one for the robot and one for the operator), modeling the interaction by using time delays whenever one actor had to wait for a task to finish. Our approach considered having just one pool to represent the entire process, using lanes to identify the actors (i.e., robot and operator). The single pool eases the execution of the process model with respect to messages exchanged between actors. In [50], the two separate pools added extra communication messages. Moreover, in their approach, it was not clear how a “communicate” task was linked to a gateway element (on their model of Figure 1). Secondly, in our approach, the use of time delays, which require an actor to wait until the other actor finishes some tasks, was removed, as this requires intelligence and the precise knowledge of the exact task duration values. Such calculations might be difficult or even pointless to perform. Instead, the AND-split and merge points for separating work between actors were chosen. These two changes ended up providing the BPMN model shown in Figure 5. The added modifications enabled a clear definition of the resources involved in process (i.e., pool) and a description of the type of collaboration involved (i.e., parallel, or sequential tasks).

2.3. Manufacturing Execution System Component

To meet the requirements of HMLV production, an MES needs to provide integration functions that enable it to adapt the production quickly and improve the production output. In this case, an MES for dealing with production changes in the context of a collaborative application was created. The MES had to integrate its capabilities to receive a process definition in the form of a BPMN file, process the BPMN file to extract the necessary resources involved in the process, query the available resources, and insert a production order as a process once the available resources had been mapped to the process. Hence, through these steps, the MES acts as a system and parametrizes the received BPMN to make it executable.
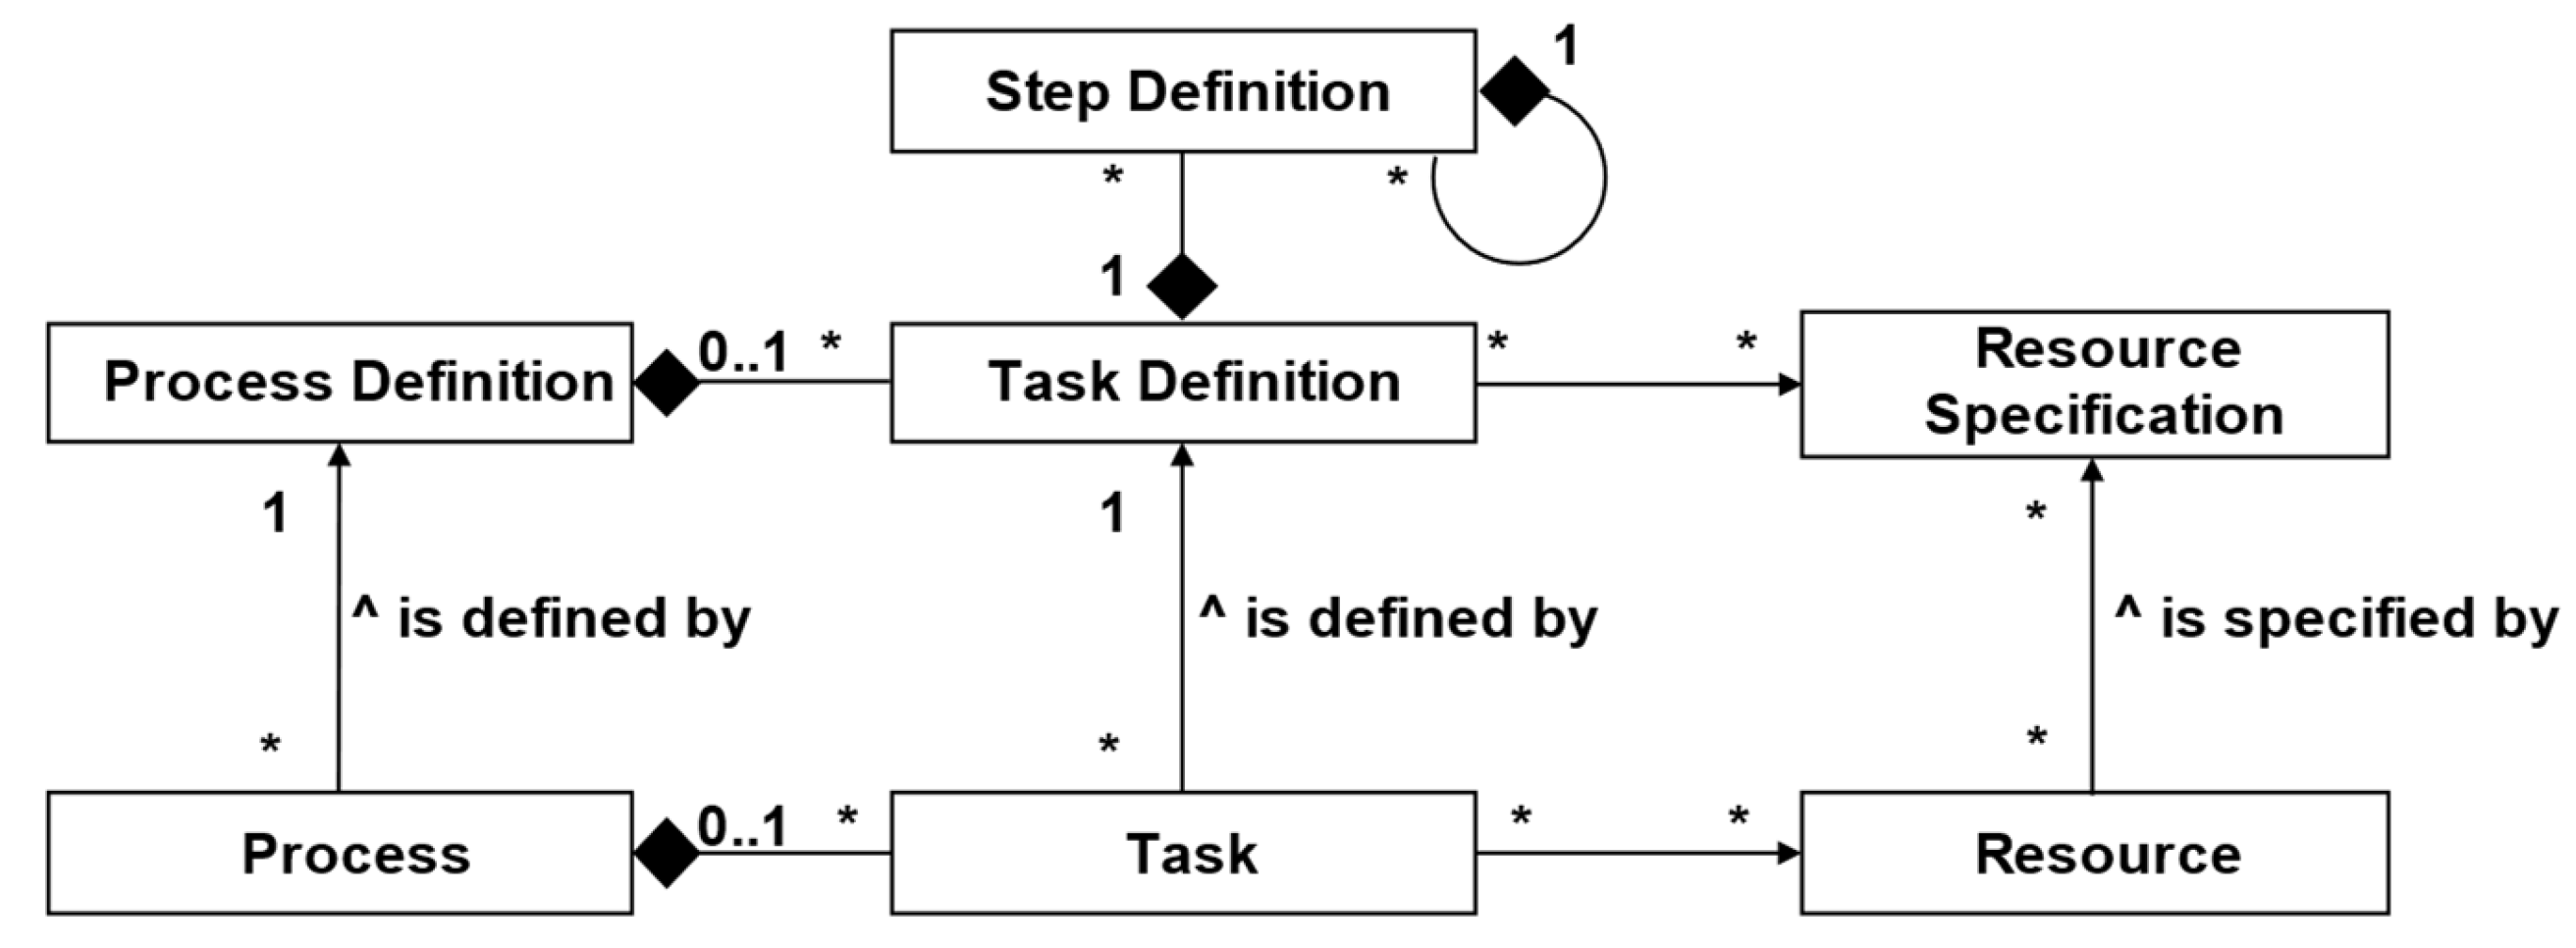
To satisfy these requirements, the internal architecture of the MES is based on a database, following the specifications of the top-level logical data architecture within SHOP4CF [32]. This top-level logical data architecture is visualized in Figure 6.
Using this architecture, the MES parses a BPMN file and create database entities, which reflect the BPMN content. This is achieved by creating entities in the MES database that are mapped to the BPMN artifacts. For sake of clarity, an example based on the BPMN process (as shown in Figure 5) is given here. Starting from the top level, initially, the assembly pool was mapped to the MES as a process definition, considering that it represents an entire process. Secondly, the different activities both for the robot and the operator were mapped to several entities of the task definition, representing all the activities that the process definition contains. To highlight this relationship, each task definition was assigned to a process definition in the MES database. Finally, the different resources (operator, robot, gripper, transmission gear, and motor holder) were mapped into the MES database with the resource specification entity. Due to the connection of the activities to the different resources, this cardinality was maintained by linking the resource specification entities with the task definition entities. Through this mapping, it was possible to represent the BPMN content in a structured format.
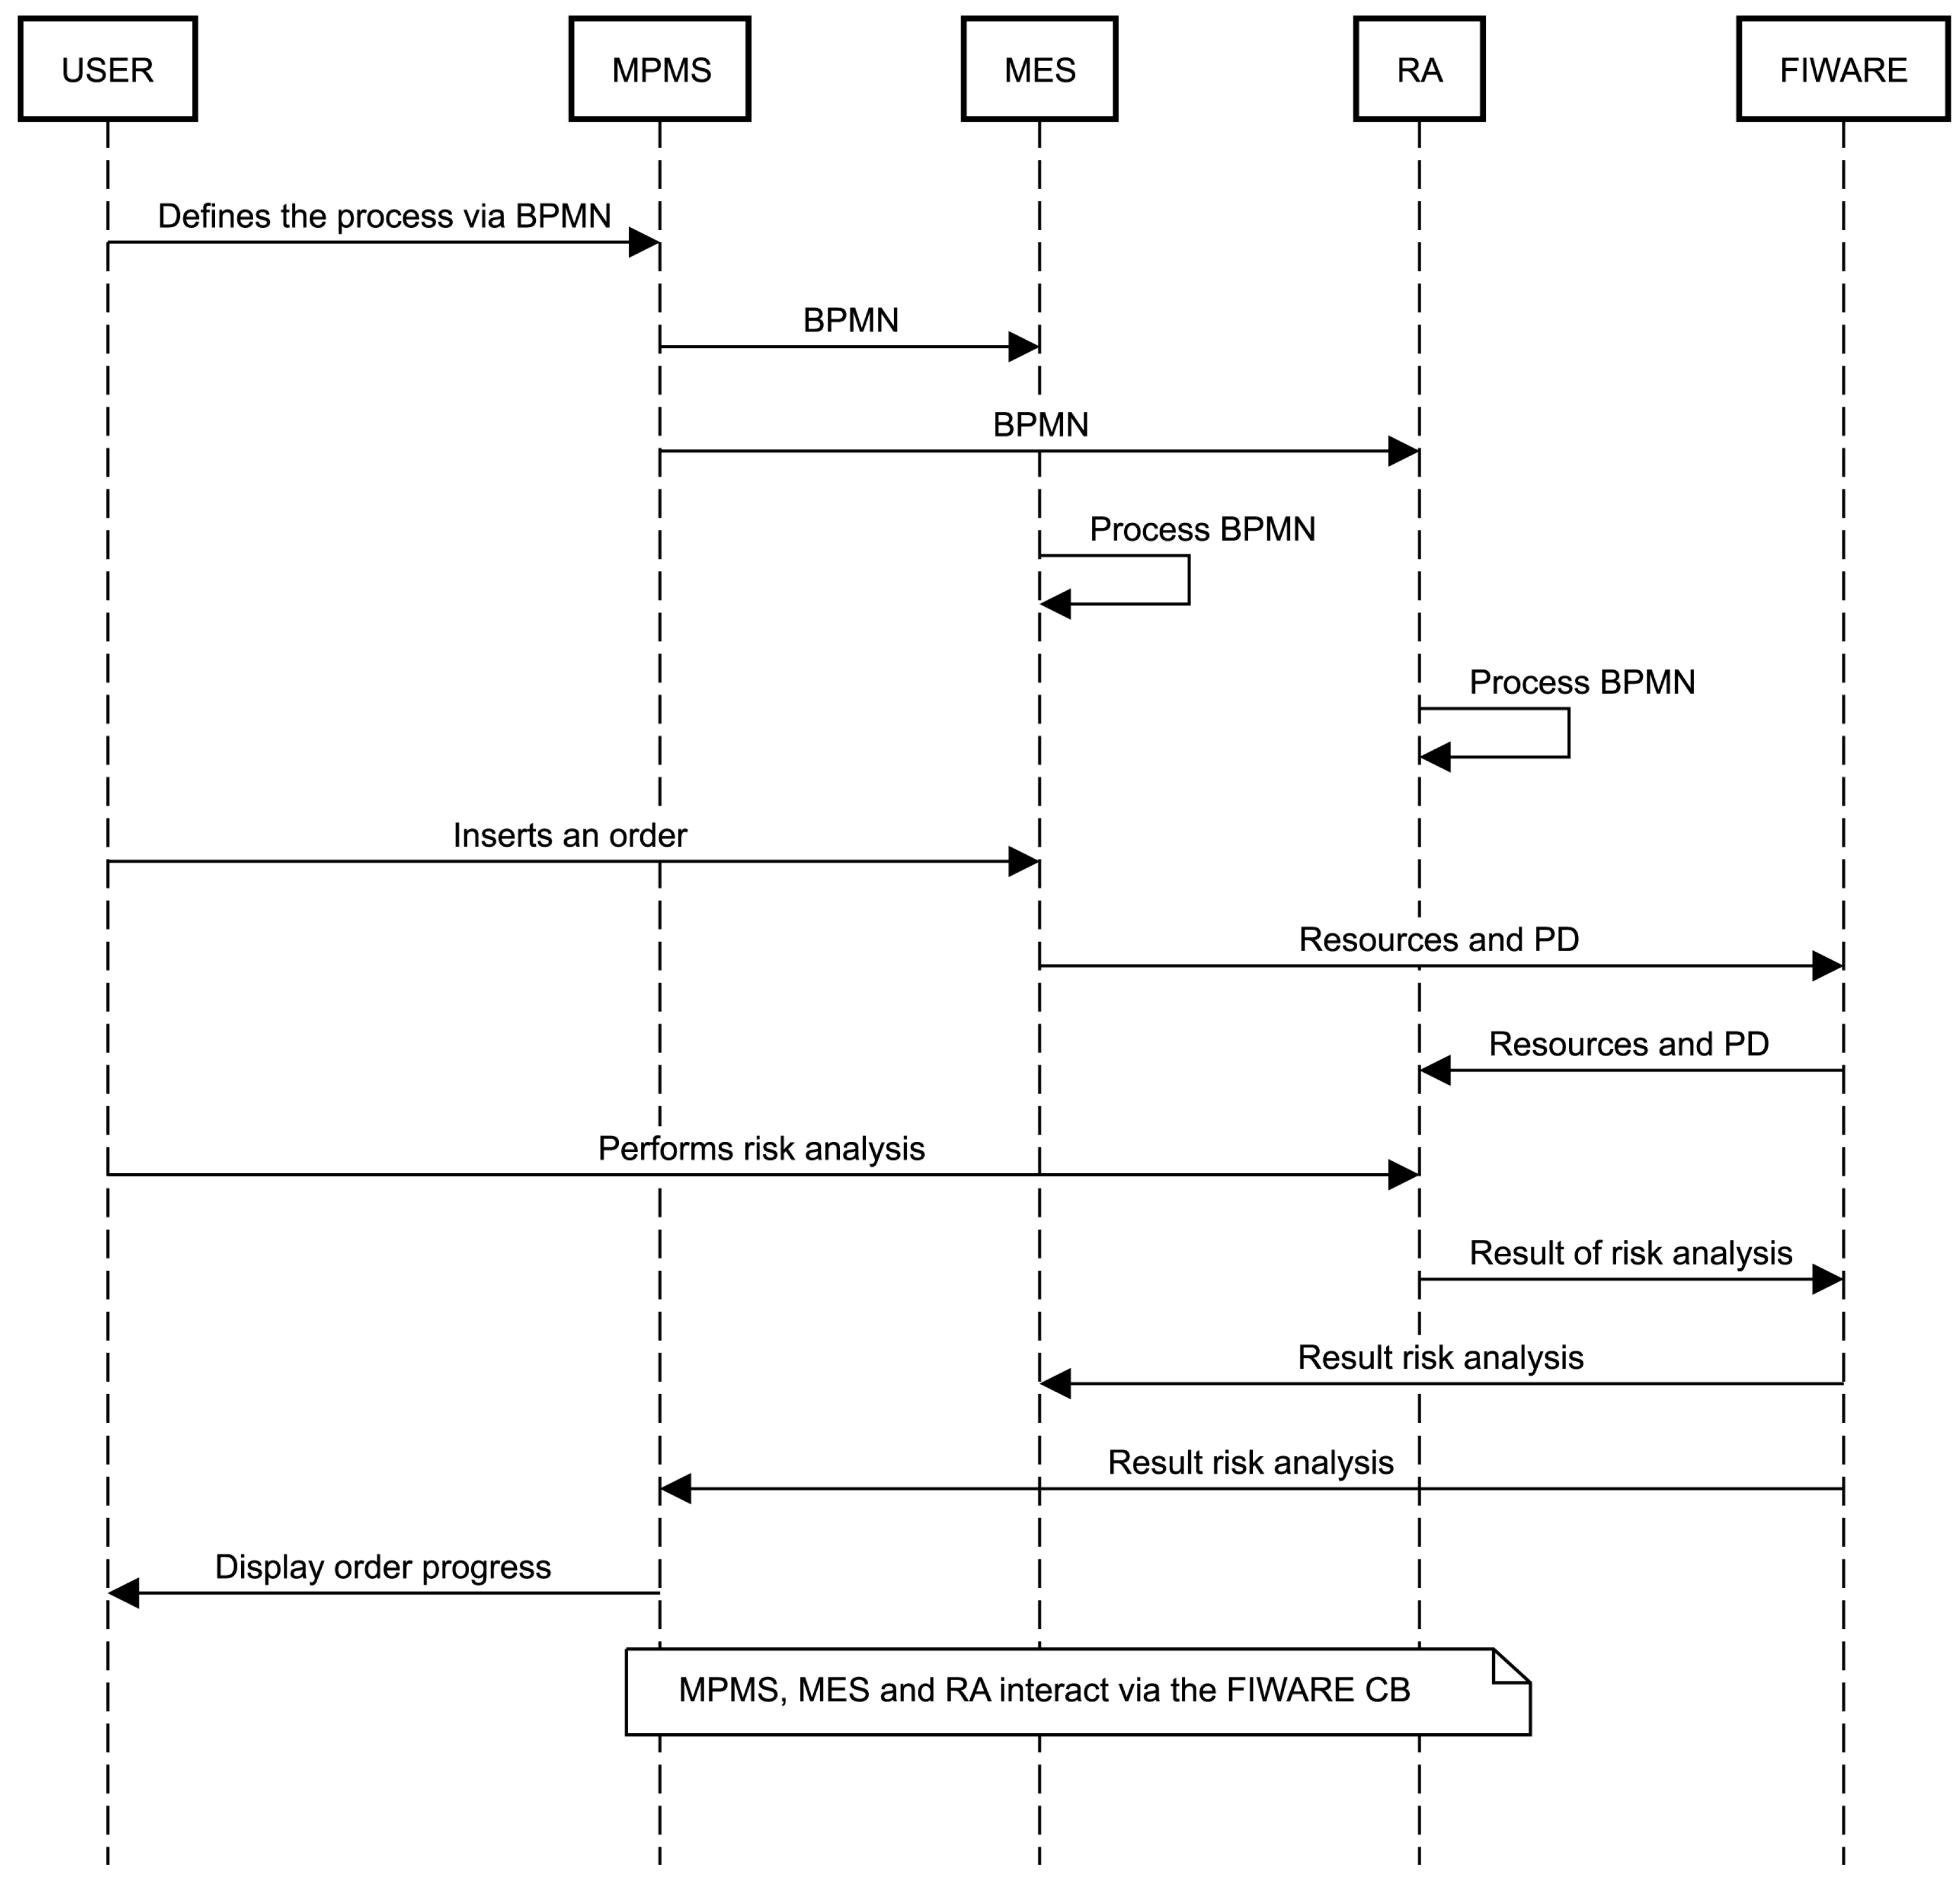
After parsing the information, the MES then leaves to a user the possibility of initiating a production order based on a process definition. To do so, the MES must first collect the available resources by querying all the entities marked as “available” in the database, and then display the ones matching the types defined in the resource specifications. Through this procedure, the user could then specify which resources to assign for the order according to capabilities (e.g., John operator, UR 10 robot, Zimmer two-finger jaw gripper) and then finally send the order for clearance through the risk analysis component. This is possible through the interaction of the MES and the RA via the FIWARE context broker, as shown by the sequence diagram in Figure 7.

2.4. Risk Analysis Component

The risk analysis component is used when designing and/or adapting an HRC application. The component supports a safety engineer during the hazard identification, risk evaluation, hazard elimination, and risk reduction, as illustrated in Figure 2. It does not automate the process of estimating risks or identifying hazards. Instead, it highlights which changes to an existing system have resulted in changes to the risk profile and need to be reviewed and enforces formal risk analysis and change management processes. The component allows the user to both import the process structure and insert additional data. The user is then guided through the process of estimating the risk and documenting hazards and risk reduction measures. When performing an update, changes that require the user’s attention are automatically detected by making comparisons against the previous configuration. The change detection is based on comparing identifiers and searching for matches between the previous version and the updated one to find added, modified, and deleted elements. The component was designed to allow both manual data entry and to import data from a variety of sources, such as a digital twin, or from a factory MES. The focus of the risk analysis is on mechanical, HRC-related hazards (e.g., crushing, impact) listed in Annex A of ISO 10218-2 [53]. These can be chosen from a pull-down list.
A novel feature of the risk analysis component is that the data are structured by task—e.g., a partial process, action, or operation performed by some actor in the assessed system, such that every hazard is always associated with a task. With this approach, the tasks are connected to resources (which correspond to a physical entity such as robotic equipment, a part of the environment, or a person) and actions (operations that are performed by one or more resources). A basic assumption of this model is that some action (e.g., motion of some dynamic parts—automated or mechanical equipment of the system, interaction with their environment as part of normal or abnormal operation, putting people or materials on site) is always required in order to introduce risks into a state which would otherwise be safe (e.g., when the equipment is standing still, the factory is empty, and no one is around). It is easy to imagine a counterexample case in which the mere presence of the equipment or materials might constitute a hazard (consider for instance the storage of explosives or corrosive chemicals). Such cases would not fit into the model used by the application; however, one could still consider defining “storing dangerous chemical 1” as a task that covers this specific case. This “task-based modeling” of an application fits well with a robot-centric view of an application. Risks that exist due to a robotic application are heavily dependent on specific information, such as the robot’s speed during a defined movement. As such, the proposed level of granularity is considered sufficient for understanding what the robot is doing and allows the safety expert to identify associated hazards and risks. Although the component is also able to document the evaluation of the individual risks (risk assessment) by the safety expert, the main focus of the innovation is on the methods for asset and task definition, as well as hazard identification during the risk analysis phase.
In the SHOP4CF architecture, the risk analysis component is a web server running inside of a container, which has its own database, a communication channel to FIWARE context broker, and a modern, single-page application user interface. The component supports multiple users with varying access levels. In the normal workflow, a safety expert would import a BPMN model to create the process structure (tasks and their resources), then identify common hazards and perform the initial risk assessment.
A risk analysis project is bound to, and continuously monitors, a specific FIWARE process entity during manufacturing. When the process is triggered, the risk analysis component looks up the current dynamic resources assigned to tasks, determined through search queries for FIWARE resource entities recorded by third-party applications, and then creates a configuration in which the changes are automatically detected. Then, it triggers a notification, prompting a review of the changes and an update of the risk assessment. Once that is completed, the component sends the risk assessment result back to the third-party system via the context broker.
The history of changes to the process structure and configuration can be reviewed, providing transparency and traceability for safety-relevant changes. The project data can be exported or imported in JSON format, providing open data portability or integration with additional tools.

3. Smart Factory Use-Case

The methodology described above can be applied in different applications. To enable an evaluation of the described risk assessment tool through multiple users, a use-case from the SHOP4CF project was considered. This section describes how the previously explained method can be integrated in a smart factory use-case. Initially, the description of the risk analysis component usage is given in Section 3.1. Then, the use-case and the considered collaborative cell are described in Section 3.2. Finally, ways in which the risk analysis can be used in the use-case, and how it compares with an existing tool, is presented in Section 3.3.

3.1. Workflow for using the Risk Analysis Component

To understand how the proposed methods could be used for the execution of risk analysis based on a BPMN model and resource specific information coming from the MES, the workflow from the user perspective is reported here. The workflow starts with the user inserting the high-level description of a process via the MPMS interface. Second, the BPMN is shared with the MES and the RA to obtain the process definition. Third, the user inserts an order into the MES and specifies which resources have to be used. Fourth, the RA receives the process definition and the resources, and the user performs the risk analysis using the obtained information. Finally, the result is sent to the MES and MPMS, which can then trigger the execution. The sequence of the steps is shown in Figure 7.

3.2. Hardware Set-Up

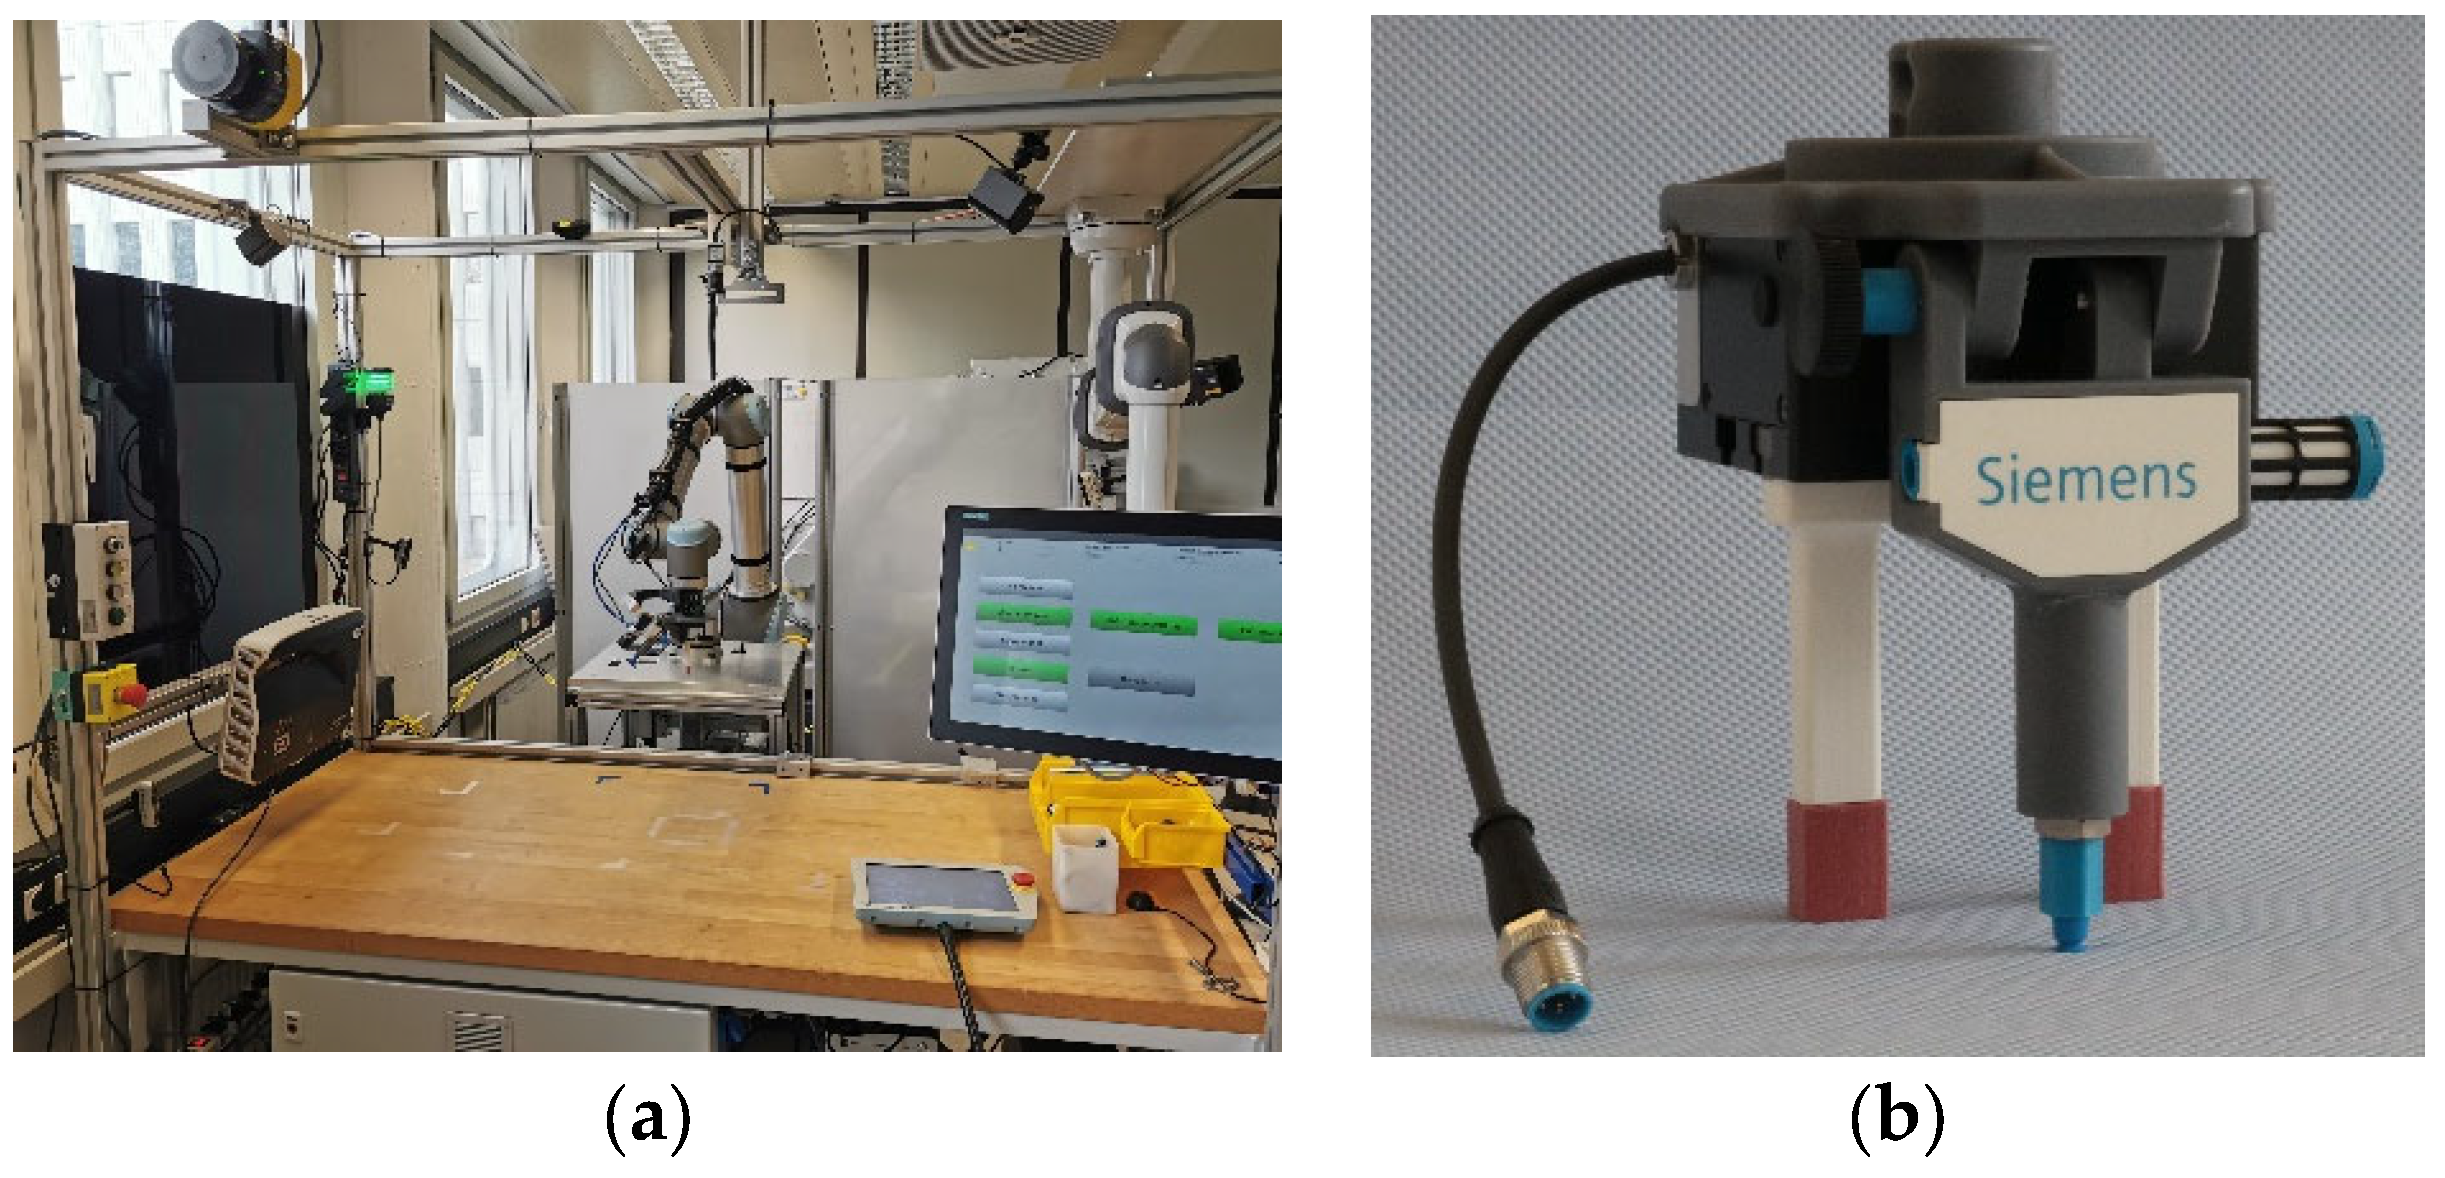
For performing the user evaluation of the proposed risk analysis component, as described in the upcoming Section 4, a collaborative robotic cell and its components needed to be considered. Most importantly, the robot, the EE, and the safety laser scanner have to be considered to ensure safe collaboration. The selected robot is a UR10 collaborative robot from Universal Robots® (UR) with ISO 10218-1 [54] certification for the integration of a power and force limiting (PFL) risk mitigation measure. The selected EE is a self-built device composed of two-finger jaw module and a vacuum module disposed at 45° with respect to the approaching direction. Finally, the selected laser scanner was the microScan3 from Sick® to allow for the integration of a speed and separation monitoring (SSM) risk mitigation measure. The work cell and the EE can be seen in Figure 8. To ensure a correct configuration of SSM and PFL, collision testing was performed. The collision testing followed the GRI-LIE-1 protocol from the COVR toolkit [55], considering pressure limits in ISO/TS 15066 [56]. Therefore, a safe operation speed of 50 mm/s was obtained to ensure maximum exerted pressures. Then, the robot was programmed to adopt the defined speed and monitor for applied pressures whenever the operator entered the workspace. A detailed description of this procedure is reported by the authors in [57].

3.3. Using Risk Analysis Component for Smart Factory Use-Case

To showcase the risk analysis component in the context of the collaborative cell, the collaborative assembly of a gearbox for medical machines is considered. The use-case consists of several steps that need to be completed by the operator, by the robot, or by both. An excerpt of the use-case description using BPMN can be seen in Figure 5; for a description of the full model please refer to the Supplementary Material (File S1). This use-case was selected due to the peculiarity of its process, where changes are often introduced to cope with manufacturing resource availabilities and small batch production.
To illustrate the usage of the risk analysis component in the use-case, the methods and software previously used at the manufacturing site are described. The method for documenting the risk analysis is to use an Excel spreadsheet with special functions designed in Visual Basic for Applications (VBA) (referred later as “legacy tool”). The spreadsheet is composed of multiple worksheets to define the involved resources (e.g., robot type, safety devices, material), describe the work performed, and to document possible hazards in the application. In case a user wants to perform a risk analysis, a table of the necessary resources must be created. This includes, but it is not limited to, robot type, materials for the process, and end-effector. Secondly, the work steps need to be inserted and matched with the different resources. Finally, the user assesses risk levels based on frequency of exposure, probability of occurrence, and degree of severity, according to [58]. For sake of clarity, an excerpt of the legacy tool can be found in the support material (File S2). Considering the use of the legacy tool for a process revision related to a change of resources, the user needs to go through the following tasks. Initially, the user inserts new resources into the appropriate worksheet. Then, the work steps where the resources are involved need to be checked one by one and the risks need to be re-evaluated. Finally, risk mitigations are checked against the new risk levels.
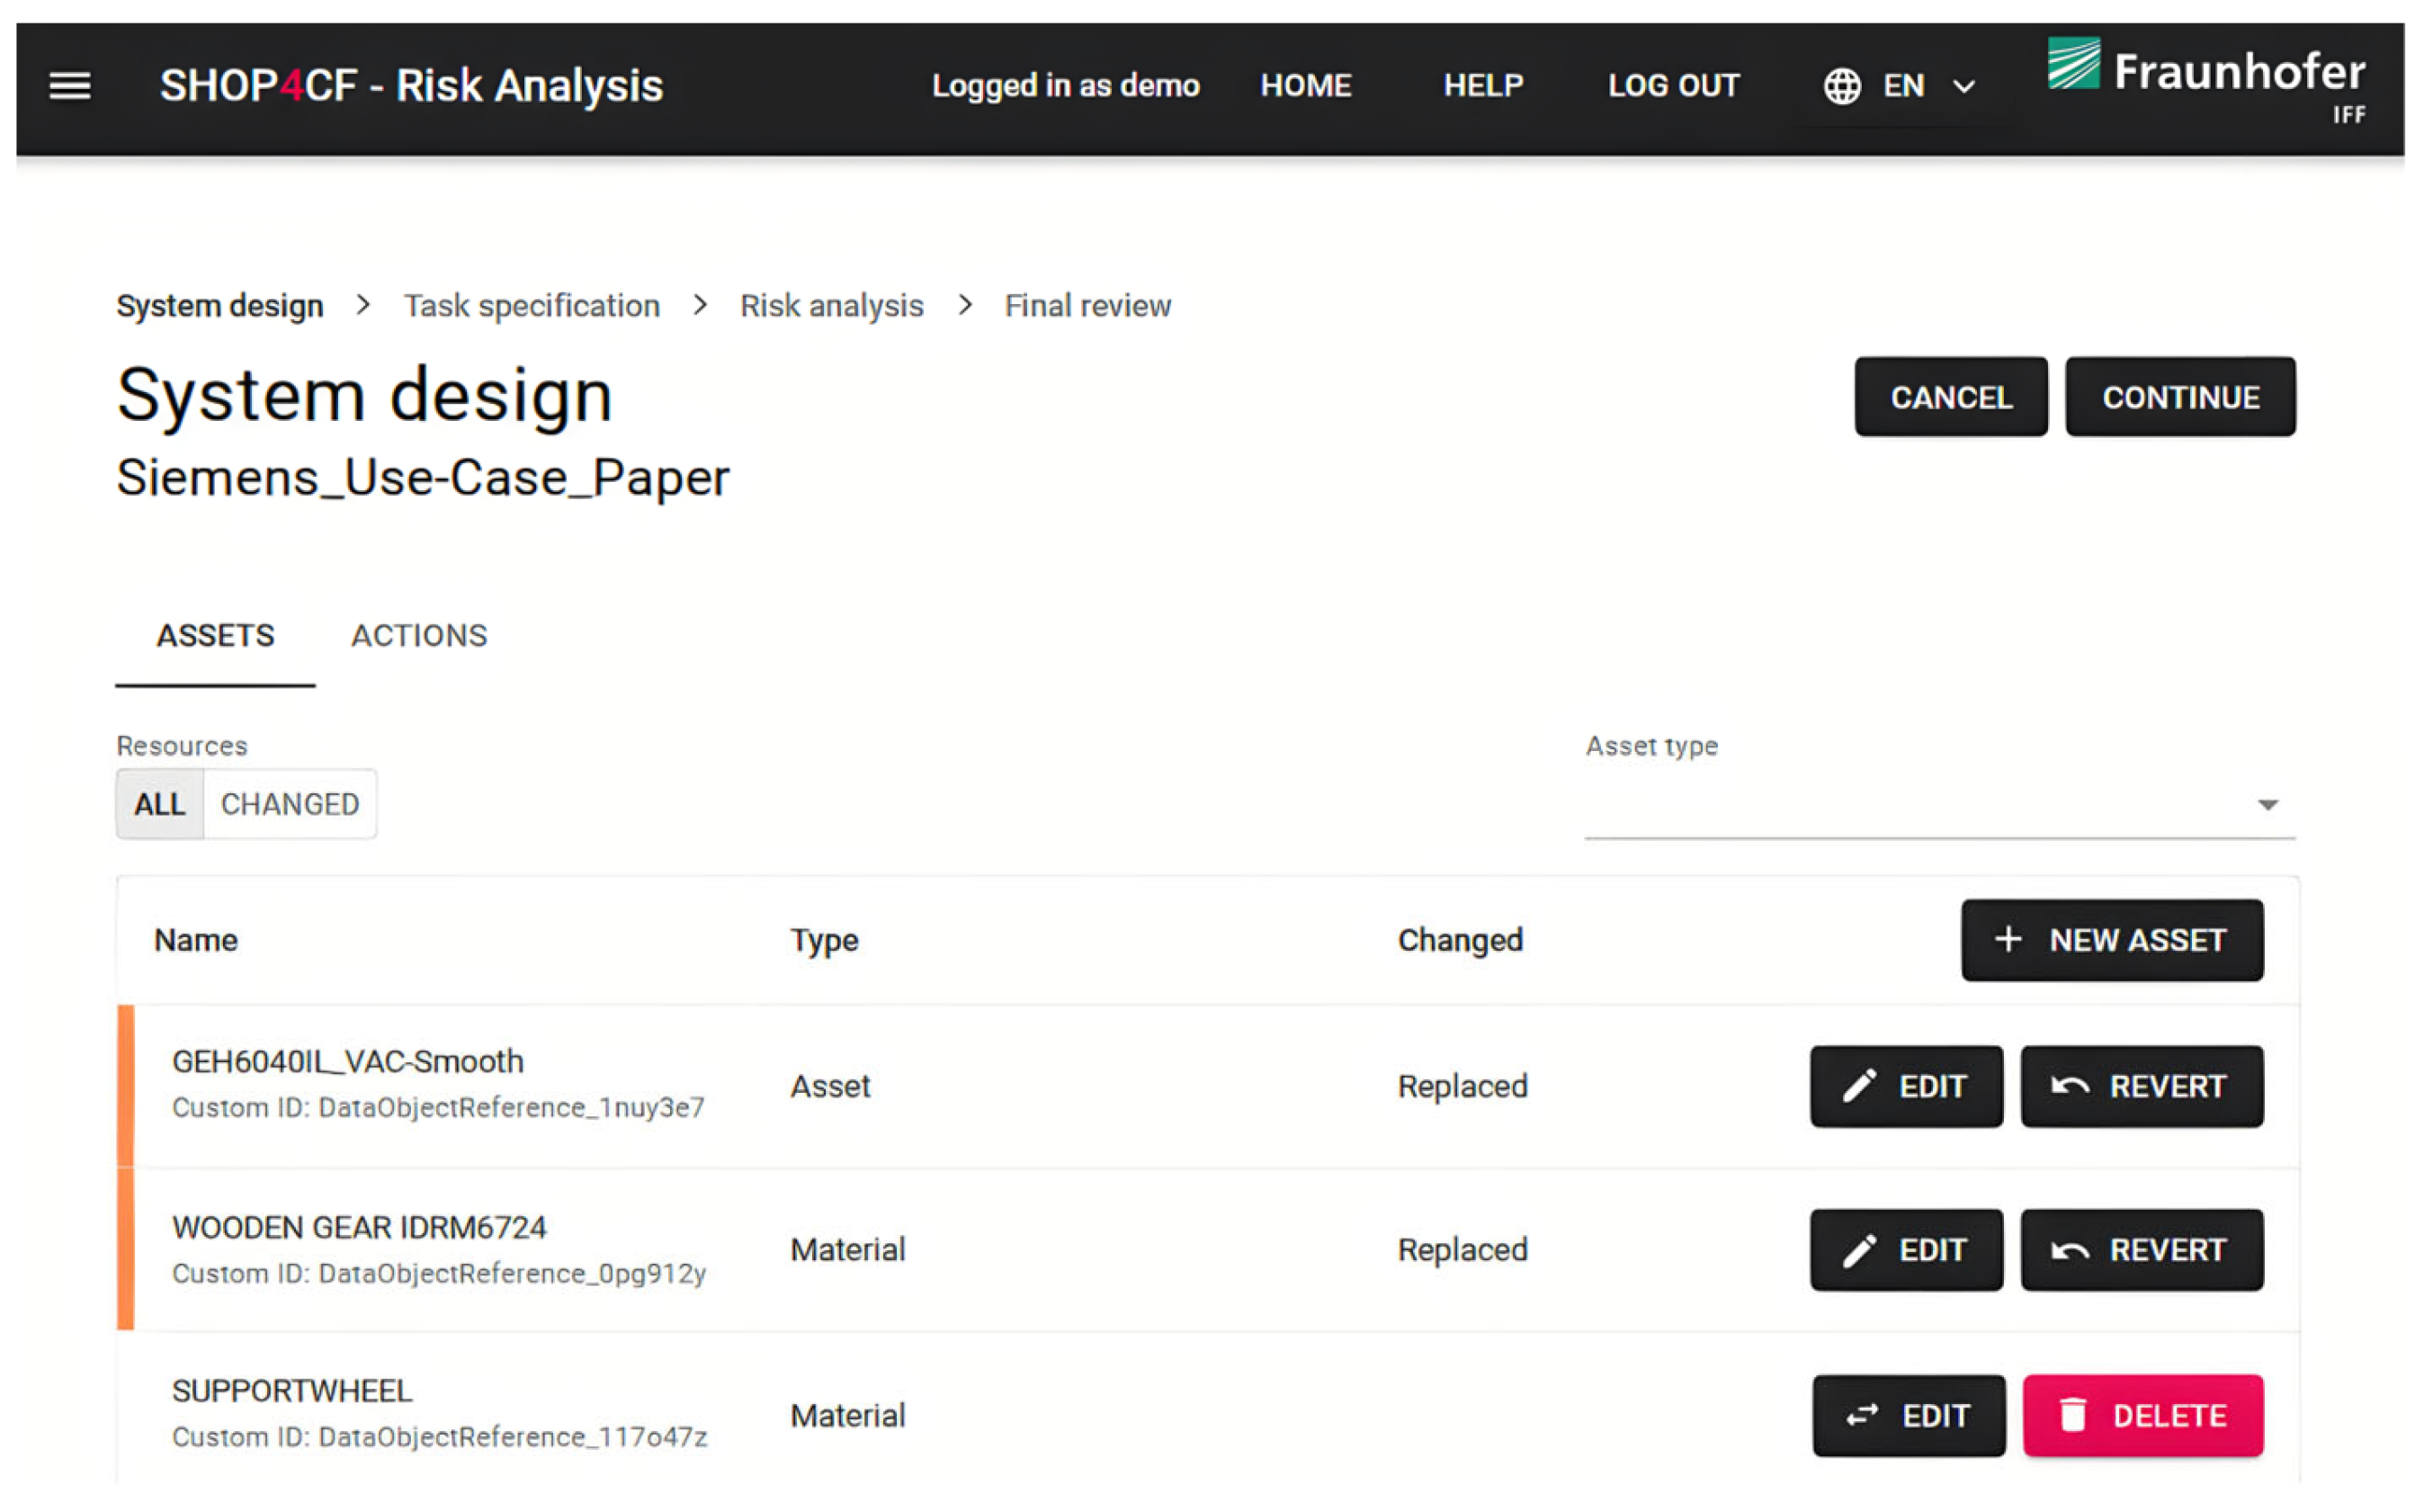
On the other hand, if the revision process with the RA component is considered, the procedure unfolds as follows. Initially, the user changes the newly added resources in the asset tab and provides information about them. Once the change is performed, the modified resources are highlighted in orange, as shown in Figure 9.
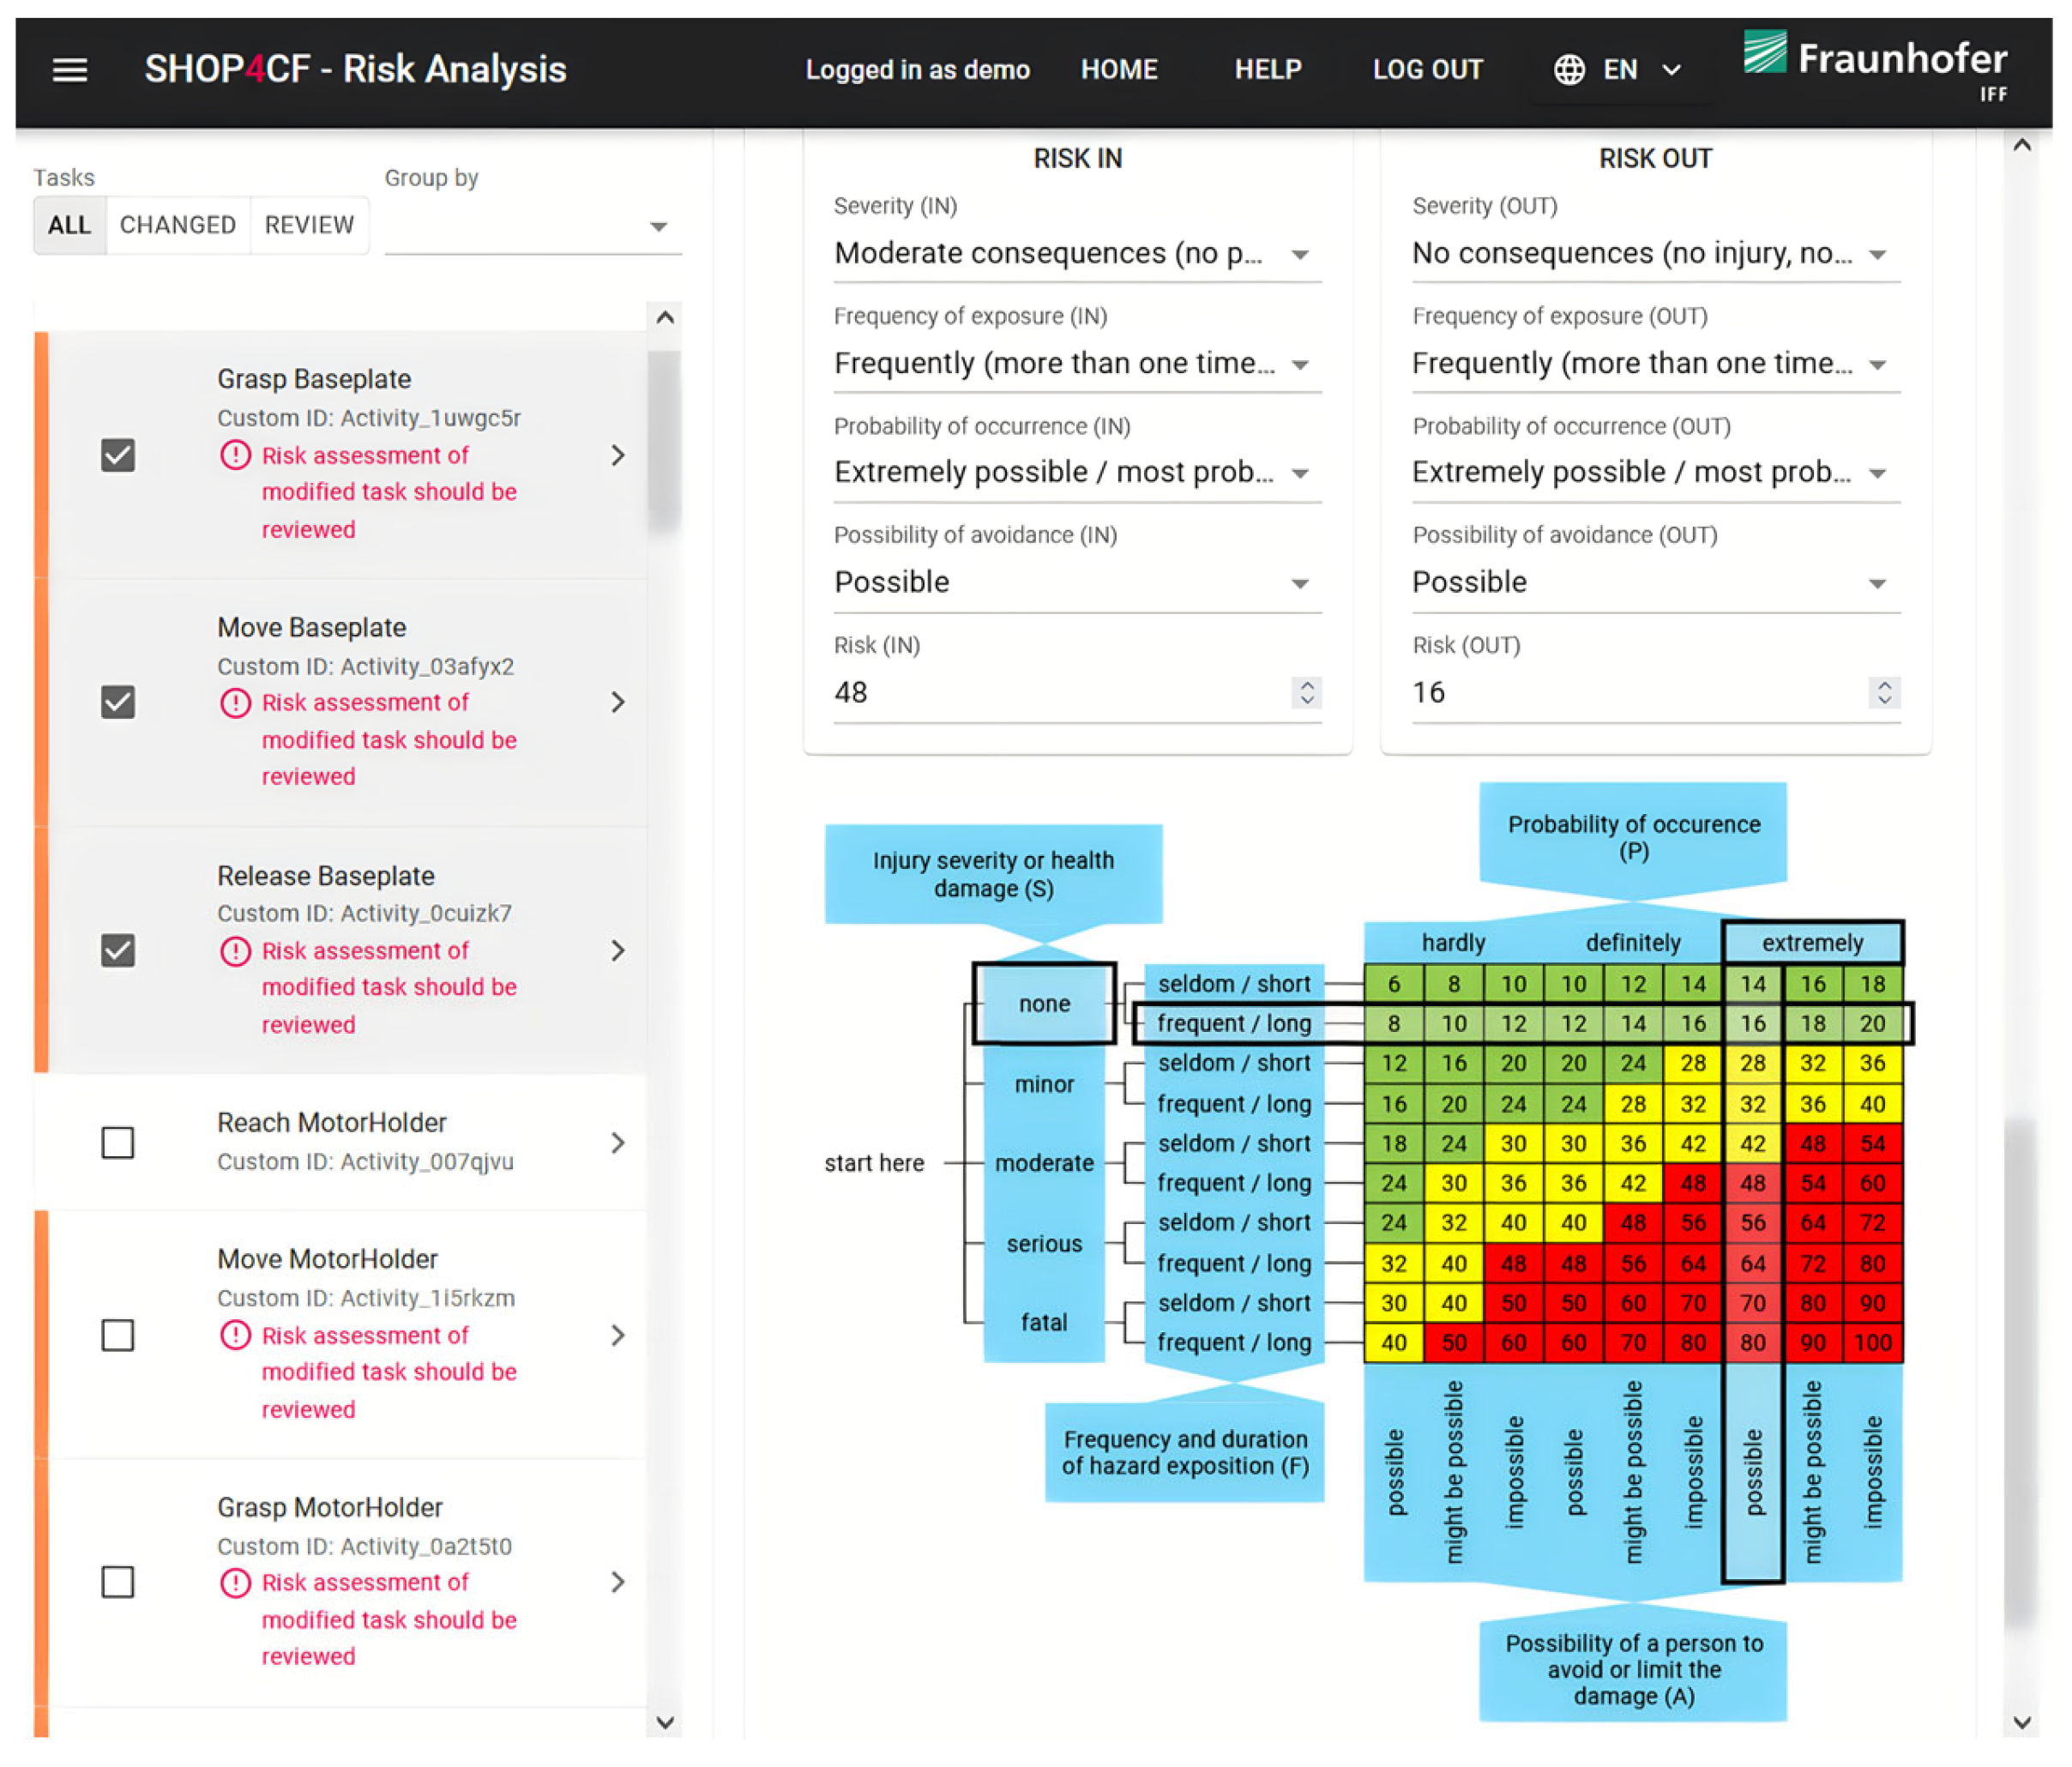
Afterwards, the RA highlights all the steps in which the risk should be revised according to the modified resources. To better guide the user, this is highlighted in pink under each step. Once the risks are highlighted, the user can select all the steps connected to the new asset via a grouping function and will be prompted to edit all the hazards connected, as shown in Figure 10 on the left. Once the hazards are revised, new mitigations are proposed, and risks are evaluated by frequency of exposure, probability of occurrence, and degree of severity. The user can save the new risk evaluation for the steps concerned with the modified resource, as shown in Figure 10 on the right.

4. Evaluation

This section describes how the described components are evaluated through a user test by comparing the legacy tool with the RA. Initially, the usability results are presented in Section 4.1. Then, in Section 4.2, key performance indicators (KPIs) related to the changes, which the users performed in the risk evaluation analysis, are presented.

4.1. Usability

An evaluation investigating the usability of the RA tool compared to the legacy method was performed. The evaluation focused on a situation where an EE and one material were switched due to a product design change. The users were instructed to review the risk assessment, conduct any changes, and then update the risk assessment using one of the available tools (File S3 contains the project of the RA tool and File S2 contains the project with the legacy tool). Afterwards, they were asked to repeat the same process, but with the other tool. At the end of each interaction, the participants were asked to provide their evaluation on the tools’ usability via the standardized system usability scale (SUS) [59] questionnaire. An explanatory image of the process is shown in Figure 11.
A total of eight users participated in the study. To avoid biases, four of them used the legacy tool first and the remaining used the RA tool first. The outcome of the survey can be seen in Figure 12 and in the supporting material (File S4). On average, the legacy tool scored worse in the SUS compared to the RA. More precisely, RA had a score of M = 65 (SD = 18.32) and the legacy tool had a score of M = 35 (SD = 16.03). A Welch’s t-test was conducted to prove statistical difference between the samples. From this, it is possible to see that p < 0.05 (CI = 95%), meaning that the RA tool scored statistically better compared to the legacy one.

4.2. KPIs on the User Updates to the Risk Assessment

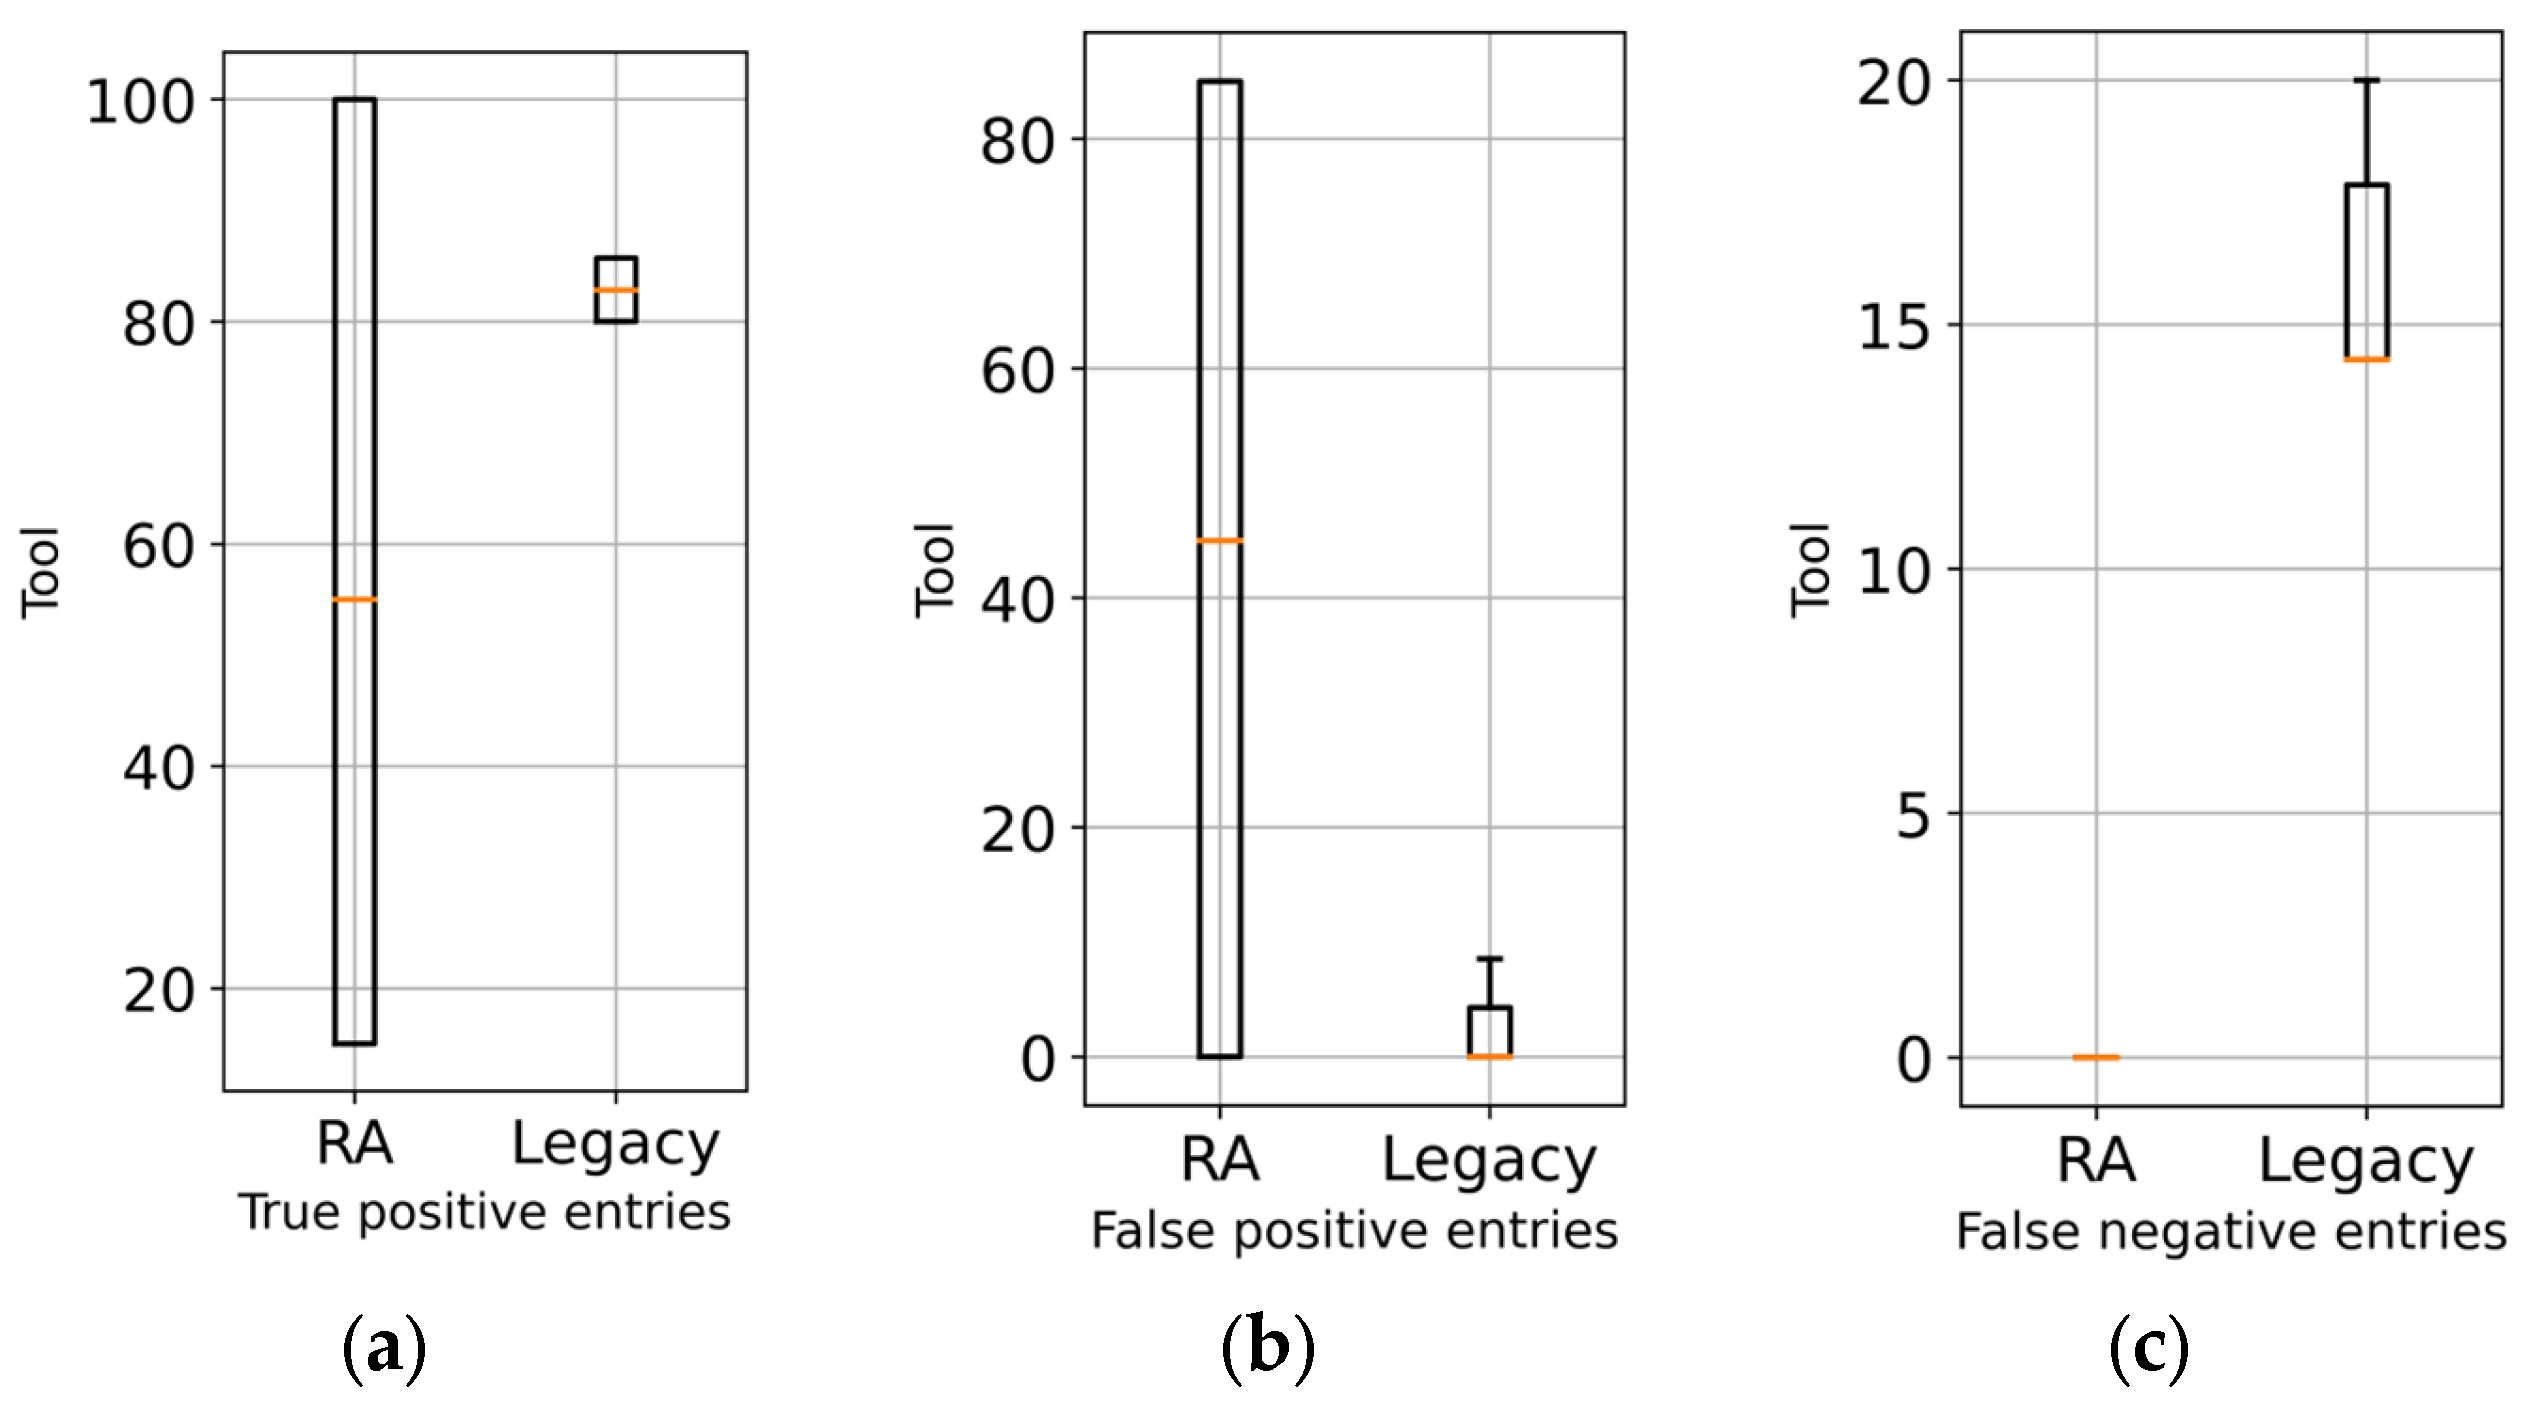
After the study, the risks documented by the users were analyzed to compare the performance of the users based on which tool they used. The following KPIs were monitored: true positives (e.g., fields that were changed, which were supposed to have been changed, and for which the updated content was correct), false negatives (e.g., omissions, in which fields that should have been updated, were not), and false positives (e.g., fields that should have been changed, but for which the updated content was incorrect). The authors formulated the hypothesis that the RA tool usage would lead to fewer false negative and false positive answers, as well as a higher percentage of true positives. In other words, the authors expect that the RA tool will completely eliminate errors wherein the safety expert forgets to add a change. The results for the different KPIs measuring these impacts can be seen in Figure 13. Looking at the figure, it is possible to see that, on average, the RA had lower performance in cases of true positive entries and false positive entries. However, RA scored better in the category of false negative entries. To check the difference among distributions, a Welch’s t-test was conducted after ensuring preconditions to the test. The test yielded a statistical significance for the group of false positive entries (p < 0.05, CI = 95%) and false negative entries (p < 0.05, CI = 95%). On one hand, RA had a score of M = 43 (SD = 44) and the legacy tool had a score of M = 3 (SD = 5) for the false positive entries. On the other hand, RA had a score of M = 0 (SD = 0) and the legacy tool had a score of M = 19 (SD = 17) for the false negative entries. No further statistical significance was found for the true positive entries.

5. Discussion

This section discusses the results identified in Section 4. First, a comparison of the usability scores of the RA and legacy tool is given in Section 5.1. Then, the KPIs for evaluating accuracy and the performance of the RA are discussed in Section 5.2.

5.1. Usability

The evaluation showed that the RA component was more usable compared to the legacy tool. We believe that this is related to the design specifications of the tool, such as the use of a task-based modeling method, the traceability of the steps, and finally, the automatic detection of changes. For example, two participants in the group that used the RA tool second spontaneously reported that having the changes highlighted was better compared to the legacy tool, with which the user had to scroll and search to find the changes. However, despite the good ratings given in the RA tool, the SUS score is not yet optimal—considering that the average was below 70. This indicates that the tool might not be accepted by the whole user pool [60]. Therefore, further improvements can be considered for future developments. For example, while changing resources either via the MES or via manual entry, the user must confirm for each step that the resource has been changed and no grouping feature, as in the risk evaluation, is present. This leads to the user having to click on “save change” several times, therefore leading to a repetitive task which could have influenced the SUS score. This is demonstrated by one user in the group that used the RA tool second. The user spontaneously expressed that the repetitive clicking for every step was improper if compared with the grouping of the resources in the subsequent risk assessment. Therefore, integrating the grouping feature across all steps could be one way to improve the acceptance of the RA tool. As an example, if a robot is changed and PFL is used as mitigation, the maximum allowable speed would depend on the robot type. Considering these insights, future versions of the RA will limit the number of clicks required to confirm changes and will integrate the grouping feature across different steps in the risk evaluation workflow. These changes could lead to an SUS score above 70, indicating a wider acceptance by the user pool.

5.2. KPIs on the User Updates to the Risk Analysis

A different outcome was recorded in the area concerning the accuracy of the information. In contrast to our hypothesis, usage of the RA tool led to a higher number of false positive entries. However, by looking at the RA risk evaluations in the user tests (File S4), it is possible to see that the users erred by not updating the information regarding the smallest contact area in the event of an impact. In the RA, this information had to be inserted in a long string. However, in the legacy tool, this information was organized in a specially designed entry field. Given that the current layout requires a user to manually scroll sideways in the field (and the entire text is not shown in multiple lines), it is possible that users did not see this or realize that they needed to look more carefully within a long string to make the correct update. We believe that this design error led to an increased percentage of false positive entries. Despite this, the results showed that the RA tool was less prone to false negative entries compared to the legacy tool. We believe that this lower rate of false negative entries was possibly due to the highlighting feature provided. Considering this information, we believe that the designed RA tool can better support engineers when frequent changes to risk evaluations are necessary and some fine tunings are necessary to reduce the amount of false positive entries. Therefore, the future version of RA will integrate special entry fields for HRC-related information such as the smallest contact area, similar to the legacy tool, to further support the user and reduce the rate of false positive entries. Moreover, we believe that the RA tool could improve the overall compliance to machinery directive requirements by reminding safety experts about a needed review. However, further experiments are needed to prove this last hypothesis.

6. Conclusions

This work presented a novel software tool to perform and update risk assessments for industrial applications featuring human–robot collaboration. The paper first presented the state-of-the-art methods of performing safety risk assessments. It then underlined the need for new tools to support re-evaluations of cobot applications by safety experts in HMLV production facilities in order to fulfil requirements on documentation related to the CE mark. In particular, the authors identified that there are no risk assessment software tools available that connect with a factory information system to ensure a seamless flow of data and facilitate change management. Afterwards, the overall architecture and specific components, developed within the SHOP4CF project to address the identified needs, were explained. These included a method for task modeling, a lightweight MES, and a risk analysis component. Finally, the risk analysis component was evaluated against an already existing tool for performing risk assessments through a user test. The tools and overall workflow proposed by the authors had a higher usability and lower omission errors compared to the legacy tools. Unfortunately, the RA component usage showed a higher number of false positive entries. Analysis of this unexpected outcome indicated that a simple adjustment to the GUI—increasing the size of a field with text to show all the text without requiring sideways scrolling—is necessary to improve this result.
These results may be connected to some work limitations which the authors would like to directly address. First, the tests were limited to a small user pool due to availability and the necessary knowledge of robotics by the users. Therefore, this study might better represent the usability as perceived by an engineering-based user pool. Second, while the MES was not evaluated in terms of usability, we believe that it served its purpose to parametrize defined processes ready for safe execution and its functionality does not affect the evaluation of the risk analysis tool. However, further studies on the MES usability can be investigated. Considering the limitations, we would like to encourage the use of the tool by other practitioners and look forward to gathering more feedback in the near future. The risk analysis tool is publicly available and is freely accessible on the robotics and automation marketplace (RAMP) (https://www.ramp.eu/#/ (accessed on 3 March 2022)).
Future work will focus on the testing of the MES, perceived usability by a larger user pool, and improvement of the risk analysis component GUI according to the identified shortcomings.

Supplementary Materials

The following supporting information can be downloaded at: https://www.mdpi.com/article/10.3390/app12115639/s1, File S1: Gearbox use-case; File S2: Excerpt of the excel risk tool; File S3: RA project export; File S4: Results obtained from the tests.

Author Contributions

Conceptualization, Y.P., E.S., J.S., K.T. and M.P.; methodology, E.S., J.S.; software, Y.P., E.S. and M.P.; validation, M.P. and D.R.; formal analysis, M.P.; investigation, M.P.; resources, M.P. and D.R.; data curation, Y.P., E.S. and M.P.; writing—original draft preparation, Y.P., J.S., K.T., S.A. and M.P.; writing—review and editing, Y.P., E.S., J.S., K.T., S.A., D.L. and M.P.; visualization, J.S. and M.P.; supervision, D.R. and D.L.; project administration, M.P., D.R. and J.S.; funding acquisition, D.R. and J.S. All authors have read and agreed to the published version of the manuscript.

Funding

This research has received funding from the European Union’s Horizon 2020 research and innovation program under grant agreement No 873087. The results obtained in this work reflect only the authors’ views and not those of the European Commission; the Commission is not responsible for any use that may be made of the information they contain.

Institutional Review Board Statement

Ethical review and approval were waived for this study due to anonymized data collection which in Bavaria does not need approval from an ethical committee (https://ethikkommission.blaek.de/studien/sonstige-studien/antragsunterlagen-ek-primarberatend-15-bo) (accessed on 8 March 2022).

Informed Consent Statement

Informed consent was obtained from all subjects involved in the study and the participation to the study was voluntary.

Data Availability Statement

The data for this study are contained within the article and Supplementary Materials.

Acknowledgments

The authors would like to thank the users who took part to the study.

Conflicts of Interest

The authors declare no conflict of interest.

References

  1. Anshuk, G.; Magar, C.; Roger, R. How Technology Can Drive the Next Wave of Mass Customization: Seven Technologies Are Making It Easier to Tailor Products and Services to the Wants of Individual Customers—And Still Make a Profit; Business Technology Office, McKinsey & Company: Chicago, IL, USA, 2014. [Google Scholar]
  2. Hermann, M.; Pentek, T.; Otto, B. Design Principles for Industrie 4.0 Scenarios. In Proceedings of the 2016 49th Hawaii International Conference on System Sciences (HICSS), Koloa, HI, USA, 5–8 January 2016; pp. 3928–3937. [Google Scholar]
  3. Forschungsunion; Acatech. Recommendations for Implementing the Strategic Initiative INDUSTRIE 4.0 Securing the Future of German Manufacturing Industry: Final Report of the Industrie 4.0 Working Group. 2013. Available online: https://www.Gateway-bayern.de/BV041628398 (accessed on 30 August 2021).
  4. Pozzi, R.; Rossi, T.; Secchi, R. Industry 4.0 technologies: Critical success factors for implementation and improvements in manufacturing companies. Prod. Plan. Control 2021, 1–21. [Google Scholar] [CrossRef]
  5. European Commission; Executive Agency for Small and Medium-Sized Enterprises; Muller, P.; Cannings, J.; Priem, M.; Unlu Bohn, N.; Lefebvre, V.; Murphy, E.; Aranda, F.; Devnani, S.; et al. Annual Report on European SMEs 2020/2021: Digitalisation of SMEs: Background Document; Hope, K., Ed.; Publications Office of the European Union: Luxembourg, 2021. [Google Scholar]
  6. Fernández-Macías, E.; Klenert, D.; Antón, J.-I. Not so disruptive yet? Characteristics, distribution and determinants of robots in Europe. Struct. Change Econ. Dyn. 2021, 58, 76–89. [Google Scholar] [CrossRef]
  7. Aaltonen, I.; Salmi, T. Experiences and expectations of collaborative robots in industry and academia: Barriers and development needs. Procedia Manuf. 2019, 38, 1151–1158. [Google Scholar] [CrossRef]
  8. Johansen, K.; Rao, S.; Ashourpour, M. The Role of Automation in Complexities of High-Mix in Low-Volume Production—A Literature Review. Procedia CIRP 2021, 104, 1452–1457. [Google Scholar] [CrossRef]
  9. Karaulova, T.; Andronnikov, K.; Mahmood, K.; Shevtshenko, E. Lean Automation for Low-Volume Manufacturing Environment. In Proceedings of the 30th International DAAAM Symposium 2019, Zadar, Croatia, 20–27 October 2019; Katalinic, B., Ed.; DAAAM International: Vienna, Austria, 2019; pp. 59–68. [Google Scholar]
  10. Miqueo, A.; Torralba, M.; Yagüe-Fabra, J.A. Lean Manual Assembly 4.0: A Systematic Review. Appl. Sci. 2020, 10, 8555. [Google Scholar] [CrossRef]
  11. Tomašević, I.; Stojanović, D.; Slović, D.; Simeunović, B.; Jovanović, I. Lean in High-Mix/Low-Volume industry: A systematic literature review. Prod. Plan. Control 2021, 32, 1004–1019. [Google Scholar] [CrossRef]
  12. Villani, V.; Pini, F.; Leali, F.; Secchi, C. Survey on human–robot collaboration in industrial settings: Safety, intuitive interfaces and applications. Mechatronics 2018, 55, 248–266. [Google Scholar] [CrossRef]
  13. Jeschke, S.; Brecher, C.; Song, H.; Rawat, D.B. Industrial Internet of Things; Springer International Publishing: Cham, Swizerland, 2017; ISBN 978-3-319-42558-0. [Google Scholar]
  14. Fujita, M.; Domae, Y.; Noda, A.; Garcia Ricardez, G.A.; Nagatani, T.; Zeng, A.; Song, S.; Rodriguez, A.; Causo, A.; Chen, I.M.; et al. What are the important technologies for bin picking? Technology analysis of robots in competitions based on a set of performance metrics. Adv. Robot. 2020, 34, 560–574. [Google Scholar] [CrossRef]
  15. Pantano, M.; Blumberg, A.; Regulin, D.; Hauser, T.; Saenz, J.; Lee, D. Design of a collaborative modular end effector considering human values and safety requirements for industrial use cases. In Proceedings of the 14th International Workshop on Human-Friendly Robotics (HFR 2021), Bologna, Italy, 28–29 October 2021. [Google Scholar]
  16. Eiband, T.; Willibald, C.; Tannert, I.; Weber, B.; Lee, D. Collaborative Programming of Robotic Task Decisions and Recovery Behaviors. Auton. Robot. 2022; in press. [Google Scholar]
  17. Gualtieri, L.; Rauch, E.; Vidoni, R. Emerging research fields in safety and ergonomics in industrial collaborative robotics: A systematic literature review. Robot. Comput.-Integr. Manuf. 2021, 67, 101998. [Google Scholar] [CrossRef]
  18. Bauer, W.; Bender, M.; Braun, M.; Rally, P.; Scholtz, O. Lightweight Robots in Manual Assembly—Best to Start Simply: Examining Companies’ Initial Experiences with Lightweight Robots; Frauenhofer-Institut für Arbeitswirtschaft und Organisation IAO: Stuttgart, Germany, 2016. [Google Scholar]
  19. Saenz, J.; Elkmann, N.; Gibaru, O.; Neto, P. Survey of methods for design of collaborative robotics applications—Why safety is a barrier to more widespread robotics uptake. In Proceedings of the ICMRE 2018: 2018 4th International Conference on Mechatronics and Robotics Engineering, Valenciennes, France, 7–11 February 2018; ACM: New York, NY, USA, 2018; pp. 95–101. [Google Scholar]
  20. ISO 12100:2010; Safety of Machinery—General Principles for Design—Risk Assessment and Risk Reduction, Version 1. International Organization for Standardization: Geneva, Switzerland, 2010.
  21. Vicentini, F.; Askarpour, M.; Rossi, M.G.; Mandrioli, D. Safety Assessment of Collaborative Robotics Through Automated Formal Verification. IEEE Trans. Robot. 2020, 36, 42–61. [Google Scholar] [CrossRef]
  22. Awad, R.; Fechter, M.; van Heerden, J. Integrated risk assessment and safety consideration during design of HRC workplaces. In Proceedings of the 2017 22nd IEEE International Conference on Emerging Technologies and Factory Automation (ETFA), Limassol, Cyprus, 12–15 September 2017; pp. 1–10. [Google Scholar]
  23. Inam, R.; Raizer, K.; Hata, A.; Souza, R.; Forsman, E.; Cao, E.; Wang, S. Risk Assessment for Human-Robot Collaboration in an automated warehouse scenario. In Proceedings of the 2018 IEEE 23rd International Conference on Emerging Technologies and Factory Automation (ETFA), Turin, Italy, 4–7 September 2018; pp. 743–751. [Google Scholar]
  24. Liu, Z.; Wang, X.; Cai, Y.; Xu, W.; Liu, Q.; Zhou, Z.; Pham, D.T. Dynamic risk assessment and active response strategy for industrial human-robot collaboration. Comput. Ind. Eng. 2020, 141, 106302. [Google Scholar] [CrossRef]
  25. Gualtieri, L.; Rauch, E.; Vidoni, R. Development and validation of guidelines for safety in human-robot collaborative assembly systems. Comput. Ind. Eng. 2022, 163, 107801. [Google Scholar] [CrossRef]
  26. Huck, T.P.; Münch, N.; Hornung, L.; Ledermann, C.; Wurll, C. Risk assessment tools for industrial human-robot collaboration: Novel approaches and practical needs. Saf. Sci. 2021, 141, 105288. [Google Scholar] [CrossRef]
  27. Directive 2006/42/EC of the European Parliament and of the Council of 17 May 2006 on Machinery and Amending Directive 95/16/EC. Off. J. Eur. Union 2006, L157, 24–86.
  28. Federal Ministry of Labour and Social Affairs. Interpretation Paper on Substantial Modification to Machinery. 2015. Available online: https://www.bmas.de/SharedDocs/Downloads/DE/Arbeitsschutz/en-interpretation-paper-substantial-modification-to-machinery.pdf?__blob=publicationFile&v=1 (accessed on 3 March 2022).
  29. Traganos, K.; Grefen, P.; Vanderfeesten, I.; Erasmus, J.; Boultadakis, G.; Bouklis, P. The HORSE framework: A reference architecture for cyber-physical systems in hybrid smart manufacturing. J. Manuf. Syst. 2021, 61, 461–494. [Google Scholar] [CrossRef]
  30. Grefen, P.W.; Boultadakis, G. Designing an Integrated System for Smart Industry: Designing an Integrated System for Smart Industry; Departmental Office IE&IS, Industrial Engineering and Innovation Sciences: Eindhoven, The Netherlands, 2021; ISBN 979-8667048640. [Google Scholar]
  31. Zanetti, R. Deliverable 1.2—OPIL Architecture. 2018. Available online: http://www.l4ms.eu/sites/default/files/deliverables/D1.2.pdf (accessed on 28 February 2022).
  32. Zimniewicz, M. Deliverable 3.2—SHOP4CF Architecture. 2020. Available online: https://elk.adalidda.com/2021/05/SHOP4CF-WP3-D32-DEL-210119-v1.0.pdf (accessed on 28 February 2022).
  33. Araujo, V.; Mitra, K.; Saguna, S.; Åhlund, C. Performance evaluation of FIWARE: A cloud-based IoT platform for smart cities. J. Parallel Distrib. Comput. 2019, 132, 250–261. [Google Scholar] [CrossRef]
  34. Vanderfeesten, I.; Erasmus, J.; Traganos, K.; Bouklis, P.; Garbi, A.; Boultadakis, G.; Dijkman, R.; Grefen, P. Developing Process Execution Support for High-Tech Manufacturing Processes. In Empirical Studies on the Development of Executable Business Processes; Lübke, D., Pautasso, C., Eds.; Springer International Publishing: Cham, Switzerland, 2019; pp. 113–142. ISBN 978-3-030-17665-5. [Google Scholar]
  35. West, M. Developing High Quality Data Models; Morgan Kaufmann: Burlington, MA, USA, 2011; ISBN 978-0-12-375106-5. [Google Scholar]
  36. IEC-62264; Enterprise-Control System Integration. International Electrotechnical Commission: Geneva, Switzerland, 2013.
  37. Brunoe, T.D.; Nielsen, K. Complexity Management in Mass Customization SMEs. Procedia CIRP 2016, 51, 38–43. [Google Scholar] [CrossRef] [Green Version]
  38. Grewal, C. An initiative to implement lean manufacturing using value stream mapping in a small company. Int. J. Manuf. Technol. Manag. 2008, 15, 404. [Google Scholar] [CrossRef]
  39. Cheng-Leong, A.; Li Pheng, K.; Keng Leng, G.R. IDEF*: A comprehensive modelling methodology for the development of manufacturing enterprise systems. Int. J. Prod. Res. 1999, 37, 3839–3858. [Google Scholar] [CrossRef]
  40. Kim, C.-H.; Weston, R.H.; Hodgson, A.; Lee, K.-H. The complementary use of IDEF and UML modelling approaches. Comput. Ind. 2003, 50, 35–56. [Google Scholar] [CrossRef]
  41. OMG. Business Process Model and Notation (BPMN), Version 2.0.2. 2013. Available online: http://www.omg.org/spec/BPMN/2.0.2 (accessed on 8 March 2022).
  42. García-Domínguez, A.; Marcos, M.; Medina, I. A comparison of BPMN 2.0 with other notations for manufacturing processes. In Proceedings of the 4th Manufacturing Engineering Society International Conference (MESIC 2011), Cadiz, Spain, 21–23 September 2011; AIP: Melville, NY, USA, 2012; pp. 593–600. [Google Scholar]
  43. Prades, L.; Romero, F.; Estruch, A.; García-Dominguez, A.; Serrano, J. Defining a Methodology to Design and Implement Business Process Models in BPMN According to the Standard ANSI/ISA-95 in a Manufacturing Enterprise. Procedia Eng. 2013, 63, 115–122. [Google Scholar] [CrossRef] [Green Version]
  44. Erasmus, J.; Vanderfeesten, I.; Traganos, K.; Grefen, P. The Case for Unified Process Management in Smart Manufacturing. In Proceedings of the 2018 IEEE 22nd International Enterprise Distributed Object Computing Conference (EDOC), Stockholm, Sweden, 16–19 October 2018; pp. 218–227. [Google Scholar] [CrossRef]
  45. Zor, S.; Leymann, F.; Schumm, D. A proposal of BPMN extensions for the manufacturing domain. In Proceedings of the 44th CIRP International Conference on Manufacturing Systems, Madison, WI, USA, 1–3 June 2011. [Google Scholar]
  46. Meyer, S.; Ruppen, A.; Magerkurth, C. Internet of Things-Aware Process Modeling: Integrating IoT Devices as Business Process Resources. In Active Flow and Combustion Control 2018; King, R., Ed.; Springer International Publishing: Cham, Switzerland, 2019; pp. 84–98. ISBN 978-3-319-98176-5. [Google Scholar]
  47. Petrasch, R.; Hentschke, R. Process modeling for industry 4.0 applications: Towards an industry 4.0 process modeling language and method. In Proceedings of the 2016 13th International Joint Conference on Computer Science and Software Engineering (JCSSE), Khon Kaen, Thailand, 13–15 July 2016; pp. 1–5. [Google Scholar]
  48. Abouzid, I.; Saidi, R. Proposal of BPMN extensions for modelling manufacturing processes. In Proceedings of the 2019 5th International Conference on Optimization and Applications (ICOA), Kenitra, Morocco, 25–26 April 2019; pp. 1–6. [Google Scholar]
  49. Schonberger, D.; Lindorfer, R.; Froschauer, R. Modeling Workflows for Industrial Robots Considering Human-Robot-Collaboration. In Proceedings of the 2018 IEEE 16th International Conference on Industrial Informatics (INDIN), Porto, Portugalt, 18–20 July 2018; pp. 400–405. [Google Scholar]
  50. Froschauer, R.; Lindorfer, R. Workflow-based programming of human-robot interaction for collaborative assembly stations. In Proceedings of the ARG & OAGM Workshop, Steyr, Austria, 9–10 May 2019. [Google Scholar]
  51. Lindorfer, R.; Froschauer, R.; Schwarz, G. ADAPT—A decision-model-based Approach for Modeling Collaborative Assembly and Manufacturing Tasks. In Proceedings of the 2018 IEEE 16th International Conference on Industrial Informatics (INDIN), Porto, Portugal, 18–20 July 2018; pp. 559–564. [Google Scholar]
  52. Schmidbauer, C.; Hader, B.; Schlund, S. Evaluation of a Digital Worker Assistance System to enable Adaptive Task Sharing between Humans and Cobots in Manufacturing. Procedia CIRP 2021, 104, 38–43. [Google Scholar] [CrossRef]
  53. ISO 10218-2:2011; Robots and Robotic Devices—Safety Requirements for Industrial Robots—Part 2: Robot Systems and Integration, Version 1. International Organization for Standardization: Geneva, Switzerland, 2011.
  54. ISO 10218-1:2011; Robots and Robotic Devices—Safety Requirements for Industrial Robots—Part 1: Robots, Version 2. International Organization for Standardization: Geneva, Switzerland, 2011.
  55. Saenz, J.; Fassi, I.; Prange-Lasonder, G.B.; Valori, M.; Bidard, C.; Lassen, A.B.; Bessler-Etten, J. COVR Toolkit—Supporting safety of interactive robotics applications. In Proceedings of the 2021 IEEE 2nd International Conference on Human-Machine Systems (ICHMS), Magdeburg, Germany, 8–10 September 2021; pp. 1–6. [Google Scholar]
  56. ISO/TS 15066:2016; Robots and Robotic Devices—Collaborative Robots, Version 1. International Organization for Standardization: Geneva, Switzerland, 2016.
  57. Pantano, M.; Blumberg, A.; Regulin, D.; Hauser, T.; Saenz, J.; Lee, D. Design of a Collaborative Modular End Effector Considering Human Values and Safety Requirements for Industrial Use Cases. In Human-Friendly Robotics 2021; Palli, G., Melchiorri, C., Meattini, R., Eds.; Springer International Publishing: Cham, Switzerland, 2022; pp. 45–60. ISBN 978-3-030-96358-3. [Google Scholar]
  58. ISO/TR 14121-2:2012; Safety of Machinery—Risk Assessment—Part 2: Practical Guidance and Examples of Methods, Version 2. International Organization for Standardization: Geneva, Switzerland, 2012.
  59. Brooke, J. SUS—A Quick and Dirty Usability Scale; Usability evaluation in industry; CRC Press: Boca Raton, FL, USA, 1996; ISBN 9780748404605. [Google Scholar]
  60. Bangor, A.; Kortum, P.T.; Miller, J.T. An Empirical Evaluation of the System Usability Scale. Int. J. Hum.-Comput. Interact. 2008, 24, 574–594. [Google Scholar] [CrossRef]
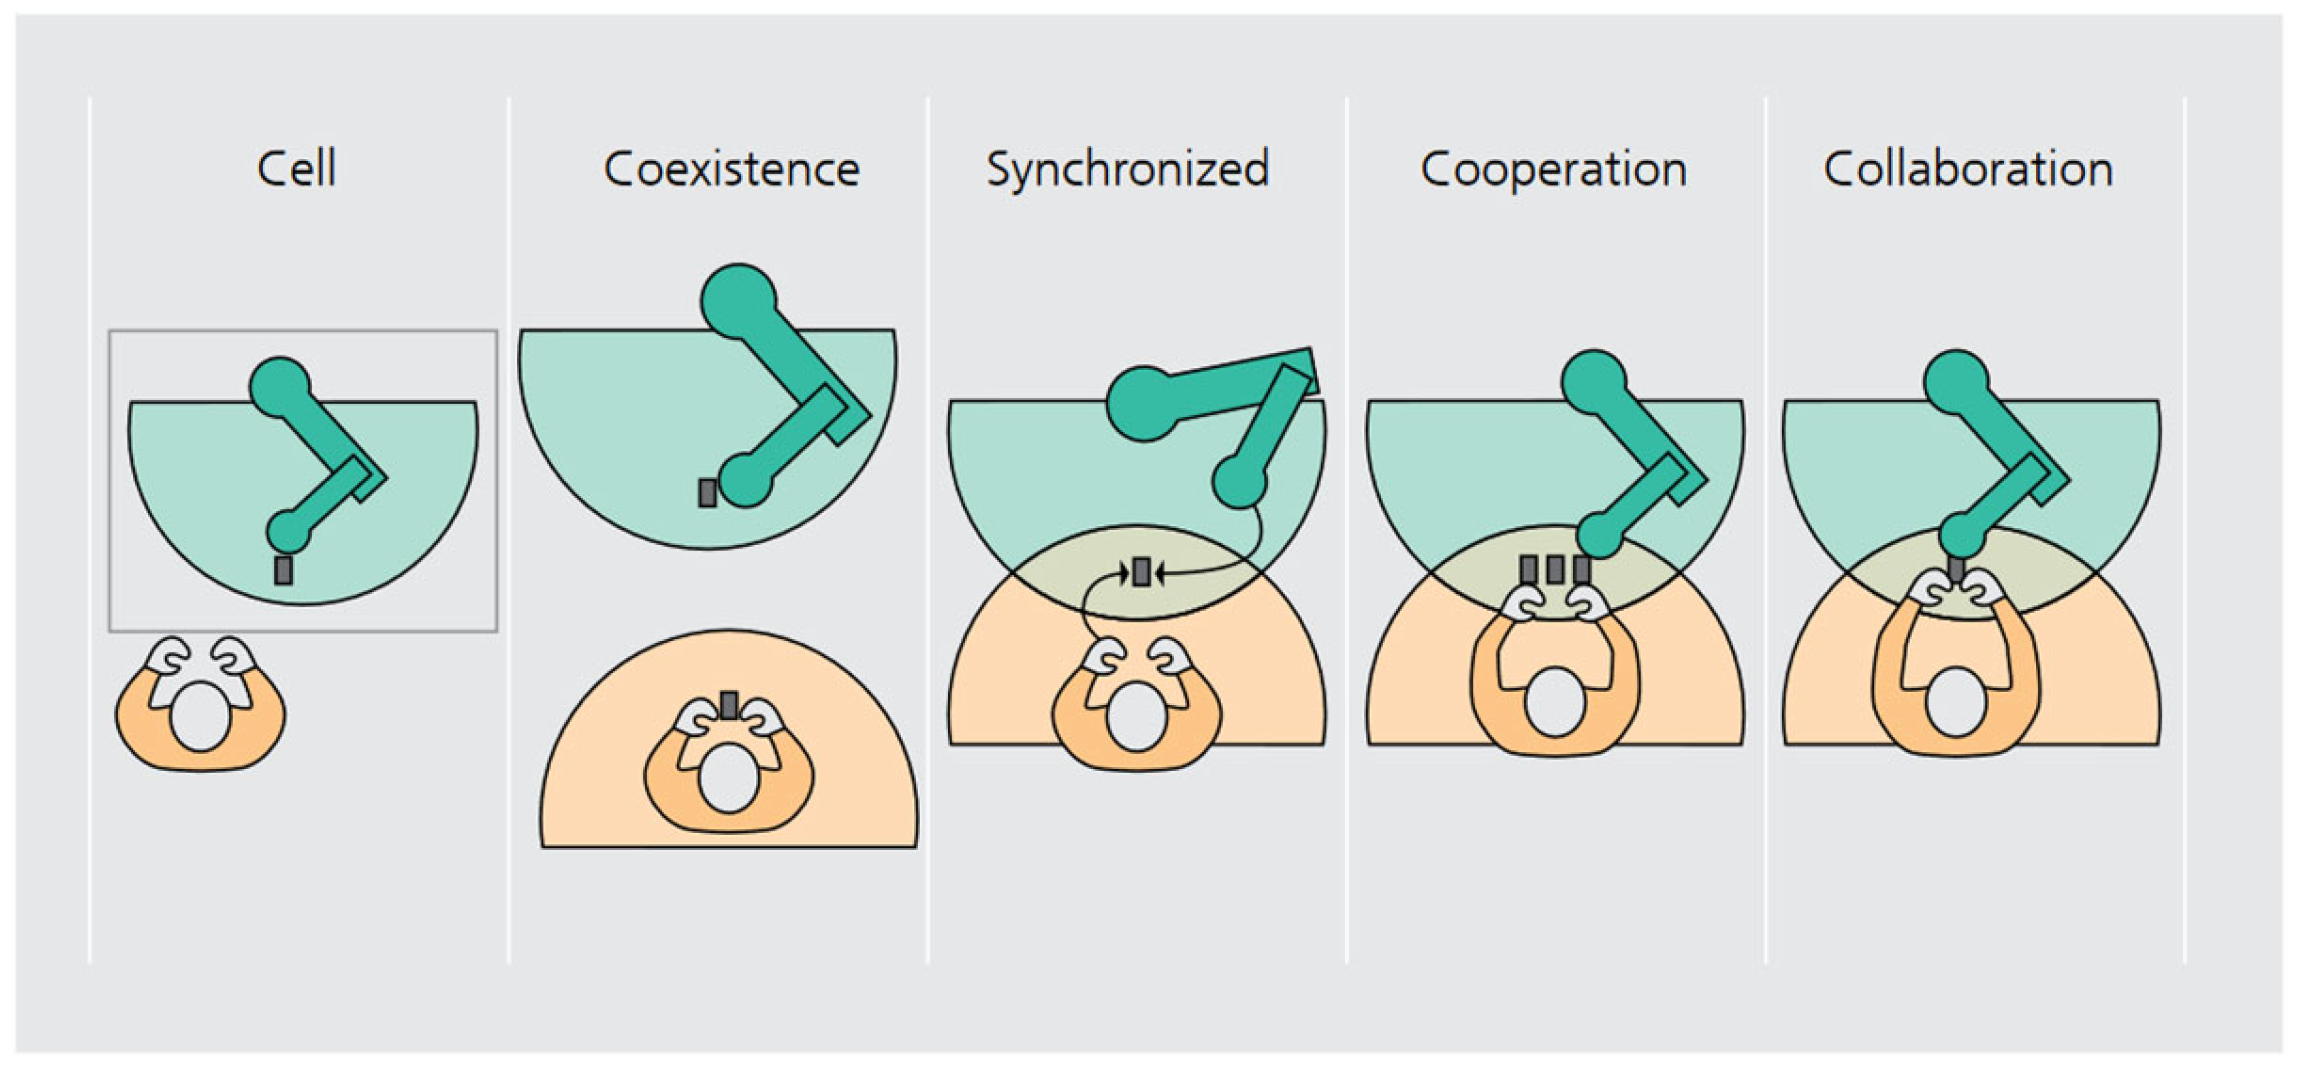
Figure 1. Collaboration levels in human–robot interaction from [18]. The cobot can be integrated with the human in five different modalities depending on the workspace and the tasks shared among the human and robot.
Applsci 12 05639 g001
Figure 2. The workflow for ensuring safety of an HRC application, for hazard identification, risk evaluation, risk reduction, and review. Adapted from [19].
Applsci 12 05639 g002
Figure 3. Top-level logical platform architecture [32]. The platform is composed of different levels depending on closeness to the hardware. On the top level are the SHOP4CF components along with third-party information systems, which are software components meant to use data to send and receive information. On the middle level, middleware, containers, and software of cyber-physical systems, which are components related to moving data between hardware and software, are positioned. On the bottom level there are hardware components such as servers and IoT devices meant to perform environment changes.
Applsci 12 05639 g003
Figure 4. High-level logical software architecture of a SHOP4CF platform for a connected factory [32]. Additions refer to the use-case described in this work. The abbreviation MPMS stands for manufacturing process management system, which is a process management component. MES stands for manufacturing execution system, which is a system for inserting, managing, and tracking production orders. RA stands for risk analysis, which is a component in charge of performing a risk analysis from definitions of the collaborative process. BPMN (business process model notation) is also highlighted due to its usage in data transfer. For more information see Section 2.2.
Applsci 12 05639 g004
Figure 5. Example of modeling for a collaborative assembly task. One pool named “assembly” is used to contain all the steps concerning the process. Afterwards, two lanes, “ROBOT” (in green) and “operator” (in pink), are used to depict the actions that each actor should perform for the collaborative task. Finally, passive resources complementary to the actions (in orange) are connected to the different actions. This representation allows one to identify all resources (robot, operator, transmission gear, gripper, and motor holder) involved in a unique process (assembly). Moreover, the unfolding of the different actions is clearly assigned to each actor (e.g., the operator needs to perform reach, grasp, and clip).
Applsci 12 05639 g005
Figure 6. Top-level logical data architecture used in SHOP4CF [32]. The notation used is based on the UML and defines the cardinality between the different data models. This architecture is used to structure the MES database. In this architecture, the process definition and process are of utmost importance. These refer respectively to a high-level process definition, which was initially given by a BPMN model, and to a process representation with clearly mapped resources.
Applsci 12 05639 g006
Figure 7. Sequence diagram of the workflow for performing a risk analysis using the proposed methods. Initially, the user defines the process via BPMN. Second, the BPMN is shared to the MES and RA to extract the process definition (PD). Third, the process definition is used by the user to assign resources. Fourth, the process definition and resources are sent to the RA for the risk analysis. Finally, the result is sent back to the MPMS and the MES, directing them to start execution, or not, depending on the result of the analysis.
Applsci 12 05639 g007
Figure 8. The work cell for the use-case. (a) The work cell considered in the evaluation use-case. (b) The EE integrated in the use-case. A UR 10 CB3 was used for the implementation, which allowed for the implementation of the PFL risk mitigation. Moreover, the EE employed was a self-designed device, which was also proven to be safe by performing collision testing to determine a safe operation speed of the robot.
Applsci 12 05639 g008
Figure 9. Changing resources in the risk analysis component. After editing the resources, the name of the replaced resource is highlighted in orange to simplify further assessment. The user can also filter according to “changed” with the relevant button.
Applsci 12 05639 g009
Figure 10. Updating the risk assessment. Using the “review” function, only tasks featuring a change need to be reviewed (left). These can be grouped according to resource so that all tasks featuring the changed gripper “Gripper-GEH6040IL_VAC-Smooth” are simultaneously edited. The mitigation methods are updated to indicate the changed minimum contact area and newly allowed maximum speed (right).
Applsci 12 05639 g010
Figure 11. Visual representation of the experiment. Initially, between t0 and t1, the users were introduced to the problem together with the experiment clarification, which also had explanatory steps for the task they had to accomplish. Afterwards, between t1 and t2, the first interaction with one of the risk tools was performed, which concluded with filling out the SUS at time t2. Finally, between t2 and t3, the second interaction with the other tool occurred and concluded with filling out the SUS scale at t3.
Applsci 12 05639 g011
Figure 12. The box plot shows the distributions among the SUS questionnaires for the two tools. On average, the RA tool scored better compared to the legacy tool.
Applsci 12 05639 g012
Figure 13. Outcome of the KPIs calculated on the final risk evaluations performed by the users. The RA tool had, on average, a larger percentage of false positive entries (b) and a lower percentage of true positive ones (a) when compared with the legacy tool. However, the percentage of false negative entries (c) was lower in the RA compared to the legacy tool.
Applsci 12 05639 g013
Publisher’s Note: MDPI stays neutral with regard to jurisdictional claims in published maps and institutional affiliations.