Abstract
To analyze the multi-dimensional seismic mitigation performance and the torsional vibration characteristic of an L-shaped frame structure with a magnetorheological damper (MRD). Firstly, the mechanical property of the MRD is experimentally studied. Then, the calculation models of the L-shaped frame structure without and with MRDs are found through theoretical analysis, and the programs of the calculation models are compiled. Finally, the time history responses of the calculation models are calculated during the excitation of bi-directional seismic wave; the responses of displacement, acceleration, story drift ratio, shear force and bending moment and torsional vibration are then compared and analyzed. The results show that by adjusting the current, the damping force provided by the MRD can be adjusted continuously in the range of 3.1 to 120 kN. The compiled calculation model programs of the L-shaped frame structure without and with MRDs can effectively simulate the multi-dimensional seismic response of the structure. Reasonable arrangement of MR dampers can effectively reduce the displacement, acceleration, shear force, bending moment, multi-dimensional vibration, and torsional vibration response of L-shaped frame structures.
1. Introduction
Magnetorheological fluid (MRF) is a new kind of smart fluid whose rheological characteristics are related to the strength of the magnetic field under the action of the magnetic field; MRFs can restore to the initial liquid state without the magnetic field [1]. Magnetorheological dampers (MRDs), semi-active control devices using MRFs, become effective damping control devices for controlling structural vibration because of advantages such as quick response, low energy consumption, large damping force, and being continuously adjustable. Therefore, MRDs have shown good application prospects in civil engineering earthquake mitigation and disaster prevention [2,3,4,5,6,7,8].
The mechanical performance of the MRD is an important factor affecting the efficiency of suppressing vibration control of structures [9]. Therefore, the performance of the MRD should be experimentally studied before the MRD is installed on the structure [10,11]. Since 1996, many important experimental studies on the performance of MRDs have been carried out. Spencer et al. [12] designed and tested an MRD that had a 200 kN damping force. In 2003, Fujitani et al. [13] developed a 400 kN MRD for a real base-isolated building, whose dynamic characteristics were verified through tests. Xu et al. [14] carried out tests on a multi-stage shear-valve mode MRD, and the test results showed that the energy dissipation and the damping force increased significantly with the current until magnetic saturation occurred. Tu et al. [15] presented a large-scale MRD that had a 500 kN damping force and carried out its performance experiments; the results showed that the damping force increased obviously with the increase of current, and when the current was 1.0 A, the maximum damping force provided by the MRD was 537 kN.
The trends of the irregular plane frame structure [16,17,18,19] have rapidly increased due to flexible column grid layouts and large practical spaces. However, the building structures with irregular planes are more susceptible to seismic forces than regular ones. The reason is that the center of mass has different positions from the center of rigidity in the irregular frame structure, and the torsional deformation of the structure caused by eccentricity is more likely to lead to structural failure. To reduce the torsional response of irregular structures, many experimental studies on the multi-dimensional seismic response of the irregular structure with MRDs have been carried out, and the results demonstrate that setting MRDs in the structure can efficaciously decrease the structural torsion response and the multi-dimensional dynamic response [20,21,22,23,24,25,26].
Dyke et al. [27] studied a three-story model structure with MRDs through tests and concluded that MRDs had a significant weakening effect on the peak and RMS responses caused by seismic excitations. Yoshida et al. [28] conducted experimental research on a two-story structure model with an irregular column distribution and concluded that the responses of the structure were greatly reduced after adopting the semi-active controller. Although the analysis of the structure with MRDs has the advantages of obtaining accurate results and high reliability, it also has the disadvantages of high costs and being time-consuming. Moreover, numerical simulation analysis of the structure with MRDs is an effective and economical method to study the effect of structural torsion and multi-dimensional dynamic responses.
Therefore, many scholars have used MATLAB programming to establish various models of the structures with MRDs. Zhang et al. [29] carried out the time history analysis on the elastic-plastic for the plane structure with MRDs, and the results showed that the amount of the yielding point and cracking point of the controlled structure obviously decreased and that MRDs can improve the seismic performance of the structure. Bhaiya et al. [30] established the elastic plane mode of a ten-story frame structure with MRDs and conducted the analysis and research under the action of the seismic force. Xu et al. [31] developed a time history analysis program on the elastic–plastic of the spatial frame structure with MRDs through using MATLAB programming.
However, the program of the spatial frame structure to MRDs in [29] ignored the function of the floor, and the other plane model cannot simulate the multi-dimensional vibration response and torsional vibration control effect of the L-shaped frame structure with MRDs. Compared with [32], this paper tests the mechanical properties of the self-made MRD and analyzes the shear force and bending moment of the structural columns. Additionally, the L-shaped frame structure with MRDs has not been studied up until now.
In this paper, the mechanical performance of the self-made MRD is experimentally studied at different displacement amplitudes and currents. The calculation models of the L-shaped frame structure with and without MRDs are established in view of the theories of spatial beam elements, shell elements, and semi-active control algorithms, and the programs of the calculation models are then compiled by MATLAB software. The dynamic time history analysis is conducted during the action time of bi-directional seismic waves, and the responses of displacement, acceleration, story drift ratio, shear force, bending moment, multi-dimensional vibration, and torsional vibration of the L-shaped frame structure without and with MRDs are then contrasted and analyzed.
The rest of the work includes Section 2, which provides details about the tests on the MRDs. Section 3 describes in detail the modeling theory of the L-shaped frame structure. Section 4 describes the model and explains the verification process. Additionally, Section 5 gives a detailed analysis and interpretation of results, and finally, Section 5 summarizes the research conducted and presents the future objectives that can extend it.
2. The Tests of the MRD
2.1. Structure of the MRD
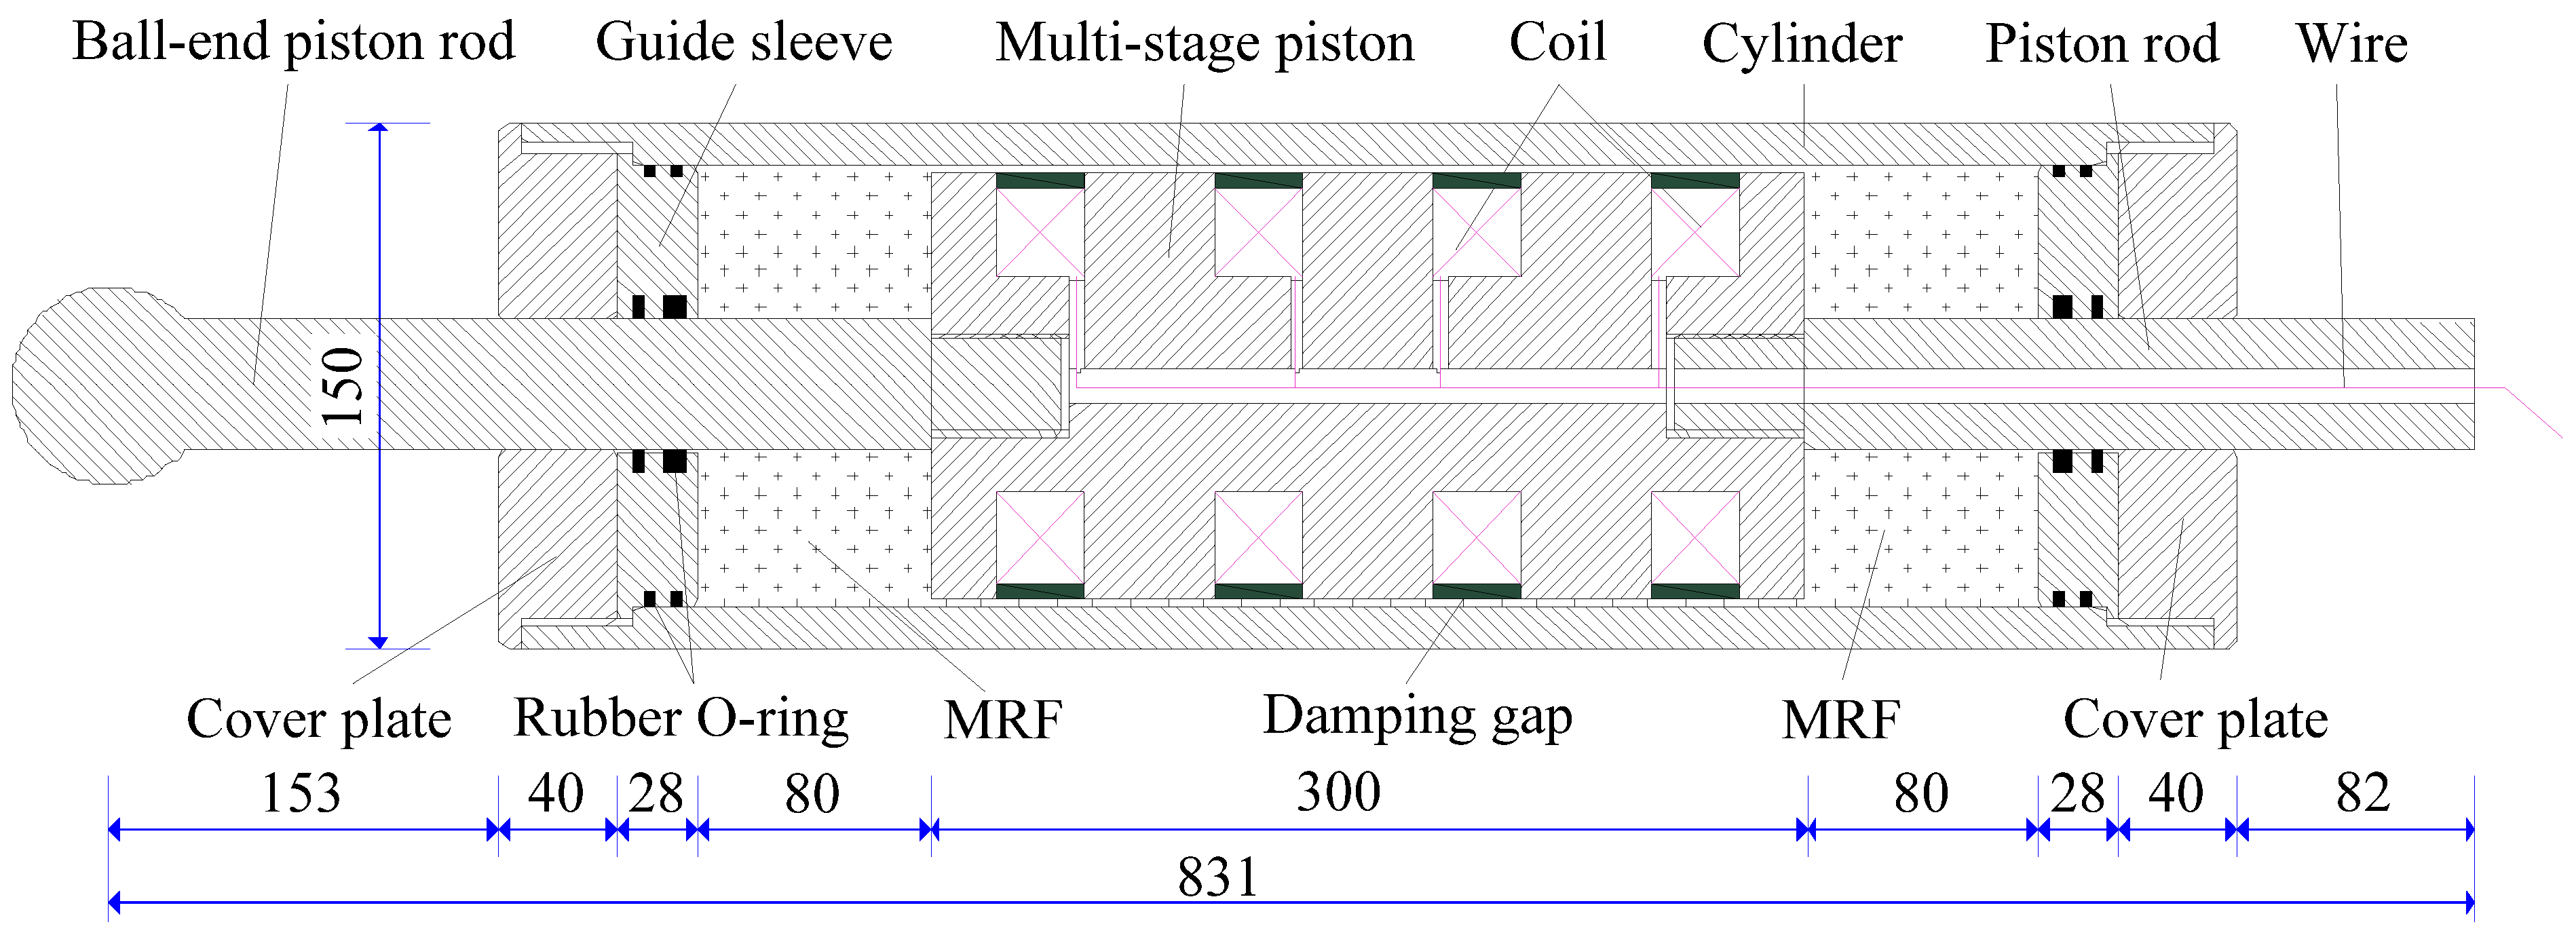
The structure chart of the self-made four-coil shear valve mode MRD is shown in Figure 1. The MRD consists of a multi-stage piston, a piston rod, a cylinder, a guide sleeve, a cover plate, an O-ring, a ball-end piston rod, and coils, in which the multi-stage piston is made of electrical pure iron and the piston rod, cylinder, guide sleeve, cover plate, and cylinder are made of No. 45 steel. The parameters of each part of the MRD are shown in Table 1.
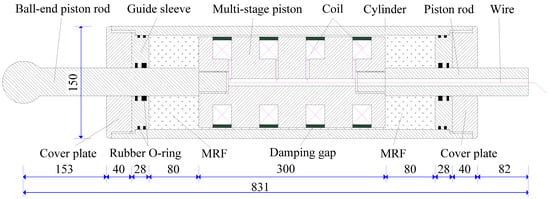
Figure 1.
Structure schematic diagram of the MRD (mm).

Table 1.
The structure parameters of the MRD.
The cavity of the MRD was filled with self-made MRF, whose main components were carbonyl iron power, sodium dodecyl sulfate, and methyl silicone oil. The masses of carbonyl iron powder and methyl silicone oil account for 78% and 20%, respectively. When the shear rate is 100 s−1, the shear stresses of the MRF under different magnetic fields are given in Table 2.
Table 2.
Shear stress of the MRF under different magnetic fields.
2.2. Test Loading of the MRD
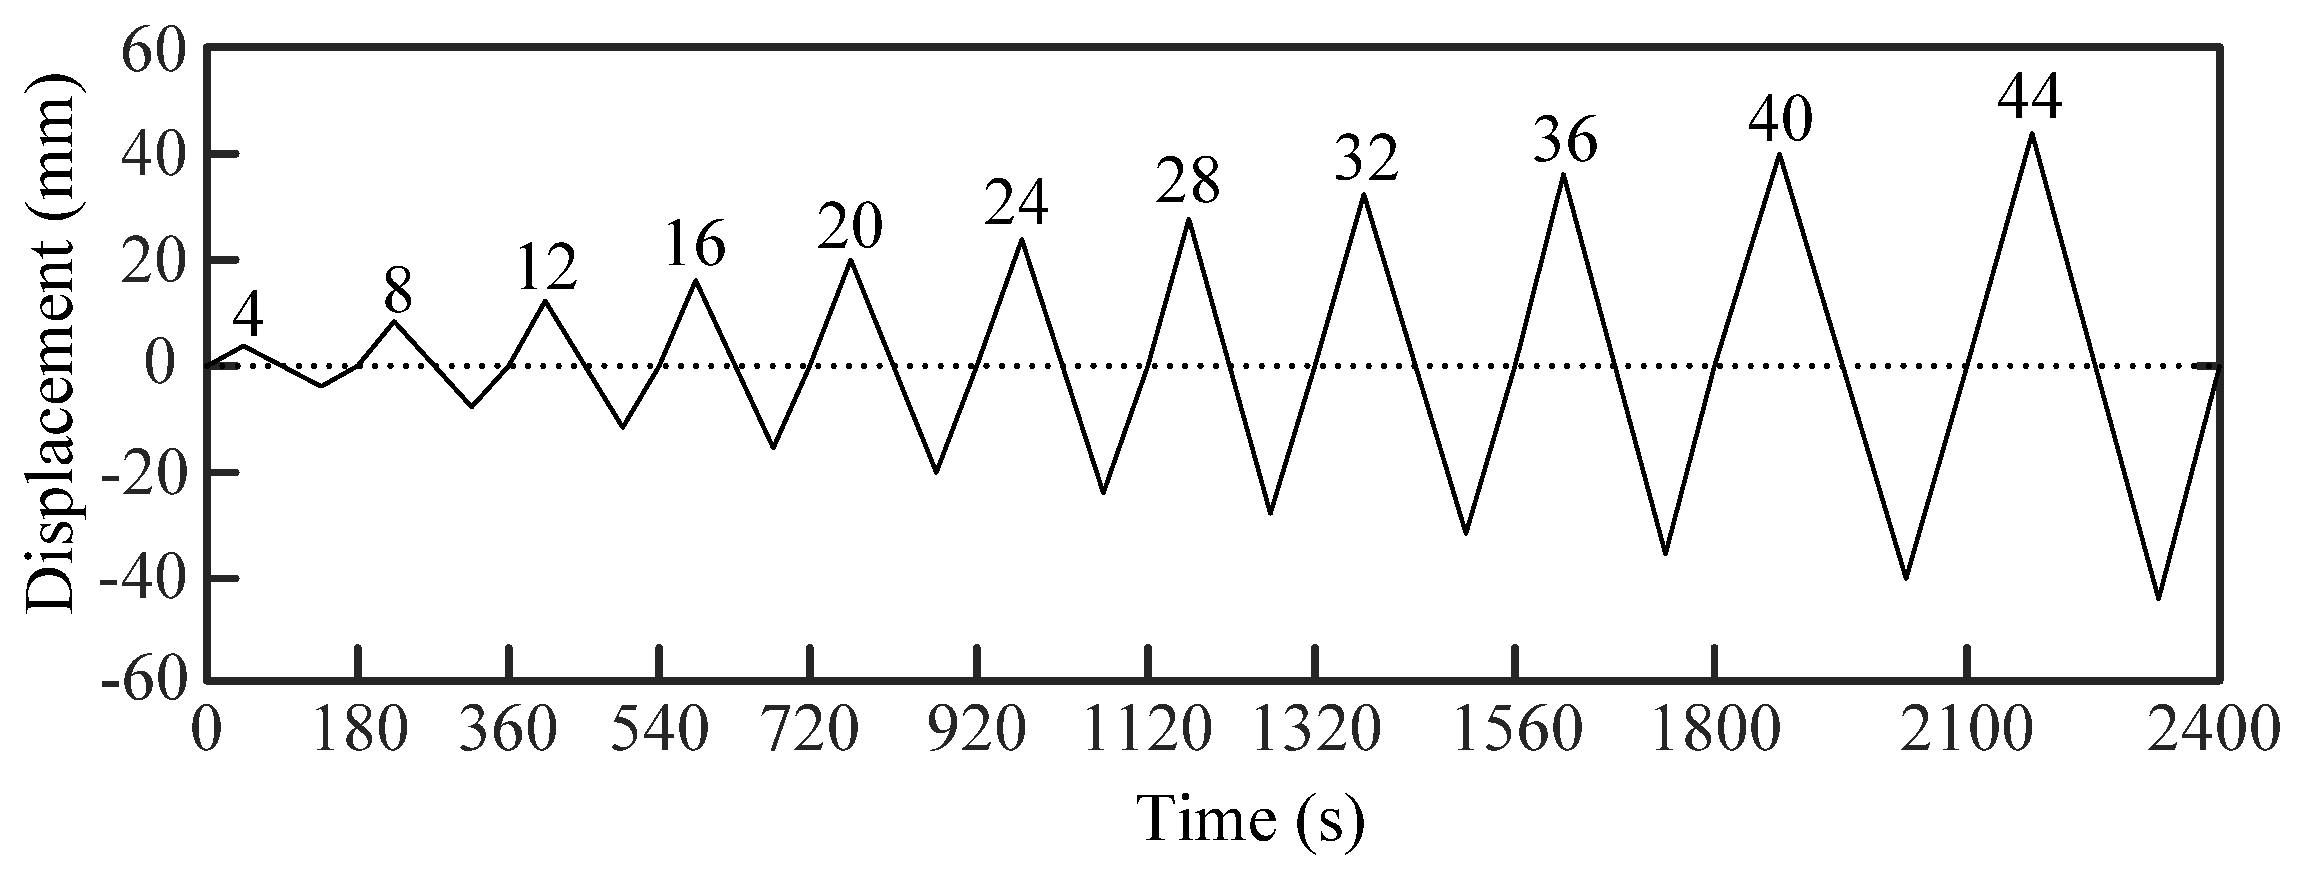
Tests on the MRD were conducted to research the characteristics of the MRD. During the test, the MRD was powered by a regulated DC power supply, and the current levels for the four coils were identical to the current levels from 0 A to 0.28 A at the interval of 0.14 A. For each current level, the MRD was held in a fixed position at one end, while the other end was subjected to a triangular displacement, as shown in Figure 2.

Figure 2.
Loading protocol of the MRD.
2.3. Test Results Analysis
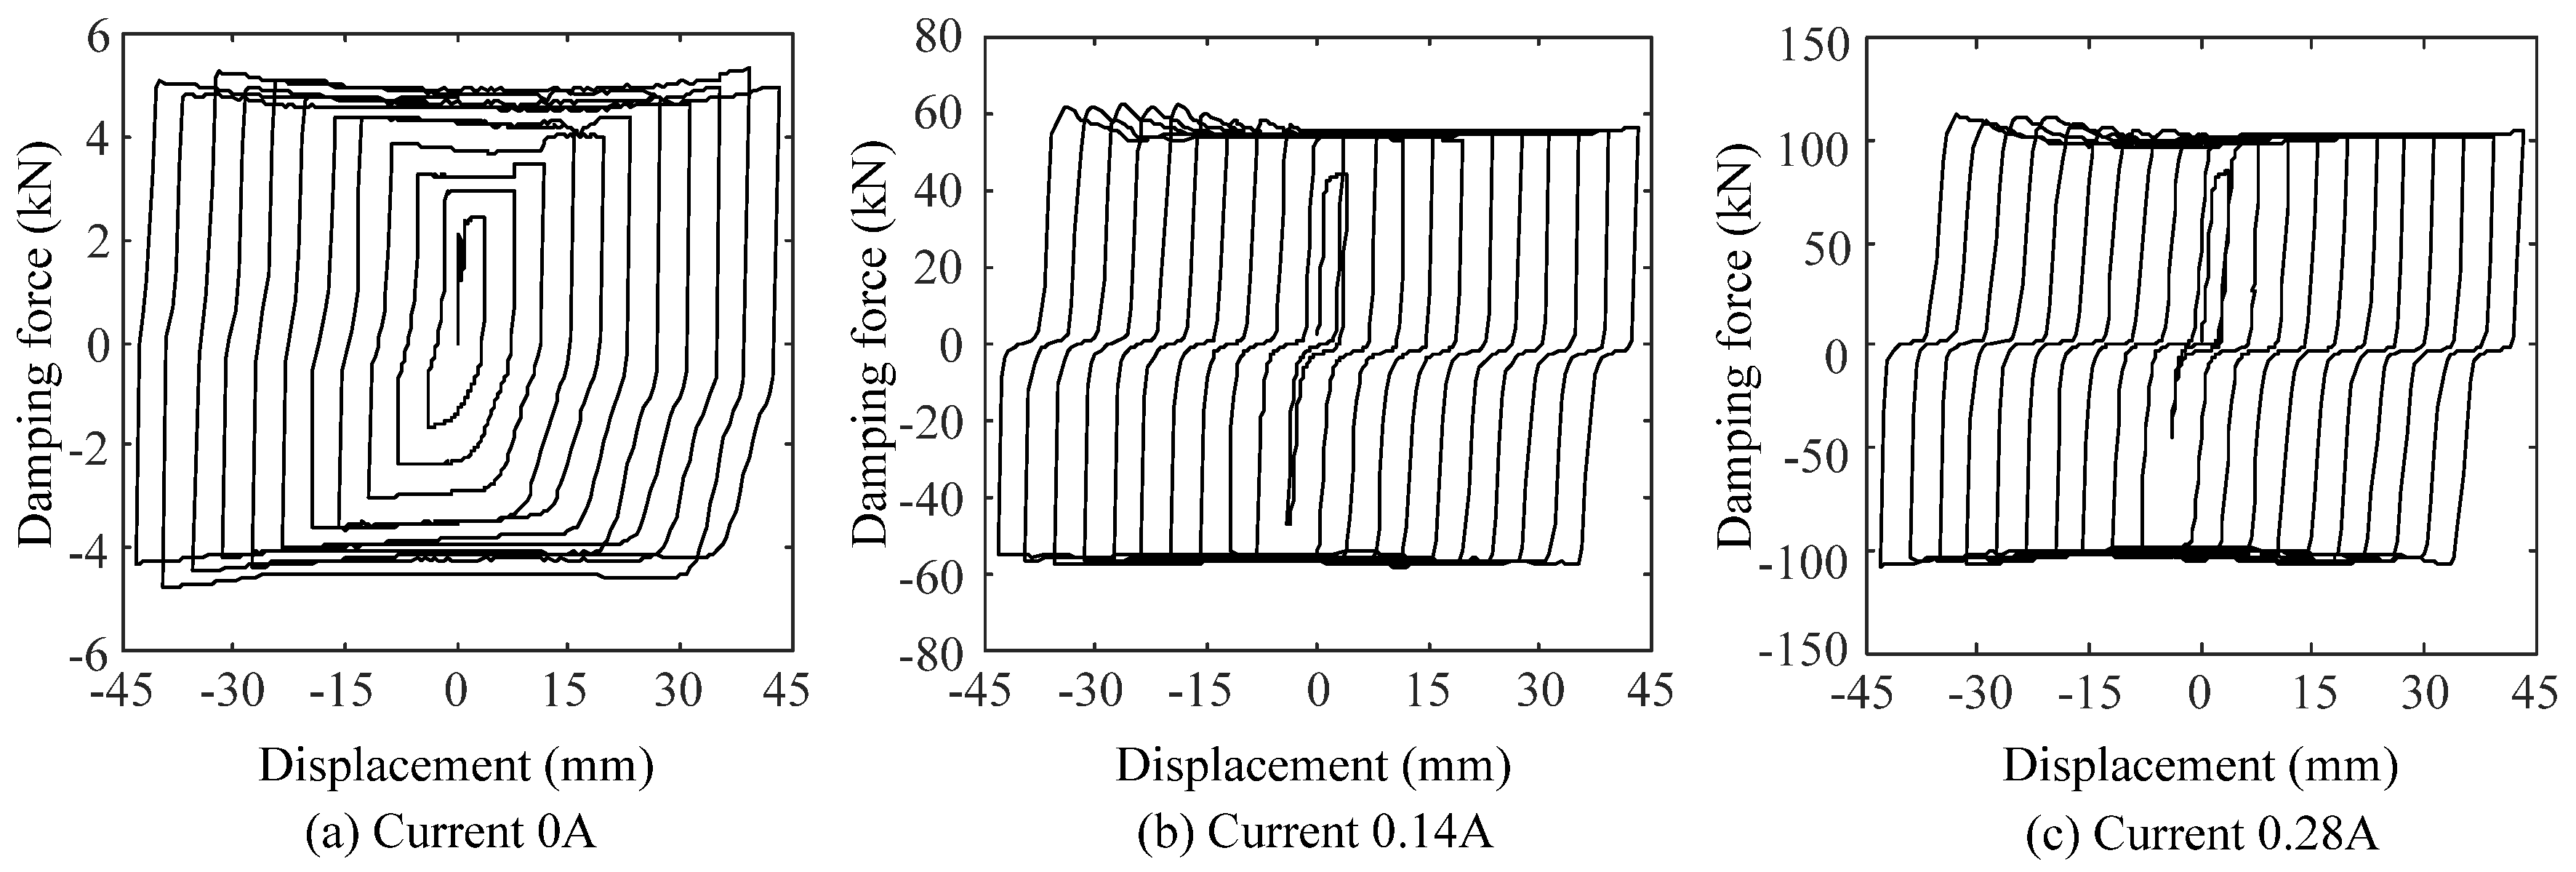
According to the test results, the variation of mechanical performance with current is plotted in Figure 3. As shown in Figure 3a, when the current is 0 A, the minimum damping force provided by the MRD can attain about 3.1 kN, while the maximum damping force can attain about 5.3 kN when the displacement amplitude is 40 mm. As shown in Figure 3c, when the current attains 0.28 A, the minimum damping force provided by the MRD can attain about 80 kN when the displacement amplitude is 4 mm, while the maximum damping force can attain 120 kN when the displacement amplitude is bigger than 4 mm. As seen in Figure 3b,c, in the case of the MRD power supply, the damping force can fluctuate within a certain range after it rises rapidly to the maximum value with the increase of displacement amplitude.
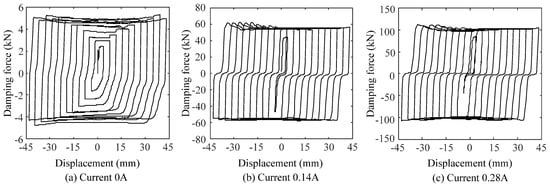
Figure 3.
Damping force-displacement hysteresis curve of the MRD at different currents.
3. Modeling Theory of the L-Shaped Frame Structure
3.1. Theory of Spatial Beam Element
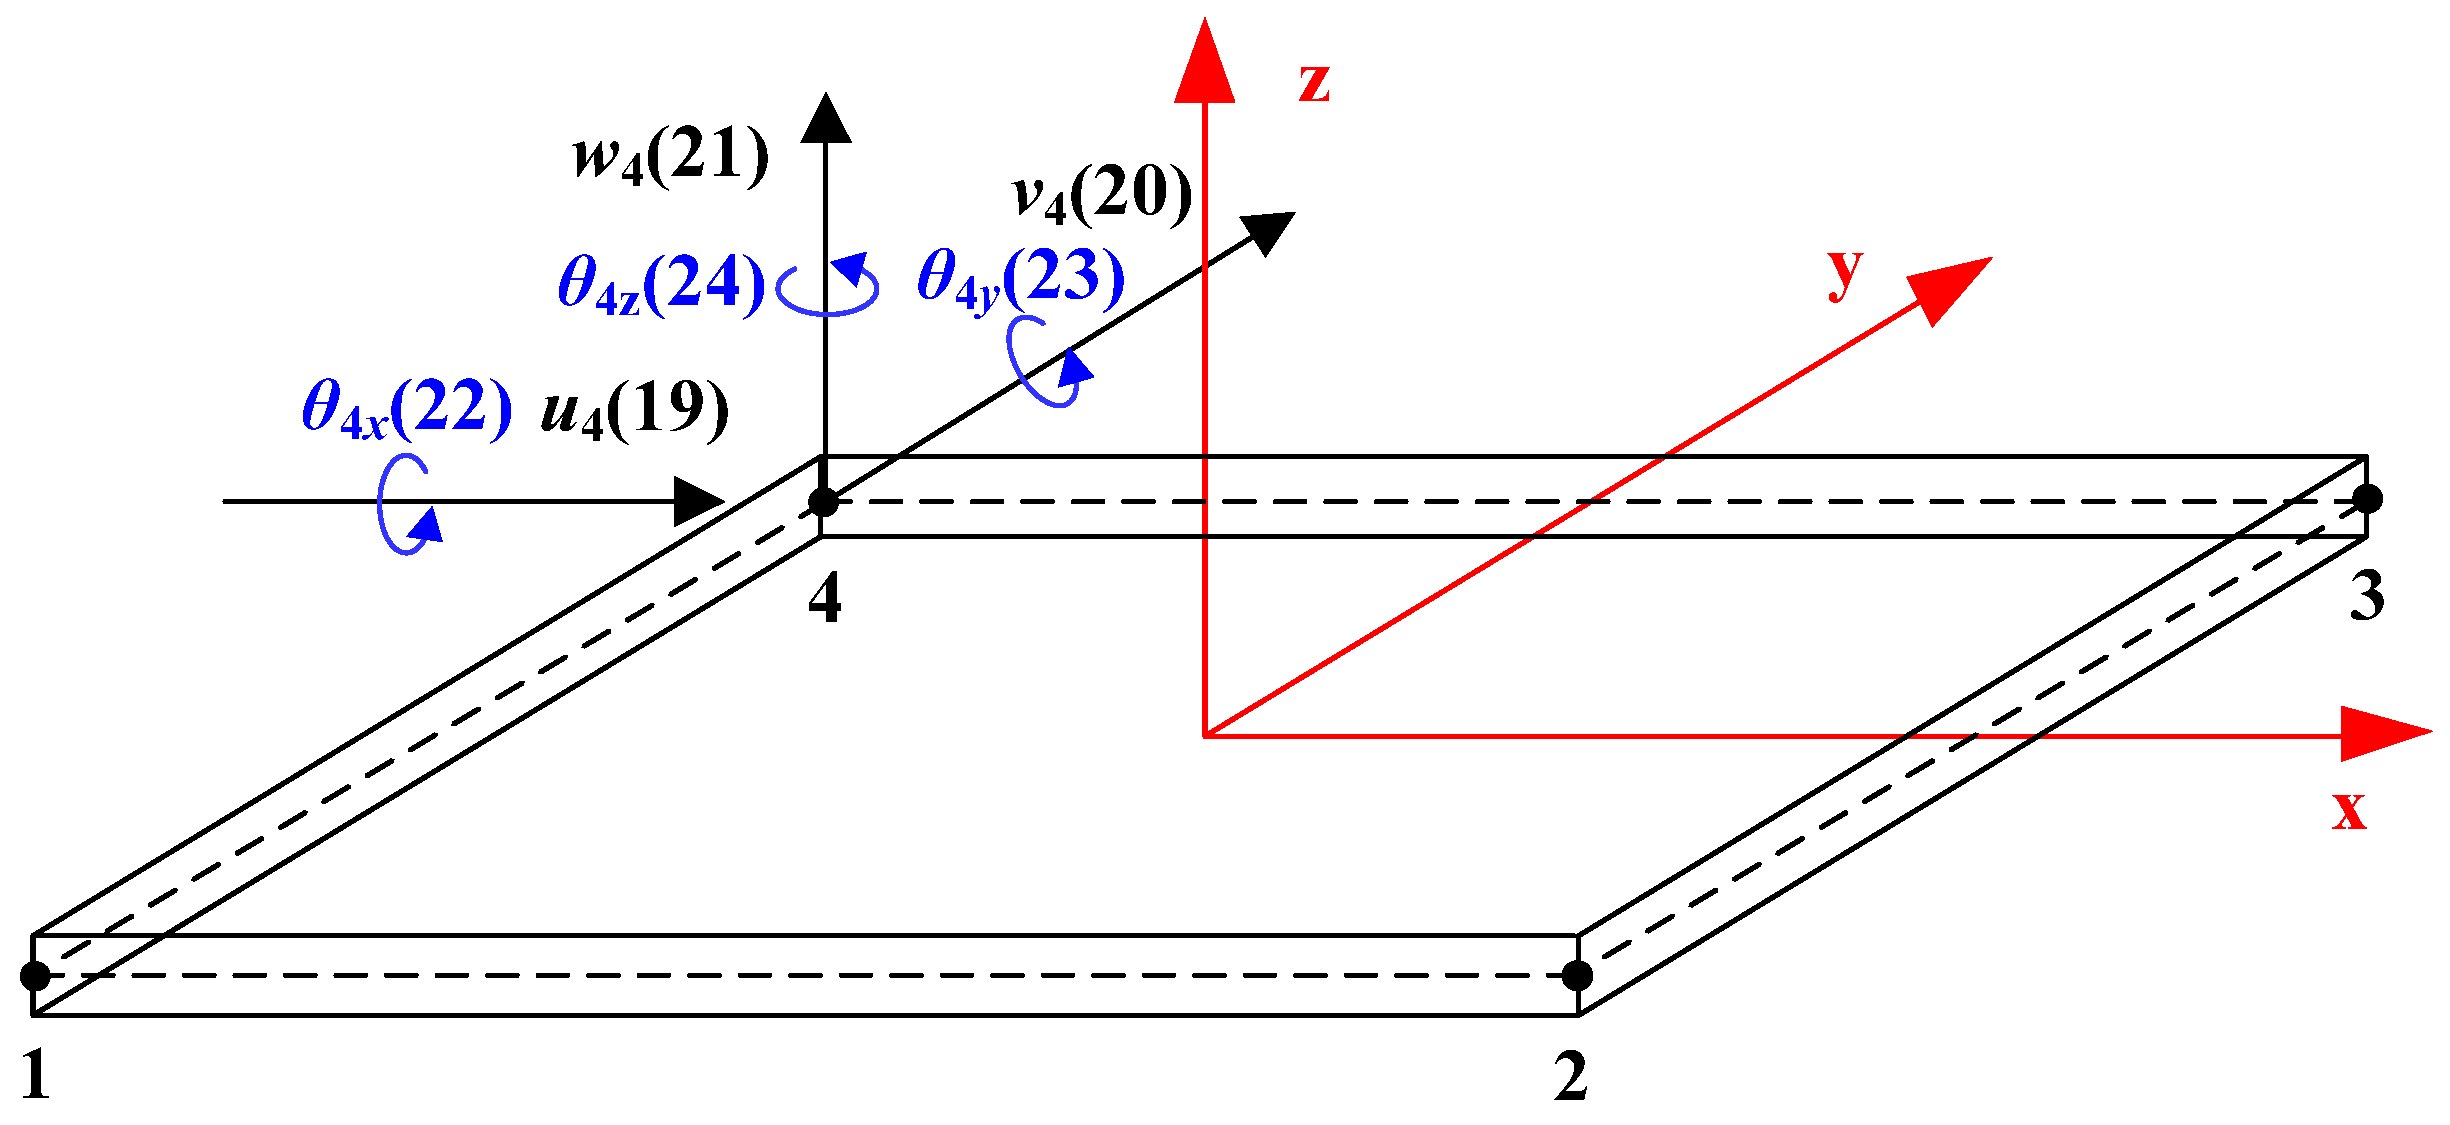
For the spatial beam element, as shown in Figure 4, every node has 6 degrees of freedom (DOFs), where u, v, and w are the axial displacements in x, y, and z directions, respectively; , , and are the angular displacements around x, y, and z directions, respectively. The numbers in brackets in Figure 4 denote the DOF number.
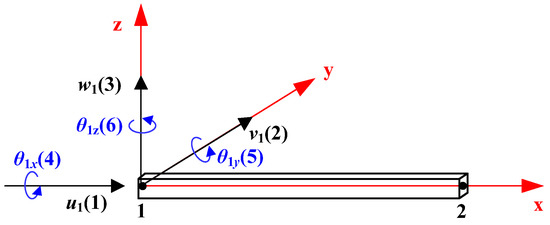
Figure 4.
Node displacement and DOF number of beam element.
According to [33], the stiffness matrix of spatial beam element, considering shear deformation , is as follow:
In Equations (2)–(4), , , , , , , , , , , , .
Where E is the elastic modulus, A is the cross-sectional area, L is the length of the element, I is the cross-sectional inertia moment, G is the shear modulus, μ is Poisson’s ratio, and J is the torsional moment of inertia. The stiffness matrix represents the system of linear equations that must be solved in order to ascertain an approximate solution to the differential equation.
The mass matrix of spatial beam element is as follow [33]:
In Equations (6)–(8), , , , , , , , , , , and ρ is the density.
3.2. Theory of the Shell Element
For the shell element, as shown in Figure 5, each node also has 6 DOFs, and the DOFs of the shell element node are the same as those of the spatial beam element node. The numbers in brackets for Figure 5 denote the DOF number.
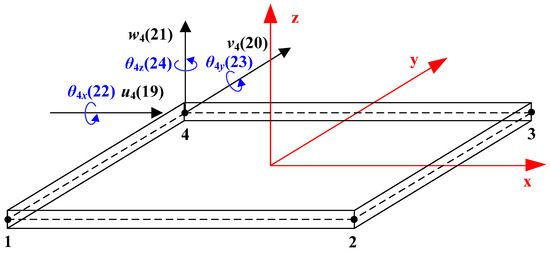
Figure 5.
Node displacement and DOF number of the shell element.
The stiffness [32] of the shell element consists of the membrane stiffness and the bending stiffness . , given in Equation (9), is used to deal with shell element membrane effects, whose corresponding DOFs are u, v and ; given in Equation (10) is used to deal with shell element bending effects, whose corresponding DOFs are w, , and ; and are the submatrices with the dimension of 3 × 3. Then, the shell element stiffness matrix is obtained by combining Equations (9) and (10), the dimension of which is 24 × 24, as shown in Equation (11).
In which
Analogously, the shell element mass matrix [32] is derived in an identical method as the stiffness matrix. The membrane mass matrix given in Equation (13) is used to deal with shell element membrane effects, whose corresponding DOFs are u, v and ; the bending mass matrix given in Equation (14) is used to deal with shell element bending effects, whose corresponding DOFs are w, , . and are the submatrices, with dimensions of 3 × 3. Then, the shell element mass matrix is obtained by combining Equations (13) and (14), the dimension of which is 24 × 24, as shown in Equation (15).
In which
3.3. Coordinate Transformation
The and are element matrices in the local coordinate system (x, y, z), which need to be converted into the element matrices and in the global coordinate system (X, Y, Z) before the total matrix is assembled. and can be given as follow:
where the transformation matrix T can be given as follow:
in which a is equal to 4 and 8 for the spatial beam element and the shell element, respectively. t can be derived according to the direction cosine relationship between the global coordinate system and the local coordinate system.
3.4. Equation of Motion
The equation of motion of the L-shaped structure with MRDs under seismic load can be given as follow:
where M is the mass matrix, C is the Rayleigh damping matrix, K is the stiffness matrix, R is the unit column vector, H is the location matrix of the MRD, is the acceleration vector of the structure, is the acceleration vector of seismic ground motion, and F is the control force matrix of the MRD.
3.5. Semi-Active Control Algorithm
At present, the classical linear quadratic control algorithm is mostly used to solve for the optimal control force [34]. In this algorithm, the optimal control force U is selected through the following performance indicators.
where the diagonal positive definite matrix R, with the dimension of m × m, is the weighting matrix for the control matrix, where m is the number of MRDs, the diagonal positive semidefinite matrix Q0, and the diagonal positive definite matrix Q are the weighting matrix for the response of the structure, and Z is the state vector of the controlled system. The optimal control question of the system state is to find the optimal control vector in an infinite time interval; the optimal control force can be given as follows:
in which the solution of the Riccati matrix algebraic equation P is as follows:
In which, , , , .
In which α and β can be obtained through trial calculation, and I is the unit matrix with the dimension of m × m.
As can be seen in Section 2, the minimum and maximum damping forces of the MRD are Fmin = 3.1 kN and Fmax = 120 kN when the current is 0 A and 0.28 A, respectively; therefore, the damping force range of the MRD is 3.1 to 120 kN, as shown in Figure 4. The optimal control force should be regulated when it surpasses the adjustable range of the damping force developed by the MRD, or it is opposite to the relative displacement direction of the two ends of the MRD. In addition, some scholars have found that a real-time controlled MRD can trace the required damping force well [35,36,37]. Thus, the semi-active control strategy for adjusting the optimal control force is shown in Equation (24).
where Ui is the optimal control force of the ith MRD, ui is the relative displacement at both ends of the ith MRD, and Fi is the damping force provided by a single MRD on the ith chevron support [38].
3.6. Determination of the MRD Location Matrix
Due to the fact that the damping force of the MRD is relatively small, two dampers are arranged on each chevron support, as seen in Figure 6. There are the following relationships between the damping force of MRD and the force on the corresponding nodes of the structure:
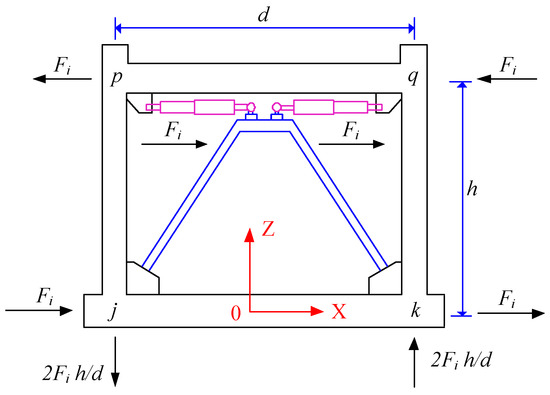
Figure 6.
The schematic diagram of damping force distribution.
The location matrix H is used to distribute the control force vector F of the MRD to the corresponding nodes of the structure, whose dimension is n × m, in which n is the amount of the structural DOFs, and m is the number of MRDs [39,40]. For the MRDs on the ith chevron support, as shown in Figure 6, the elements corresponding to nodes j and k in location matrix H are: , , and the elements corresponding to nodes p and q in location matrix H are: , while the others without damping force are all 0.
4. Model Description and Verification
4.1. Model Description
The calculation model of the L-shaped frame structure with MRDs is presented in Figure 7. The L-shaped frame structure has ten floors with a total height of 34.5 m. The heights between the first and the third floors are 4.5 m, and the heights of the other floors are 3.0 m. The column spacing in the X direction is 6.3, 4.5, and 4.5 m, and column spacing in the Y direction is all 6.3 m. The cross-sectional sizes of X directional beams are 0.25 × 0.65, 0.25 × 0.6, and 0.25 × 0.6 m, and those of Y directional beams are all 0.3 × 0.7 m. The cross-sectional sizes of columns of 1 to 3 floors are 0.7 × 0.7 m, and those of other floors are 0.6 × 0.6 m. The thickness of all floors is 0.12 m; Poisson’s ratio μ = 0.2, elastic modulus E = 3.25 × 10⁴ N/mm2, and density ρ = 2500 kg/m3. Assuming the damping ratios of the first- to second-order vibration modes of the structure are set to 5%, the bottom columns are assumed to be consolidated. As the deformation of frame structure under seismic load is mainly concentrated in the bottom floors, the MRDs are, therefore, set on the first to sixth floors, as seen in Figure 7. Numbers in brackets of Figure 7 indicate the node number.
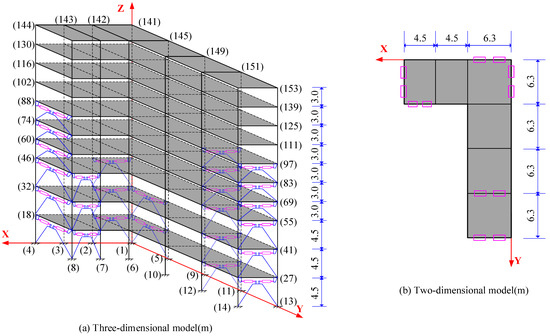
Figure 7.
Calculation model of the L-shaped frame structure with MRDs.
4.2. Model Verification
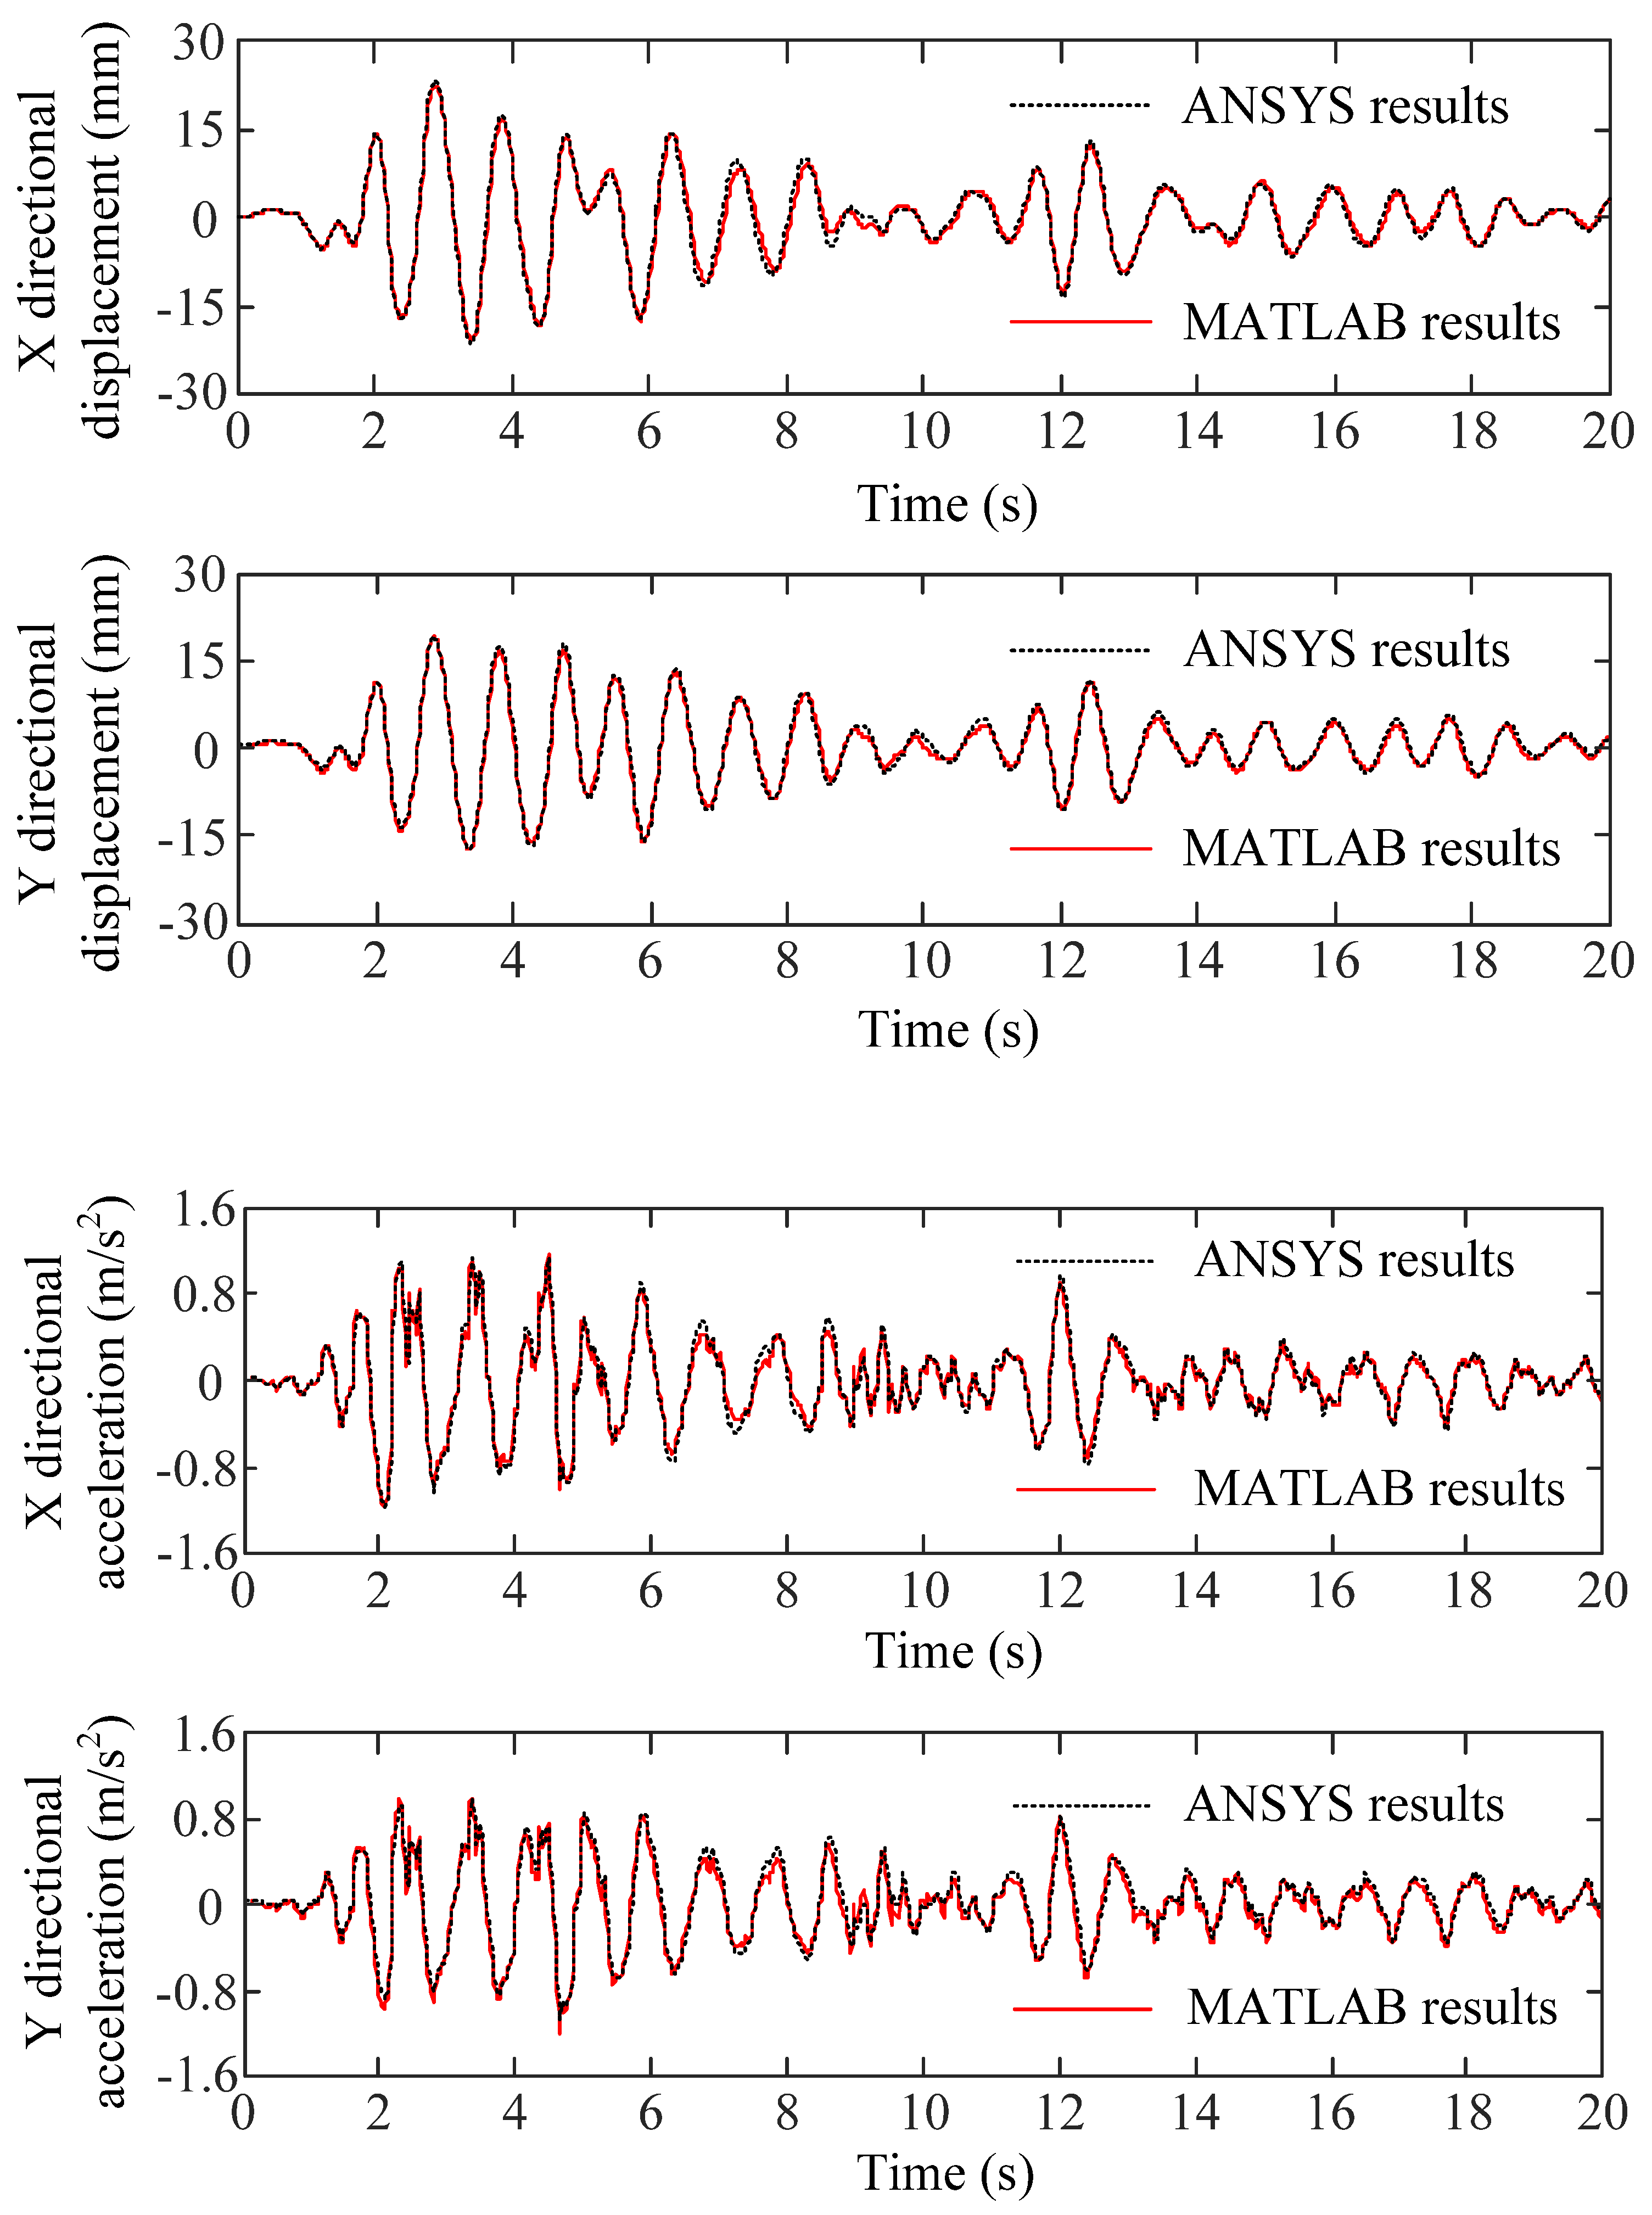
According to the theories and methods described in Section 3.1, Section 3.2, Section 3.3 and Section 3.4, the programs of the calculation model of the L-shaped frame structure with and without MRDs were compiled by MATLAB software. For verifying the validity of the programs, the model of the L-shaped frame structure is set up by ANSYS, which is the finite element software, in which the BEAM188 element is used for beams and columns and the SHELL 181 element is used for plates. The material parameters and geometry in the ANSYS model are the same as in the self-compiled program. For the ANSYS model and the self-compiled program, each beam and column is divided into 5 and 1 elements. The El-Centro wave, whose maximum acceleration is 0.7 m/s2, is adopted in both the ANSYS model and the self-compiled program, and the peak acceleration ratio of the seismic wave in the horizontal direction is X:Y = 1:0.85. Contrasts of the dynamic response of Node 141 of the self-compiled program and the ANSYS model are shown in Figure 8.
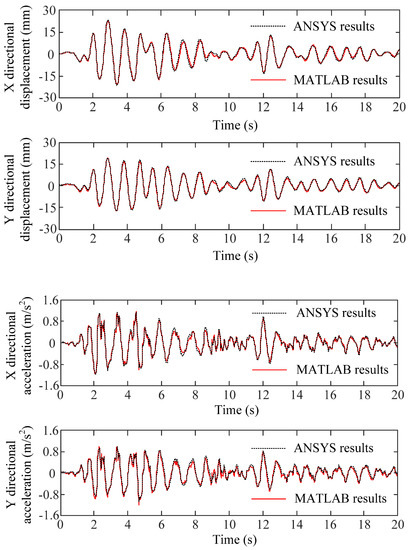
Figure 8.
Contrasts of time history response of Node 141 between the self-compiled program and the ANSYS model.
As seen in Figure 8, throughout the duration of the El-Centro wave, the dynamic responses of the two models of Node 141 are basically consistent. Numerically, the relative errors of the maximum displacement in the horizontal bi-direction are 2.33% and 2.32%; the relative errors of the maximum acceleration in the horizontal bi-direction are −0.95% and −0.52%. Moreover, the contrasts of the maximum displacement and acceleration of representative nodes between the ANSYS model and the self-compiled program can be seen in Table 3 and Table 4.
Table 3.
Contrasts of the maximum displacement of the nodes between the self-compiled program and the ANSYS model.
Table 4.
Contrasts of the maximum acceleration of the nodes between the self-compiled program and the ANSYS model.
5. Analysis and Interpretation of Results
In this part, the compiled programs are used for calculating the time history response of the L-shaped frame structure with and without MRDs, and the seismic excitations are the Kobe wave and the Taft wave, whose peak accelerations are 2 m/s2 and the peak acceleration ratio of the seismic wave in the horizontal bi-direction is X:Y = 1:0.85. Through the trial calculation [41], the value of weight matrix coefficients , of the LQR control algorithm is set to = 100 and = 3.5 × 10⁻⁵.
5.1. Results Analysis on Multi-Dimensional Vibration Reduction of the Structure
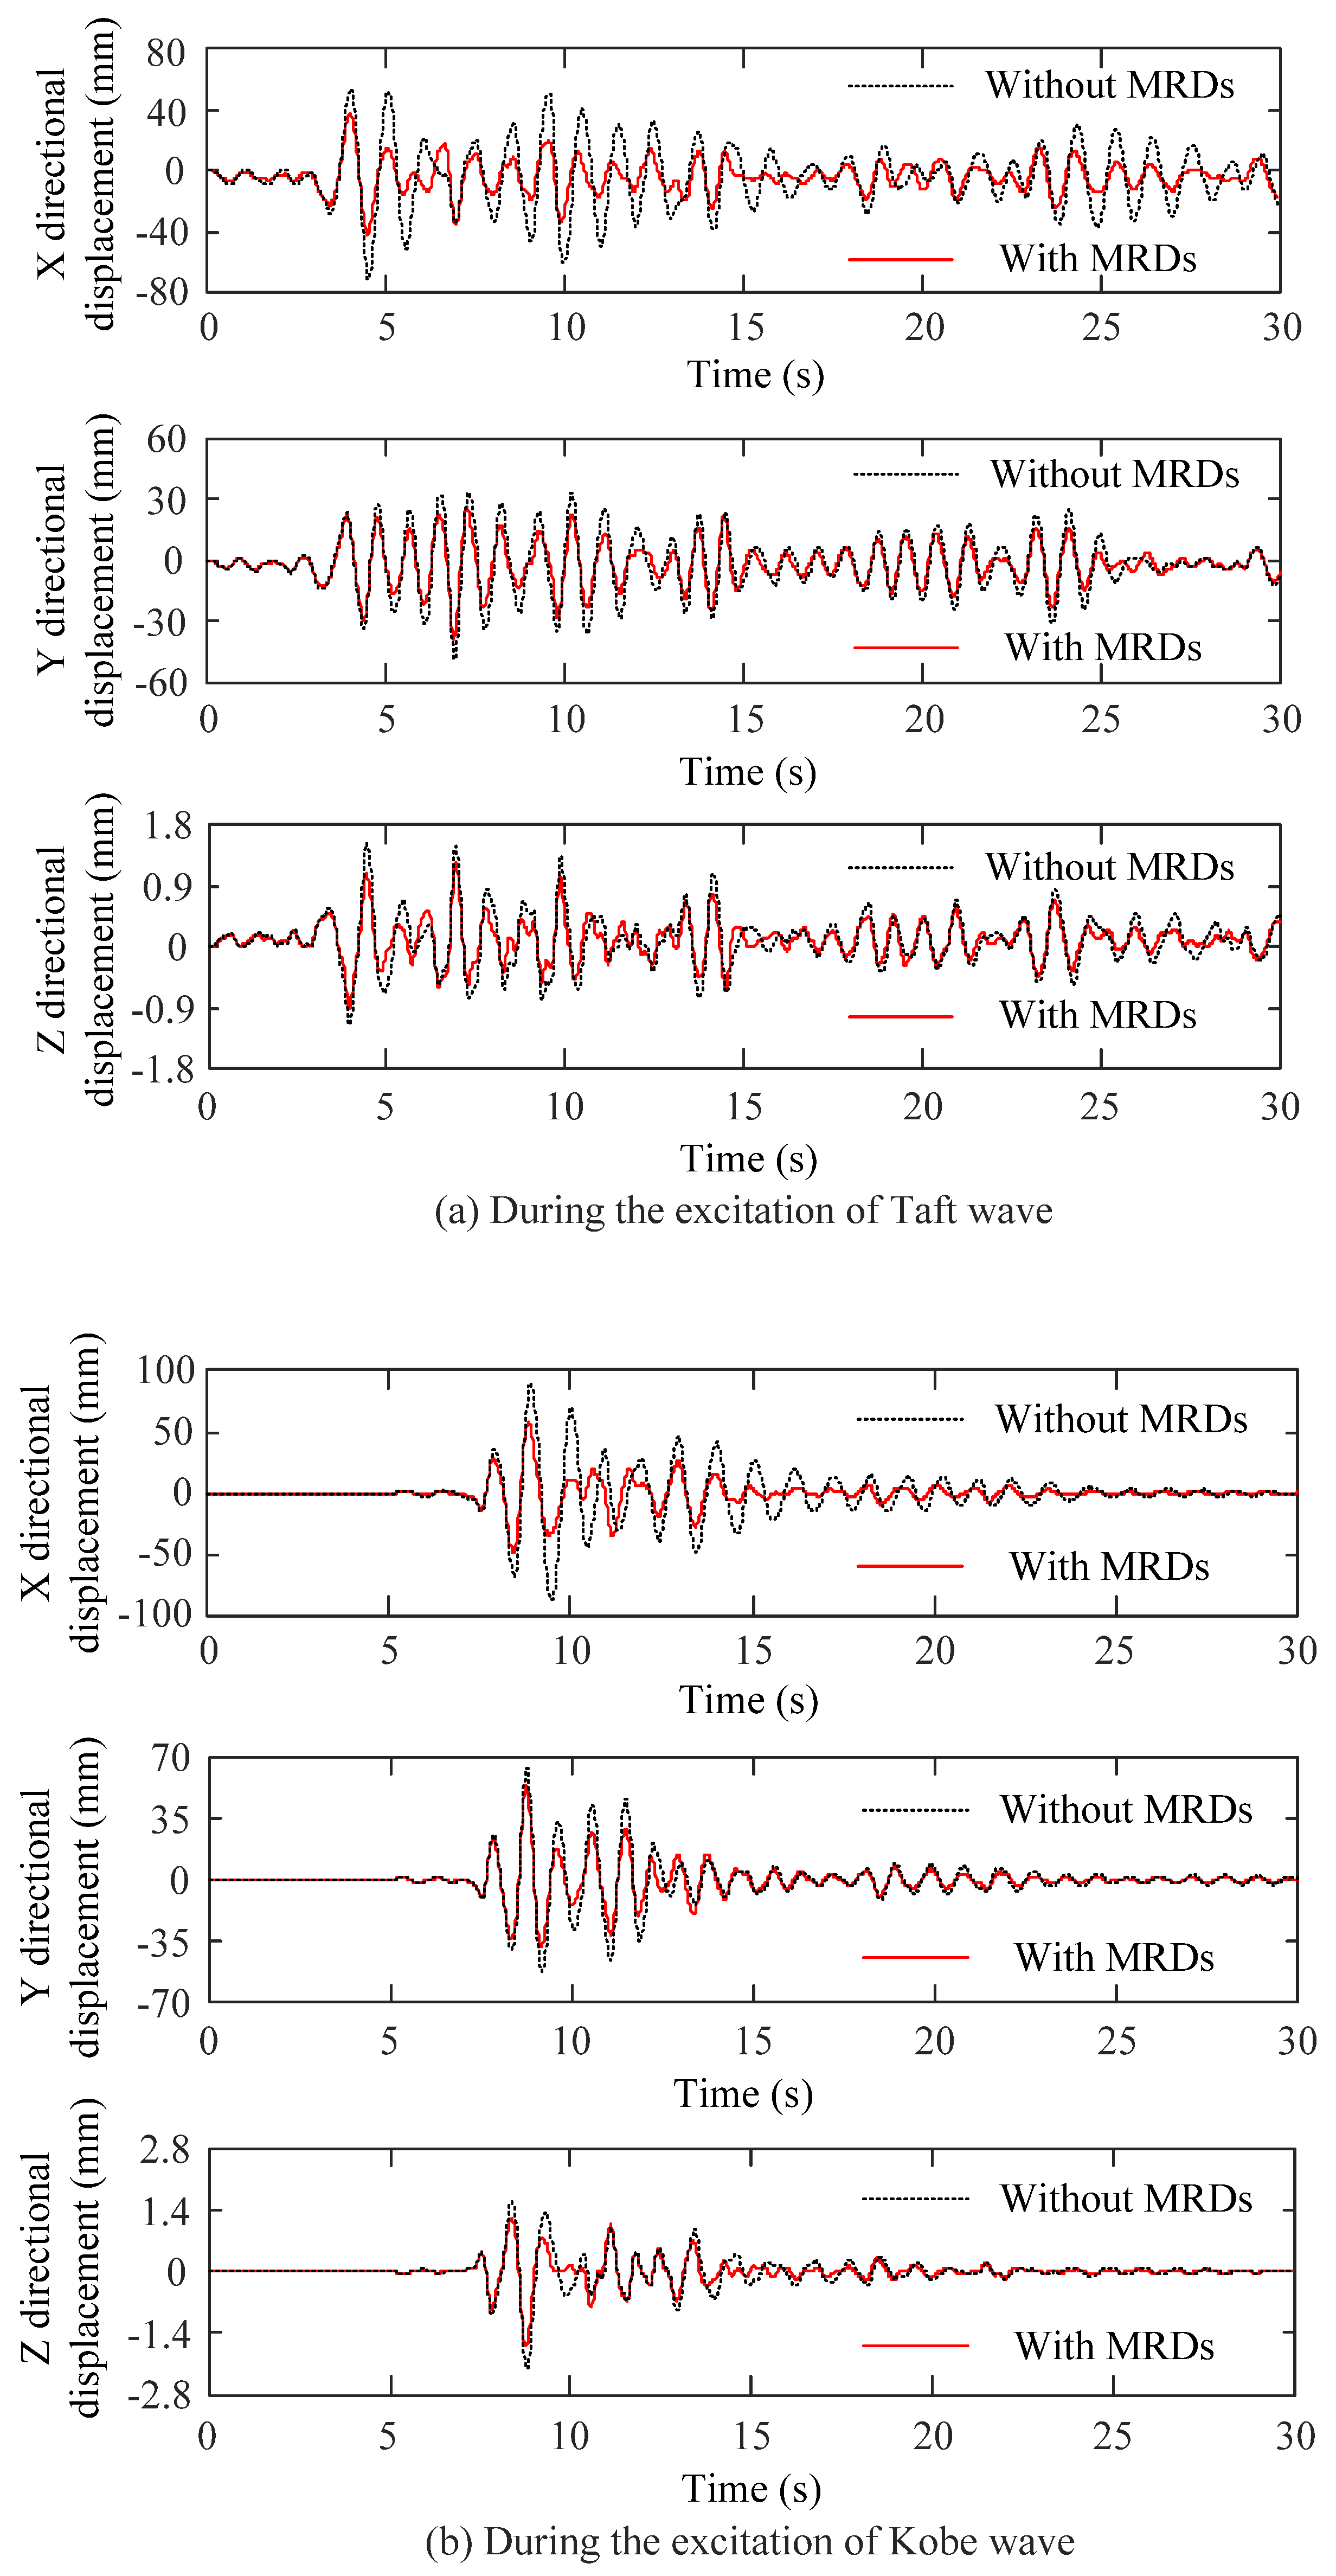
Throughout the duration of seismic waves, contrasts on the dynamic displacement response of Node 154 of the L-shaped frame structure with and without MRDs are plotted in Figure 9. As seen in Figure 9, during the action time of the Taft wave, in contrast with the structure without MRDs, the three-directional displacement responses of Node 154 of the structure with MRDs are decreased significantly. The three-directional maximum displacements of Node 154 of the structure without MRDs are 71.79, 48.27, and 1.51 mm, respectively, and those with MRDs are 42.36, 38.42, and 1.25 mm, which are decreased by 41.01%, 20.41%, and 17.36%, respectively [42]. During the action time of the Kobe wave, the three-directional maximum displacements of Node 154 of the structure without MRDs are 89.56, 64.13, and 2.20 mm, and those with MRDs are 57.41, 53.87, and 1.68 mm, which are decreased by 35.90%, 16.01%, and 23.58%, respectively.
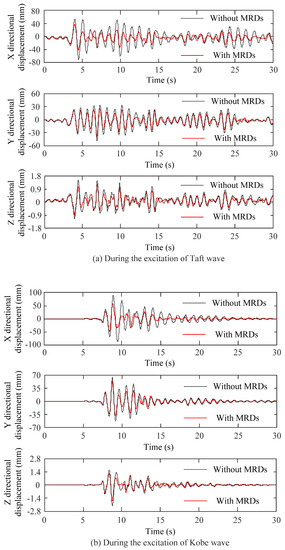
Figure 9.
Contrasts of displacement response of Node 154 of the structure with and without MRDs.
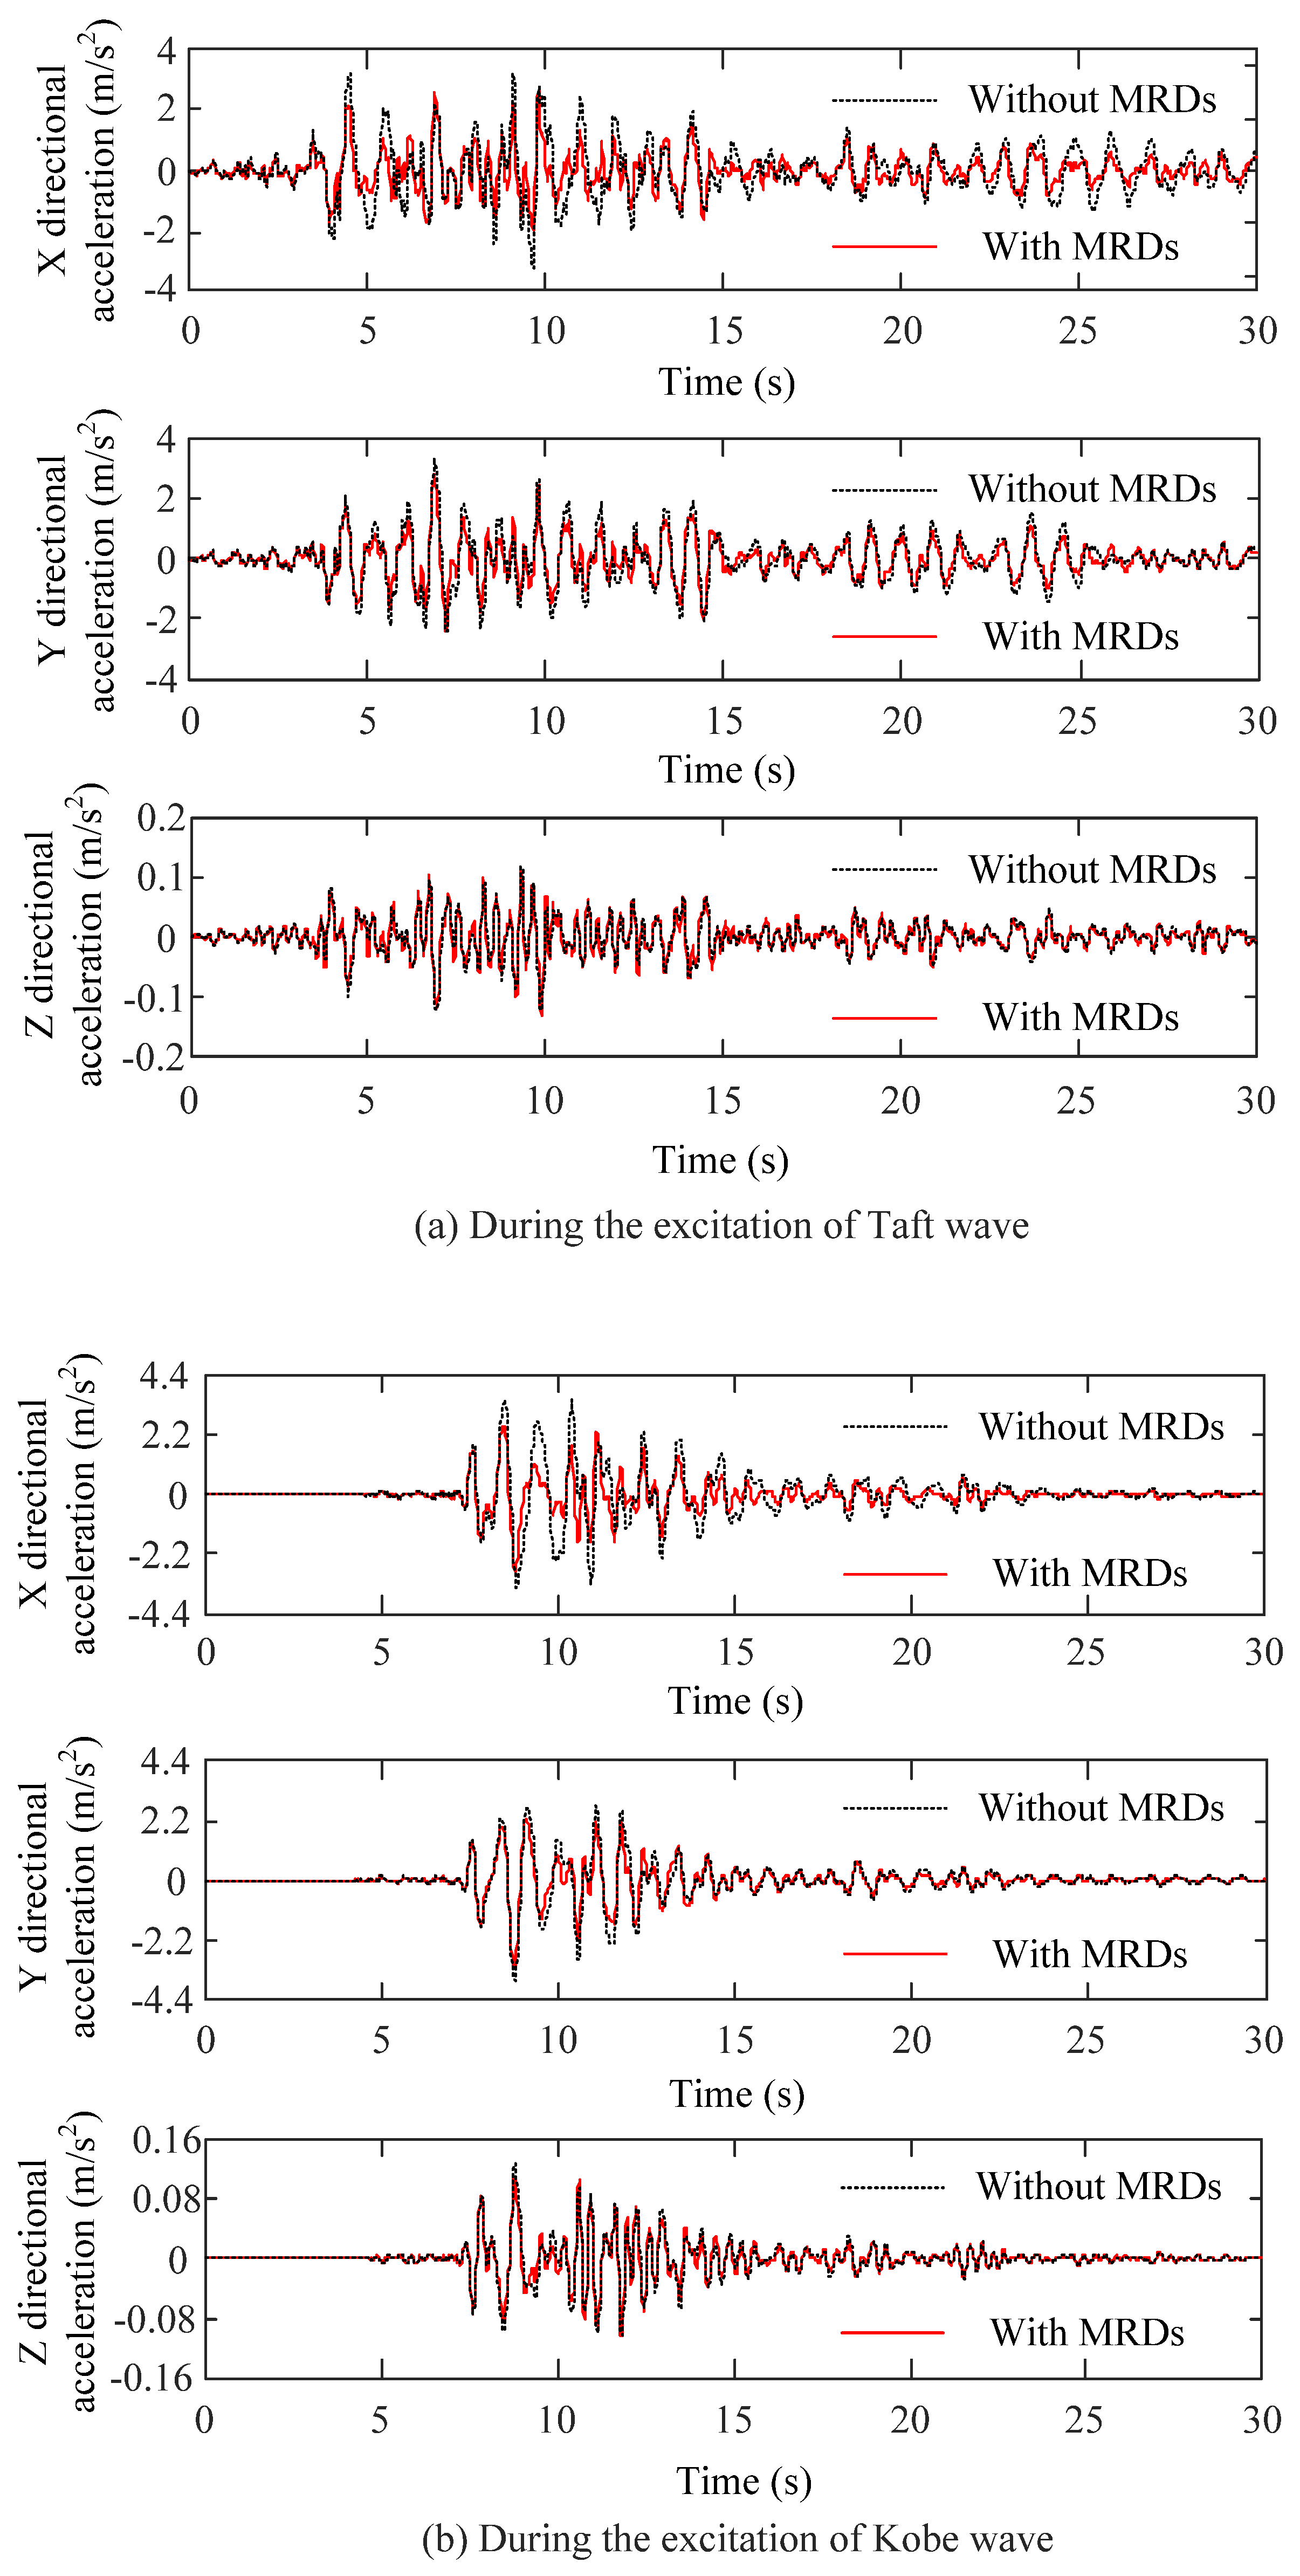
Under the excitation of seismic waves, contrasts on the dynamic acceleration response of Node 154 of the L-shaped frame structure with and without MRDs are plotted in Figure 10. As shown in Figure 10, during the action time of the Taft wave, in contrast with the structure without MRDs, the three-directional acceleration responses of Node 154 of the structure with MRDs are significantly decreased [43]. The three-directional maximum accelerations of Node 154 of the structure without MRDs are 3.29, 3.35, and 0.13 m/s2, respectively, and those with MRDs are 2.77, 2.91, and 0.12 m/s2, which are decreased by 15.87%, 13.03%, and 5.31%, respectively. During the action time of the Kobe wave, the three-directional maximum accelerations of Node 154 of the structure without MRDs are 3.56, 3.70, and 0.13 m/s2, and those with MRDs are 2.87, 3.21, and 0.11 m/s2, which are decreased by 19.35%, 13.29%, and 12.32%, respectively.

Figure 10.
Contrasts of acceleration response of Node 154 of the structure with and without MRDs.
According to the differential equation of motion of the MRD damping structure [32], a control force matrix will be added because of the setting of MRDs in the structure; it is equivalent to increasing the stiffness and damping of the structure, and both of them can reduce the displacement response of the structure under the action of seismic waves; hence, by setting the MRD in the structure, the displacement control effect of the structure is very obvious, as shown in Figure 9 and Figure 11. However, increasing the damping and stiffness of the structure has the opposite effect on the acceleration response of the structure under the action of seismic waves. Therefore, setting the MRD in the structure, the acceleration control effect of the structure is relatively general, as shown in Figure 10 and Figure 11. Since there are no MRDs in the Z direction, the displacement and acceleration responses in the Z direction are relatively small.
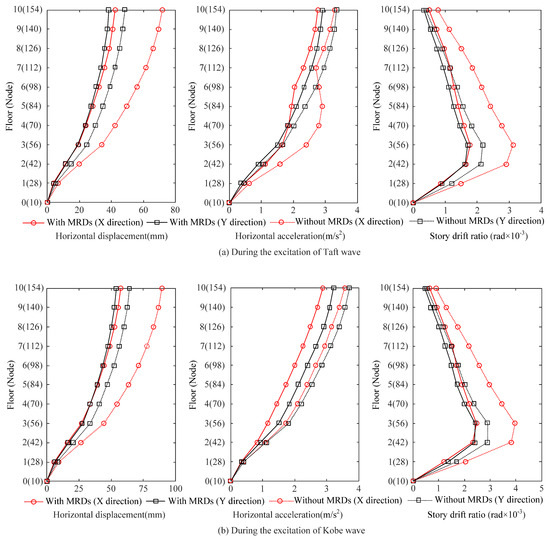
Figure 11.
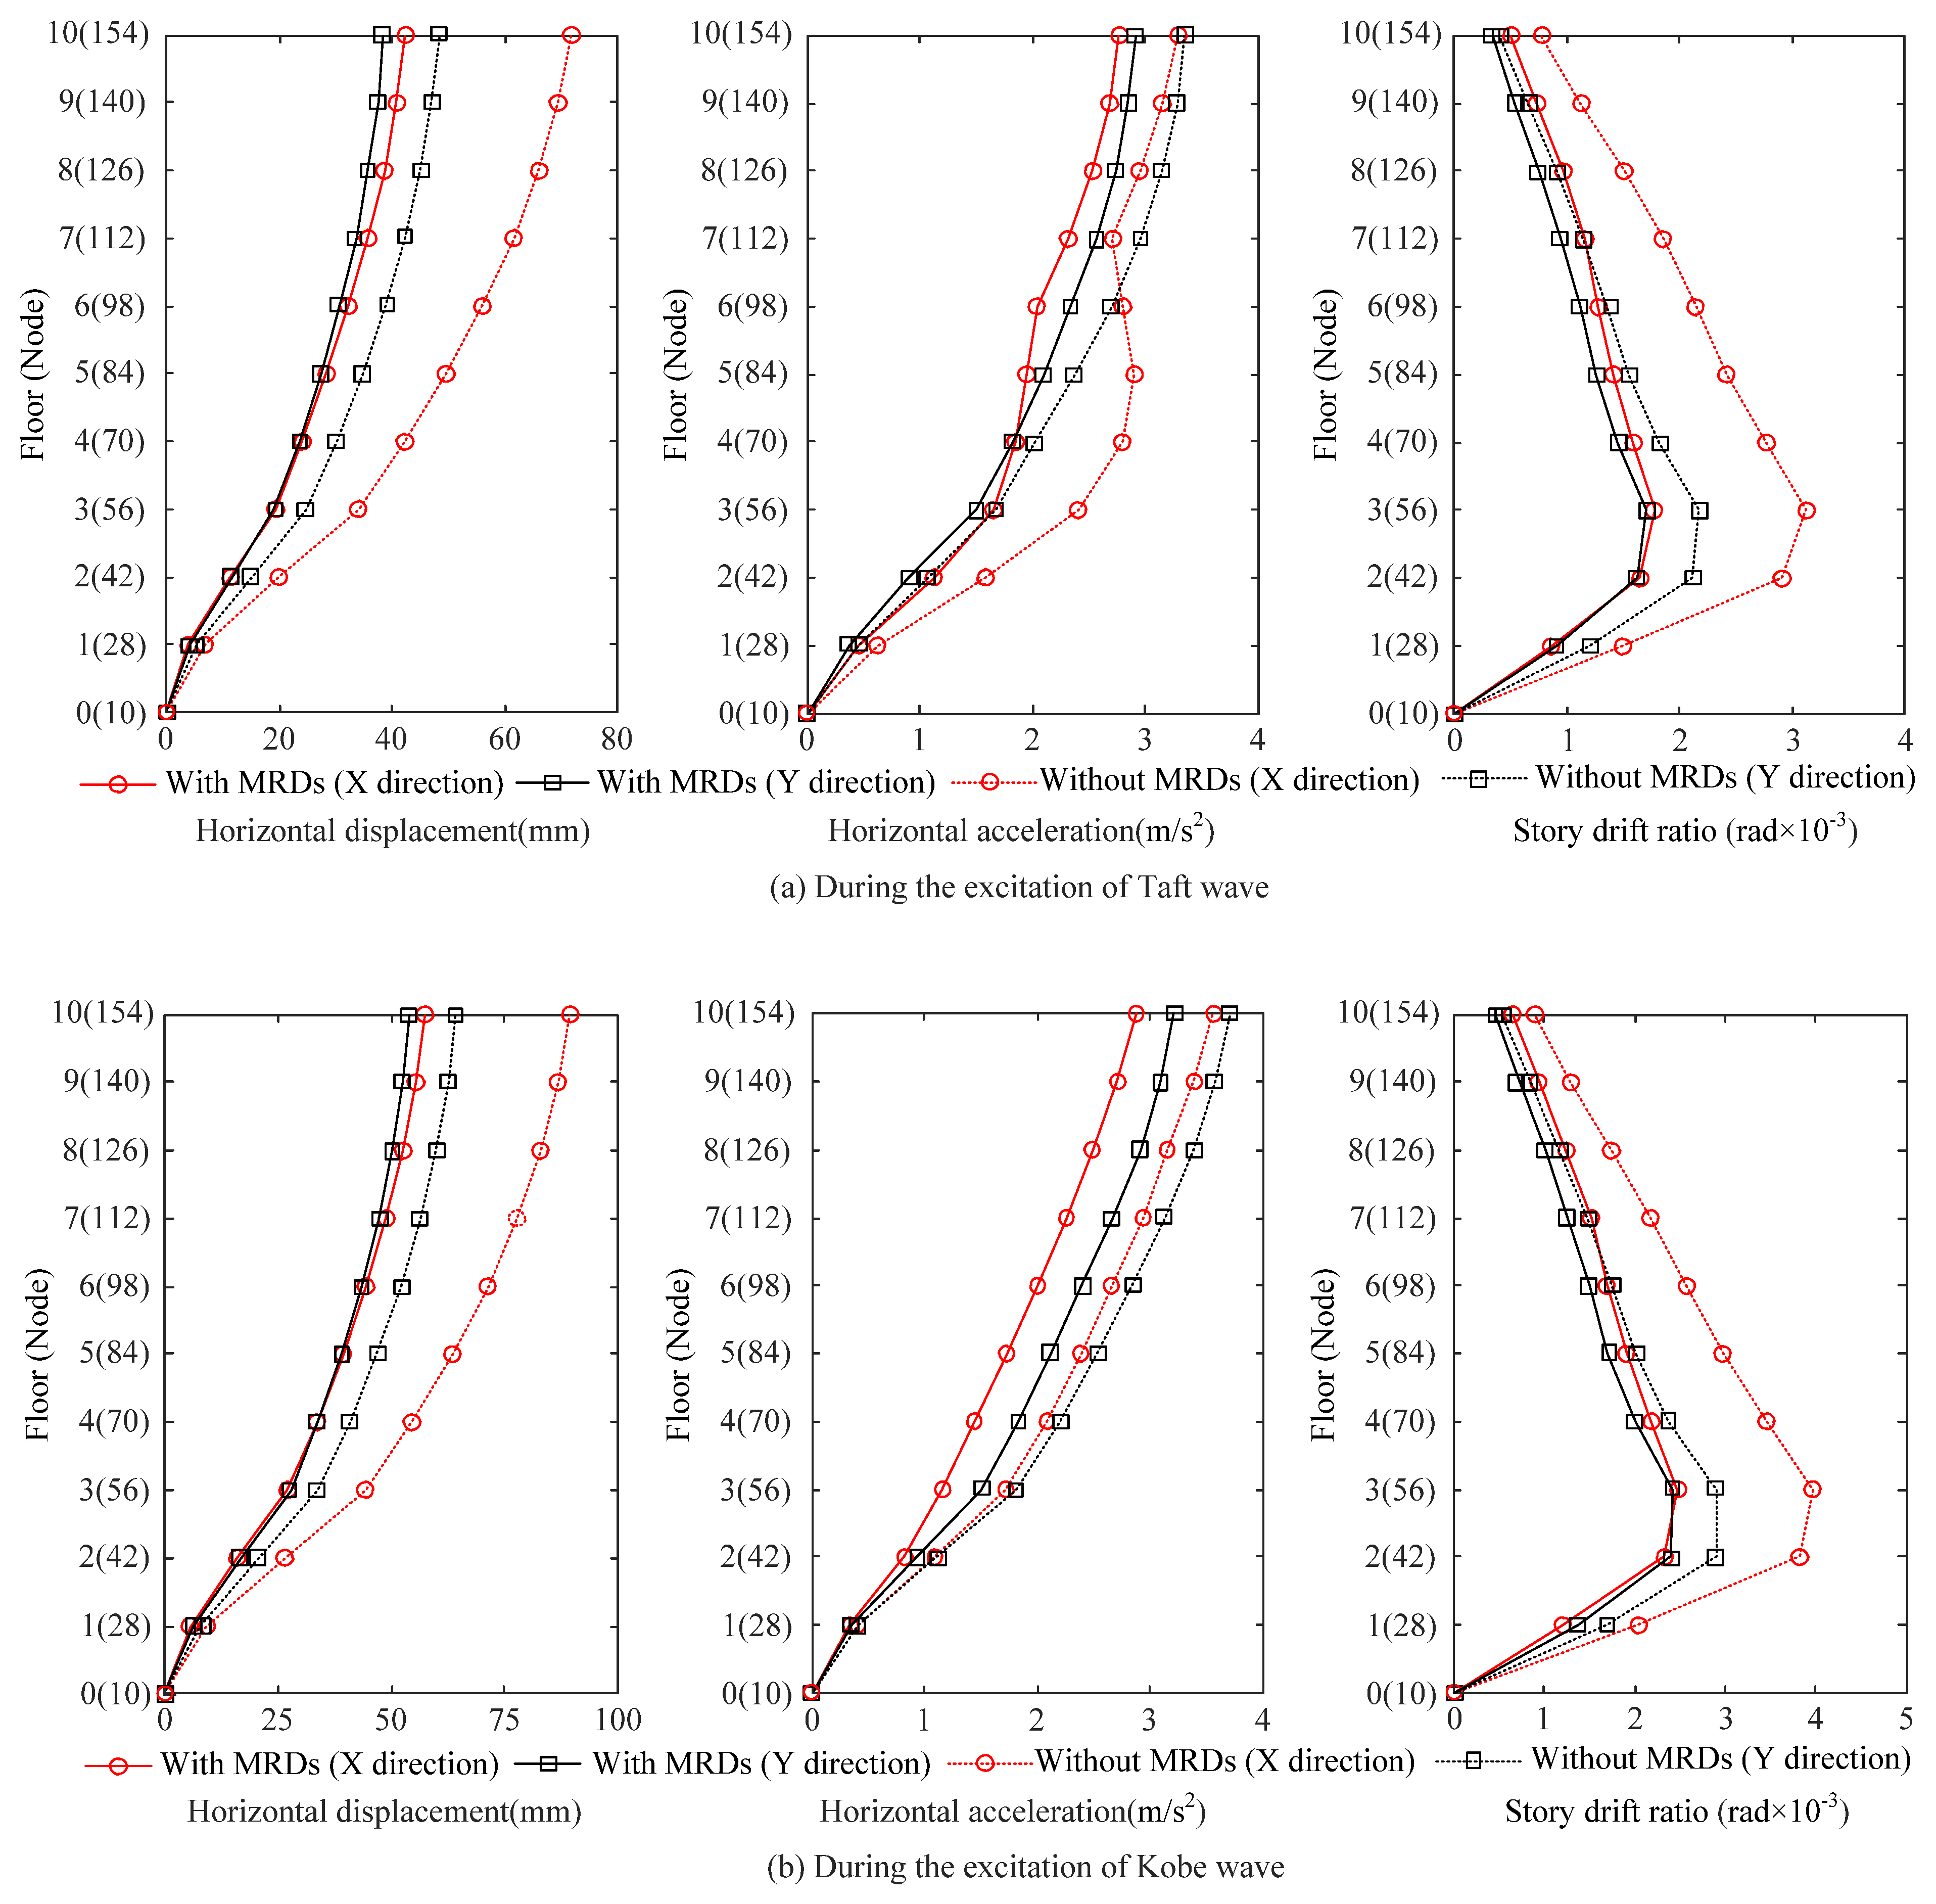
The max horizontal displacement, acceleration, and story drift ratio of every floor of the structure with and without MRDs.
5.2. Results Analysis on the Maximum Displacement, Acceleration, and Story Drift Ratio of the Structure
Under the excitation of seismic waves, the maximum horizontal displacement, acceleration, and story drift ratio of every floor of the L-shaped frame structure with and without MRDs are plotted in Figure 11. As shown in Figure 11a, during the action time of the Taft wave, the maximum horizontal displacement, acceleration, and story drift ratio of every floor of structure with MRDs are obviously lower than those without MRDs [44]. For Node 126 on the eighth floor, during the action time of the Taft wave, the horizontal bi-directional maximum displacements of the structure without MRDs are 66.05 and 45.07 mm, and those with MRDs are 38.62 and 35.77 mm, which are decreased by 41.53% and 20.64%, respectively. The horizontal bi-directional maximum accelerations of the structure without MRDs are 2.95 and 3.15 m/s2, and those with MRDs are 2.54 and 2.74 m/s2, which are decreased by 14.01% and 13.12%, respectively. The horizontal bi-directional story drift ratios of the structure without MRDs are 1.51 × 10⁻³ rad and 0.92 × 10⁻³ rad, and those with MRDs are 0.97 × 10⁻³ rad and 0.76 × 10⁻³ rad, which are decreased by 35.55% and 17.51%, respectively.
As shown in Figure 11b, for Node 126 on the eighth floor, during the action time of the Kobe wave, the horizontal bi-directional maximum displacements of the structure without MRDs are 82.99 and 59.99 mm, and those with MRDs are 52.67 and 50.32 mm, which are decreased by 36.53% and 16.14%, respectively. The horizontal bi-directional maximum accelerations of the structure without MRDs are 3.15 and 3.38 m/s2, and those with MRDs are 2.48 and 2.91 m/s2, which are decreased by 21.08% and 13.89%, respectively. The horizontal bi-directional story drift ratios of the structure without MRDs are 1.74 × 10⁻³ rad and 1.17 × 10⁻³ rad, and those with MRDs are 1.25 × 10⁻³ rad and 1.01 × 10⁻³ rad, which are decreased by 28.41% and 14.44%, respectively.
It can be seen from Figure 11 that the story drift ratios of the L-shaped frame structure with and without MRDs first increase and then decrease with the increase in the number of floors of the structure, and the maximum value appears on the third floor. This is because the bottom column of the structure is assumed to be consolidated, and the angle displacement of the bottom column is 0, resulting in a small story drift ratio between the bottom floors at not less than 1/2 of the second layer displacement angle; it shows that the envelope diagram is reasonable.
5.3. Results Analysis on Shear Force and Bending Moment of the Structural Columns
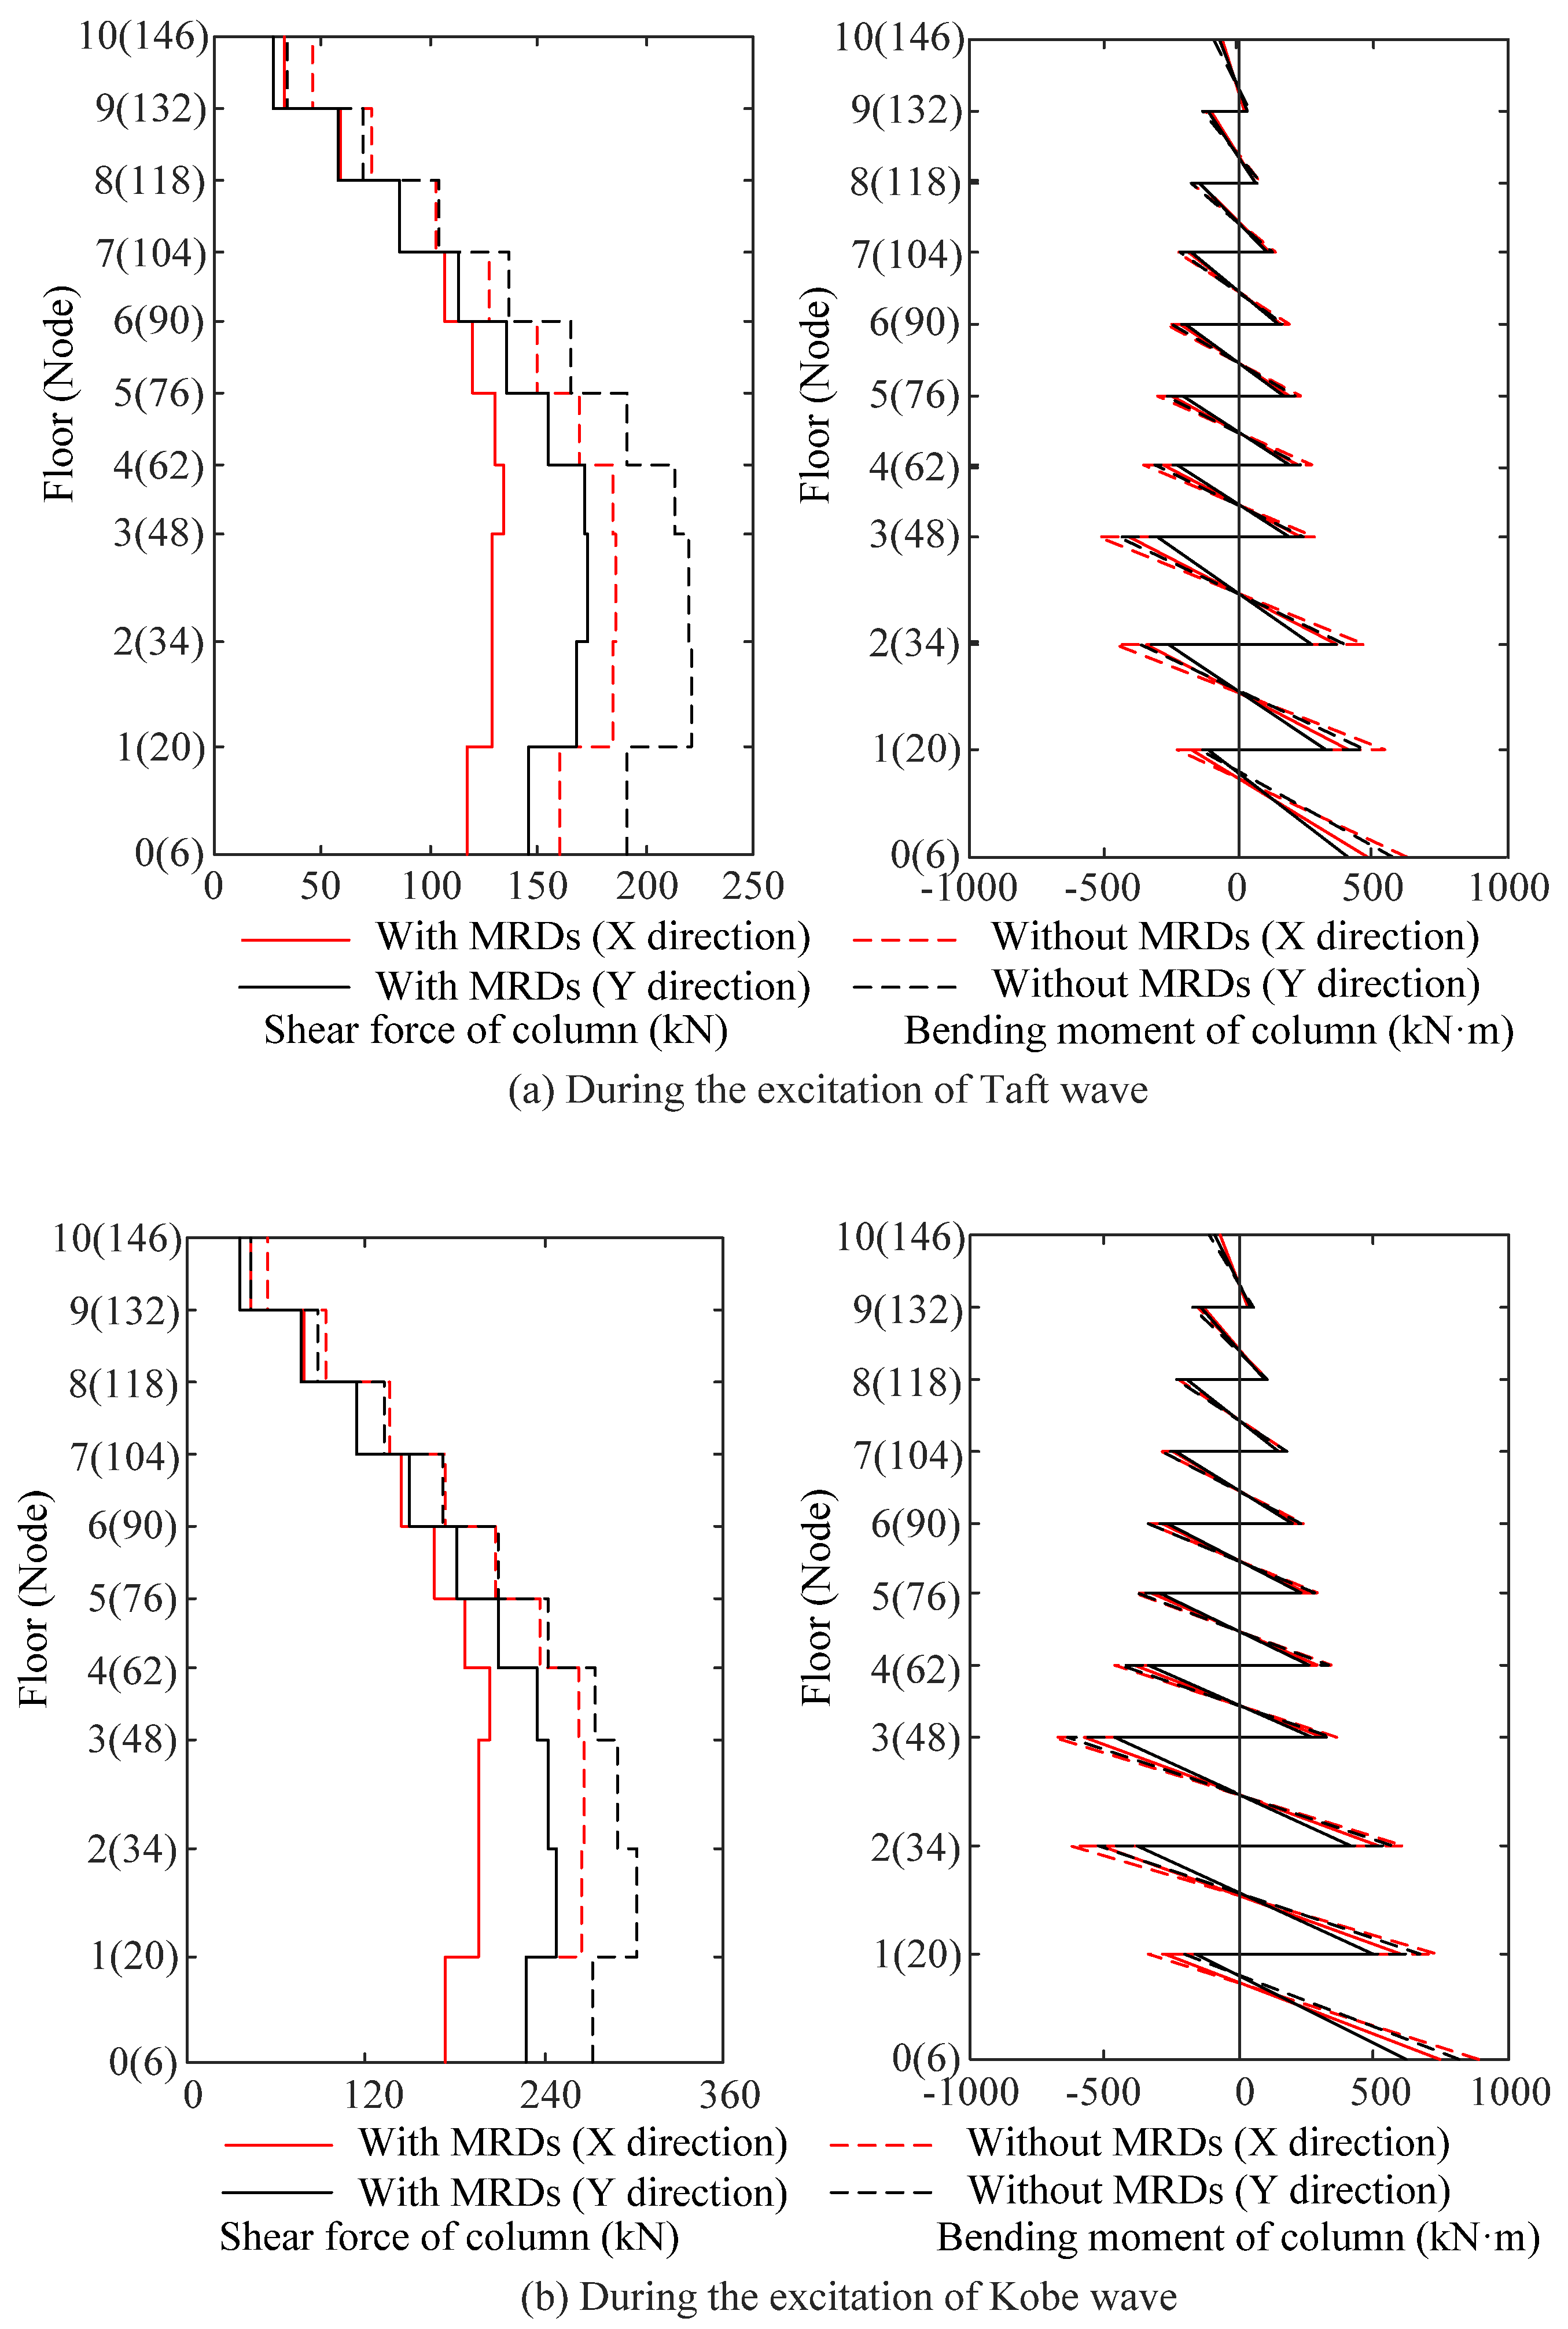
Under the excitation of seismic waves, the maximum shear force and bending moment of the column on every floor of the L-shaped frame structure with and without MRDs are plotted in Figure 12. As shown in Figure 12, the maximum shear force and the bending moment of the column on each floor of the structure with MRDs are obviously lower than those without MRDs, and the shear forces at both ends of the column are equal. Taking the column (Nodes 20 and 34) on the second floor as an example, as shown in Figure 12a, under the excitation of the Taft wave, the horizontal bi-directional maximum shear forces of the column of structure without MRDs are 184.90 and 220.93 kN, and those with MRDs are 128.35 and 167.67 kN, which are decreased by 30.58% and 24.11%, respectively. As shown in Figure 12b, throughout the duration of the Kobe wave, the horizontal bi-directional maximum shear forces of the column of structure without MRDs are 265.29 and 302.03 kN, and those with MRDs are 195.07 and 247.98 kN, which are decreased by 26.47% and 17.90%, respectively.
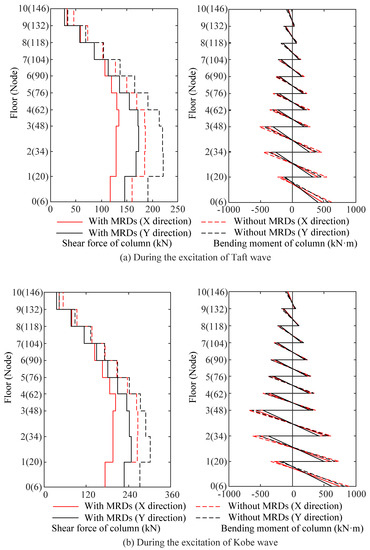
Figure 12.
The max shear forces and bending moments of the columns of every floor of the structure with and without MRDs.
As shown in Figure 12, the inflection point of the column on the top floor appears in the lower middle of the column, the inflection point of the column on the ground floor appears in the upper middle of the column, and those on the other floors appear in the middle of the column. Throughout the duration of seismic waves, the maximum bending moments at both ends of columns on each floor of the structure with MRDs are obviously lower than those without MRDs. Taking the column (Nodes 20 and 34) on the second floor as an example, as shown in Figure 12a, during the action time of the Taft wave, the horizontal bi-directional maximum bending moments of the column bottom of structure without MRDs are 541.61 and 468.77 kN·m, and those with MRDs are 413.81 and 325.01 kN·m, which are decreased by 23.60% and 30.66%, respectively. As shown in Figure 12b, throughout the duration of the Kobe wave, the horizontal bi-directional maximum bending moments of the column bottom of structure without MRDs are 731.01 and 674.36 kN·m, and those with MRDs are 602.17 and 496.72 kN·m, which are decreased by 17.62% and 26.34%, respectively.
5.4. Results Analysis on Torsional Vibration Control of the Structure
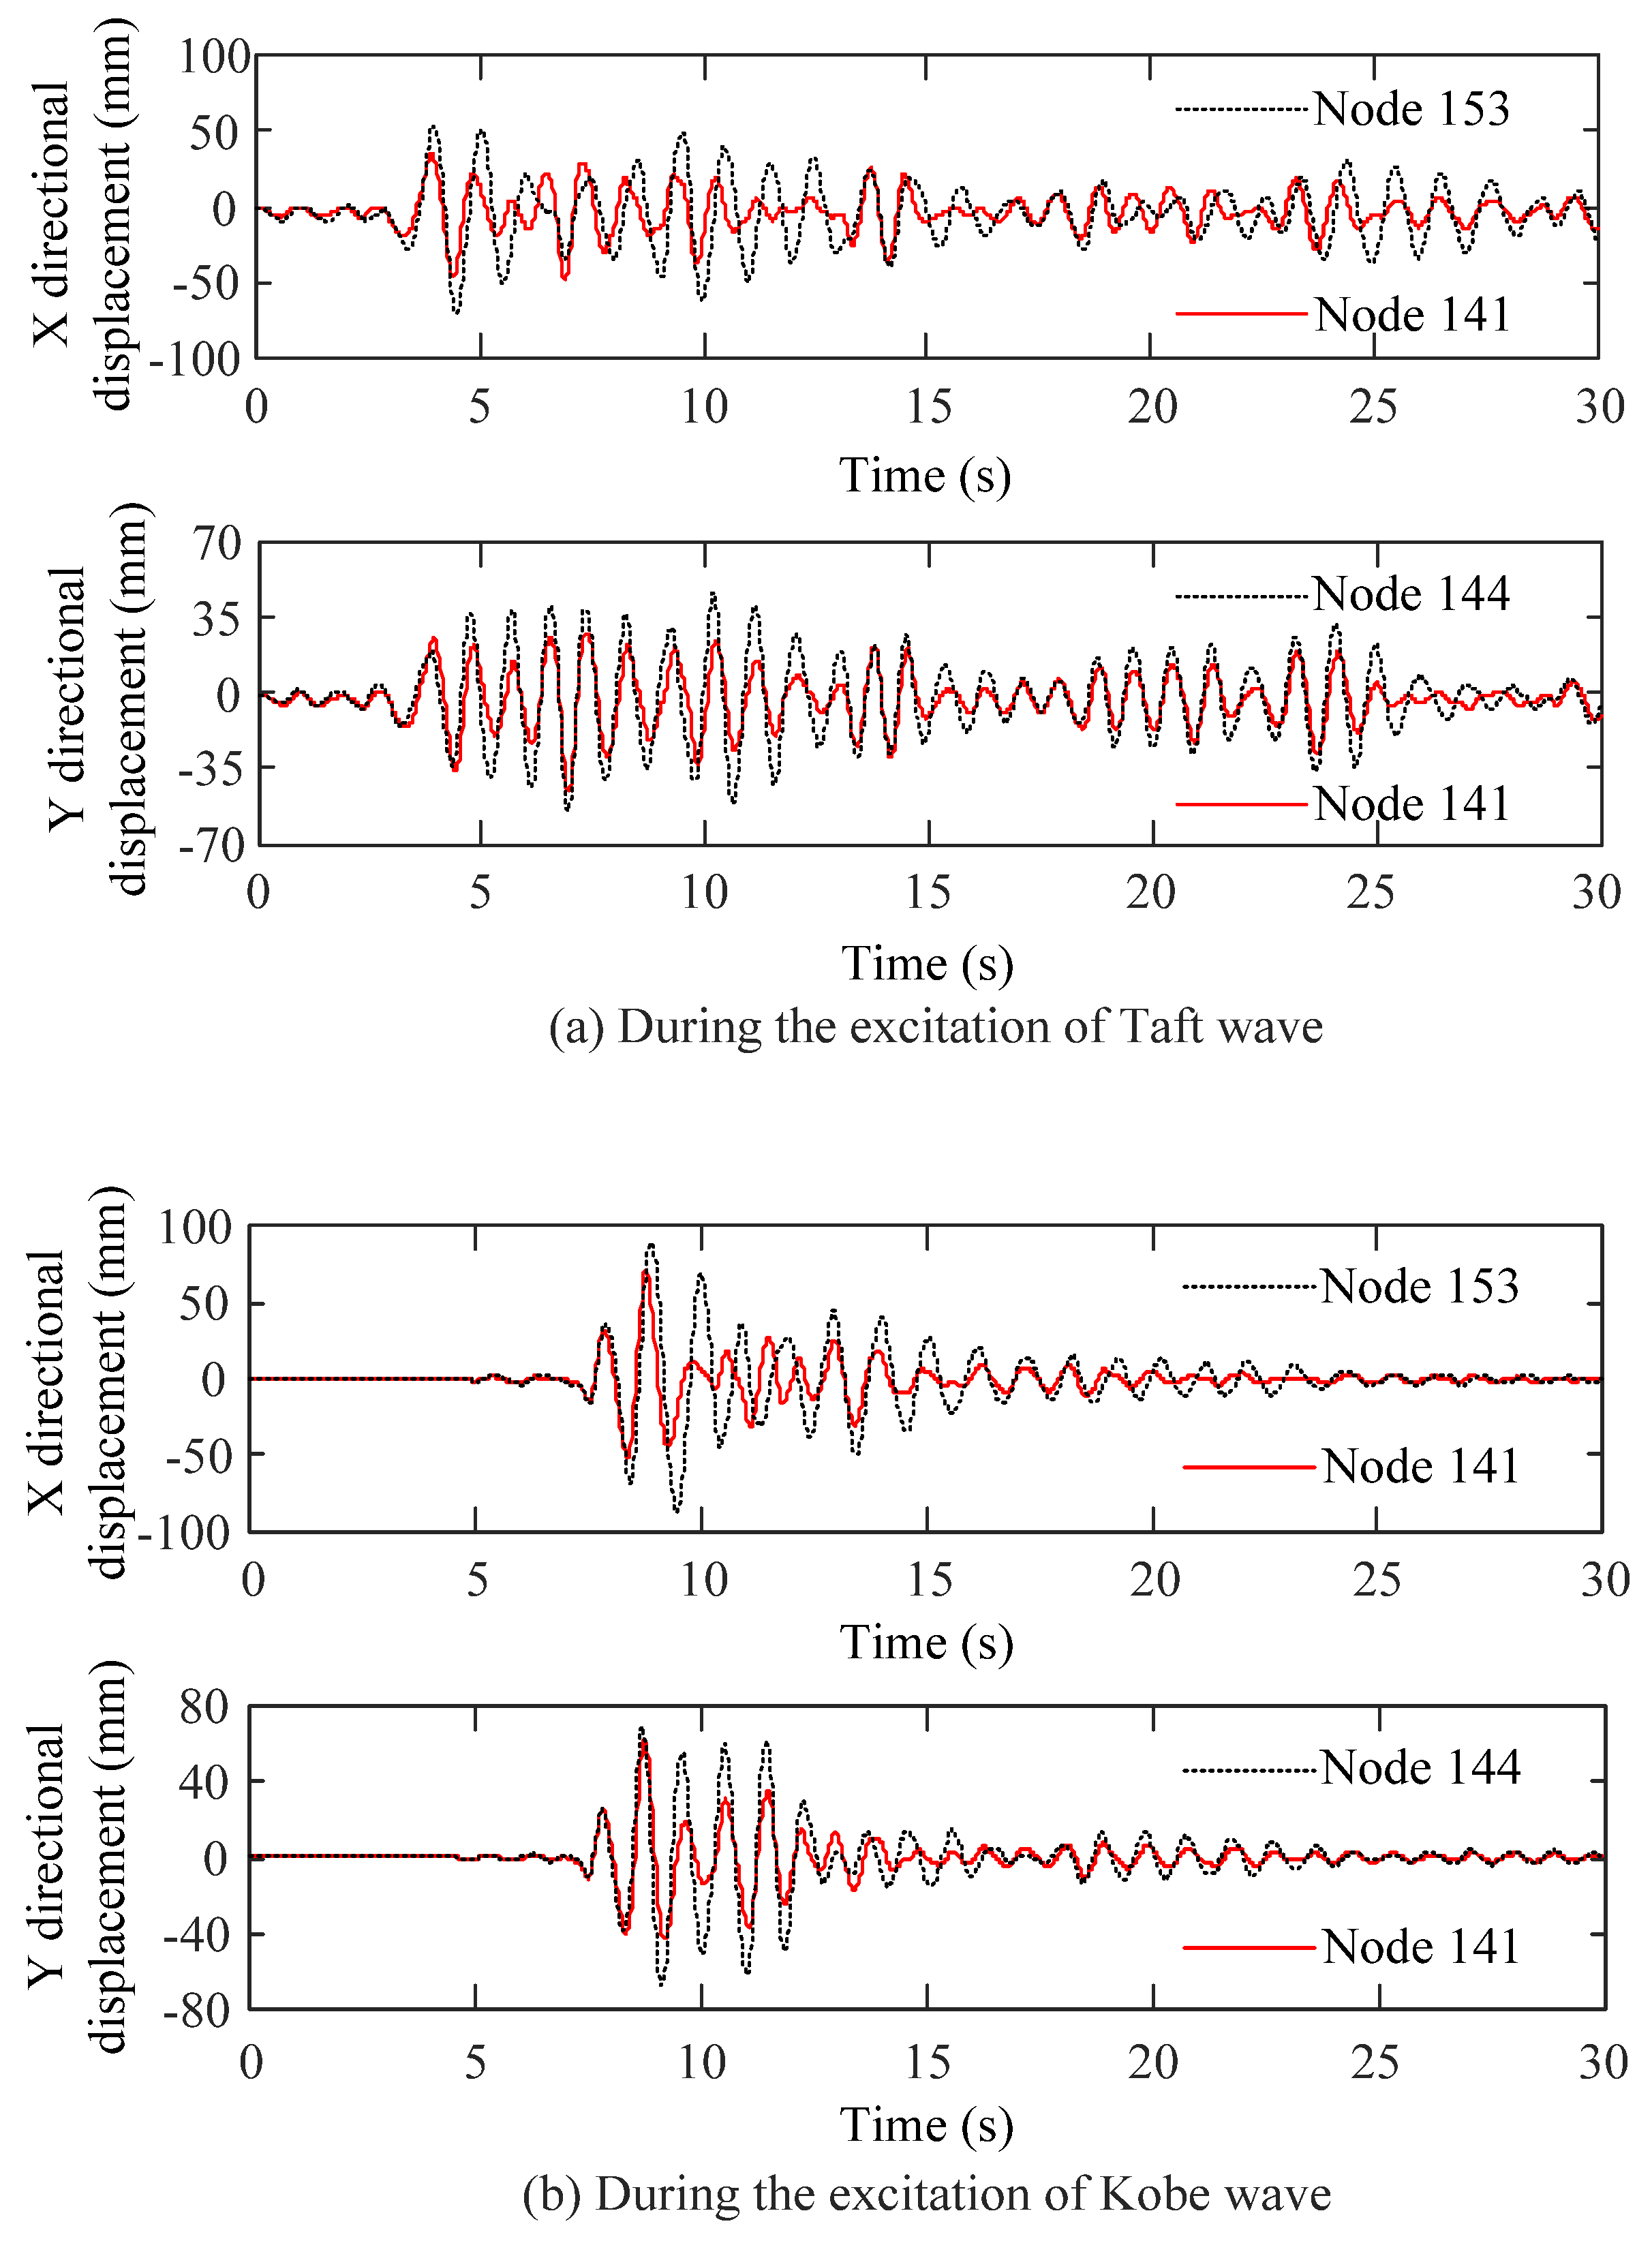
Contrasts of the horizontal displacement response of the top node of the L-shaped frame structure without MRDs are plotted in Figure 13. As shown in Figure 13, the X directional displacement time history responses of Nodes 153 and 141 are significantly different, and the Y directional displacement time history responses of Nodes 144 and 141 are also different. As shown in Figure 13a, during the excitation of the Taft wave, the X directional maximum displacements of Nodes 153 and 141 are 71.79 and 48.20 mm, and the ratio is 1.489; the Y directional maximum displacements of Nodes 144 and 141 are 53.77 and 44.52 mm, and the ratio is 1.208. As shown in Figure 13b, during the excitation of the Kobe wave, the X directional maximum displacements of Nodes 153 and 141 are 89.56 and 71.93 mm, and the ratio is 1.245; the Y directional maximum displacements of Nodes 144 and 141 are 69.62 and 62.01 mm, and the ratio is 1.123. The results show that the L-shaped structure without MRDs has obvious torsional vibration in the horizontal plane.

Figure 13.
Contrasts of the horizontal displacement response of the top node of the structure without MRDs.
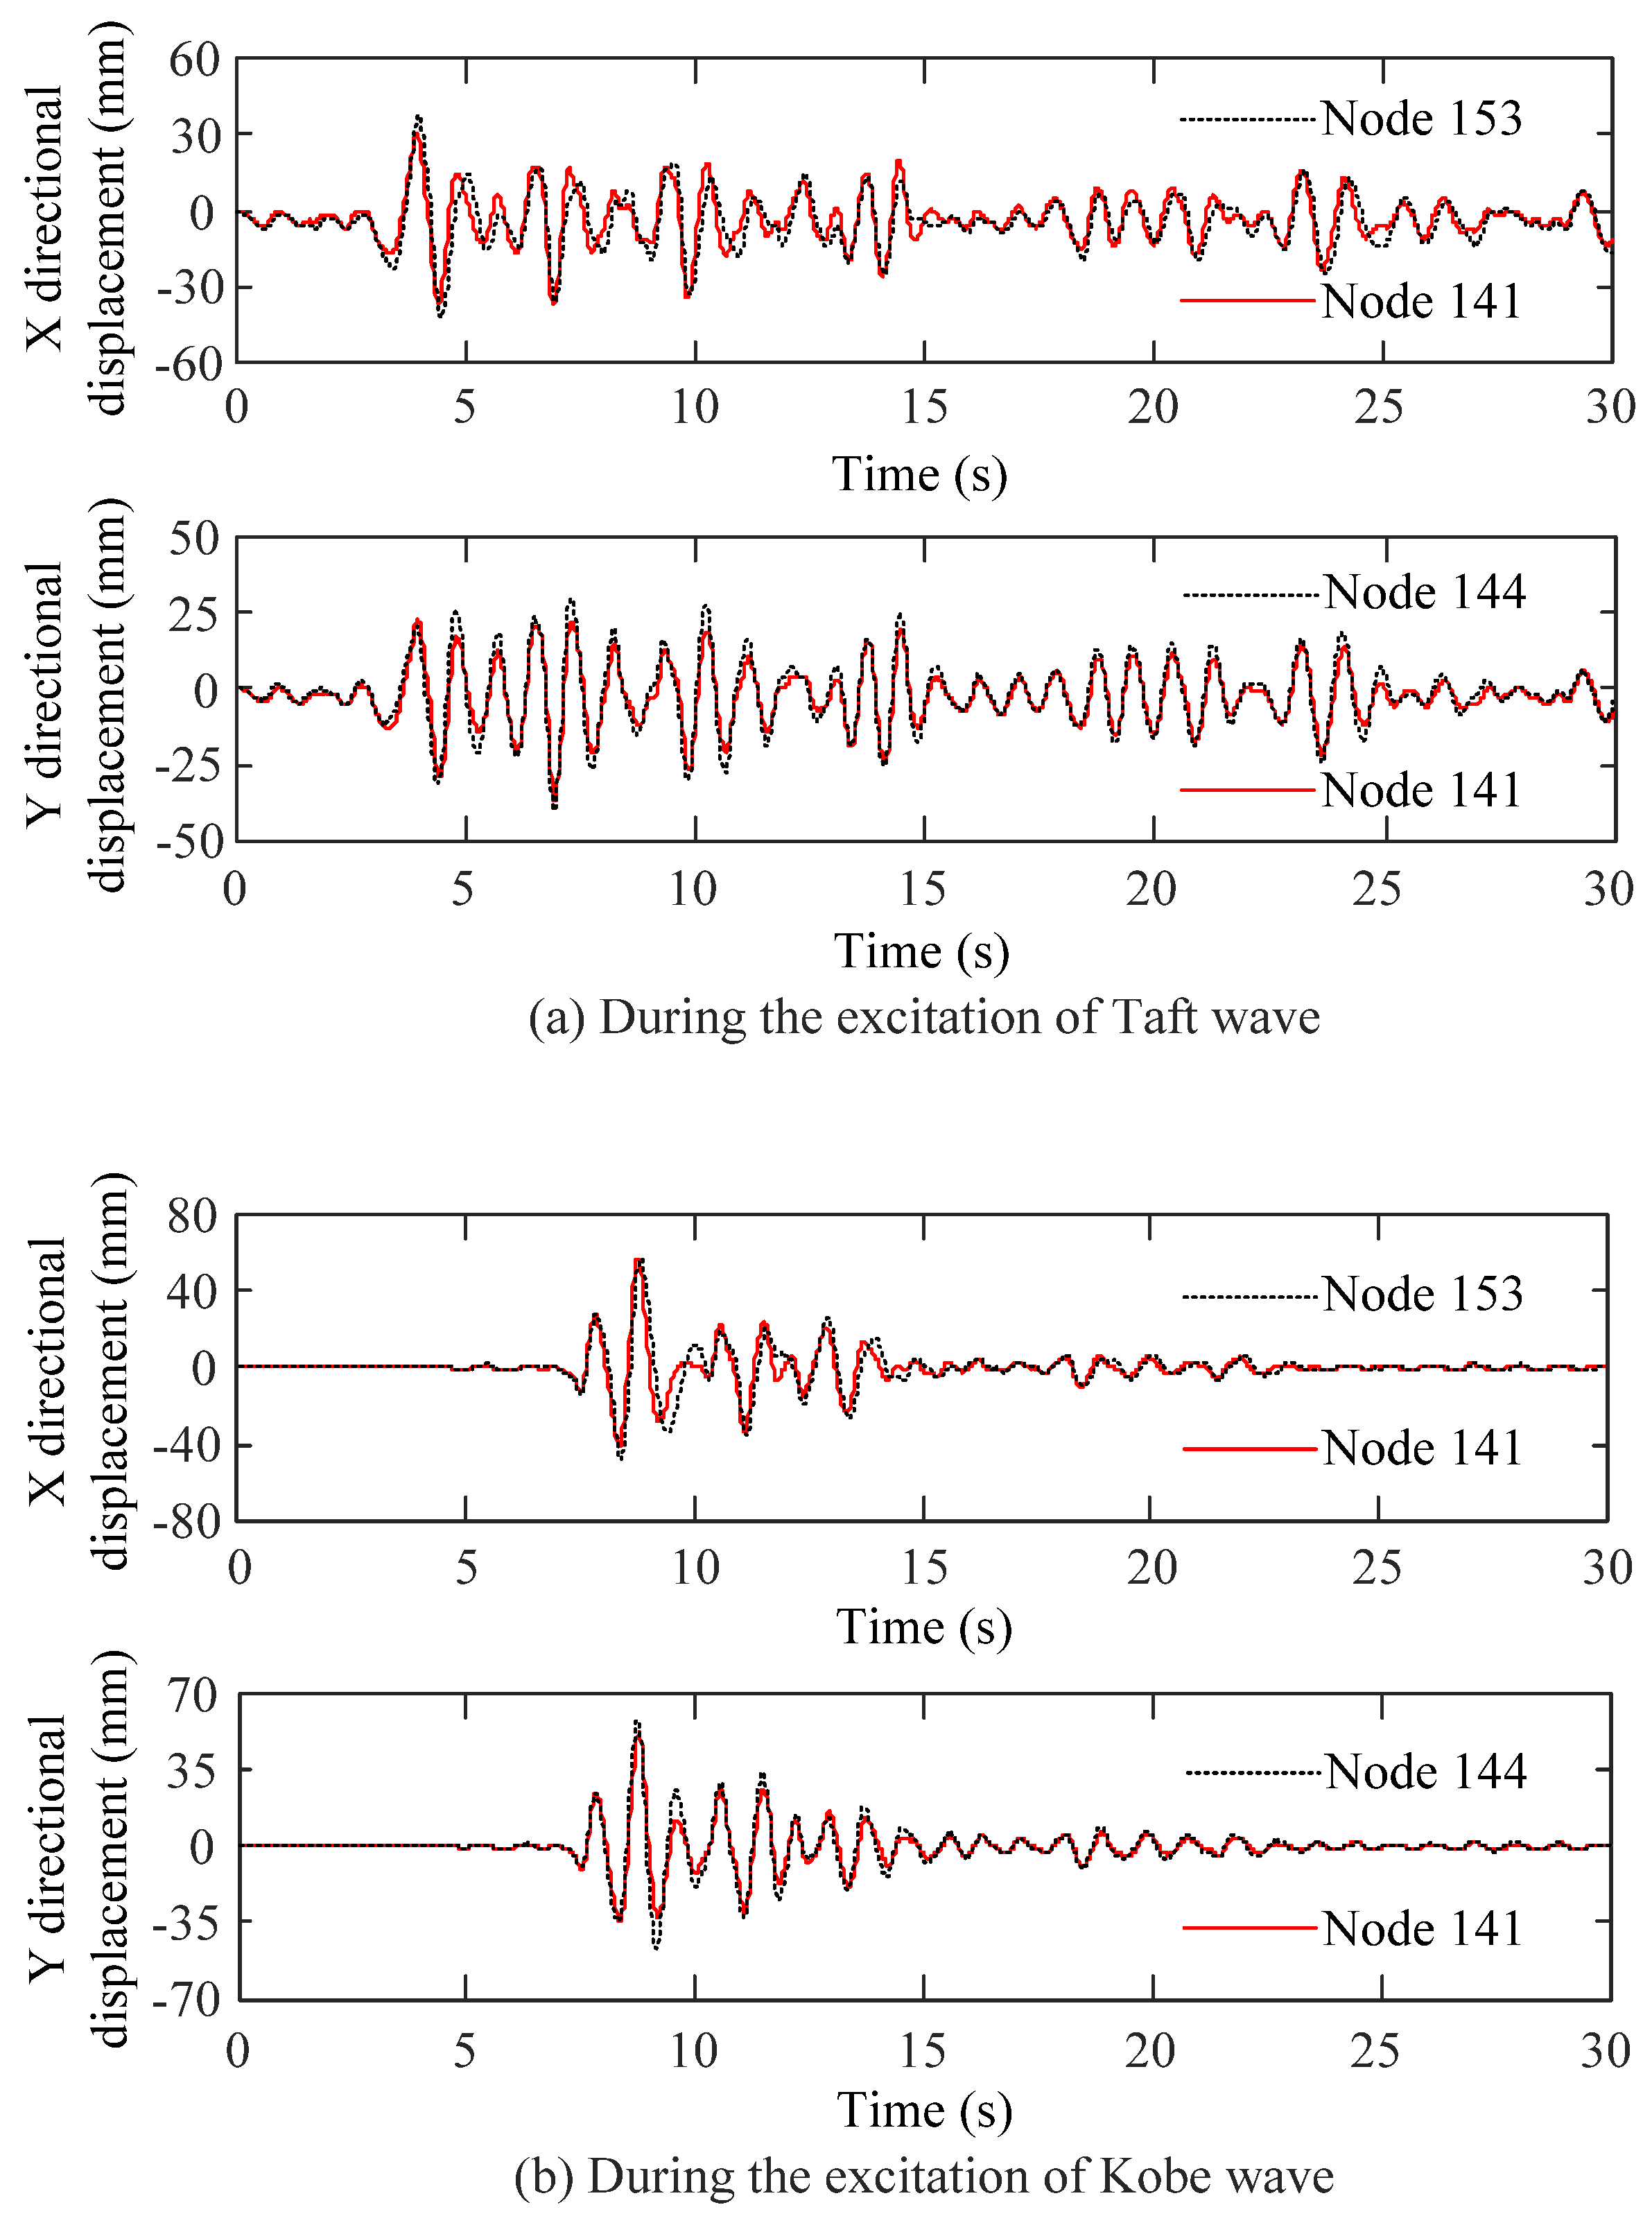
Contrasts of the horizontal displacement response of the top node of the L-shaped frame structure with MRDs are plotted in Figure 14. As shown in Figure 14, the X directional displacement time history responses Nodes 153 and 141 and Y directional displacement time history responses of Nodes 144 and 141 are almost identical. As shown in Figure 14a, during the excitation of the Taft wave, the X directional maximum displacements of Nodes 153 and 141 are 42.36 and 37.25 mm, and the ratio is 1.140; the Y directional maximum displacements of Nodes 144 and 141 are 40.26 and 37.25 mm, and the ratio is 1.081. As shown in Figure 14b, during the excitation of the Kobe wave, the X directional maximum displacements of Nodes 153 and 141 are 57.41 and 57.55 mm, and the ratio is 0.998; the Y directional maximum displacements of Nodes 144 and 141 are 57.79 and 51.92 mm, and the ratio is 1.113. The results show that, compared with the L-shaped frame structure without MRDs, the torsional vibration of the structure with MRDs is significantly reduced.
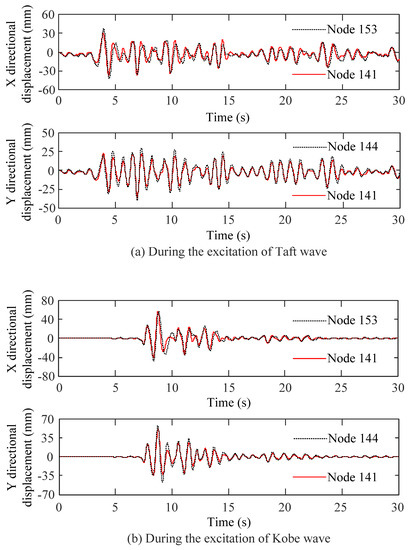
Figure 14.
Contrasts of the horizontal displacement response at the top node of the structure with MRDs.
For the action time of seismic waves, the maximum horizontal displacement ratios of each floor of the L-shaped frame structure with and without MRDs can be seen in Table 5 and Table 6. As shown in the tables, compared with the L-shaped frame structure without MRDs, the Y directional maximum displacement ratios of every floor of the structure with MRDs are getting closer to 1; the X directional maximum displacement ratios are obviously on the decrease. The results demonstrate that the L-shaped frame structural torsional vibration is significantly controlled.
Table 5.
The maximum horizontal displacement ratios of every floor during the Taft wave excitation.
Table 6.
The maximum horizontal displacement ratios of every floor during the Kobe wave excitation.
It can be seen from Figure 7 that the center of mass has different positions from the center of rigidity in the L-shaped frame structure; it directly leads to the obvious torsional vibration response under the action of seismic waves. Since the multi-floor L-shaped frame structure is a shear-type structure, many MRDs are arranged at the bottom floor of the structure, which can effectively increase the shear rigidity and torsional rigidity of the overall structure. This is the main reason why the multi-dimensional vibration and torsional vibration response of the L-shaped frame in this article are effectively controlled after setting the MRDs.
6. Conclusions
In the present study, extensive research about the mechanical performance of the self-made MRD is experimentally studied at different displacement amplitudes and currents. Finally, the main conclusions are summarized as follows:
- The damping force provided by the MRD gradually increases with the current, and the adjustable scope of damping force is from 3.1 to 120 kN when the current level increases from 0 to 0.28 A.
- The programs of the calculation model and time history analysis of the L-shaped frame structure without and with MRDs are proposed, which offers a new way for seismic response analysis of frame structures with MRDs.
- In contrast with the L-shaped frame structure without MRDs, the three-directional displacement and acceleration, story drift ratio, shear force, and bending moment of each floor of the L-shaped frame structure with MRDs have been significantly decreased.
- Throughout the duration of seismic waves, the L-shaped frame structure has the obvious response of torsional vibration, and the response of torsional vibration can be controlled by reasonably arranging MRDs in the structure.
A comparison of the most known machine learning algorithms will be considered in the same scenario for future applications. Moreover, a more comprehensive range of structural systems should be examined to incorporate them into the seismic response methodology.
Author Contributions
Conceptualization, Y.Y., J.Y., Y.F. and X.Z.; methodology, Y.Y., J.Y. and X.Z.; software, Y.Y.; validation, Y.Y., J.Y., Y.F. and X.Z.; formal analysis, Y.F. and X.Z.; investigation, Y.Y. and J.Y.; resources, Y.Y. and J.Y.; data curation, Y.Y., J.Y., Y.F. and X.Z.; writing—original draft preparation, Y.Y.; writing—review and editing, Y.Y., J.Y., Y.F. and X.Z.; visualization, Y.Y., Y.F. and X.Z.; supervision, X.Z.; project administration, X.Z.; funding acquisition, Y.Y., J.Y., Y.F. and X.Z. All authors have read and agreed to the published version of the manuscript.
Funding
This research is financially supported by the Key R & D and Promotion Projects of Henan Province (202102310239).
Institutional Review Board Statement
Not applicable.
Informed Consent Statement
Not applicable.
Data Availability Statement
Not applicable.
Acknowledgments
This research is financially supported by the Key R & D and Promotion Projects of Henan Province (202102310239). The support is gratefully acknowledged.
Conflicts of Interest
The authors declare that they have no known competing financial interests or personal relationships that could appear to influence the work reported in this paper.
References
- Kolekar, S.; Venkateshv, K.; Oh, J.S.; Choi, S.B. Vibration controllability of sandwich structures with smart materials of electrorheological fluids and magnetorheological materials: A review. J. Vib. Eng. Technol. 2019, 7, 359–377. [Google Scholar] [CrossRef]
- Rahman, M.; Ong, Z.C.; Julai, S.; Ferdaus, M.M.; Ahamed, R. A review of advances in magnetorheological dampers: Their design optimization and applications. J. Zhejiang Univ.-Sci. A (Appl. Phys. Eng.) 2017, 18, 991–1010. [Google Scholar] [CrossRef]
- Bahman, F.A.; Hedayat, V.; Farzad, R.; Siamak, T. Control of the nonlinear building using an optimum inverse TSK model of MR damper based on modified grey wolf optimizer. Eng. Struct. 2020, 214, 110657. [Google Scholar]
- Ding, Y.; Zhang, L.; Zhu, H.T.; Li, Z.X. A new magnetorheological damper for seismic control. Smart Mater Struct. 2013, 22, 115003-1–115003-12. [Google Scholar] [CrossRef]
- Wang, W.; Hua, X.; Wang, X.; Wu, J.; Sun, H.; Song, G. Mechanical behavior of magnetorheological dampers after long-term operation in a cable vibration control system. Struct. Control Health Monit. 2019, 26, e22801-19. [Google Scholar] [CrossRef] [Green Version]
- Xu, Z.D.; Shen, Y.P. Intelligent Bi-State Control for the Structure with Magnetorheological Dampers. J. Intell. Mater. Syst. Struct. 2003, 14, 35–42. [Google Scholar] [CrossRef]
- Xu, Z.D.; Ge, T.; Liu, J. Experimental and theoretical study of high energy dissipation viscoelastic dampers based on acrylate rubber matrix. J. Eng. Mech. 2020, 146, 04020057. [Google Scholar] [CrossRef]
- Xu, Z.D.; Xu, F.H.; Chen, X. Vibration suppression on a platform by using vibration isolation and mitigation devices. Nonlinear Dynam. 2016, 83, 1341–1353. [Google Scholar] [CrossRef]
- Zhang, X.C.; Zhang, X.; Zhao, Y.; Zhao, J.; Xu, Z. Experimental and numerical studies on a composite MR damper considering magnetic saturation effect. Eng. Struct. 2017, 132, 576–585. [Google Scholar] [CrossRef]
- Lv, H.Z.; Zhang, S.S.; Sun, Q.; Chen, R.; Zhang, W.J. The dynamic models, control strategies and applications for magnetorheological damping systems A Systematic Review. J. Vib. Eng. Technol. 2020, 9, 131–147. [Google Scholar] [CrossRef]
- Parlak, Z.; Engin, T. Time-dependent CFD and quasi-static analysis of magnetorheological fluid dampers with experimental validation. Int. J. Mech. Sci. 2012, 64, 22–31. [Google Scholar] [CrossRef]
- Carlson, J.D.; Spencer, B.F. Magnetorheological fluid dampers for semi-active seismic control. Motion Vibr. Control 1996, 2, 35–40. [Google Scholar]
- Fujitani, H.; Sodeyama, H.; Tomura, T.; Hiwatashi, T.; Hata, K.; Sunakoda, K.; Morishita, S.; Soda, S. Development of 400 kN magnetorheological damper for a real base-isolated building. Proc. SPIE-Int. Soc. Opt. Eng. 2003, 5052, 265–276. [Google Scholar]
- Xu, Z.D.; Sha, L.F.; Zhang, X.C.; Ye, H.H. Design, performance test and analysis on magnetorheological damper for earthquake mitigation. Struct. Control Health Monit. 2013, 20, 956–970. [Google Scholar] [CrossRef]
- Tu, J.W.; Liu, J.; Qu, W.L.; Zhou, Q.; Cheng, H.B.; Cheng, X.D. Design and Fabrication of 500-kN Large-scale MR Damper. J. Intell. Mater. Syst. Struct. 2011, 22, 475–487. [Google Scholar] [CrossRef]
- Khanal, B.; Chaulagain, H. Seismic elastic performance of L-shaped building frames through plan irregularities. Structures 2020, 27, 22–36. [Google Scholar] [CrossRef]
- Abdel Raheem, S.E.; Ahmed, M.M.M.; Ahmed, M.M.; Abdel-shafy, A.G.A. Evaluation of plan configuration irregularity effects on seismic response demands of L-shaped MRF buildings. Bull. Earthq. Eng. 2018, 16, 3845–3869. [Google Scholar] [CrossRef]
- Abdel Raheem, S.E.; Ahmed, M.M.M.; Ahmed, M.M.; Ahmed, M.M.; Abdel-shafy, A.G.A. Seismic performance of L-shaped multi-storey buildings with moment-resisting frames. Proc. Inst. Civil Eng. Struct. Build. 2018, 171, 395–408. [Google Scholar] [CrossRef]
- Amarloo, N.; Emami, A.R. A 3-dimensional perspective for inter-storey drift, ductility and damage distributions in plan-irregular RC buildings considering seismic orientation effect. Bull. Earthq. Eng. 2019, 17, 3447–3474. [Google Scholar] [CrossRef]
- Zafarani, M.M.; Halabian, A.M. Supervisory adaptive nonlinear control for seismic alleviation of inelastic asymmetric buildings equipped with MR dampers. Eng. Struct. 2018, 176, 849–858. [Google Scholar] [CrossRef]
- Li, Z.X.; Lv, Y.; Xu, L.H.; Ding, Y.; Zhao, Q. Experimental studies on nonlinear seismic control of a steel-concrete hybrid structure using MR dampers. Eng. Struct. 2013, 49, 248–263. [Google Scholar] [CrossRef]
- Bhatti, A.Q. Performance of viscoelastic dampers (VED) under various temperatures and application of magnetorheological dampers (MRD) for seismic control of structures. Mech. Time-Depend. Mater. 2012, 17, 275–284. [Google Scholar] [CrossRef]
- Sakurai, T.; Morishita, S. Seismic response reduction of a three-story building by an MR grease damper. Front. Mech. Eng. 2017, 12, 224–233. [Google Scholar] [CrossRef]
- Ali, S.F.; Ramaswamy, A. Hybrid structural control using magnetorheological dampers for base isolated structures. Smart Mater. Struct. 2009, 18, 055011. [Google Scholar] [CrossRef]
- Dyke, S.J.; Spencer, B.F.; Sain, M.K.; Carlson, J.D. Modeling and control of magnetorheological dampers for seismic response reduction. Smart Mater. Struct. 1996, 5, 565–575. [Google Scholar] [CrossRef]
- Xu, Z.D.; Zhao, Y.L.; Guo, Y.Q.; Yang, X.L.; Sarwar, W. Shaking table tests of magnetorheological damped frame to mitigate the response under real-time online control. Smart Mater. Struct. 2019, 28, 115021. [Google Scholar] [CrossRef]
- Dyke, S.J.; Spencer, B.F.; Sain, M.K.; Carlson, J.D. An experimental study of MR dampers for seismic protection. Smart Mater. Struct. 1998, 7, 693–703. [Google Scholar] [CrossRef] [Green Version]
- Yoshida, O.; Dyke, S.J.; Giacosa, L.M.; Truman, K.Z. Experimental verification of torsional response control of asymmetric buildings using MR dampers. Earthq. Eng. Struct. Dyn. 2003, 32, 2085–2105. [Google Scholar] [CrossRef]
- Zhang, X.C.; Xu, Z.D. Testing and modeling of a CLEMR damper and its application in structural vibration reduction. Nonlinear Dyn. 2012, 70, 1575–1588. [Google Scholar] [CrossRef]
- Bhaiya, V.; Shrimali, M.K.; Bharti, S.D.; Datta, T.K. Modified semi-active control with MR dampers for partially observed systems. Eng. Struct. 2019, 191, 129–147. [Google Scholar] [CrossRef]
- Xu, F.H.; Xu, Z.D.; Zhang, X.C. Study on the space frame structures incorporated with magnetorheological dampers. Smart Struct. Syst. 2017, 19, 279–288. [Google Scholar] [CrossRef]
- Zhao, J.; Li, K.; Zhang, X.C.; Sun, Y.P.; Xu, Z.D. Multidimensional vibration reduction control of the frame structure with magnetorheological damper. Struct. Control Health Monit. 2020, 27, e2572. [Google Scholar] [CrossRef]
- Qian, R.J.; Yuan, X.F.; Lin, Z.B. The Analysis Theory and Finite Element Method for Solid and Structure; Southeast University Press: Nanjing, China, 2013; pp. 425–427+436–437. (In Chinese) [Google Scholar]
- Motra, G.B.; Mallik, W.; Chandiramani, N.K. Semi-active vibration control of connected buildings using magnetorheological dampers. J. Intell. Mater. Syst. Struct. 2011, 22, 1811–1827. [Google Scholar] [CrossRef]
- Ubaidillah, H.K.; Kadir, F.A.A. Modelling, characterisation and force tracking control of a magnetorheological damper under harmonic excitation. Int. J. Model. Identif. Control 2011, 13, 9–21. [Google Scholar] [CrossRef] [Green Version]
- Russo, R.; Terzo, M. Modelling, parameter identification, and control of a shear mode magnetorheological device. Proc. Inst. Mech. Eng. I 2011, 225, 549–562. [Google Scholar] [CrossRef]
- Weber, F. Robust force tracking control scheme for MR dampers. Struct. Control Health Monit. 2015, 22, 1373–1395. [Google Scholar] [CrossRef]
- Ribeiro, T.; Bernardo, L.; Carrazedo, R.; Domenico, D. Seismic Design of Bolted Connections in Steel Structures—A Critical Assessment of Practice and Research. Buildings 2022, 12, 32. [Google Scholar] [CrossRef]
- Nguyen, D.H.; Hong, W.-K. A novel erection technique of the l-shaped precast frames utilizing laminated metal plates. J. Asian Archit. Build. Eng. 2021, 20, 674–688. [Google Scholar] [CrossRef]
- Chhatani, Y.; Pawade, P.Y.; Dabhekar, K.R.; Khedikar, I.P. Seismic performance of l-shaped building through plan irregularities. IOP Conf. Ser. Mater. Sci. Eng. 2021, 1197, 012050. [Google Scholar] [CrossRef]
- Li, J.; Wang, Z.; Li, F.; Mou, B.; Wang, T. Experimental and numerical study on the seismic performance of an L-Shaped double-steel plate composite shear wall. J. Build. Eng. 2022, 49, 104015. [Google Scholar] [CrossRef]
- Ping, C.Z.; Weiwei, S.; Yang, Y. Seismic behavior of reinforced concrete t-shaped columns under compression-bending-shear and torsion. Earthq. Struct. 2021, 20, 431–444. [Google Scholar]
- Zhang, X.; Xia, Q.; Ye, B.; Yan, W.; Deng, Z.; Xiang, P. Seismic performances of src special-shaped columns and rc beam joints under double-direction low-cyclic reversed loading. Front. Mater. 2021, 8, 438. [Google Scholar] [CrossRef]
- Zhang, M.J.; Xu, F.Y. Tuned mass damper for self-excited vibration control: Optimization involving nonlinear aeroelastic effect. J. Wind Eng. Ind. Aerodyn. 2022, 220, 104836. [Google Scholar] [CrossRef]


Publisher’s Note: MDPI stays neutral with regard to jurisdictional claims in published maps and institutional affiliations. |
© 2022 by the authors. Licensee MDPI, Basel, Switzerland. This article is an open access article distributed under the terms and conditions of the Creative Commons Attribution (CC BY) license (https://creativecommons.org/licenses/by/4.0/).