Article

Developing a Novel Design for a Tubular Solid Oxide Fuel Cell Current Collector

by
Khaled I. Ahmed
1,2,* and
Mohamed H. Ahmed
1,3
1
Mechanical Engineering Department, Faculty of Engineering, King Abdulaziz University, Jeddah 21589, Saudi Arabia
2
K.A. CARE Energy Research and Innovation Center, King Abdulaziz University, Jeddah 21589, Saudi Arabia
3
Department of Mechanical Engineering, Faculty of Engineering, Assiut University, Assiut 71516, Egypt
*
Author to whom correspondence should be addressed.
Appl. Sci. 2022, 12(12), 6003; https://doi.org/10.3390/app12126003
Submission received: 3 April 2022 / Revised: 9 June 2022 / Accepted: 10 June 2022 / Published: 13 June 2022
(This article belongs to the Section Energy Science and Technology)

Abstract

:
This study presents a novel current collector design for a tubular SOFC and numerically investigates its performance. The new current collector design has a flow channel with a trapezoidal shape. Several channels, such as four, eight, and twelve, are investigated, and their effects on cell performance are reported and compared. Additionally, a traditional tubular SOFC and the newly developed design are presented. The equations of mass conservation, momentum, charge transport, and energy were considered in the numerical model, and the ANSYS Fluent SOFC module was used to solve the numerical model. The results show that the developed design performed better than the traditional design. The new design with twelve channels collected 0.384 A, higher than the other designs. Although the design with twelve channels gave a high concentration of hydrogen at the outlet compared to the designs with four and eight channels, it gave higher performance than the designs with four and eight channels. Increasing the number of channels in the developed design enhanced the cell performance significantly due to the increased contact area, leading to the efficient collection of the generated current.

1. Introduction

Renewable energy resources are the key solution to the coming energy shortage that the world faces. As a promising renewable energy source, fuel cells can produce electricity through the electrochemical energy stored in hydrocarbons through electrochemical reactions between hydrogen and oxygen [1,2,3]. Solid oxide fuel cells (SOFC) are fuel cells that have high power densities. SOFCs have two configurations, planar and tubular, as described in Figure 1.
Generally, an SOFC consists of an anode, a cathode, an electrolyte, and a current collector. There are specific requirements for each component to be fulfilled for better cell performance and durability. SOFC anodes should provide as many sites as possible for the oxidation of the fuel and deliver the produced electrons to the current collector efficiently. They should be chemically, mechanically, and thermally stable enough to withstand the thermal shocks and stresses caused by the high operating temperature of SOFCs. Another key criterion for SOFC anodes is that they have a close thermal expansion coefficient compared to the electrolyte and current collector [4,5]. SOFC cathodes must meet specific requirements, including chemical and thermal stability with the electrolyte and current collector, high catalytic activity for oxygen reduction, and a thermal expansion coefficient that matches those of the electrolyte and current collector [6,7]. The electrolyte should have excellent ionic and low electronic conductivity, a dense microstructure, thermal and chemical stability, and a thermal expansion coefficient that matches those of the anode and cathode [6,7].
The final component in an SOFC’s assembly is the current collector. It is regarded as the most significant component since it is in charge of transferring fuel and oxygen across the active portion of the cell, collecting the created electrons from the cell, and putting the cell components together. It should be thermally and mechanically stable and have a thermal expansion coefficient that matches those of the anode and cathode [8]. Additionally, the current collector should be able to cope with the anode and cathode requirements described previously. Therefore, the current collector should have a unique design to supply the fuel and oxygen to the reaction sites while achieving the maximum cell performance. The current collector is also responsible for the uniform distribution of the flow inside the cell and stabilizing the cell’s temperature [9,10]. It is important to design the current collector to enable it to draw the generated current from the cell with the lowest possible losses. For planar SOFCs, several previous studies have focused on the current collector’s design and reached different optimal designs that fulfilled the current collector’s requirements [11,12,13,14,15].
For tubular SOFCs, it is difficult to determine the optimal current collector configuration, and several previous studies have focused on this topic. Chen et al. [16] developed a new configuration for the current collector for a stack of fuel cells, and this new design increased the airflow among the cell tubes. The problem with this design is that it only worked for a stack of cells. Sammes et al. [17] developed a current collector that could collect the generated current from the cell while simultaneously fusing two cells together. The non-uniform distribution of the air and fuel is a problem with this design because it has no guides for the flow inside the cell. Zhu et al. [18] developed a mathematical model to study the effect of axially distributed air and fuel on a tubular SOFC’s performance. They found that the performance can be greatly enhanced by the uniform distribution of both air and fuel. Cui et al. [19] compared three different modes of the current collector: inlet current collector, outlet current collector, and inlet–outlet current collector for tubular SOFCs. The results showed that the inlet–outlet current collector was the best choice based on cell performance. Calise et al. [20] connected a tubular SOFC with an aluminum tube on both sides to collect the current from the cell. The problem with this method is that it could not achieve a uniform distribution of air and fuel throughout the cell. Li et al. [21] developed a current collector mesh that contains a microchannel to uniformly distribute the air and fuel throughout the cell. Hatchwell et al. [22] developed a method for current collection from a tubular SOFC in the form of wires that wrapped around the cell perimeter. The problem of the non-uniform distribution of the air and fuel was not solved in this way. Lee et al. [23] developed a new method of current collection in the form of metallic wires that touched the cell’s surface and were used to collect the current from the cell. Pugh et al. [24] developed a new design for a current collector to be used in a µ-tubular SOFC. This design was adapted from the heat exchanger design developed by CALGAVIN Ltd. It was mainly based on increasing the contact surface area of the electrodes to increase the cell’s current collection and performance. They achieved a peak power density 4.3 times higher than that of the conventional design. The problem with this design is its complexity, which leads to high manufacturing costs compared to traditional designs.
Shi et al. [25] studied the use of metal wire brushes as current collectors. They investigated the use of brushes made of different materials, including stainless steel and copper–zinc. The copper–zinc brush showed a higher performance compared to the stainless steel one. Although a good performance was achieved, a uniform flow distribution was not guaranteed. Additionally, many previous studies [26,27,28,29,30] have focused on the current collector designs of tubular SOFCs.
Previous studies have either focused on the current collection or on achieving a uniform distribution for the species inside the cell from the above literature review. To achieve a higher current collection from the cell, previous studies have focused on increasing the contact active surface area with electrodes, which is considered an obstacle due to the nature of tubular SOFC design, as it means reducing the available area for the fuel and oxygen flow. Therefore, the main objective of the current work is to fulfill the real need to develop and optimize a new current collector that can collect the current efficiently and distribute the species uniformly through the flow channels.
In this study, a new current collector design is developed in which the flow channels are divided into small trapezoidal channels. These small trapezoidal channels can guarantee the uniformity of the flow and simultaneously concentrate the species distribution towards the electrodes’ surface to boost the electrochemical reactions and make the best use of the fuel. Additionally, this new design increases the active contact area of the electrodes for better current collection in a simple design that can be easily manufactured.
The current study develops a numerical model for tubular SOFCs, followed by the validation of the model with available experimental data. Then, the developed numerical model investigates the new current collector design and compares it with the traditional design.

2. Numerical Model

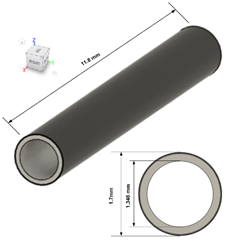
The tubular anode-supported SOFC type is investigated in this study. There are three main layers: a thin electrolyte, a thick anode, and a cathode. The material properties and cell dimensions for the cell components are summarized in Table 1 and Table 2, respectively [31,32,33]. The boundary conditions applied to the model are summarized in Table 3. Hydrogen is used as a fuel, while air is used to supply the cell with oxygen. The fuel is fed in on the anode side, and the outer surface of the cathode is exposed to air. The model includes all the solid oxide fuel cell-governing equations, such as the fluid flow, mass transport, heat transfer, electrochemistry, and charge transport. The sections below describe the governing equations used in the model in detail.

2.1. Mass Conservation

The modified Stefan–Maxwell [34,35] equations were used to model the mass transport of species inside the solid medium. The dilute approximation method was used to model the movement of species through the porous medium [36]. The governing equations for the species transport are as follows:
· ( ρ u ω i ρ ω j D i j e f f (   x i + ( x i ω i ) p p ) ) = S i  
D i j _ a e f f = ( ε a ) 1.5 ( 1 s ) r s D i o ( P o P ) γ p ( T o T ) γ t  
D i j _ c e f f = ( ε c ) 1.5 ( 1 s ) r s D i o ( P o P ) γ p ( T o T ) γ t  

2.2. Energy Conservation

The energy conservation at the two electrodes was modeled using the thermal equilibrium model at the two electrodes. The temperature of the fluid and the porous medium were assumed to be the same. The corresponding equations are described as follows [36]:
  · ( k     T + i h i n i ) ρ · C p u · T = S h e + S h j
  · ( k     T ) = 0
  · ( k     T ) ρ · C p u · T = 0

2.3. Charge Transport

Inside the cell, there are ions (hydrogen and oxygen ions) and electrons, and their movement must be considered. Electronic and ionic movement happens in the anode and cathode, and only ionic transport occurs inside the electrolyte. Only electronic transport happens inside the current collector, and Ohm’s law was used to model the charge balance [37]:
Electronic charge balance:
          A t   a n o d e                 ·   ( λ a e f f     ϕ e l ) = j a A V
A t   c a t h o d e                 ·   ( λ c e f f     ϕ e l ) = j c A V
Ionic charge balance:
A t   e l e c t r o l y t e                 ·   ( σ m e m     ϕ i o ) = 0
    A t   a n o d e                 ·   ( σ a e f f     ϕ i o ) = j a A V
      A t   c a t h o d e                 ·   ( σ c e f f     ϕ i o ) = j c A V
The values of the volumetric current densities were calculated using the Butler–Volmer equation [37] as follows:
j a   = j o , r e f H 2 ( C H 2 C H 2 , r e f ) γ H 2   [ e x p     e x p   ( β n F η a R T ) e x p     e x p   ( ( 1 β ) n F η a R T )   ]
j c = j o , r e f o 2 ( C o 2 C o 2 , r e f ) γ o 2   [ e x p     e x p   ( β n F η c R T ) e x p     e x p   ( ( 1 β ) n F η c R T )   ]
where η i is the activation overvoltage and can be expressed as:
  η i = ϕ e l ϕ i o Δ ϕ e q

3. Numerical Methodology

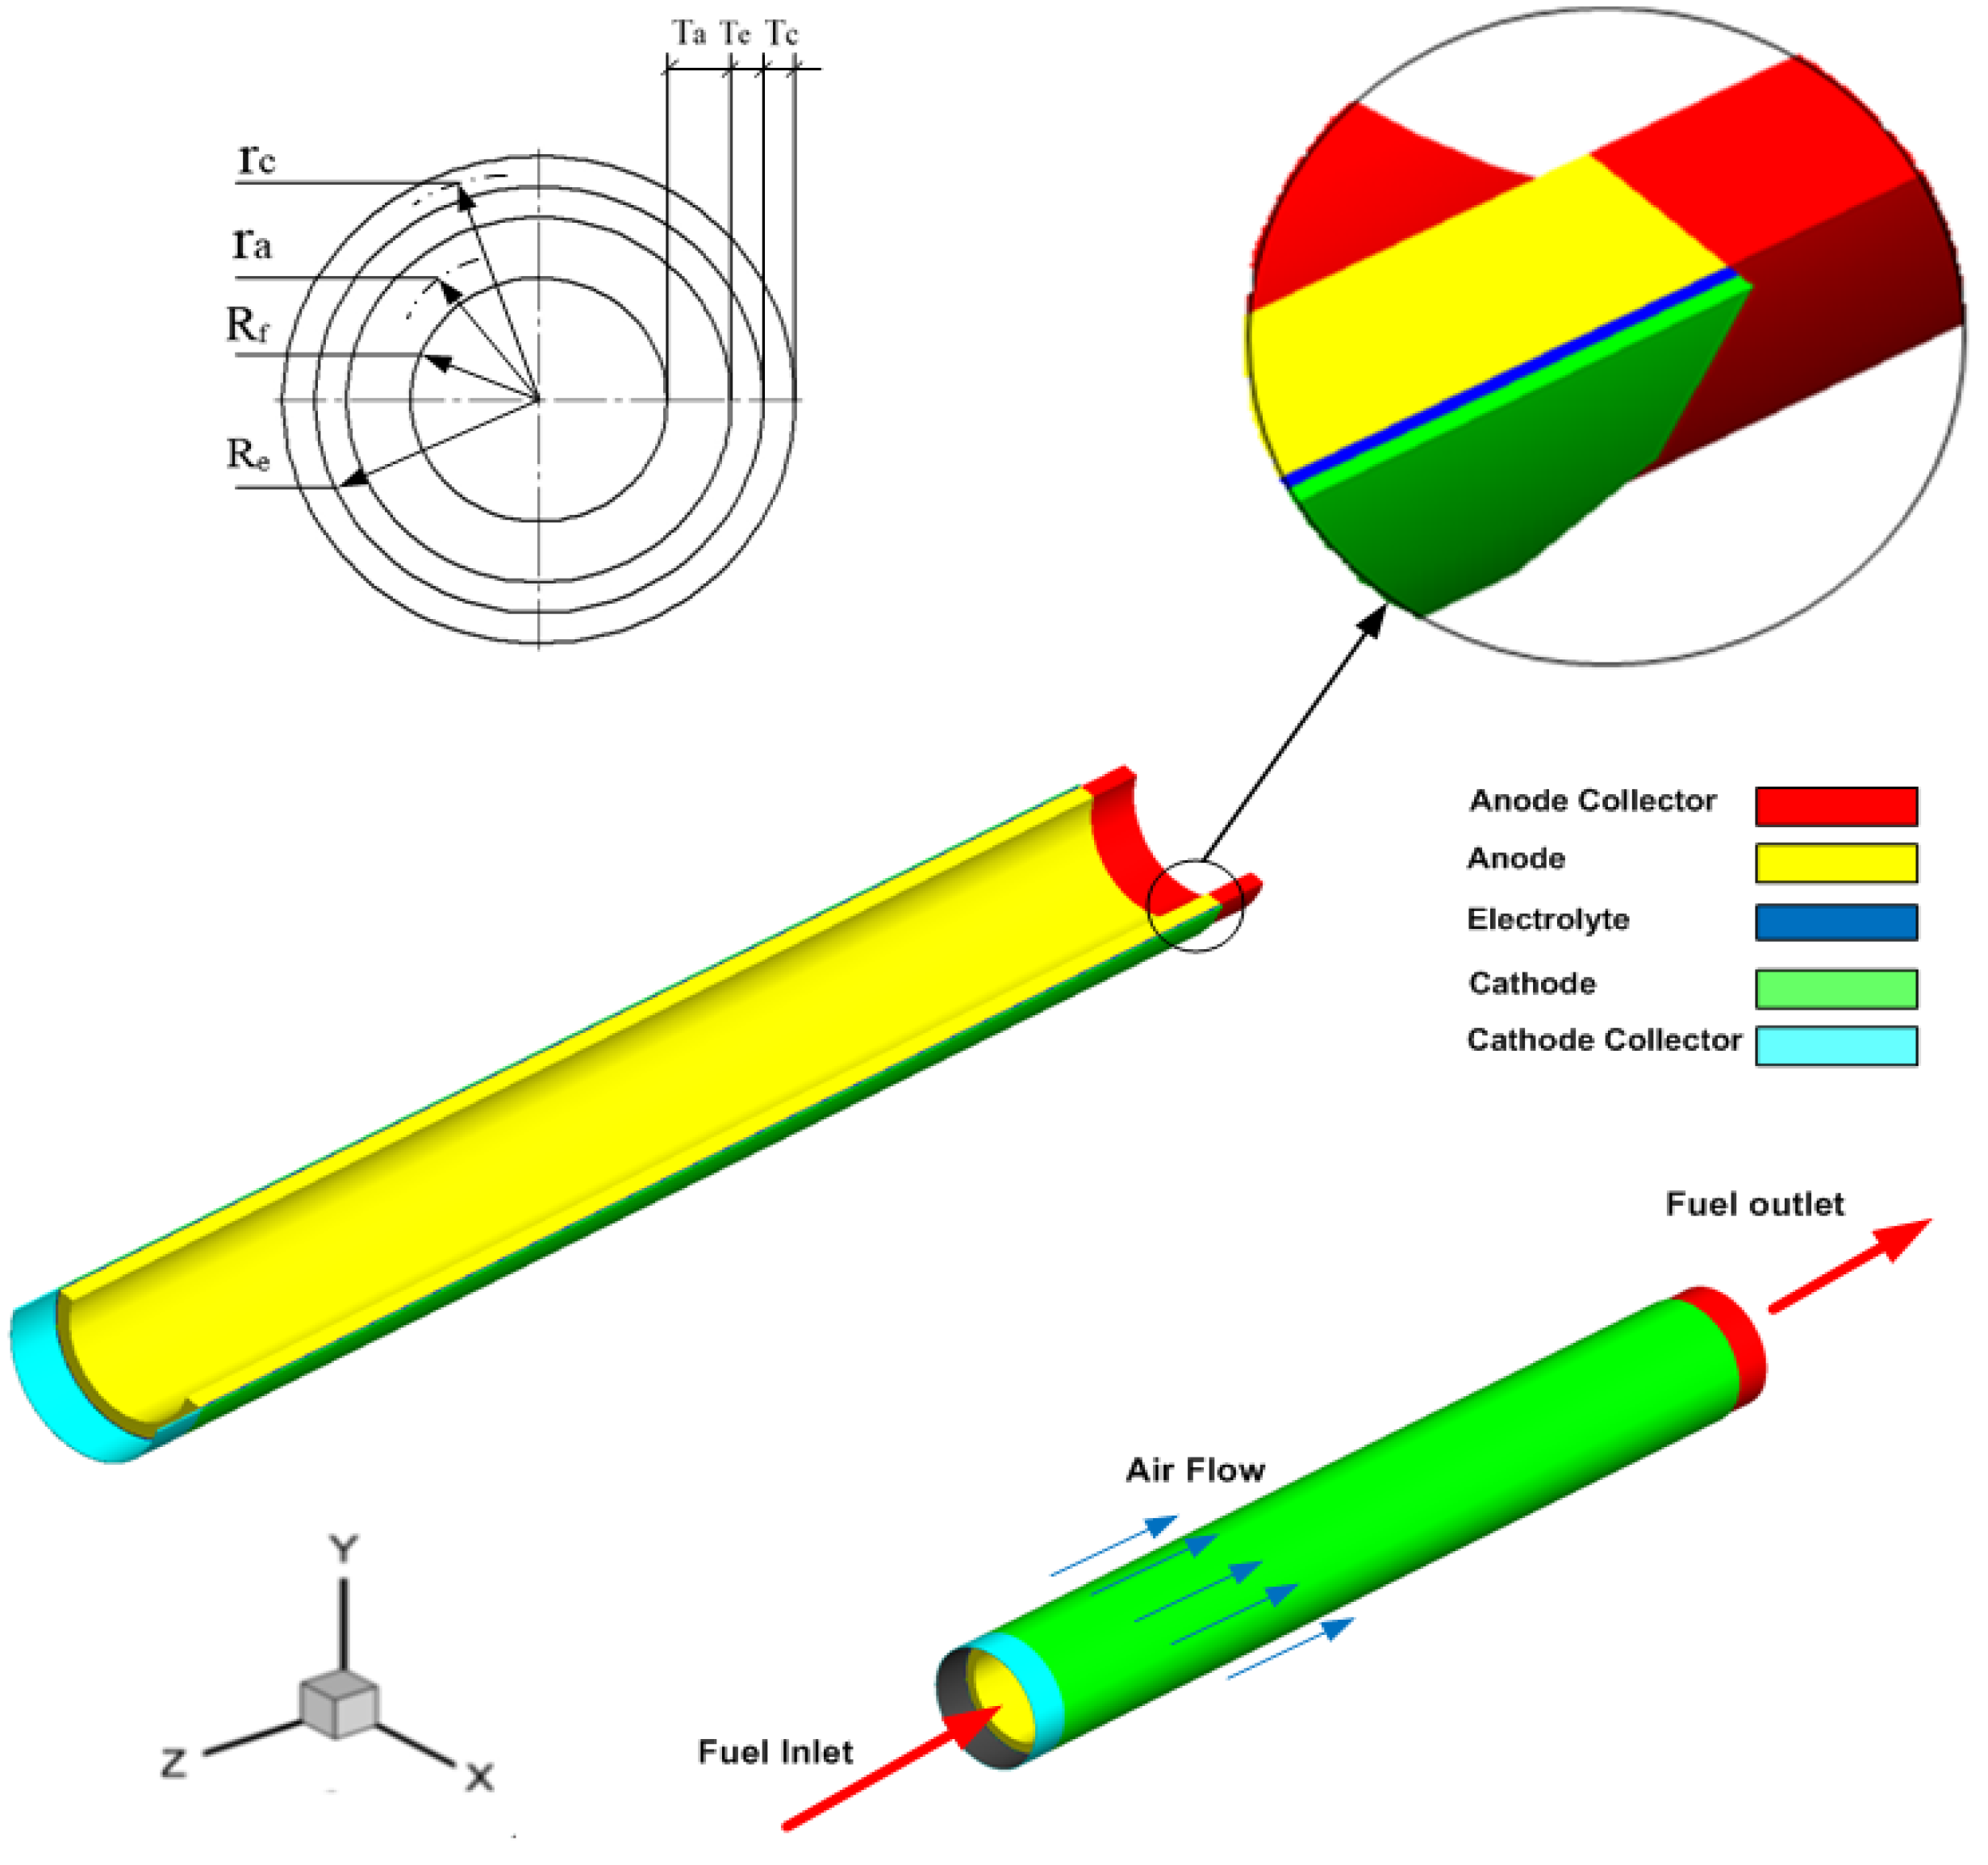
This section describes the cell geometry and the computational domain (the mesh) of the tubular cell used in this study. Additionally, the numerical solution for the governing equations and the model validation are described. The model geometry consists of an anode, a cathode, an electrolyte, flow channels, and current collectors, as shown in Figure 2.

3.1. Numerical Solution

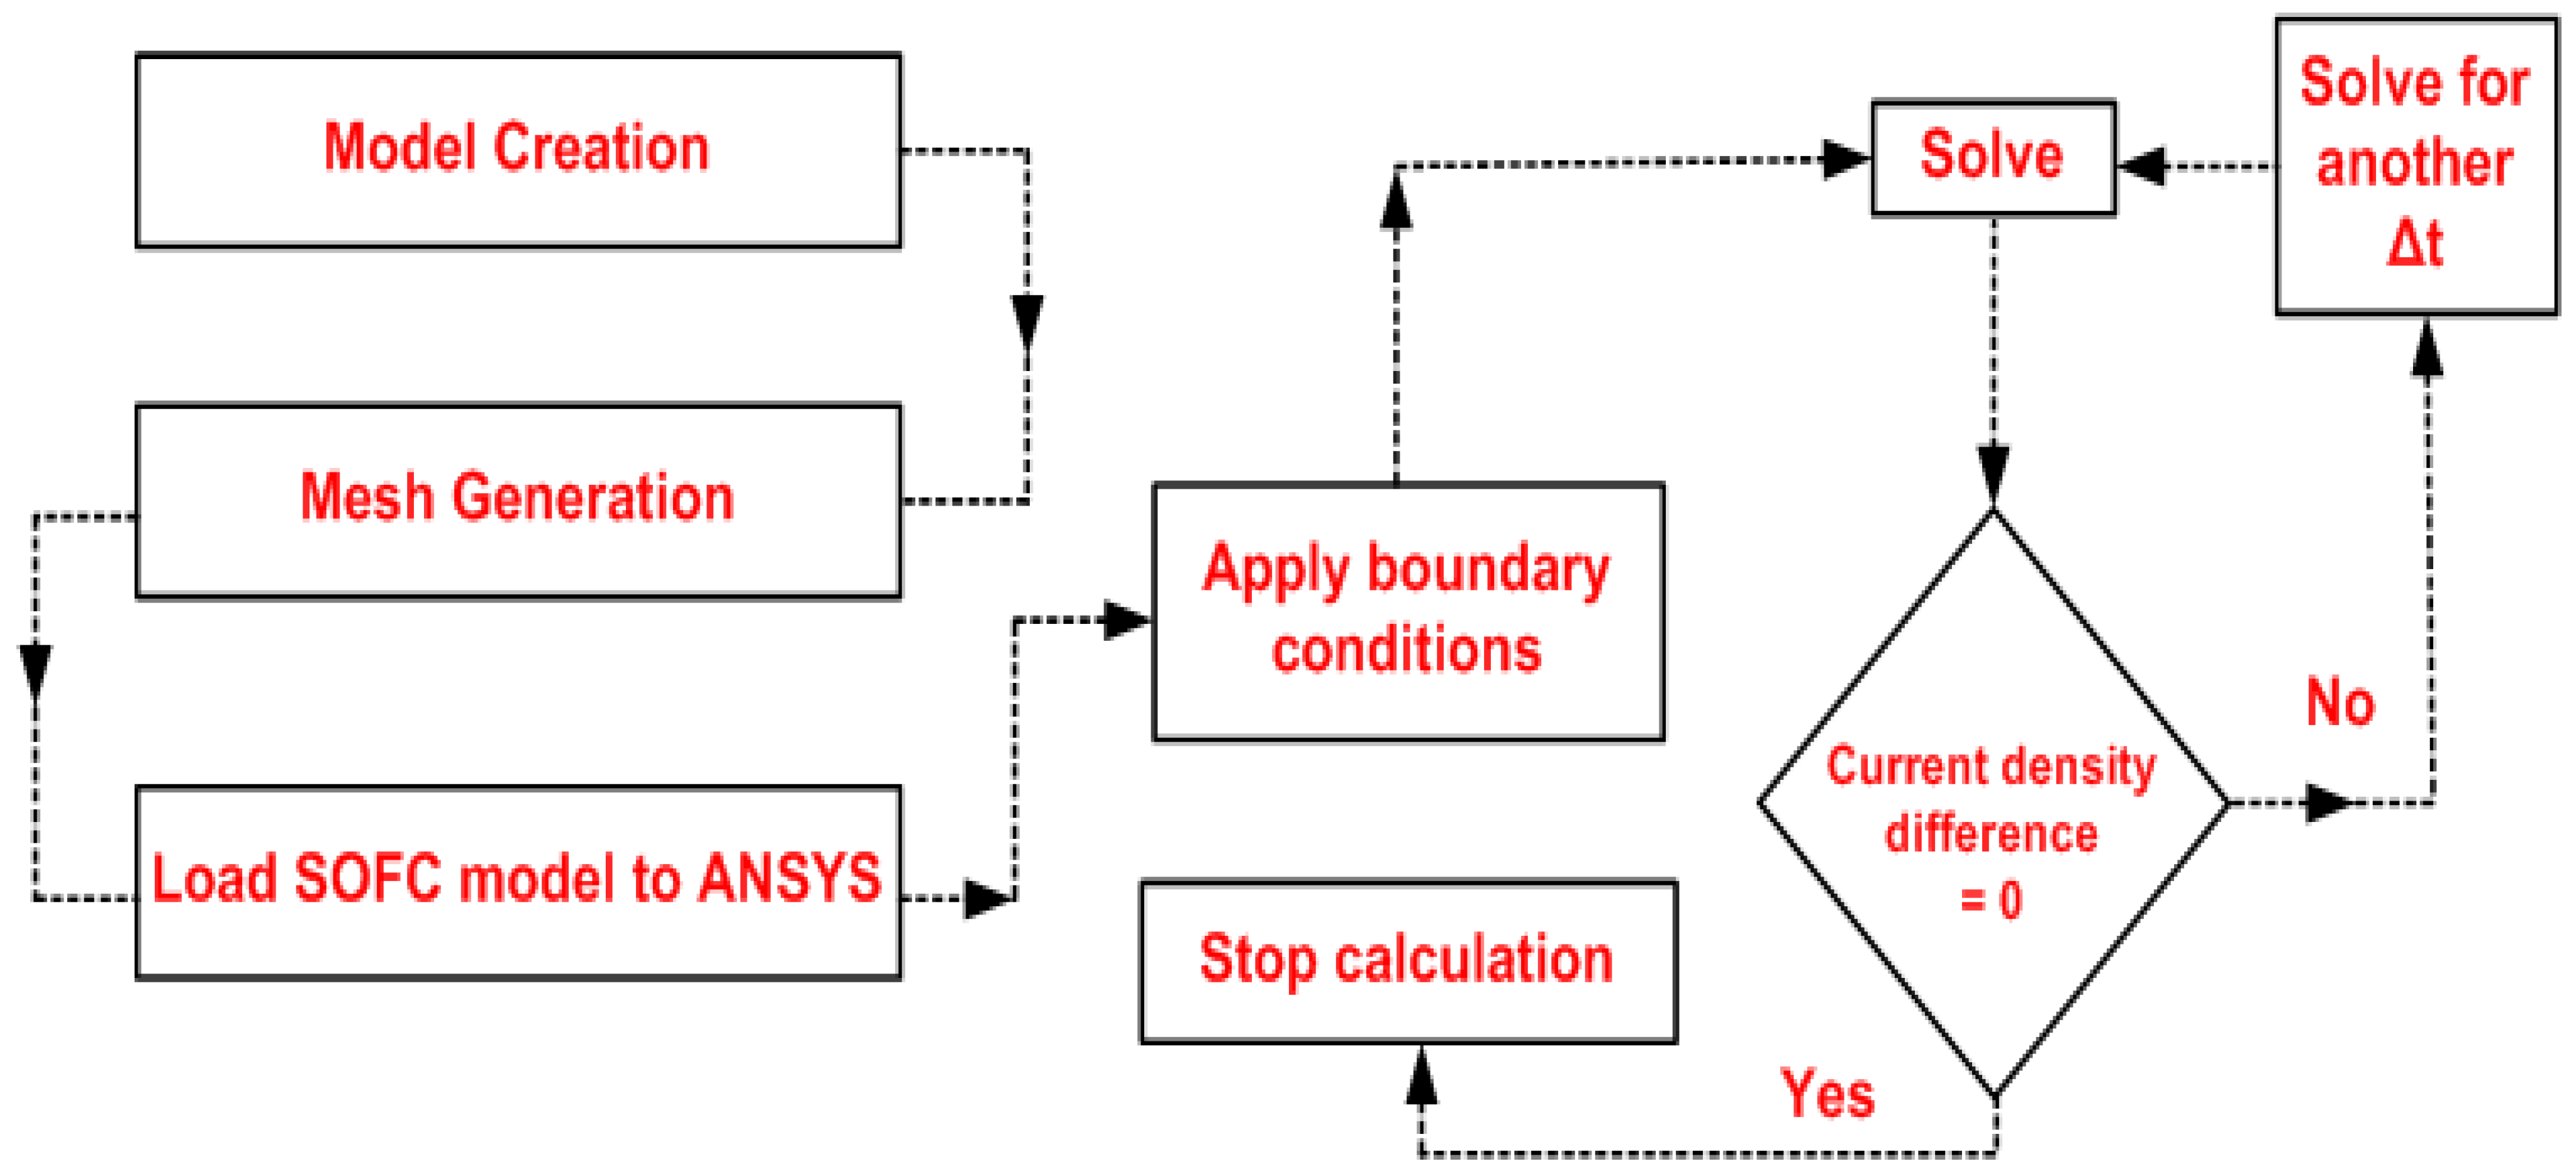
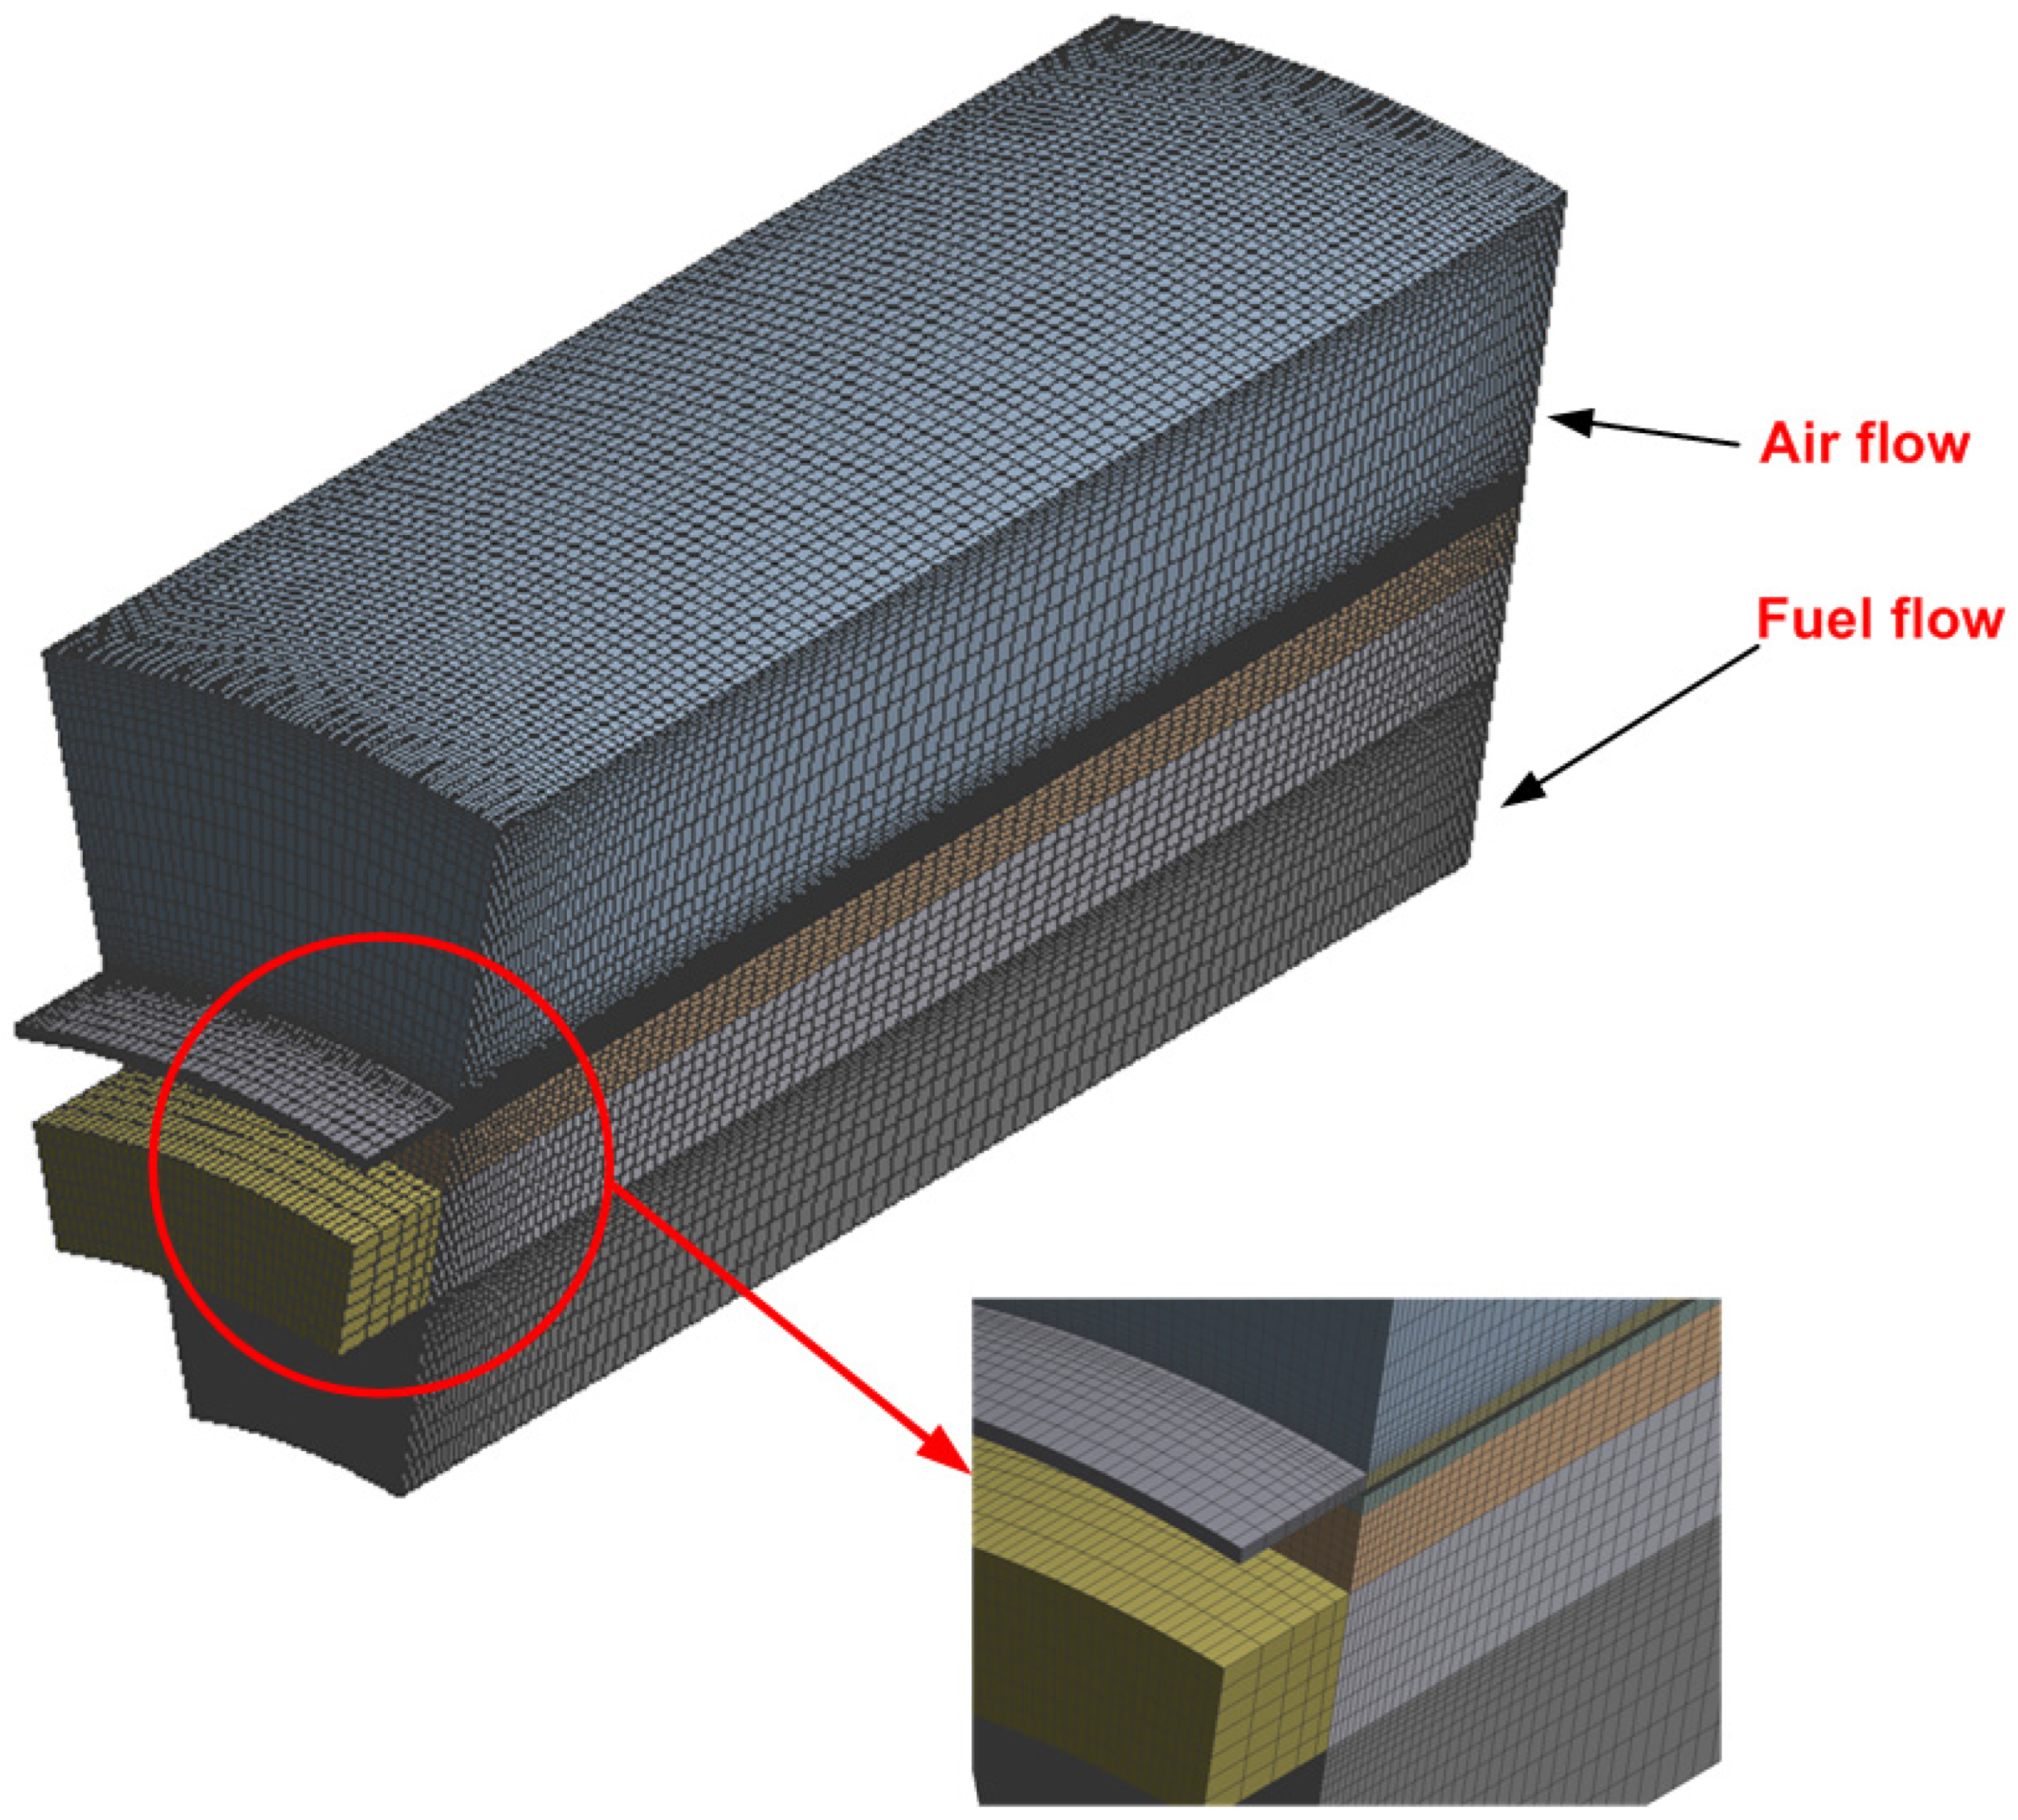
The developed tubular SOFC numerical model was solved using the ANSYS FLUENT 2020R2. All initial and boundary conditions were as described previously. Figure 3 depicts the steps used to solve the problem. Half of the channel was considered during the calculation to save computation time. The computational domain was created, as illustrated in Figure 4. The computational domain was very fine near the entrance/exit of the flow. Additionally, cell size was very small near the walls and at positions where the current was collected from the cell. Additionally, the anode, electrolyte, and cathode were finely discretized. A mesh density analysis was performed where two different mesh levels, A and B, were used to check the model and ensure that no errors came from poor mesh quality, and the results are summarized in Table 4. The current density was used in this comparison, as summarized in Table 4. The comparison indicated that mesh level B gives more accurate results than mesh level A. Therefore, mesh B was used in the current study.

3.2. Model Validation

In order to use the numerical model effectively, it is important to confirm that the results obtained from the numerical model are accurate and correct. This objective can be achieved by validating the numerical results with available experimental data. The polarization curve (I–V curve) is an effective way to compare the validation of the numerical model with the experimental data. The I–V curve can be constructed experimentally by fixing the voltage at certain values and then measuring the current density at each value. The same method can be followed to construct the I–V curve through the numerical model. The I–V curve obtained from the numerical model was compared with the I–V curve obtained experimentally by Yang et al. [38] and Chaisantikulwat et al. [39] at different operating conditions and cell configurations, as described in Table 5. The results demonstrated that the numerical model could obtain results nearly identical to those obtained experimentally under different operating conditions and also with different cell configurations (as shown in Figure 5), confirming the model’s validity and its ability to simulate the real case, even when used with cells of different dimensions and configurations. Comparing the results of the numerical model with the experimental values obtained by Yang et al. [38] and Chaisantikulwat et al. [39], the maximum errors were 5.3% and 5.85% at 0.6 volts, respectively. These results ensure the validity of the numerical model using various geometrical configurations, boundaries, and operating conditions and that it can be utilized effectively to investigate and attain the purpose of this study.

4. New Current Collector Design

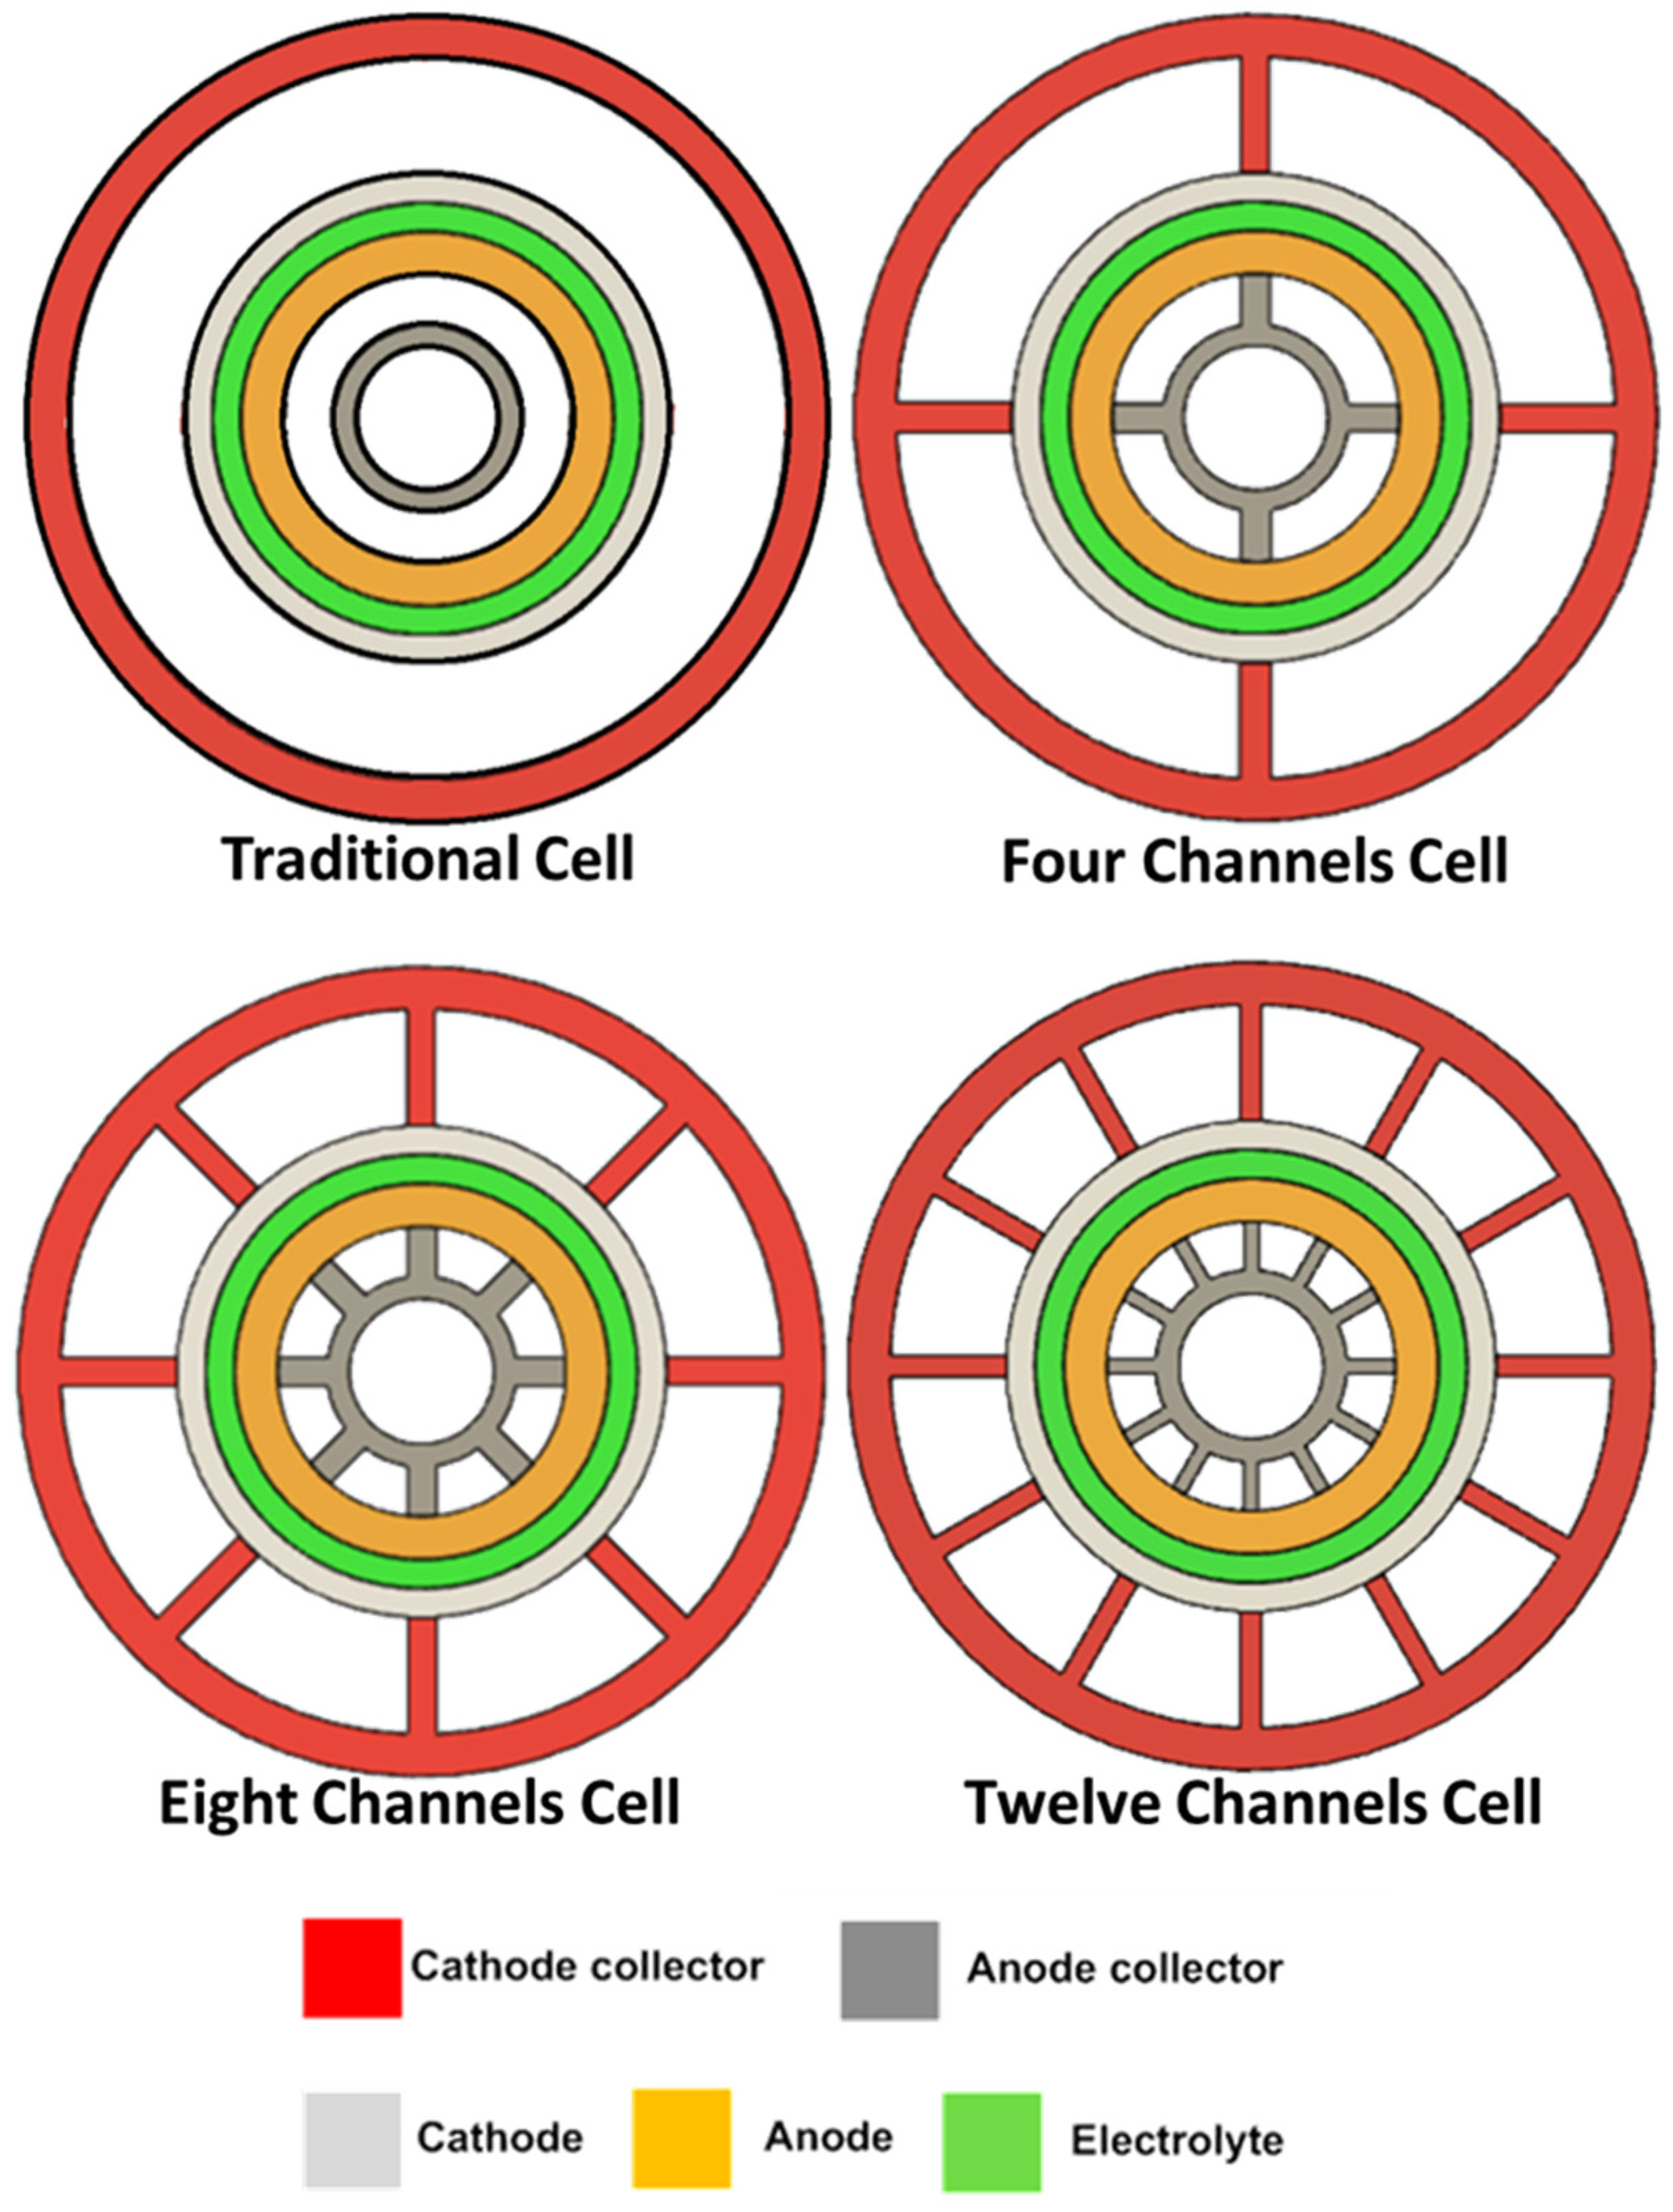
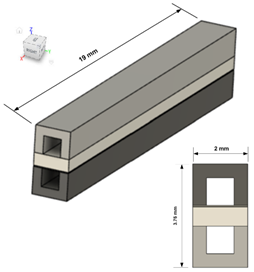
A new design for a current collector was developed to solve the two main problems of tubular SOFCs: the uniform flow distribution and current collection. The new design is a trapezoidal-shaped collector, as shown in Figure 6, with different channels on each side (cathode and anode) to control the uniformity of the flow. Additionally, each channel has two ribs connected to the outer surface of both the anode and cathode at which the current is collected. Three different designs are investigated in this study with four, eight, and twelve channels.

5. Results and Discussion

5.1. Cell Performance

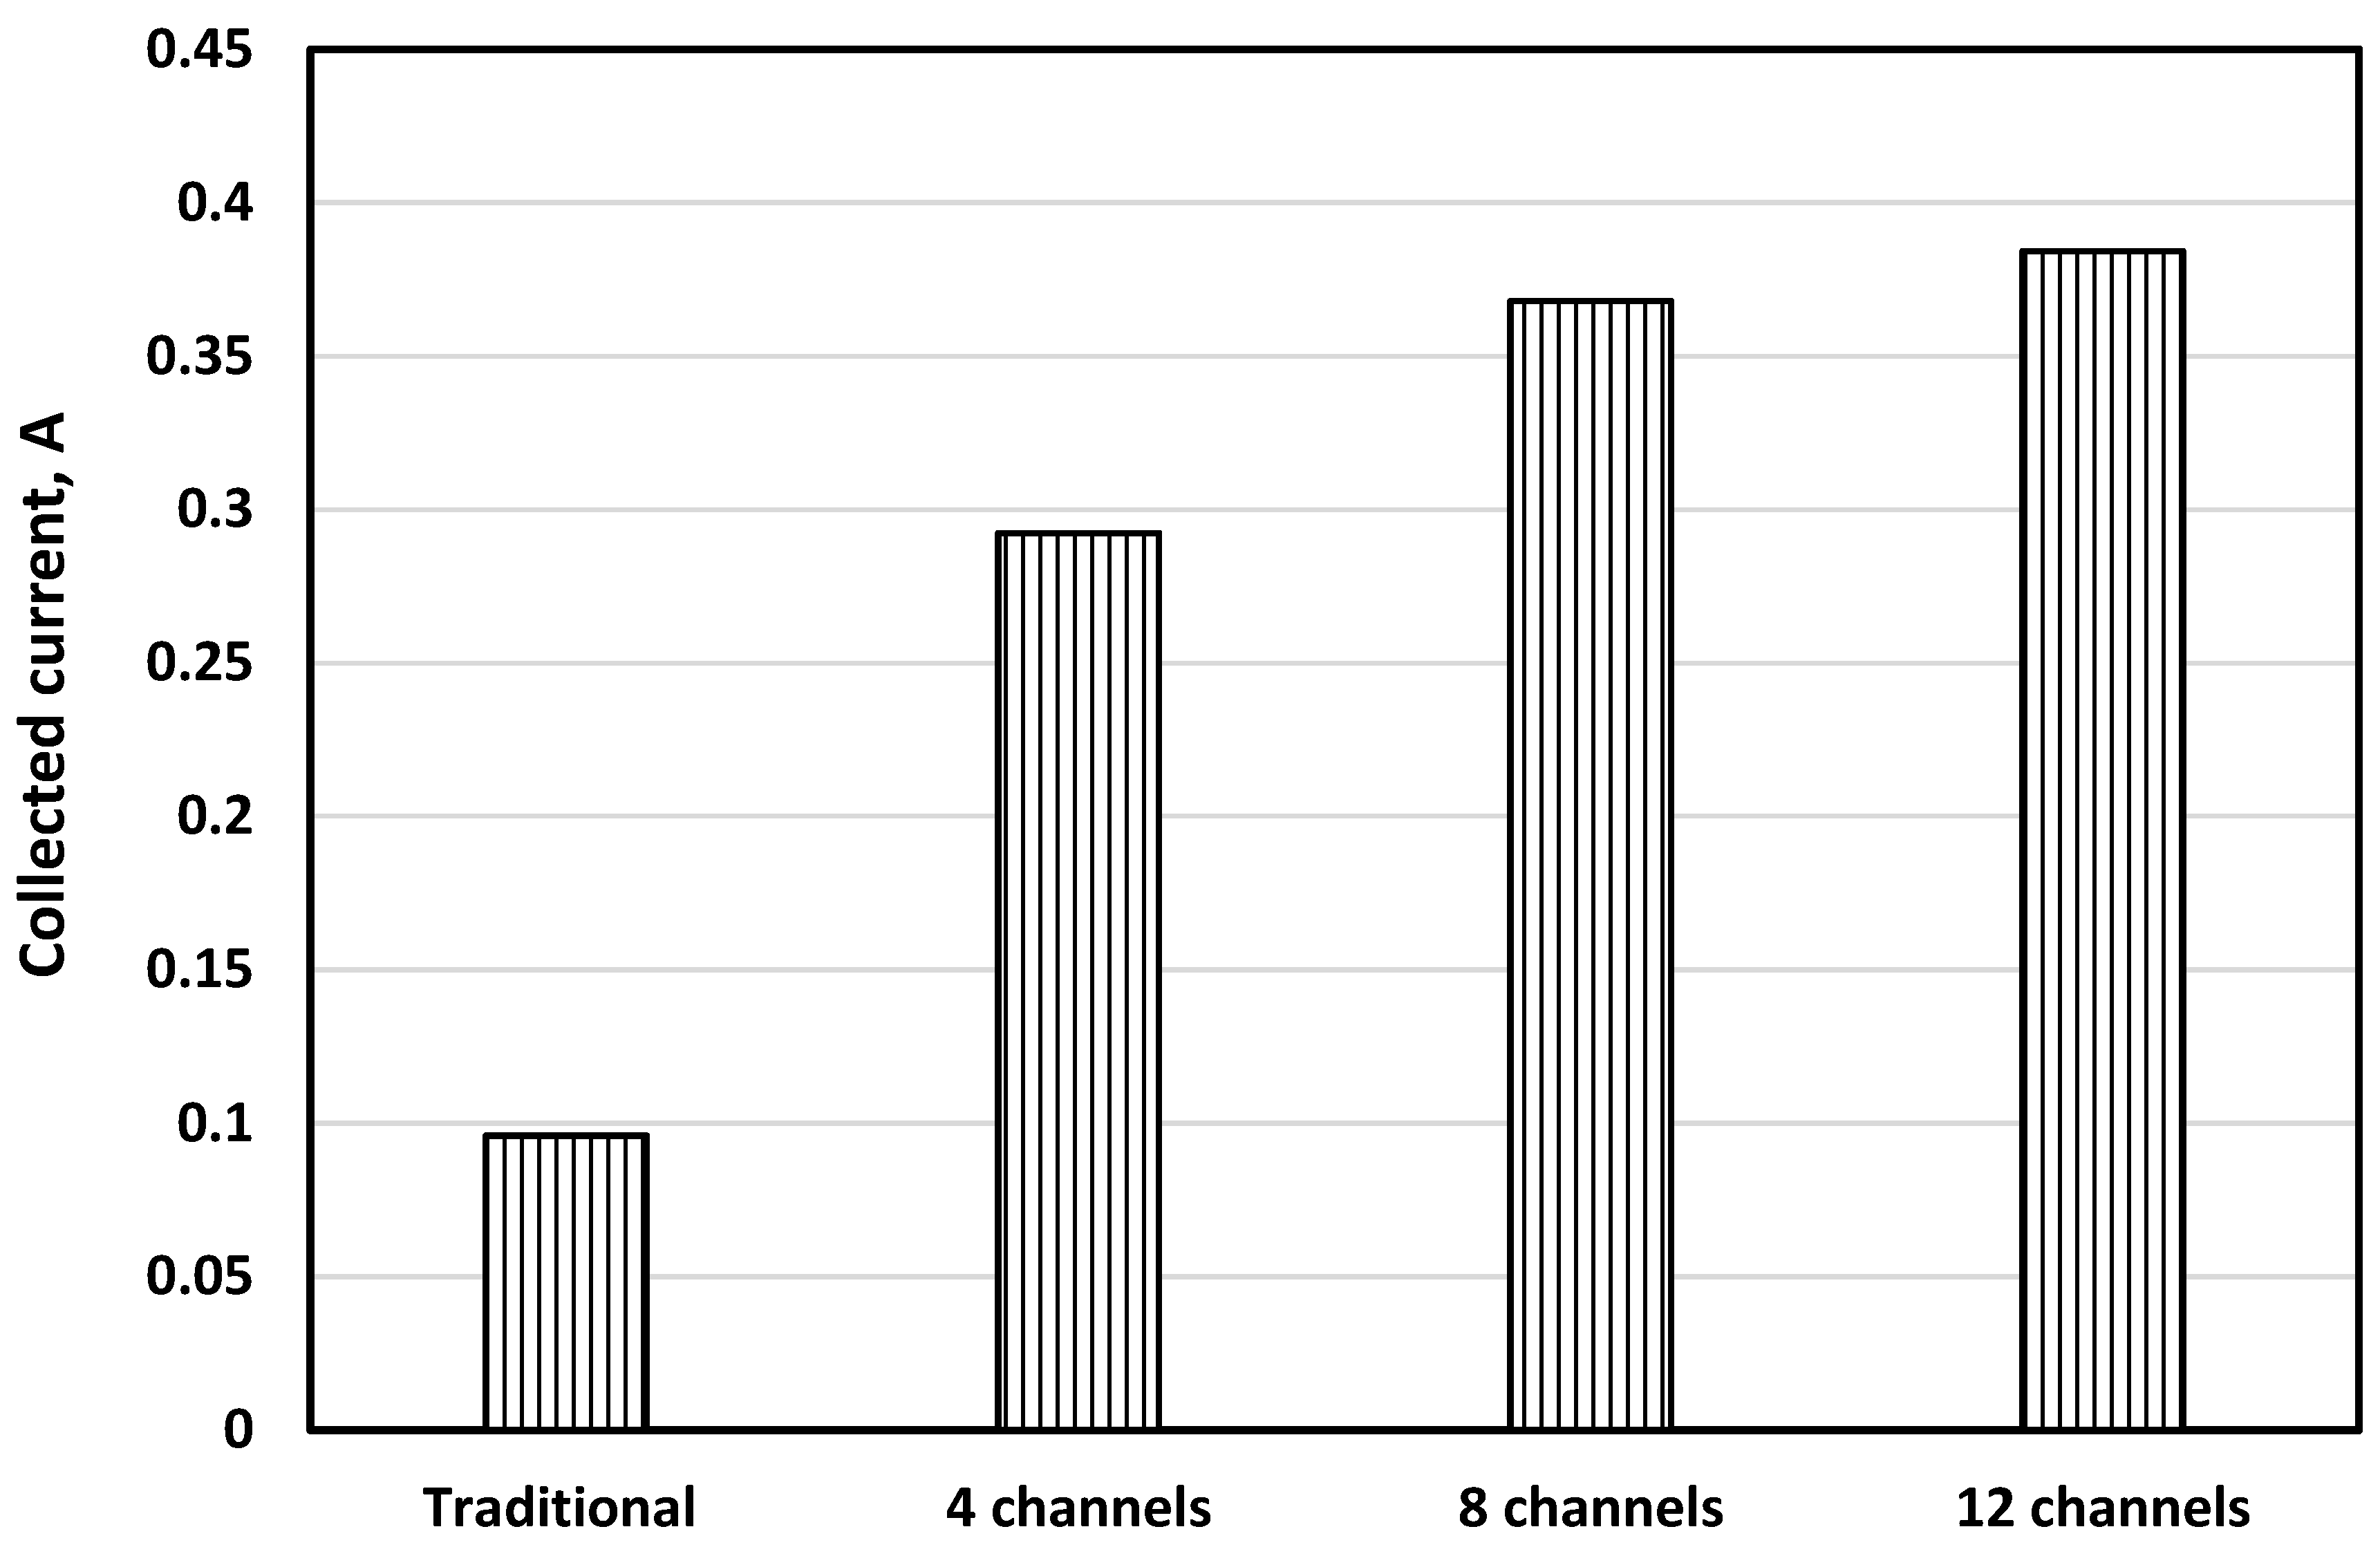
As described previously, three designs with four, eight, and twelve channels were investigated in this study and compared with the traditional design. The current generated from each design was used to compare the performance of each design. Figure 7 shows the collected current from the different cell designs. The cell with twelve flow channels collected the maximum current compared to the other designs. The collected current from the cell with twelve channels was 0.384 A, while the collected current from the cell with eight channels was 0.368 A, and the collected current from the cell with four channels was 0.292 A. When comparing the cell’s performance with twelve channels with the cell’s performance with four channels, there was a 30% increase in cell performance.
It can be concluded that increasing the number of channels led to an increase in the collected current from the cell. The cell with twelve channels collected more current than the other designs, mainly due to the improvement in the distribution of the species inside the channels. Moreover, the increase in the contact area between the current collector and the two electrodes increased the level of the electrochemical reactions inside the cell. Additionally, the electrical conductivities of both the anode and cathode were low. Consequently, it is better to increase the contact areas to compensate for these low electrical conductivities, allowing more reactions to occur by achieving the closed-circuit condition in as many areas as possible. Thus, increasing the contact area of the anode and cathode with current collectors enhances the cell performance by increasing current density.
Additionally, increasing the contact area with the cell led to an efficient collection of the generated current. The total current collected from the traditional design was about 0.1 A, which can be considered very low compared with the developed design with different channels. This low current production was mainly due to the low contact area of the current collector with the cell. Therefore, it can be concluded that the developed design is significantly better than the traditional design in current collection.
Additionally, increasing the number of channels beyond a certain number might not achieve a noticeable breakthrough in the performance. As shown in Figure 7, the difference in the collected current between 8 and 12 channels is insignificant. However, it may decrease the performance by reducing the interaction area between the fuel/air and electrodes.

5.2. Species Distribution

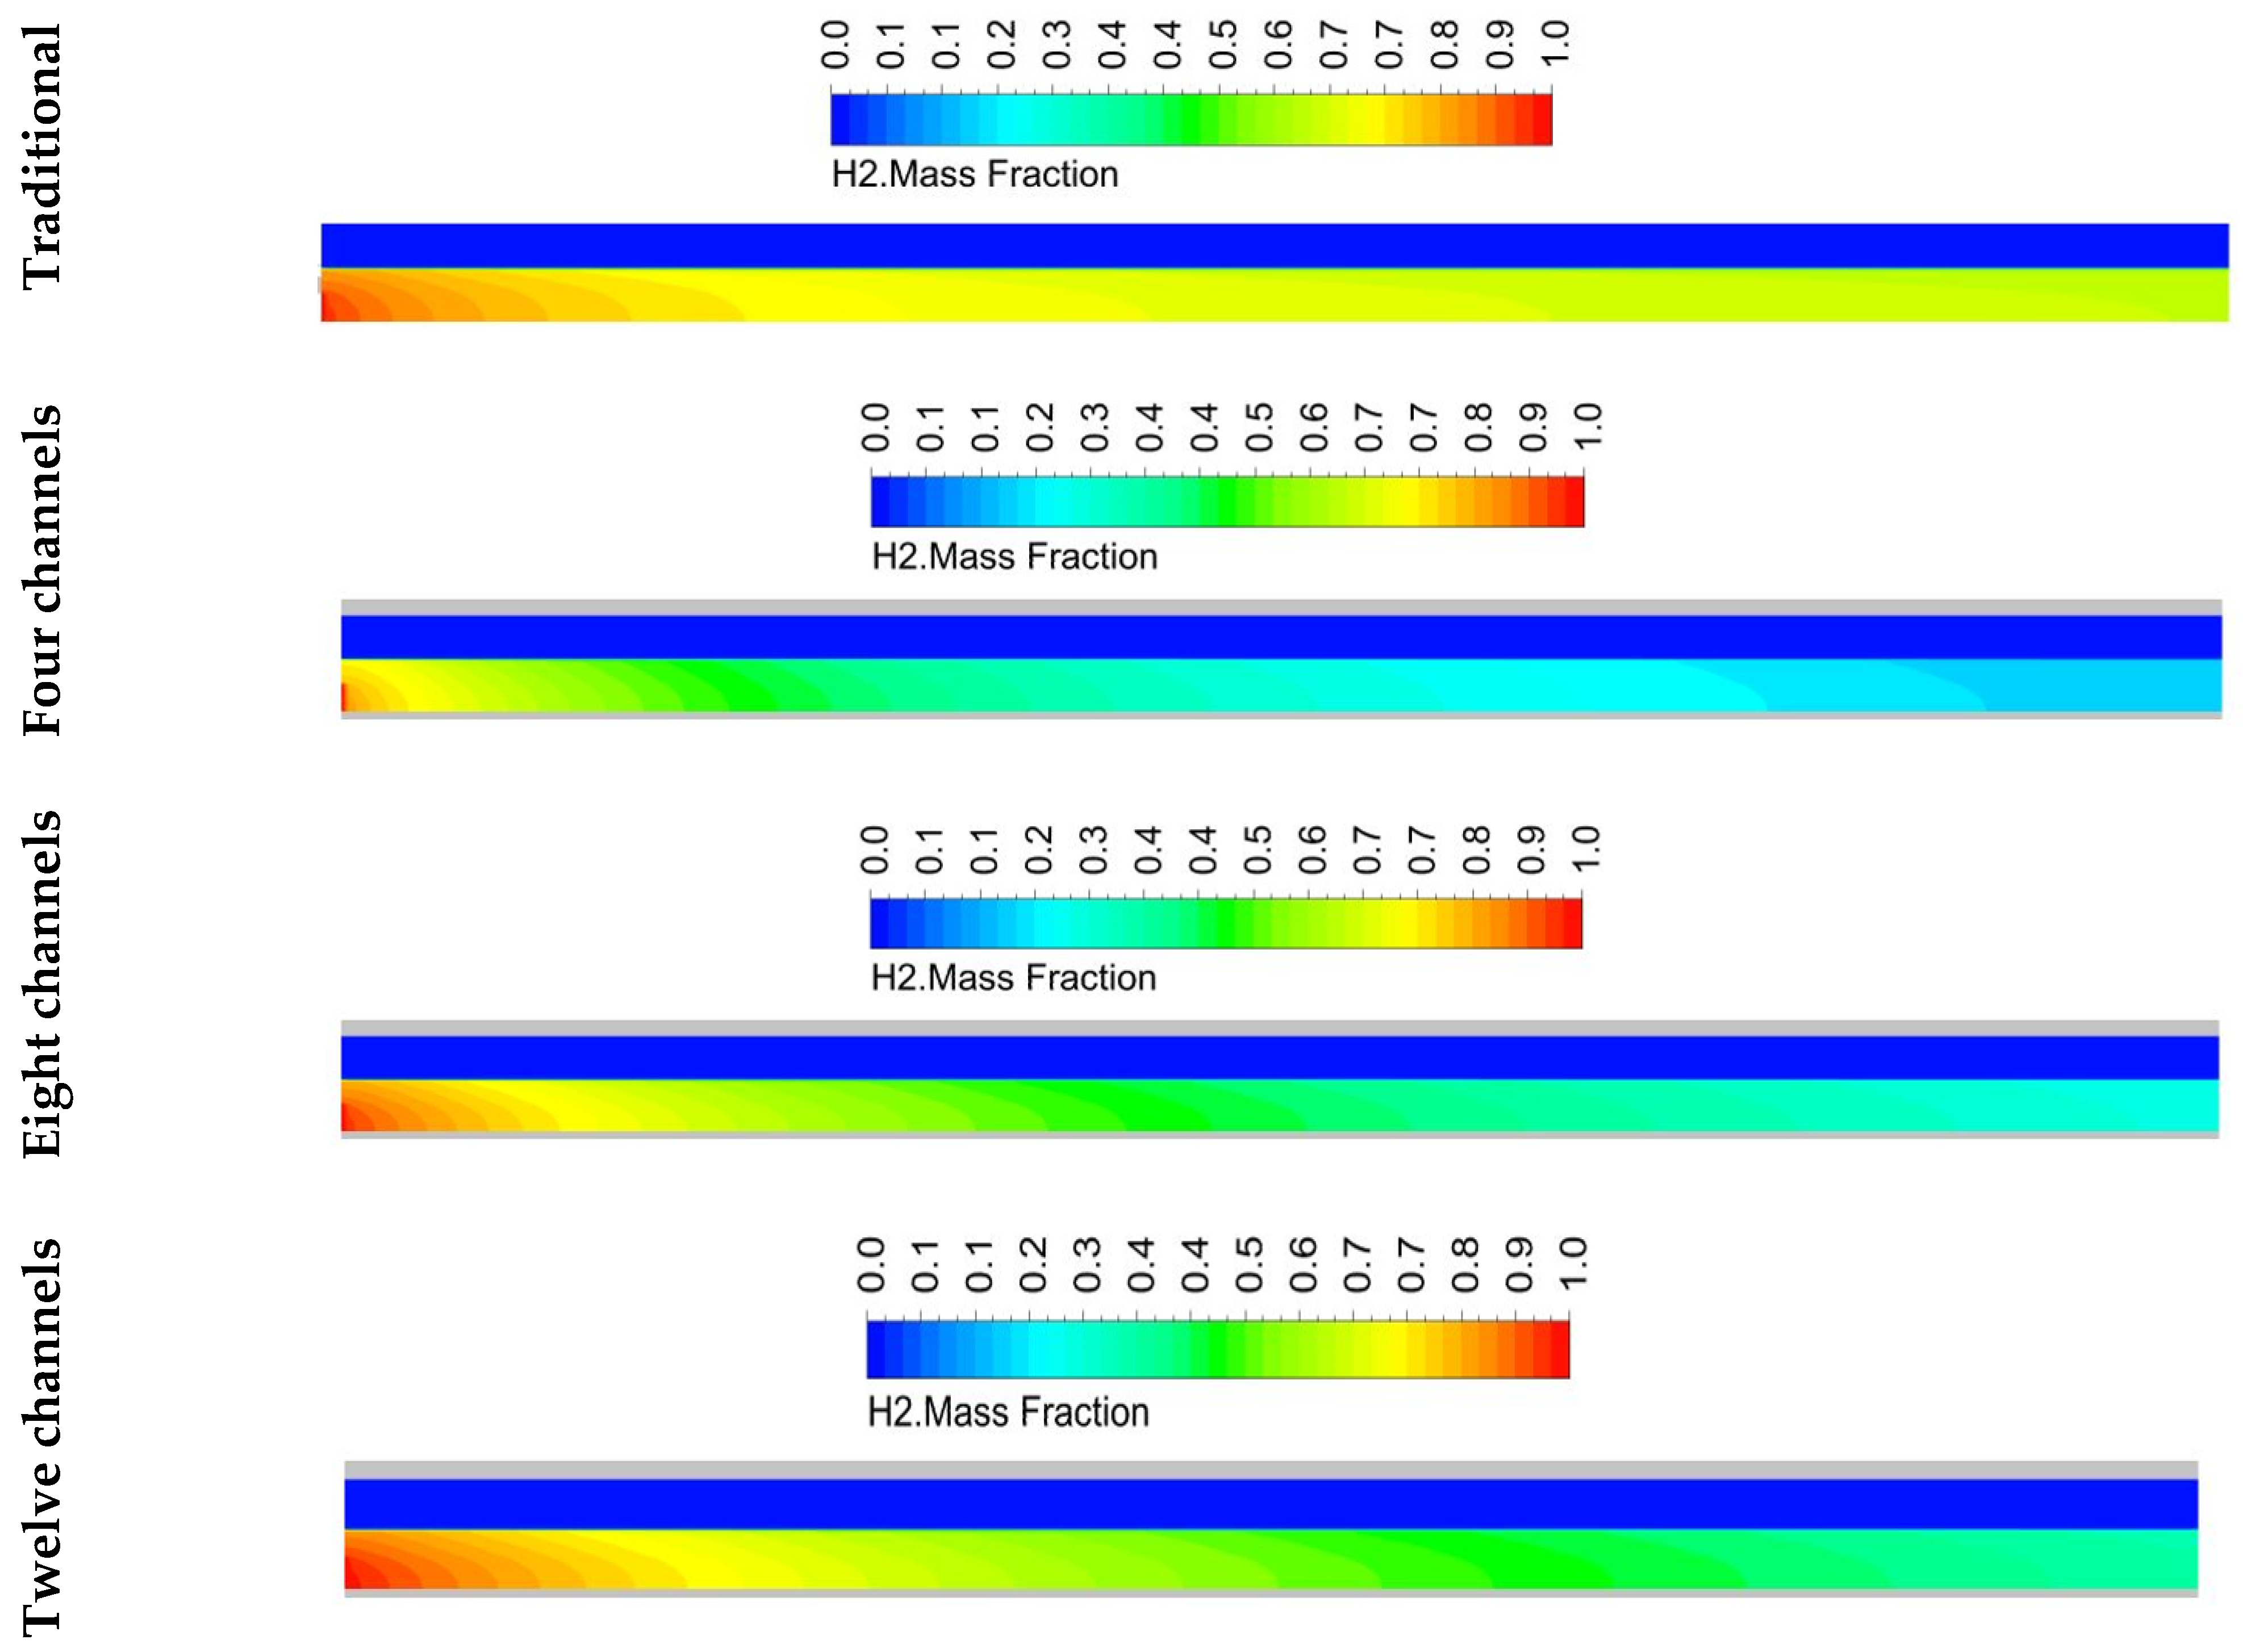
Figure 8 below shows the hydrogen species distribution contour through the anode flow channel for the traditional and the developed design. Generally, the hydrogen concentration decreases gradually from the inlet to the outlet due to hydrogen consumption in chemical reactions. For the traditional design, it can be seen that the hydrogen consumption was very low compared to the newly developed trapezoidal design with different channels. This low hydrogen consumption was due to the small contact area of the collector with the anode and cathode, which explains the achieved low performance using traditional designs. The developed trapezoidal design with different channels showed good hydrogen consumption, leading to good performance compared to the traditional design.
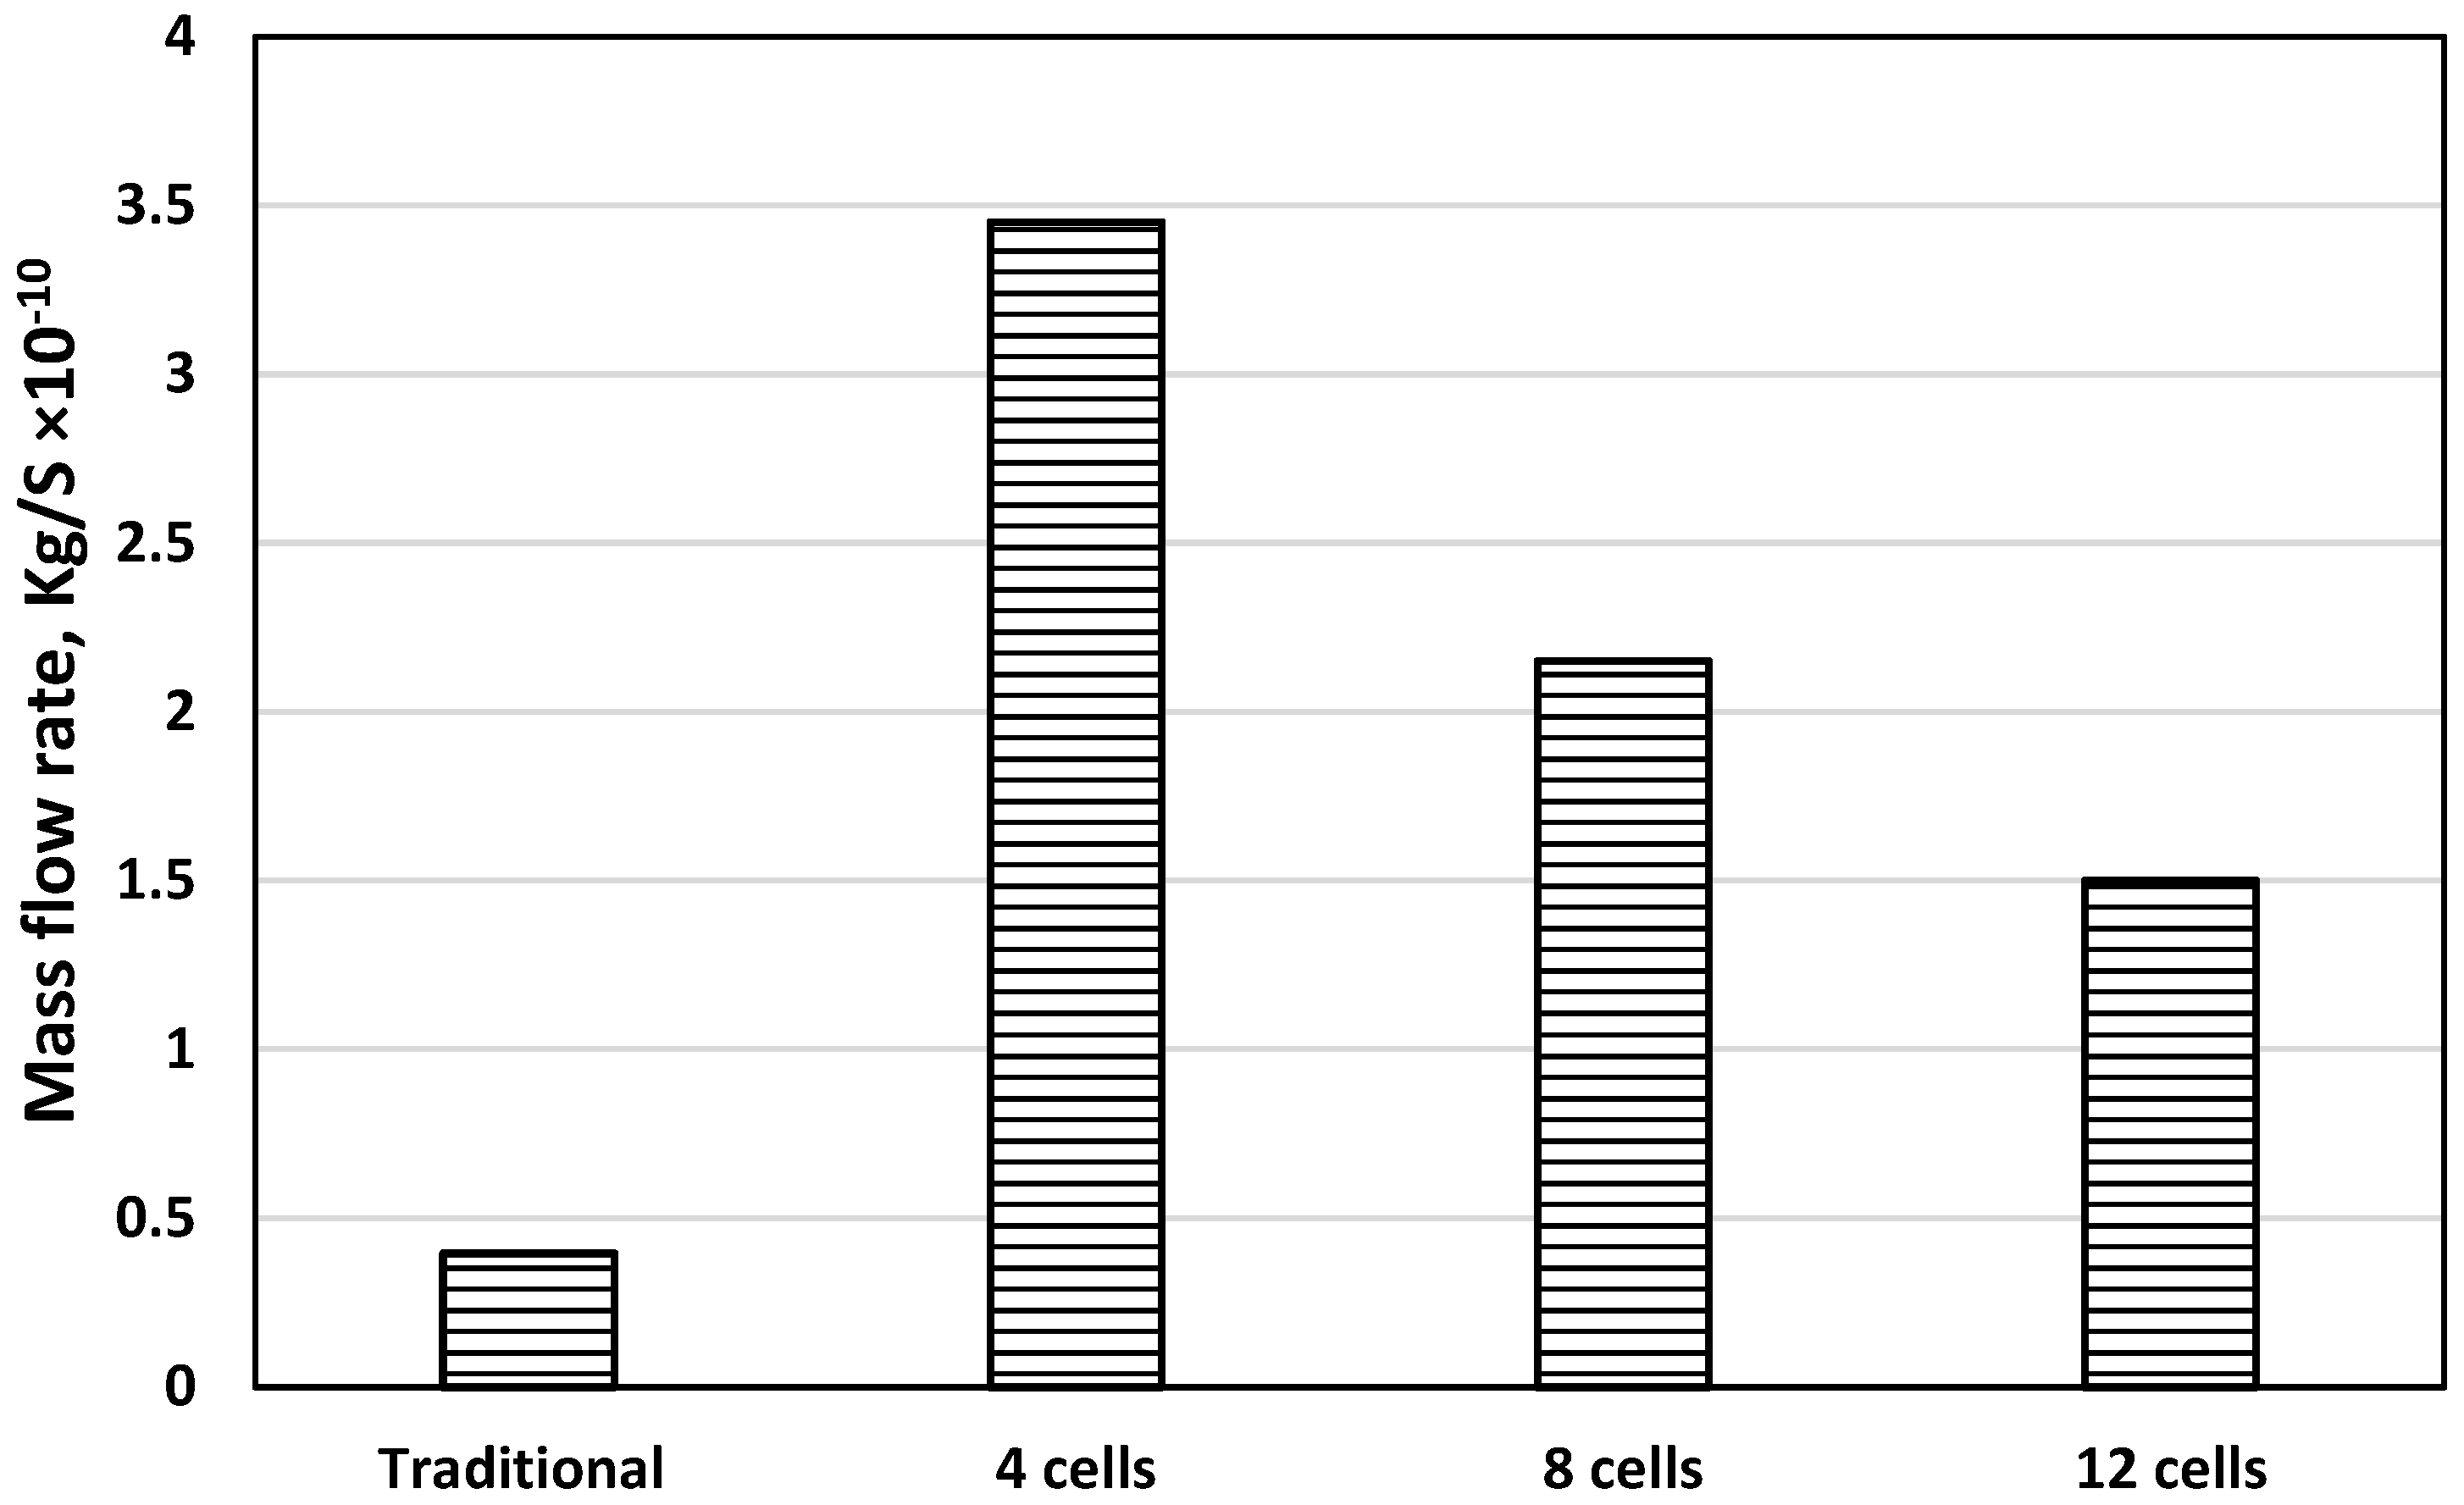
Figure 9 shows the mass flow rate of hydrogen at the outlet for each design. The maximum mass flow rate of hydrogen was detected for the traditional design, and therefore this design cannot make the best use of fuel (hydrogen). As concluded in Figure 7, increasing the number of channels in the developed trapezoidal design increased the collected current from the cell. This performance enhancement, achieved by increasing the number of channels in the developed trapezoidal design, is mainly due to an increase in the current collector’s contact area with the cell, leading to the efficient collection of the current from the cell. Additionally, increasing the collected current should be accompanied by more hydrogen consumption. However, as shown in Figure 9, the lowest fuel mass flow rate was achieved when using the developed trapezoidal design with four channels and not when using the design with the highest number of channels. This was mainly because increasing the contact area (as is the case in the eight- and twelve-channel designs) decreases the interaction area of the fuel/air with the electrodes, and this hinders the fuel/air from reaching certain reaction sites and creates a high mass flow rate at the exit (Figure 9).
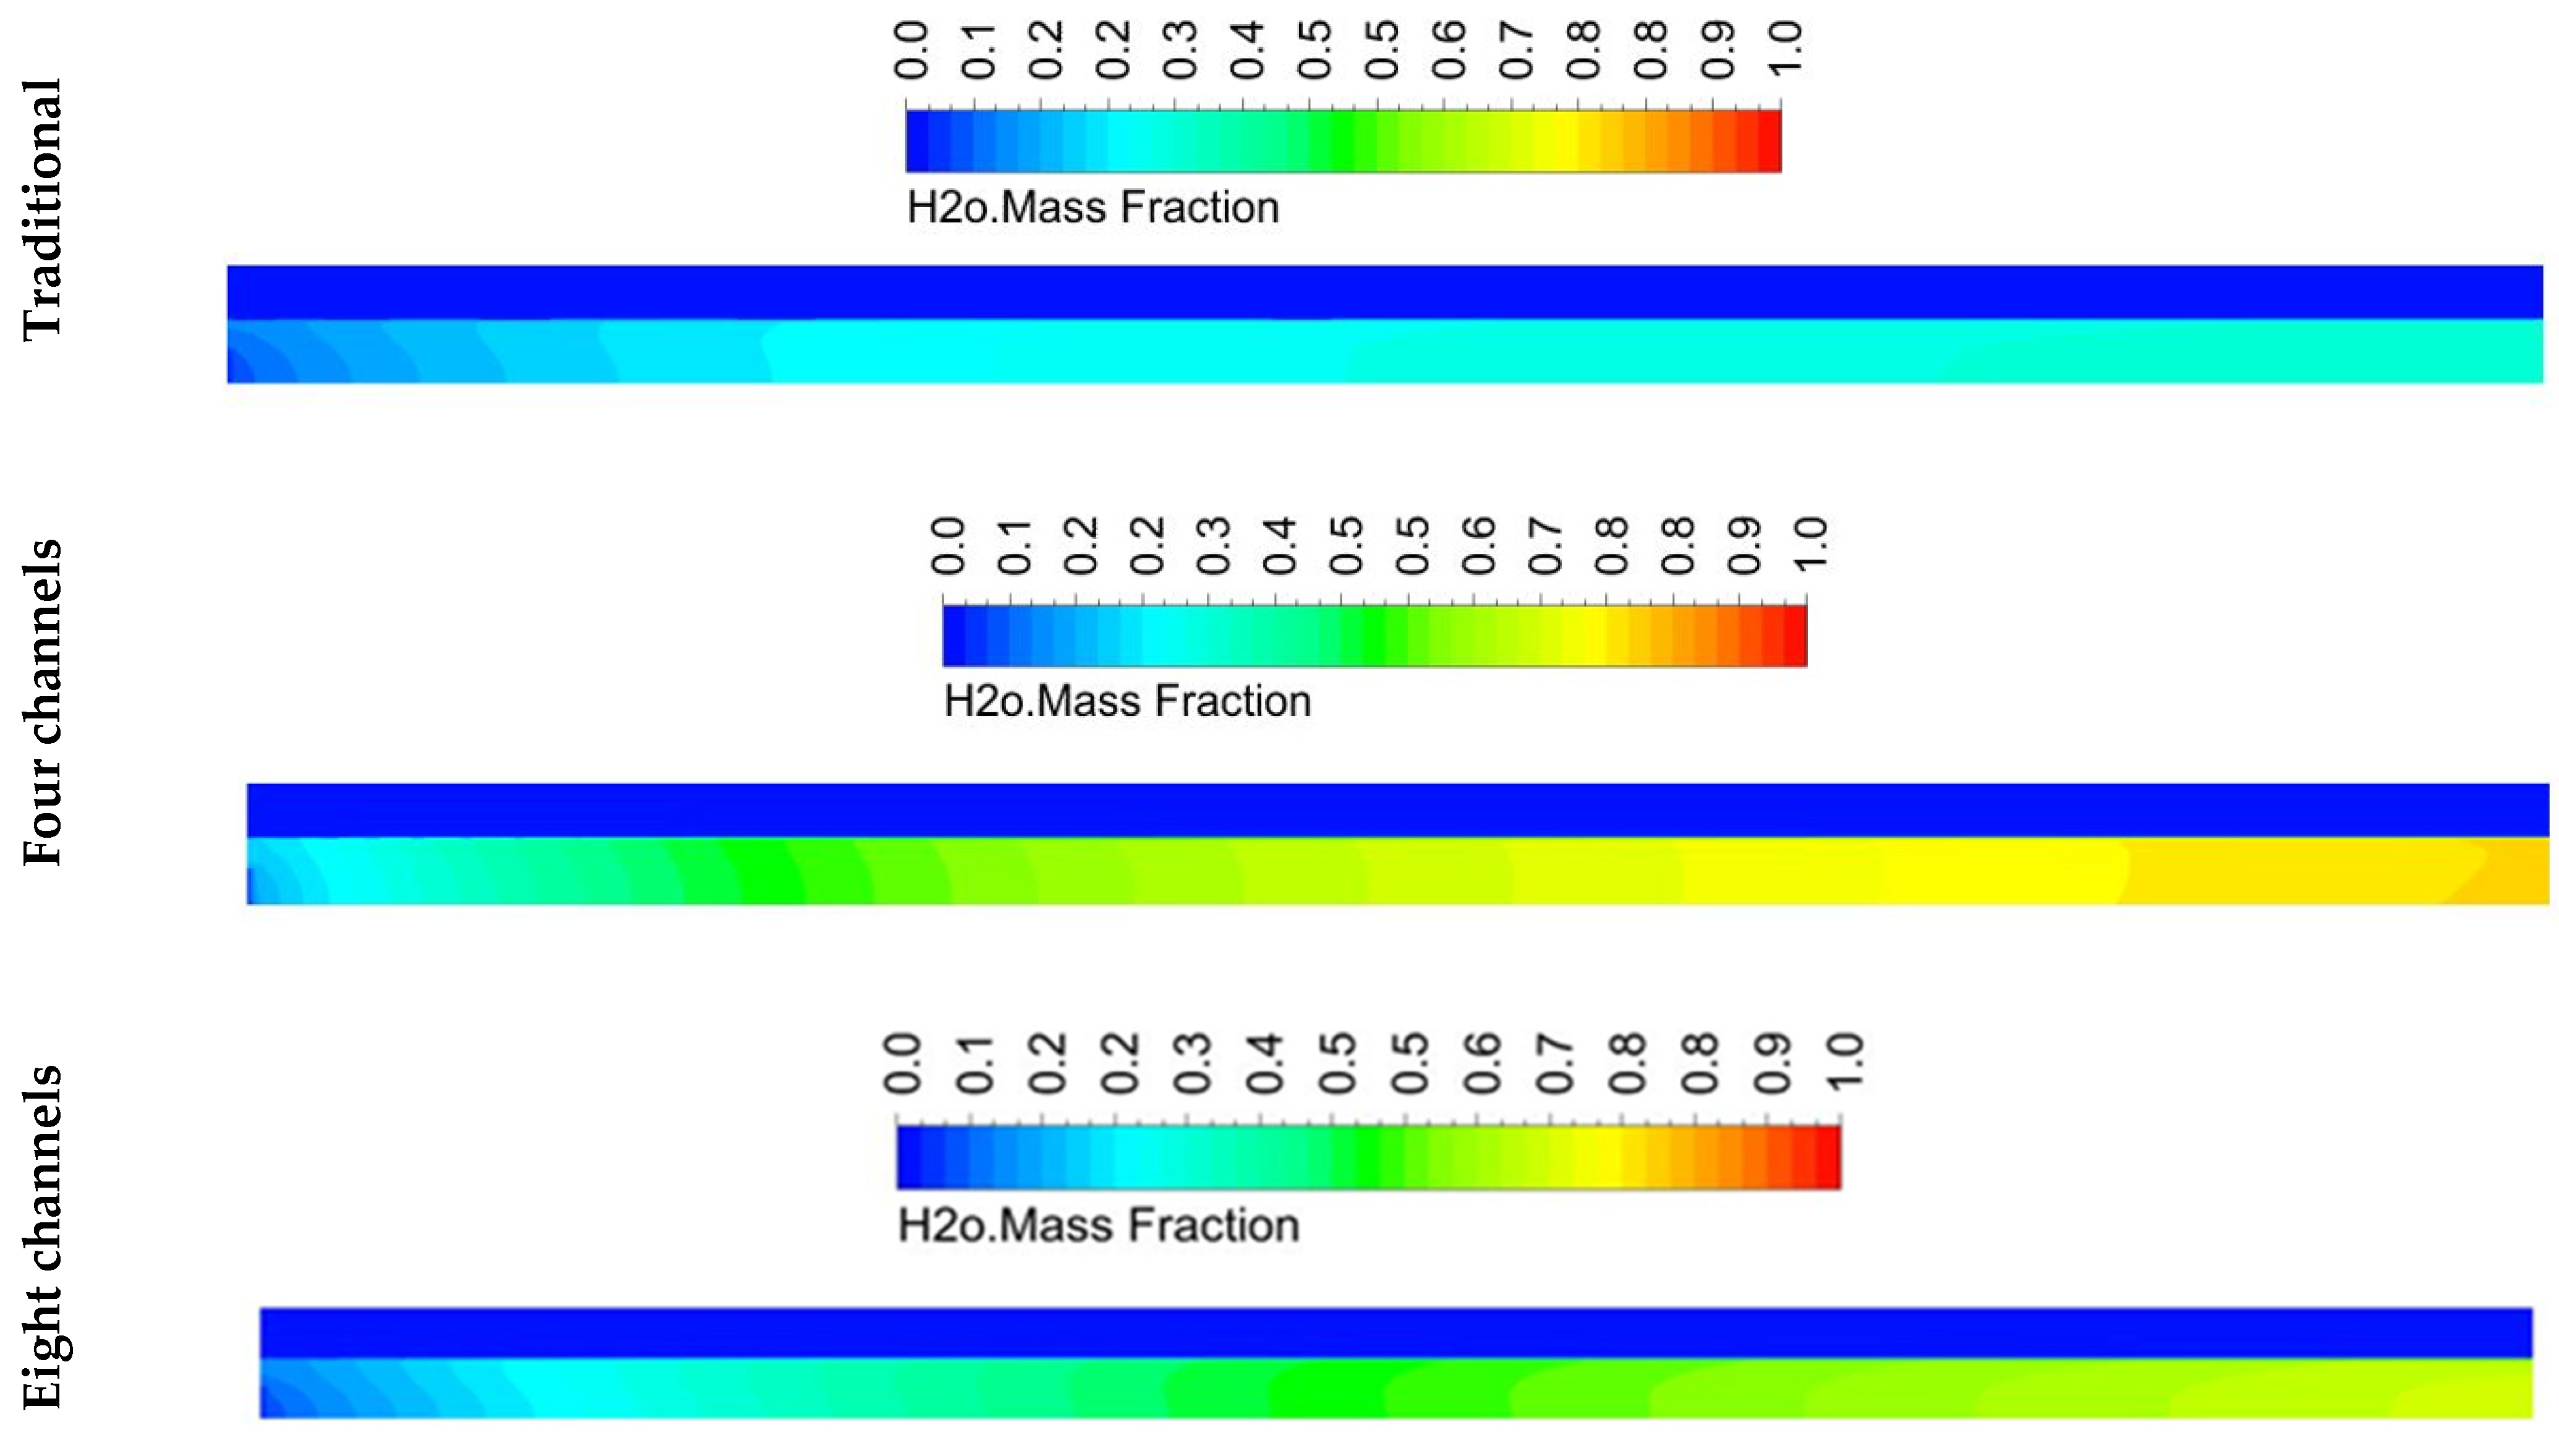
Figure 10 shows the water vapor concentration contour through the cell for the traditional and the developed trapezoidal design with different channels. A high water vapor concentration at the exit means a greater extent of the reaction and a higher achieved performance. As shown in Figure 10, the lowest water vapor concentration was achieved when using the traditional design, meaning that only a weak reaction occurred with this design. This low vapor concentration also explains the traditional design’s low performance. The developed trapezoidal designs with different channels achieved higher water vapor concentrations at the exit than the traditional design. This explains the good performance of these new designs.
Figure 11 shows the mass flow rate of water vapor at the exit using all investigated designs. The traditional design gave the lowest mass flow rate at the exit compared to the developed trapezoidal designs with different channels. The trapezoidal design with four channels achieved the maximum mass flow rate of water vapor at the exit compared to the trapezoidal designs with eight and twelve channels. However, on the other hand, the collected current from this design was less than the collected current from the designs with eight and twelve channels. This finding was mainly due to the larger contact surface for the collector designs with twelve and eight channels compared with four. Therefore, they can collect more current from the cell than the design with four channels.

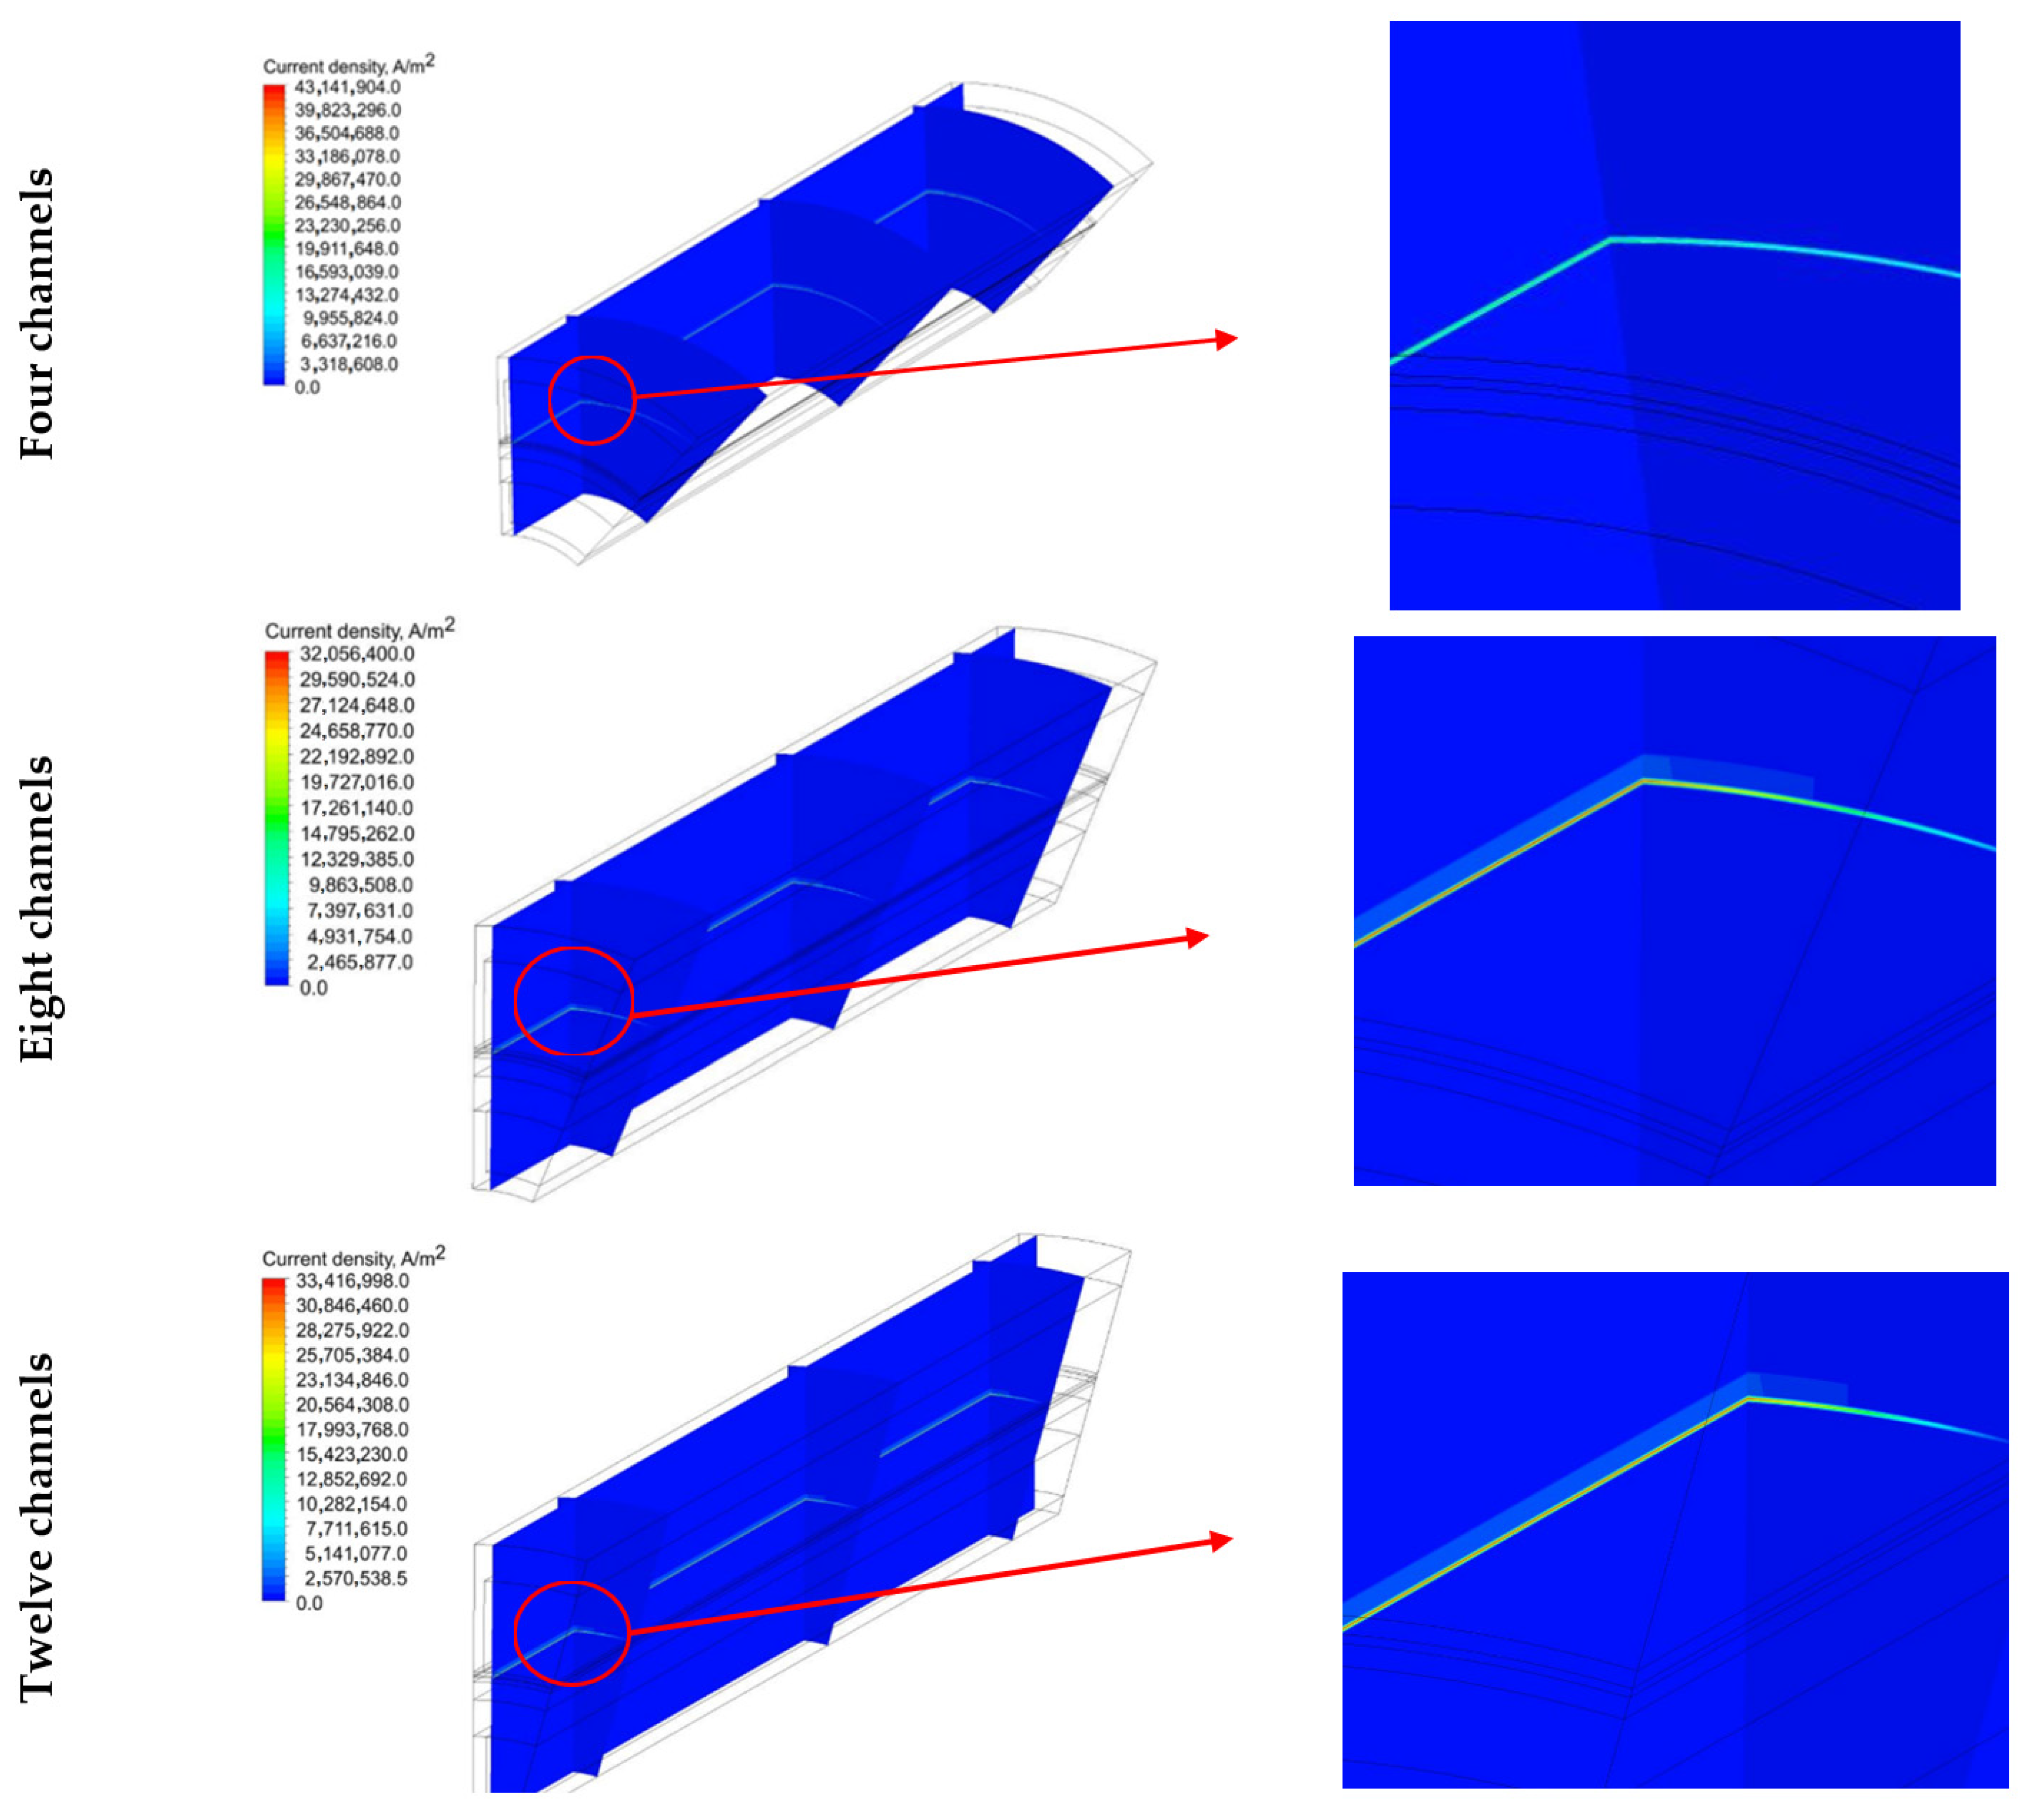
5.3. Current Density Distribution

Figure 12 shows the current density distribution contour through the cell with different plans. The current distribution mainly concentrated on the current collector’s contact points with the cell. Therefore, having more contact points with the cell led to efficient current collection from the cell. This finding can explain the high performance of the developed trapezoidal design with twelve channels. The current density distribution for the design with four channels was higher than the designs with eight and twelve channels. This finding was mainly due to the limited contact surface in the case of the four-channel design. Therefore, the current concentration was high. The designs with eight and twelve channels had almost the same current density distribution, as shown in Figure 12.

6. Conclusions

This study numerically investigated the performance of a tubular solid oxide fuel cell with a novel current collector design. The newly developed design has a trapezoidal shape for the flow channels. Different numbers of flow channels, such as four, eight, and twelve, were investigated. Additionally, a comparison between the developed and traditional cell designs was reported. The following points are concluded from this study:
  • The numerical model could predict the cell performance with the newly developed current collector designs.
  • The developed trapezoidal design achieves high performance compared with the traditional design.
  • Increasing the number of channels enhances cell performance by increasing the contact surface, leading to efficient current collection.
  • Increasing the number of channels from 8 to 12 did not achieve a significant high-performance difference, and any further improvement should be directed to the SOFC microstructure.
  • The design with twelve channels gave a high concentration of hydrogen at the outlet compared to the designs with four and eight channels. However, it achieved a greater performance than the designs with four and eight channels.

Author Contributions

Conceptualization, K.I.A. and M.H.A.; methodology, K.I.A.; software, K.I.A.; validation, K.I.A. and M.H.A.; formal analysis, K.I.A. and M.H.A.; investigation, K.I.A. and M.H.A.; resources, K.I.A. and M.H.A.; data curation, K.I.A. and M.H.A.; writing—original draft preparation, K.I.A. and M.H.A.; writing—review and editing, K.I.A. and M.H.A.; visualization, K.I.A. and M.H.A.; supervision, K.I.A.; project administration, K.I.A.; funding acquisition, K.I.A. All authors have read and agreed to the published version of the manuscript.

Funding

This research and the APC was funded by Deanship of Scientific Research (DSR) at King Abdulaziz University, Saudi Arabia, Jeddah, under Grant no. G: 1500-135-1440.

Institutional Review Board Statement

Not applicable.

Informed Consent Statement

Not applicable.

Data Availability Statement

Not applicable.

Acknowledgments

This work was supported by the Deanship of Scientific Research (DSR) at King Abdulaziz University, Saudi Arabia, Jeddah, under Grant no. G: 1500-135-1440. The authors wish to thank the DSR for their technical and financial support.

Conflicts of Interest

The authors declare no conflict of interest.

Nomenclatures

A v volumetric reaction surface area (m−1)
d p pore diameter in the porous electrode (m)
D i j binary mass diffusion coefficient of a mixture of species i and j (m2 s−1)
F Faraday’s constant: 96,487 C mol−1
h enthalpy
j i current density (A m−2)
R i species radius
r i electrode radius
M i average molecular weight (kg mol−1)
n i number fraction
j o exchange current (A m−2)
k permeability of porous electrode (m2)
P pressure (Pa)
R universal gas constant (J mol−1 K−1)
S mass source term (kg m−3 s−1)
S h e heat generation due to electrochemical reaction (W m−3)
S h i heat generation due to joule heating (W m−3)
S i reaction source term for species i (kg m−3 s−1)
T temperature (K)
u velocity (m s−1)
Poreference pressure (pa)
Toreference temperature (K)
r s exponent of pore blockage
x i mole fraction of species i
y direction perpendicular to electrolyte layer (m)
Greek Symbols
β electron transfer coefficient (usually 0.5)
µ viscosity (N s m−2)
ρ density (kg m−3)
ω i weight fraction of species i
η overpotential (V)
ϕ exchange potential (V)
k σ reaction order for oxidation or reduction
λ electrical conductivity (S m−1)

References

  1. Dhathathreyan, K.S.; Rajalakshmi, N.; Basu, S. Recent Trends in Fuel Cell Science and Technology; Basu, S., Ed.; Springer: New York, NY, USA; Springer: New Delhi, India, 2007; ISBN 978-0-387-35537-5. [Google Scholar]
  2. Larminie, J.; Dicks, A.; McDonald, M.S. Fuel Cell Systems Explained; J. Wiley: Chichester, UK, 2003; Volume 2, ISBN 978-0-470-84857-9. [Google Scholar]
  3. Saied, M.; Ahmed, K.; Ahmed, M.; Nemat-Alla, M.; El-Sebaie, M. Investigations of Solid Oxide Fuel Cells with Functionally Graded Electrodes for High Performance and Safe Thermal Stress. Int. J. Hydrogen Energy 2017, 42, 15887–15902. [Google Scholar] [CrossRef]
  4. Sun, C.; Hui, R.; Roller, J. Cathode Materials for Solid Oxide Fuel Cells: A Review. J. Solid State Electrochem. 2010, 14, 1125–1144. [Google Scholar] [CrossRef]
  5. Zhu, J.H.; Ghezel-Ayagh, H. Cathode-Side Electrical Contact and Contact Materials for Solid Oxide Fuel Cell Stacking: A Review. Int. J. Hydrog. Energy 2017, 42, 24278–24300. [Google Scholar] [CrossRef]
  6. Ivers-Tiffée, E.; Weber, A.; Herbstritt, D. Materials and Technologies for SOFC-Components. J. Eur. Ceram. Soc. 2001, 21, 1805–1811. [Google Scholar] [CrossRef]
  7. Dokiya, M. SOFC System and Technology. Solid State Ion. 2002, 152–153, 383–392. [Google Scholar] [CrossRef]
  8. Collins, C.; Lucas, J.; Buchanan, T.L.; Kopczyk, M.; Kayani, A.; Gannon, P.E.; Deibert, M.C.; Smith, R.J.; Choi, D.-S.; Gorokhovsky, V.I. Chromium Volatility of Coated and Uncoated Steel Interconnects for SOFCs. Surf. Coat. Technol. 2006, 201, 4467–4470. [Google Scholar] [CrossRef]
  9. Davies, D.P.; Adcock, P.L.; Turpin, M.; Rowen, S.J. Stainless Steel as a Bipolar Plate Material for Solid Polymer Fuel Cells. J. Power Sources 2000, 86, 237–242. [Google Scholar] [CrossRef]
  10. Demeneva, N.V.; Bredikhin, S.I. Oxide Film Formation and Diffusion Processes in Near-Surface Layers of Current Collectors in Solid Oxide Fuel Cells. Russ J. Electrochem. 2014, 50, 725–729. [Google Scholar] [CrossRef]
  11. Gao, J.-T.; Li, J.-H.; Feng, Q.-Y.; Li, C.-J.; Li, C.-X. High Performance of Ceramic Current Collector Fabricated at 550 °C through In-Situ Joining of Reduced Mn1.5Co1.5O4 for Metal-Supported Solid Oxide Fuel Cells. Int. J. Hydrogen Energy 2020, 45, 29123–29130. [Google Scholar] [CrossRef]
  12. Qu, Z.; Aravind, P.V.; Boksteen, S.Z.; Dekker, N.J.J.; Janssen, A.H.H.; Woudstra, N.; Verkooijen, A.H.M. Three-Dimensional Computational Fluid Dynamics Modeling of Anode-Supported Planar SOFC. Int. J. Hydrogen Energy 2011, 36, 10209–10220. [Google Scholar] [CrossRef]
  13. Guillodo, M.; Vernoux, P.; Fouletier, J. Electrochemical Properties of Ni–YSZ Cermet in Solid Oxide Fuel Cells: Effect of Current Collecting. Solid State Ion. 2000, 127, 99–107. [Google Scholar] [CrossRef]
  14. Wei, S.-S.; Wang, T.-H.; Wu, J.-S. Numerical Modeling of Interconnect Flow Channel Design and Thermal Stress Analysis of a Planar Anode-Supported Solid Oxide Fuel Cell Stack. Energy 2014, 69, 553–561. [Google Scholar] [CrossRef]
  15. Saied, M.; Ahmed, K.; Nemat-Alla, M.; Ahmed, M.; El-Sebaie, M. Performance Study of Solid Oxide Fuel Cell with Various Flow Field Designs: Numerical Study. Int. J. Hydrog. Energy 2018, 43, 20931–20946. [Google Scholar] [CrossRef]
  16. Chen, D.; Xu, Y.; Hu, B.; Yan, C.; Lu, L. Investigation of Proper External Air Flow Path for Tubular Fuel Cell Stacks with an Anode Support Feature. Energy Convers. Manag. 2018, 171, 807–814. [Google Scholar] [CrossRef]
  17. Sammes, N.M.; Du, Y.; Bove, R. Design and Fabrication of a 100W Anode Supported Micro-Tubular SOFC Stack. J. Power Sources 2005, 145, 428–434. [Google Scholar] [CrossRef]
  18. Zhu, H.; Kee, R.J. The Influence of Current Collection on the Performance of Tubular Anode-Supported SOFC Cells. J. Power Sources 2007, 169, 315–326. [Google Scholar] [CrossRef]
  19. Cui, D.; Liu, L.; Dong, Y.; Cheng, M. Comparison of Different Current Collecting Modes of Anode Supported Micro-Tubular SOFC through Mathematical Modeling. J. Power Sources 2007, 174, 246–254. [Google Scholar] [CrossRef]
  20. Calise, F.; Restucccia, G.; Sammes, N. Experimental Analysis of Micro-Tubular Solid Oxide Fuel Cell Fed by Hydrogen. J. Power Sources 2010, 195, 1163–1170. [Google Scholar] [CrossRef]
  21. Li, T.; Wu, Z.; Li, K. A Dual-Structured Anode/Ni-Mesh Current Collector Hollow Fibre for Micro-Tubular Solid Oxide Fuel Cells (SOFCs). J. Power Sources 2014, 251, 145–151. [Google Scholar] [CrossRef]
  22. Hatchwell, C.E.; Sammes, N.M.; Kendall, K. Cathode Current-Collectors for a Novel Tubular SOFC Design. J. Power Sources 1998, 70, 85–90. [Google Scholar] [CrossRef]
  23. Lee, S.; Lim, T.; Song, R.; Shin, D.; Dong, S. Development of a 700W Anode-Supported Micro-Tubular SOFC Stack for APU Applications. Int. J. Hydrogen Energy 2008, 33, 2330–2336. [Google Scholar] [CrossRef]
  24. Hodjati-Pugh, O.; Dhir, A.; Steinberger-Wilckens, R. Internal Current Collection and Thermofluidynamic Enhancement in a Microtubular SOFC. Int. J. Heat Mass Transf. 2021, 173, 121255. [Google Scholar] [CrossRef]
  25. Shi, J.; Fan, J.; Wang, Y.; Shi, Y.; Cai, N. A New Design Using Metal Wire Brushes as the Current Collector and Catalyst Carrier for Internal Reforming of Micro-Tubular SOFCs. J. Electrochem. Soc. 2021, 168, 104508. [Google Scholar] [CrossRef]
  26. Montero, X.; Tietz, F.; Stöver, D.; Cassir, M.; Villarreal, I. Evaluation of Commercial Alloys as Cathode Current Collector for Metal-Supported Tubular Solid Oxide Fuel Cells. Corros. Sci. 2009, 51, 110–118. [Google Scholar] [CrossRef]
  27. Doraswami, U.; Droushiotis, N.; Kelsall, G.H. Modelling Effects of Current Distributions on Performance of Micro-Tubular Hollow Fibre Solid Oxide Fuel Cells. Electrochim. Acta 2010, 55, 3766–3778. [Google Scholar] [CrossRef]
  28. Jiang, W.; Luo, Y.; Wei, Z.; Zhang, Y.; Wang, Y. Effect of Tube Radius on Creep for an Anode Supported Tubular Solid Oxide Fuel Cell: Experimental and Finite Element Simulation. Int. J. Hydrogen Energy 2017, 42, 23198–23206. [Google Scholar] [CrossRef]
  29. Funahashi, Y.; Shimamori, T.; Suzuki, T.; Fujishiro, Y.; Awano, M. Simulation Study for the Optimization of Microtubular Solid Oxide Fuel Cell Bundles. J. Fuel Cell Sci. Technol. 2010, 7, 021015. [Google Scholar] [CrossRef]
  30. Cordiner, S.; Mariani, A.; Mulone, V. CFD-Based Design of Microtubular Solid Oxide Fuel Cells. J. Heat Transf. 2010, 132, 062801. [Google Scholar] [CrossRef]
  31. Zhang, Z.; Yue, D.; Yang, G.; Chen, J.; Zheng, Y.; Miao, H.; Wang, W.; Yuan, J.; Huang, N. Three-Dimensional CFD Modeling of Transport Phenomena in Multi-Channel Anode-Supported Planar SOFCs. Int. J. Heat Mass Transf. 2015, 84, 942–954. [Google Scholar] [CrossRef]
  32. Mollayi Barzi, Y.; Raoufi, A.; Manafi Rasi, N.; Davari, S. Three Dimensional Simulation of a Counter-Flow Planar Solid Oxide Fuel Cell. ECS Trans. 2019, 35, 1021–1033. [Google Scholar] [CrossRef]
  33. Wilberforce, T.; Ijaodola, O.; Emmanuel, O.; Thompson, J.; Olabi, A.G.; Abdelkareem, M.A.; Sayed, E.T.; Elsaid, K.; Maghrabie, H.M. Optimization of Fuel Cell Performance Using Computational Fluid Dynamics. Membranes 2021, 11, 146. [Google Scholar] [CrossRef] [PubMed]
  34. Hart, N.T.; Brandon, N.P.; Day, M.J.; Lapeña-Rey, N. Functionally Graded Composite Cathodes for Solid Oxide Fuel Cells. J. Power Sources 2002, 106, 42–50. [Google Scholar] [CrossRef]
  35. Anandakumar, G.; Li, N.; Verma, A.; Singh, P.; Kim, J.-H. Thermal Stress and Probability of Failure Analyses of Functionally Graded Solid Oxide Fuel Cells. J. Power Sources 2010, 195, 6659–6670. [Google Scholar] [CrossRef]
  36. Eaton, B.M. FLUENT Fuel Cell Modules Manual. Available online: https://documents.pub/document/fluent-fuel-cell-modules-manual-cfd-is-a-trademark-used-by-ansys-inc-the.html (accessed on 2 April 2022).
  37. Cable, T.L.; Sofie, S.W. A Symmetrical, Planar SOFC Design for NASA’s High Specific Power Density Requirements. J. Power Sources 2007, 174, 221–227. [Google Scholar] [CrossRef] [Green Version]
  38. Yang, C.; Li, W.; Zhang, S.; Bi, L.; Peng, R.; Chen, C.; Liu, W. Fabrication and Characterization of an Anode-Supported Hollow Fiber SOFC. J. Power Sources 2009, 187, 90–92. [Google Scholar] [CrossRef]
  39. Chaisantikulwat, A.; Diaz-Goano, C.; Meadows, E.S. Dynamic Modelling and Control of Planar Anode-Supported Solid Oxide Fuel Cell. Comput. Chem. Eng. 2008, 32, 2365–2381. [Google Scholar] [CrossRef]
Figure 1. Solid oxide fuel cell: (a) tubular configuration; (b) planar configuration.
Applsci 12 06003 g001
Figure 2. The model geometry used in the analysis (traditional design of a tubular SOFC).
Applsci 12 06003 g002
Figure 3. Numerical procedure flowchart used in this study.
Applsci 12 06003 g003
Figure 4. The computational domain used in the analysis (not to scale).
Applsci 12 06003 g004
Figure 5. Validation of the numerical result with the experimental result.
Applsci 12 06003 g005
Figure 6. Investigated current collector designs (front view).
Applsci 12 06003 g006
Figure 7. Collected current from different fuel cell designs.
Applsci 12 06003 g007
Figure 8. Hydrogen concentration contour through the cell for different designs.
Applsci 12 06003 g008
Figure 9. Hydrogen mass flow rate at the exit for different designs.
Applsci 12 06003 g009
Figure 10. Water vapor concentration contours through the cell for different designs.
Applsci 12 06003 g010aApplsci 12 06003 g010b
Figure 11. The mass flow rate of water vapor at the exit for different designs.
Applsci 12 06003 g011
Figure 12. Current density distribution contour through the cell.
Applsci 12 06003 g012
Table 1. Cell component dimensions.
ItemDimension, mm
Cell length11.8
Anode thickness0.15
Cathode thickness0.015
Electrolyte thickness0.012
Anode flow Diameter1.35
Cathode flow Diameter3.4
Table 2. Cell components’ material properties.
ParameterAnodeCathodeElectrolyte
MaterialNi-YSZLSMYSZ
Density (kg/m3)420063506010
Specific heat (j/kg-K)3773772000
Table 3. Cell boundary and operating conditions.
ItemsAnode InletCathode InletCollectorCell Surroundings
Mass flow inlet (kg/s)1.334 × 10−8Exposed to airNoneNone
Temperature, K10731073AdiabaticAdiabatic
SpeciesH297%NoneNoneNone
O2None21%
H2O3%None
Table 4. Mesh independency analysis.
MeshAB
Element size0.2 mm sizing0.125 mm sizing
Mesh size1,057,9971,617,846
No. of cores used77
Iteration time (sec)1520
Amp. at 0.6 volt0.6368380.635234
Error (%)5.785.5466
No. of iterations17,65017,650
Solving time (hr)73.5498.06
Table 5. The operating conditions for the various experimental studies used for model validation.
ItemYang et al. [38]Chaisantikulwat et al. [39]
Fuel cell configurationTubular Planar
3D representation Applsci 12 06003 i001 Applsci 12 06003 i002
Fuel compositionH2 (∼3% H2O)H2 (∼3% H2O)
Fuel flow rate40 mL min−110 cm3/min
Reduction mediumExposed to airO2 (21%) + N2 (79%)
Reduction of medium flow rate15 cm3/min
Operating temperature873.15 K1023 K
Pressure 1.01325 bar1.01325 bar
Publisher’s Note: MDPI stays neutral with regard to jurisdictional claims in published maps and institutional affiliations.