Article

Methane Production Potential from Apple Pomace, Cabbage Leaves, Pumpkin Residue and Walnut Husks

by
Robert Czubaszek
*,
Agnieszka Wysocka-Czubaszek
and
Rafał Tyborowski
Faculty of Civil Engineering and Environmental Sciences, Bialystok University of Technology, Wiejska 45A Str., 15-351 Bialystok, Poland
*
Author to whom correspondence should be addressed.
Appl. Sci. 2022, 12(12), 6128; https://doi.org/10.3390/app12126128
Submission received: 22 May 2022 / Revised: 11 June 2022 / Accepted: 15 June 2022 / Published: 16 June 2022
(This article belongs to the Special Issue Biogas as Renewable Energy Source)

Abstract

:
Circular economy aims to eliminate organic waste through its transformation, composting and processing into other products or energy. The main aim of the study was to determine the specific methane yield (SMY) of anaerobic digestion (AD) of four different fruit and vegetable residues (FVR). In addition, the reduction in greenhouse gas (GHG) emissions was calculated based on the assumption that maize will be replaced by the FVR as a feedstock for biogas production. The SMY of four residues (apple pomace, cabbage leaves, pumpkin peels and fibrous strands and walnut husks) was measured in the biomethane potential test (BMP) in wet anaerobic digestion technology. The highest SMY (297.81 ± 0.65 NL kgVS−1) was observed for cabbage leaves while the lowest SMY (131.07 ± 1.30 kgVS−1) was found for walnut husks. The concentrations of two inhibitory gasses (NH3 and H2S) in biogas were low and did not affect the AD process. Only biogas produced from cabbage leaves was characterised by higher NH3 and H2S concentrations resulting from the highest protein concentration in this waste. FVR used as feedstock in biogas production may decrease the area of maize cultivation. Therefore, the GHG emissions from maize cultivation will be reduced. In Poland only, the use of four studied FVR as feedstock for biogas production would contribute to the reduction of GHG emissions by 43,682 t CO2 eq.

1. Introduction

Fruit and vegetable production and processing generate biomass losses which are inevitable and may pose serious environmental risks but also mean the loss of valuable nutrients [1]. The fruit and vegetable residues (FVR) and wastes are highly fermentable and biodegradable and can be a source of GHG emissions when disposed in landfills [2,3]. Losses in agricultural production due to mechanical damage and/or spillage during harvest operation and during the post-harvest stage including losses due to spillage and degradation during handling, storage and transportation between farm and distribution are equal to ca. 20–25% [4]. Agro-industrial processing of fruit and vegetables during the processing of raw plant material in the transformation process to food product generates residues such as peel, pulp, pomace, shells, stalk, foliage etc. [1,5]. These materials are not intentionally generated during food production and are not considered as waste but rather as residues which constitute 20–30% of fresh material [6].
Poland is known as one of the main producers of temperate climate fruit and vegetables, and their production and processing together with export are a very important part of agriculture [7]. In 2021, Poland produced ca. 4,000,000 tonnes of apples [8], 687,000 tonnes of cabbage [8], 289,900 tonnes of pumpkin [9] and 6100 tonnes of walnuts [10] in 2020. In the last 10 years, ca. 56% of harvested apples in Poland were processed into concentrated juice [11]. Apple processing generates pomace, for many years regarded as waste, which is a heterogeneous mixture consisting of peel, core, seed, stem, calyx and soft tissue [12]. This inexpensive and abundantly available by-product of the apple cider and juice processing industries accounts for even 30% of the original fruit mass [6]. The inedible fraction of cabbage and pumpkin is equal to 20% of fresh vegetables [13]. Walnut production generates wastes such as leaves and husk of the fruit. The husk is the green outer layer of the fruit which splits at full ripening and is removed during piking of the walnuts. In processing, the walnut shell is another waste. The shell and green husk constitute approximately 50% of the total fruit weight [14].
The management of agro-industrial residues and wastes is challenging since wastes are produced seasonally and both wastes and residues vary significantly in quantity and quality. Besides that, agricultural and agro-industrial production is scattered.
Since bio-waste, including agro-industrial residues, is a key waste stream with a high potential for contributing to a more circular economy, the European Union is strengthening rules on waste prevention and setting new municipal-waste-recycling targets such as: (a) at least 55% of municipal waste by weight will have to be recycled by 2025; (b) in all EU Members, by 31 December 2023, biowaste will be collected separately or recycled at source [15]. Consequently, the disposal of organic wastes is banned in many countries [16]. The other two options such as incineration and composting can cause environmental problems. Thus, valorisation pathways of FVR to energy are a promising option and can be a part of the circular economy. The organic waste streams, including the FVR, can be used to produce bio-based energy carriers such as biogas, bioethanol or hydrogen gas (H2) [17,18,19,20,21,22,23]. Biogas production on the industrial scale is considered a part of the green economy [24]. From the agricultural point of view, biogas should be seen as a very promising source of energy. On one hand, anaerobic digestion (AD) can be an attractive way to manage waste; other disposal methods require significant financial outlays. On the other hand, the energy produced can and should be used as a substitute for conventional energy sources, e.g., to heat livestock buildings or greenhouses.
Biogas is a renewable energy source which is implemented successfully in many countries. Biogas production has a direct impact and contribution to 12 of 17 sustainable development goals adopted by all United Nations Member States in 2015 [25,26]. In addition to generally recognized advantages such as a decrease in GHG emissions, waste utilization and nutrient recycling [27], the energy obtained from biogas is non-intermediate and biogas can be relatively easily stored.
Utilization of organic wastes and organic residues as feedstock, digestate management as fertilizer and biogas upgrading with purification of CO2 from a useless waste product to, for example, a high purity gas for the food and beverage industry [28] or for geological storage [29] closes the CO2 loop and plays potentially an indispensable role in the transition to a circular bio-economy [30].
The assessment of the carbon neutrality of biogas is based primarily on the feedstock used for its production. Since expanded cultivation of energy crops leads to loss of biodiversity, loss of wet habitats, and increased competition for land area for food and fodder [31,32], the organic wastes and residues which are typically wet, bulky, and of low economic value [33] are perfect feedstock leading the biogas to be considered a carbon-neutral source of energy because carbon originating from organic wastes comes from existing CO2 in the atmosphere [34]. Another benefit of biogas production is post-production slurry (digestate) which has been proved to be a good fertilizer with increased content of NH4-N compared to substrates.
Numerous studies concern the biogas production from either food waste [35] or its co-digestion with other substrates [16,36,37,38]. Anaerobic co-digestion of cabbage waste with potato waste was studied by Mu et al. [19]. The methane yield of pumpkin peels and the energy and economic evaluation of anaerobic co-digestion of fluted pumpkin with poultry manure were evaluated by Dahunsi et al. [21,22,23]. Less is known about mono-digestion of fruit or vegetables. Yan et al. [39] compared the methane production from wastes of 20 leafy species popular in China focusing mostly on herbaceous plants. The highest methane yield was obtained from the AD of cauliflower (249.61 NL kgVS−1), while the lowest yield was observed in the case of Schizonepeta (81.52 NL kgVS−1). The study revealed that the volatile solids to total solids (VS/TS) ratio, lignin content, and hemicellulose content exerted a combined influence on the methane yield [39].
Analyses of GHG emissions often emphasise the significant share of the crop cultivation used as a substrate for biofuels production in overall emissions. The GHG emissions from crop cultivation are related to fertilization, plant protection, seeds treatment as well as the production of agricultural machinery and equipment [40]. The land-use change also significantly increases the GHG emissions from biofuels production. Organic wastes used as feedstock for biogas production may significantly contribute to the reduction in the GHG emissions through the replacement of the energy crops and avoidance of GHG emissions related to their production and harvest.
Most studies have focused on the AD of mixed fruit and vegetable waste [41,42,43,44,45,46,47] or co-digestion of fruit, vegetable and other feedstock [48,49,50,51,52]; therefore, there is a gap in knowledge on specific methane yield from individual fruit or vegetable species. The aim of this study was to determine the SMY from anaerobic mono-digestion of fruit and vegetable residues from four individual species such as: apple, pumpkin, cabbage and walnut. The residues investigated in this study were chosen because of their high availability. In addition, the biogas chemical composition leads to the assessment of the possibility of using studied residues as co-substrates in biogas plants without impairing the AD process. The potential reduction in GHG emissions from maize cultivation as a result of partial replacement of this energy crop by four studied residues was also estimated.

2. Materials and Methods

2.1. Substrates and Inoculum

The substrates used in biomethane potential (BMP) tests were apple pomace, pumpkin residue consisting of peels and fibrous strands, walnut husks, and cabbage leaves. Prior to the BMP, substrates were ground into a homogeneous mass with a kitchen robot with a blender function. The inoculum was collected from the digestate storage tank of a mesophilic agricultural biogas plant processing maize silage with the addition of 10–20% of food and agricultural wastes. The inoculum was degassed at a temperature of 38 ± 1 °C.

2.2. The Experimental Set-Up and Biogas Calculations

The BMP of four substrates was performed in the batch assay in eudiometers in wet fermentation technology. The reactors with a total volume of 1 L and a working volume of 600 mL were incubated at a temperature of 38 ± 1 °C in a water bath (Figure 1). The 300 mL of inoculum was added to the reactors and the inoculum to substrate ratio was set as 2:1 based on volatile solids (VS) content. Distilled water was added to obtain the total solids (TS) content of 5% in reactors. The reactors were flushed with nitrogen for 2 min and sealed to ensure the anaerobic conditions. Batch BMP trials were conducted in duplicate. Two blank experiments were performed with inoculum and water only. The biogas composition was measured with a portable biogas analyzer DP-28BIO (Nanosens, Wysogotowo, Poland).
To determine the SMY of each sample, the methane produced from the inoculum was subtracted from the methane produced by each sample. SMY was then calculated as NL CH4 kgVS−1 according to the ideal gas law and to the molar volume of ideal gases at standard temperature and pressure conditions (NL = normal litre, i.e., gas volume corrected to 0 °C and 1013 bar). The kinetics of methane production was determined using the modified Gompertz model:
G ( t ) = G 0   × e x p { e x p [ R m a x × e G 0 ( λ t ) + 1 ] }
where:
  • G(t)—cumulative methane production at specific time t (mL)
  • G0—methane production potential (mL)
  • Rmax—maximum methane production rate (mL day−1)
  • λ—duration of lag phase (minimum time to produce methane) (days)
  • t—cumulative time for methane production (days)
  • e—mathematical constant (2.71828)
The Modified Gompertz model is commonly used to show the relationship between cumulative gas production and fermentation time. This equation does not only allow estimating the biogas production potential but also the maximum biogas potential rate and the lag phase which are essential for the evaluation of the AD process [53].
Based on the plotted curves, the time (days) when 50% (T50) and 95% (T95) of the possible methane production had been reached was determined.

2.3. Analytical Methods

In substrates and inoculum, the following parameters were measured: total solids (TS), volatile solids (VS), total Kjeldahl nitrogen (TKN) content, total phosphorus (TP) content, potassium (K) content and total organic carbon (TOC) content. The TS content was obtained by drying material to a constant weight at 105 °C, and VS content was determined after incineration of dried material at 550 °C for 6 h in a muffle furnace according to standard methods [54]. TKN which is the sum of organic nitrogen and ammonia nitrogen [54] was determined in fresh samples by the Kjeldahl method in a Vapodest 50 s analyzer (Gerhardt, Königswinter, Germany). The oven-dried samples were ground and used for further analyses. After nitric acid/hydrogen peroxide microwave digestion in ETHOS One (Milestone s.r.l., Sorisole, Italy), the content of TP was determined with the ammonium metavanadate method using a UV-1800 spectrophotometer (Shimadzu, Kyoto, Japan) and the content of K was analysed using flame photometry (BWB Technology, Newbury, UK). TOC content was determined in the TOC-L analyzer with an SSM-5000A Solid Sample Combustion Unit (Shimadzu, Kyoto, Japan). The analyses were performed in triplicate and the results are given on a dry weight basis.

2.4. Statistical Analyses

A one-way ANOVA was used to test the statistical differences in the chemical composition of substrates. The homogeneity of variance and normality were checked prior to ANOVA using Levene’s test. Differences between means were determined using Tukey’s test. The level of accepted statistical significance was p < 0.05. All the statistical analyses of data were performed using STATISTICA 12 software (StatSoft, Kraków, Poland).

2.5. Calculations of Energy and GHG Emissions

The calculations of potential energy produced monthly in biogas plants fed with studied residues used SMY that was determined during the 30-day BMP experiment. Calculations were performed according to the method presented by Curkowski et al. [55]. The hourly CH4 production was calculated based on the amount of methane expressed as m3 per tonne of substrate’s VS. The theoretical thermal power (in kW) and theoretical electric power (in kW) were calculated assuming a methane calorific value of 9.17 kWh m−3 and thermal and electrical efficiency of 43% and 38%, respectively. The thermal energy and electric energy per 1 tonne of substrate’s VS were calculated assuming the 30 days of biogas plant operation. The internal consumption of thermal energy was assumed to be 30% of produced energy, and electric use was considered to be 9% of produced energy. The amount of each FVR obtained from 1 hectare was used to express the energy in m3 CH4 ha−1.
The energy expressed in m3 CH4 ha−1 was used to calculate the area of maize needed for producing the same amount of energy as the studied FVR obtained from 1 ha of the crop field. The results of this calculation and the cultivation area of studied FVR allowed calculating the reduction in GHG emissions from maize replacement by FVR as feedstock for biogas production The crop yields and the cultivation area were taken from Statistics Poland [8] (apples, cabbage, maize), Eurostat [9] (pumpkin) and FAOSTAT [10] (walnut). The emission factor for maize cultivation was taken from Czubaszek et al. [40].

3. Results

3.1. Properties of Analysed FVR and Inoculum

The analysed substrates differed significantly (p < 0.05) from each other in terms of both physical and chemical properties (Table 1). As expected, the FVR tested in this study were characterised by a high moisture content (80.59–93.87%). The high moisture content of tested substrates resulted in relatively low TS values, which in the case of apple pomace and walnut husks did not exceed 20%, and in the case of pumpkin residue and cabbage leaves was lower than 10% of fresh weight.
The VS content ranged between 85 and 98%. Similar values were observed for walnut husks and cabbage leaves, while significantly lower VS was found for pumpkin residue. The highest VS was in apple pomace. The TOC content in the analysed substrates was similar and amounted to ca. 430 g kgDM−1 (Table 1) which is close to the average TOC content (456 g kgDM−1) in food waste reported in the literature [56]. The pumpkin had the highest TKN, TP and K content, while the lowest content of TKN and TP was found in walnut husks. In turn, the lowest K content was found in apple pomace.
An important parameter determining the conditions in which biogas production takes place is the relationship between the nutrients that affect the living conditions of the bacteria. The lowest C:N ratios were found in pumpkin residue and cabbage leaves (Table 1). The C:N ratios obtained for apple pomace and walnut husks were much higher than the maximum value (24:1) reported for food waste [56]. Mutual relations between the contents of N and P were more even and ranged from 5:1 to 13:1 (Table 1) which is much higher than the optimal ratio in anaerobic digestion (3:1) [57].
The inoculum used in the study was characterised with TKN content similar to the pumpkin residue and cabbage leaves, but with higher TP and K content compared to most of the residues.

3.2. Production of Methane

The tested substrates differed in terms of methane production (Table 2). During the 30 days of the experiment, the highest SMY (297.81 ± 0.65 NL kgVS−1) was observed in the case of cabbage leaves, while the lowest SMY (131.07 ± 1.30 NL kgVS−1) was obtained from walnut husks.
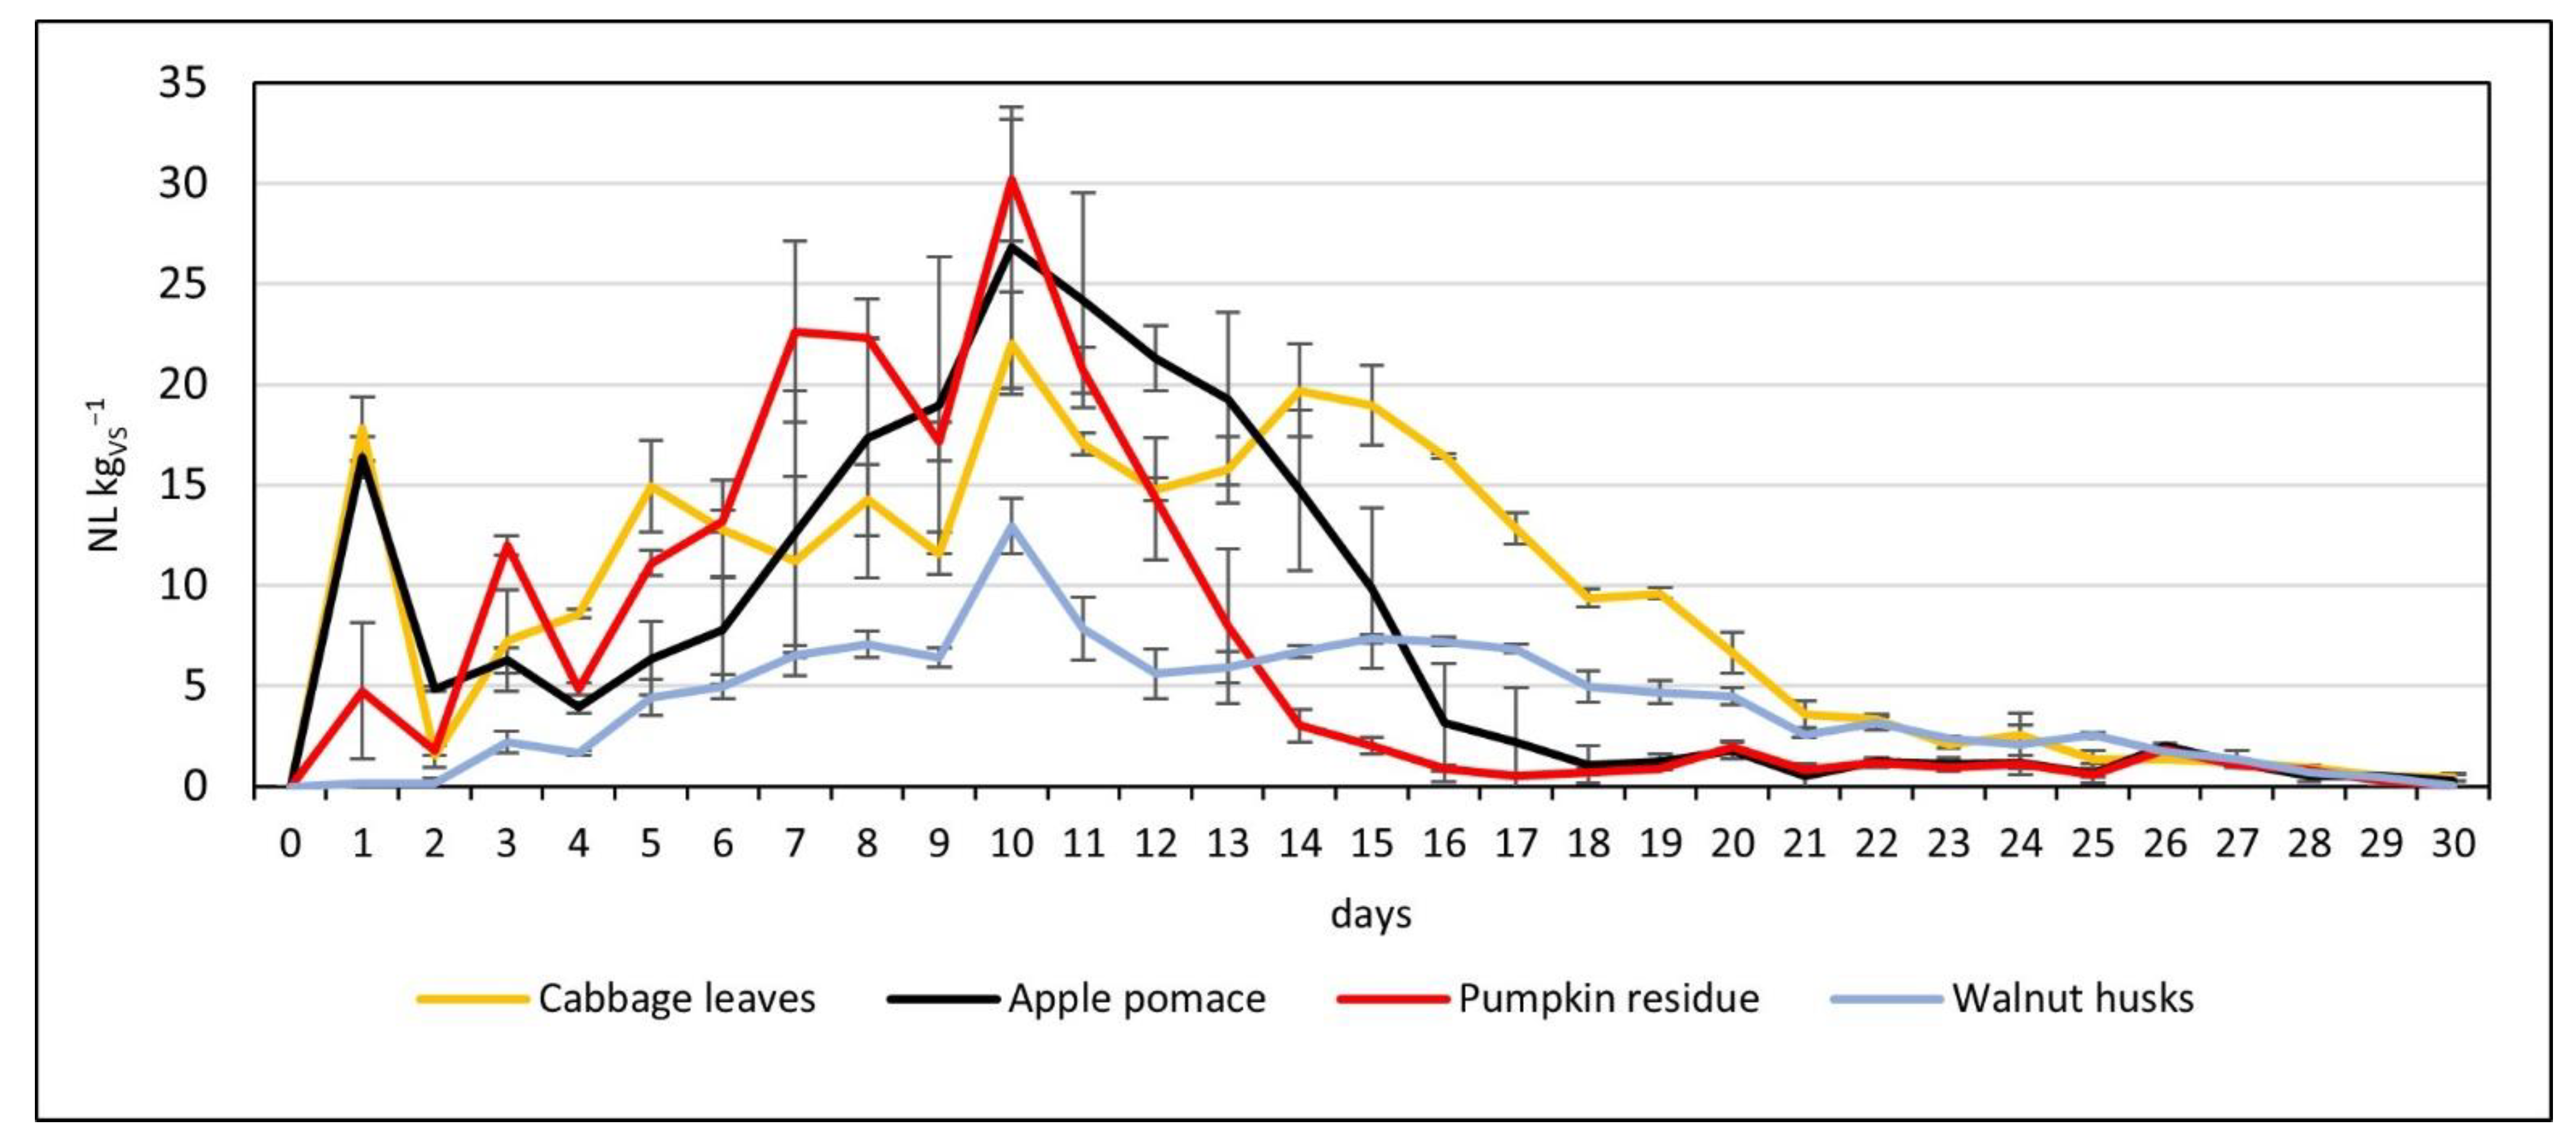
The daily methane production followed similar patterns for all the substrates (Figure 2). The first peak in the daily production was observed on day 1 for all the studied wastes except the walnut husks. The cabbage leaves and apple pomace produced ca. 17 NL kgVS−1 d−1 while the pumpkin residue peak of daily production reached only 5 NL kgVS−1 d−1. The next significant peak in daily production was detected on day 10 when all the substrates reached the maximum daily production of methane. The highest methane production on day 10 was observed for pumpkin residue (30.18 NL kgVS−1 d−1), followed by a rapid decline to 0.89 NL kgVS−1 d−1 on day 16, from which low stable methane production was noted. A similar pattern with a rapid decrease in daily methane production from 26.83 NL kgVS−1 d−1 on day 10 to 1.08 NL kgVS−1 d−1 on day 18 was found for apple pomace. In contrast, three peaks of daily methane production appeared during the AD of cabbage leaves. The first two peaks were detected on day 1 and day 10 with the third one observed on day 14, followed by a slow decline to 2.09 NL kgVS−1 d−1 on day 23 and stable negligible production until day 30. Even though the maximum daily production for cabbage leaves on day 10 was lower than production for pumpkin or apple residues, the third peak and slower decline resulted in the highest cumulative methane production from cabbage leaves. The daily methane production of walnut husks followed a different pattern with a very slow increase in the first 9 days followed by the smallest peak on day 10 reaching 13 NL kgVS−1 d−1. Then, a short decline in daily methane production was observed in the next two days, followed by an increase lasting for 5 days followed by a slow decrease until day 30. Even though, the cumulative methane production from anaerobic digestion of walnut husks was the lowest since the daily methane production was lower compared to other studied wastes.
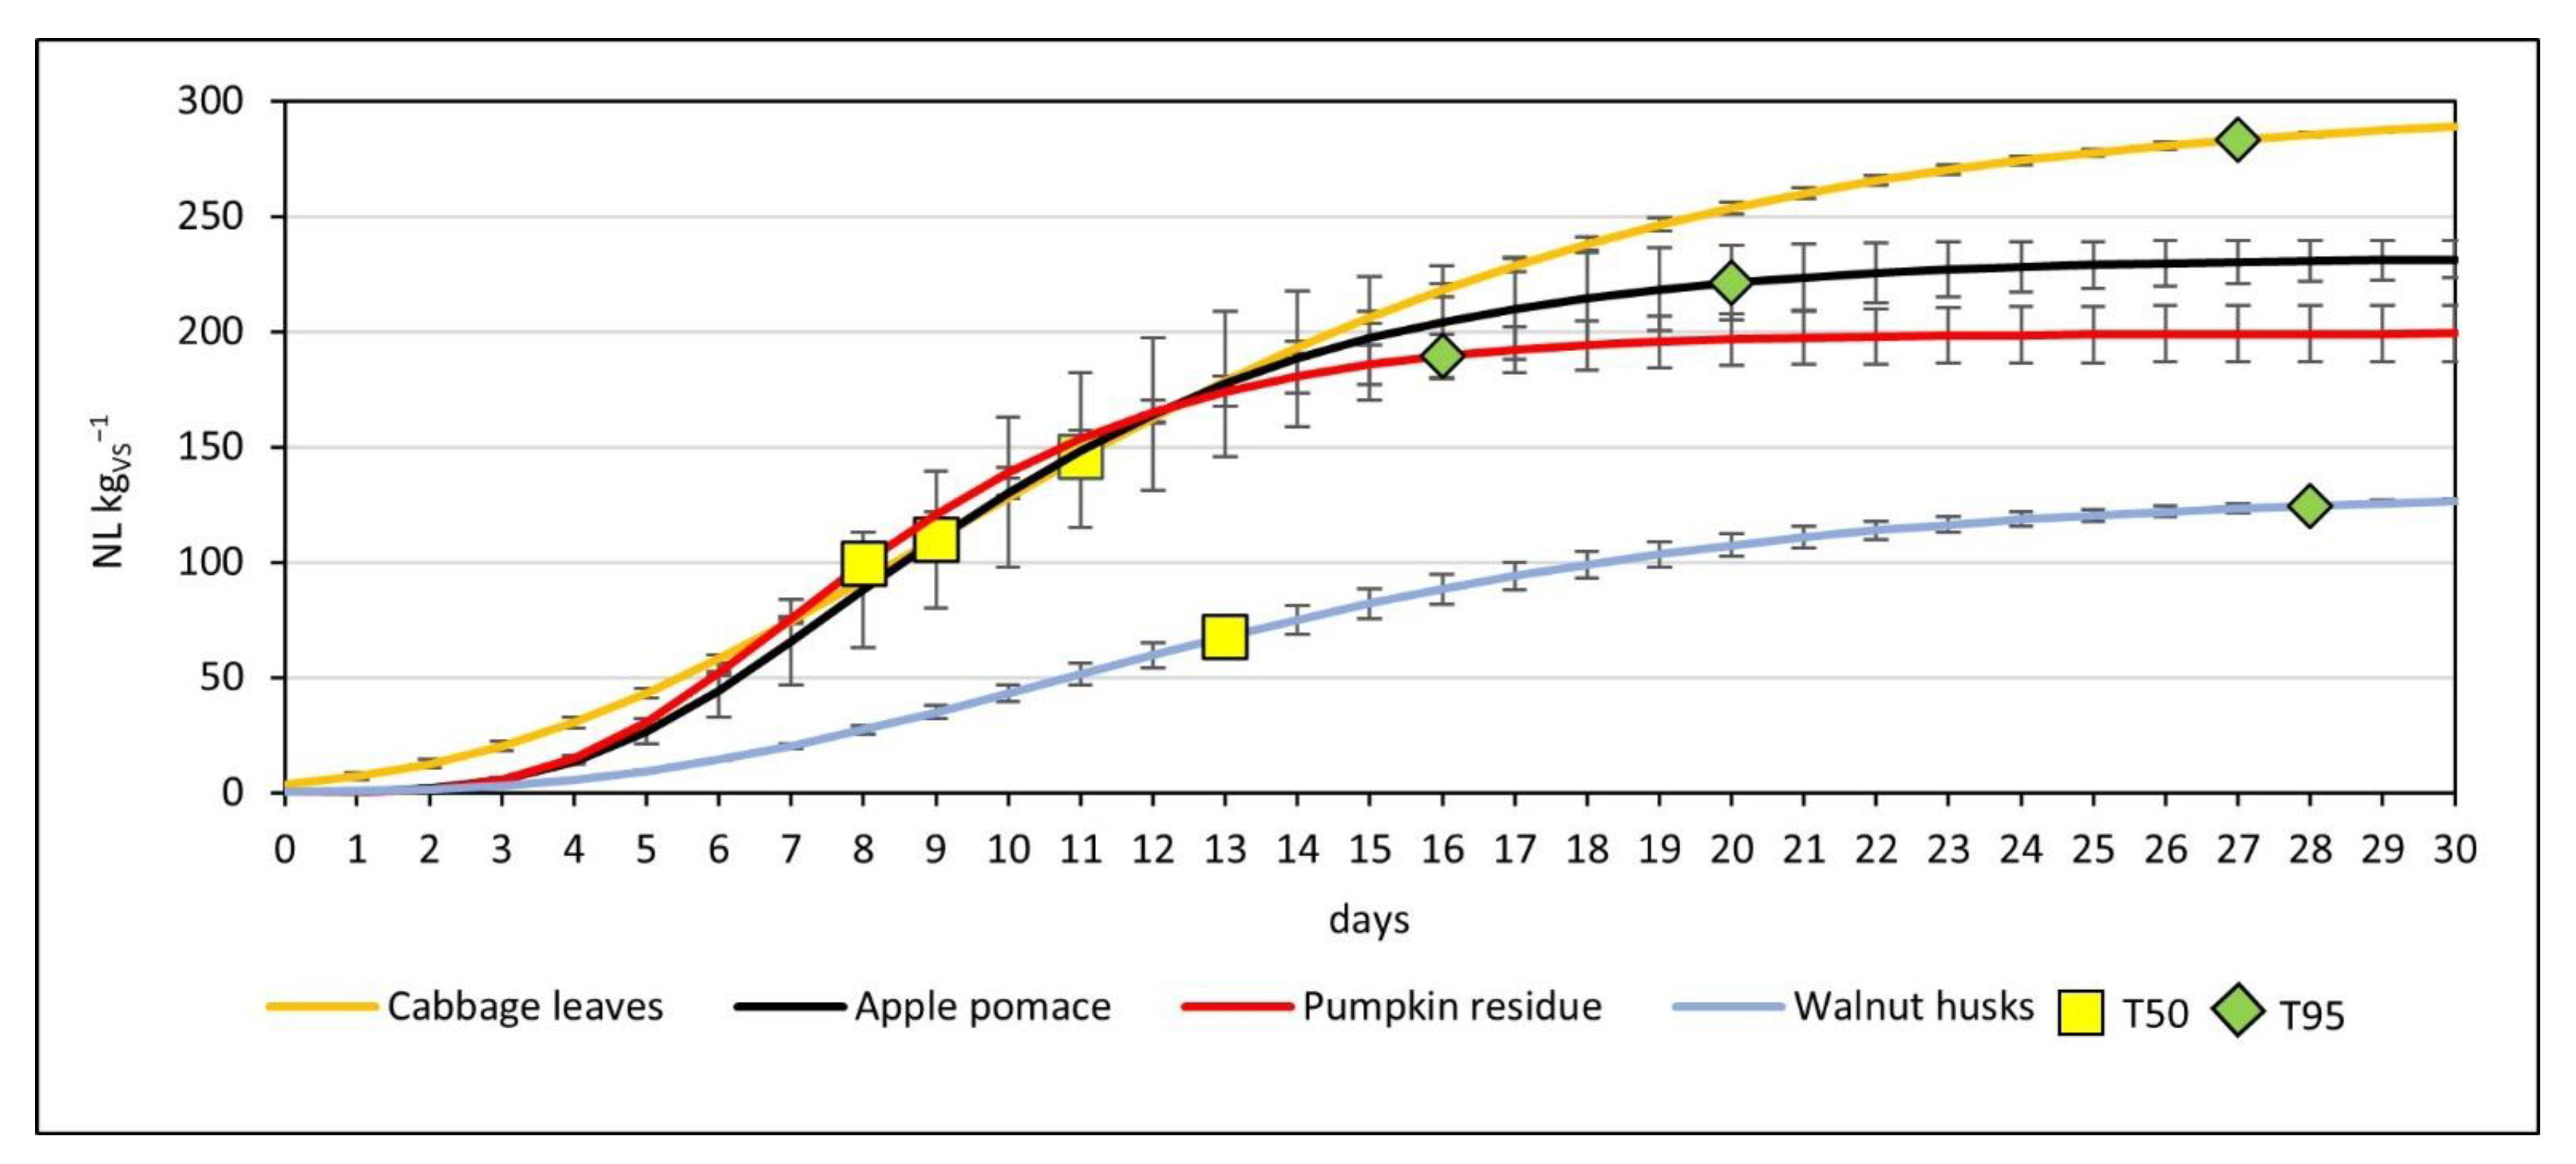
From a practical point of view, a very important parameter indicating the substrate’s suitability for biogas production is the rate of its decomposition, which affects the hydraulic retention time. This time can be calculated from cumulative methane curves as the time needed to obtain 50% (T50) and 95% (T95) of potential methane production. The time when analysed substrate decomposed in 50% (T50) does not differ among the studied residues. The T50 ranged from 8 days for pumpkin residue to 13 days for walnut husks (Figure 3). The time needed to reach 95% of potential methane production depended on the substrate and was the shortest for pumpkin residue (16 days) and apple pomace (20 days), while walnut husks and cabbage leaves required 28 and 27 days, respectively.
The AD can be inhibited by a failure of process parameters, by substances supplied with the substrate, as well as by compounds formed in the digestion process. The level of inhibitors is a very important parameter which determines the conditions of biogas production. FVR are perishable but often are fed into the biogas plant in an unpreserved state. Therefore, it is very important to determine the level of substances in such unpreserved substrate that can inhibit the biogas production process. This is mainly addressed to the level of ammonia (NH3) and hydrogen sulphide (H2S) in biogas.
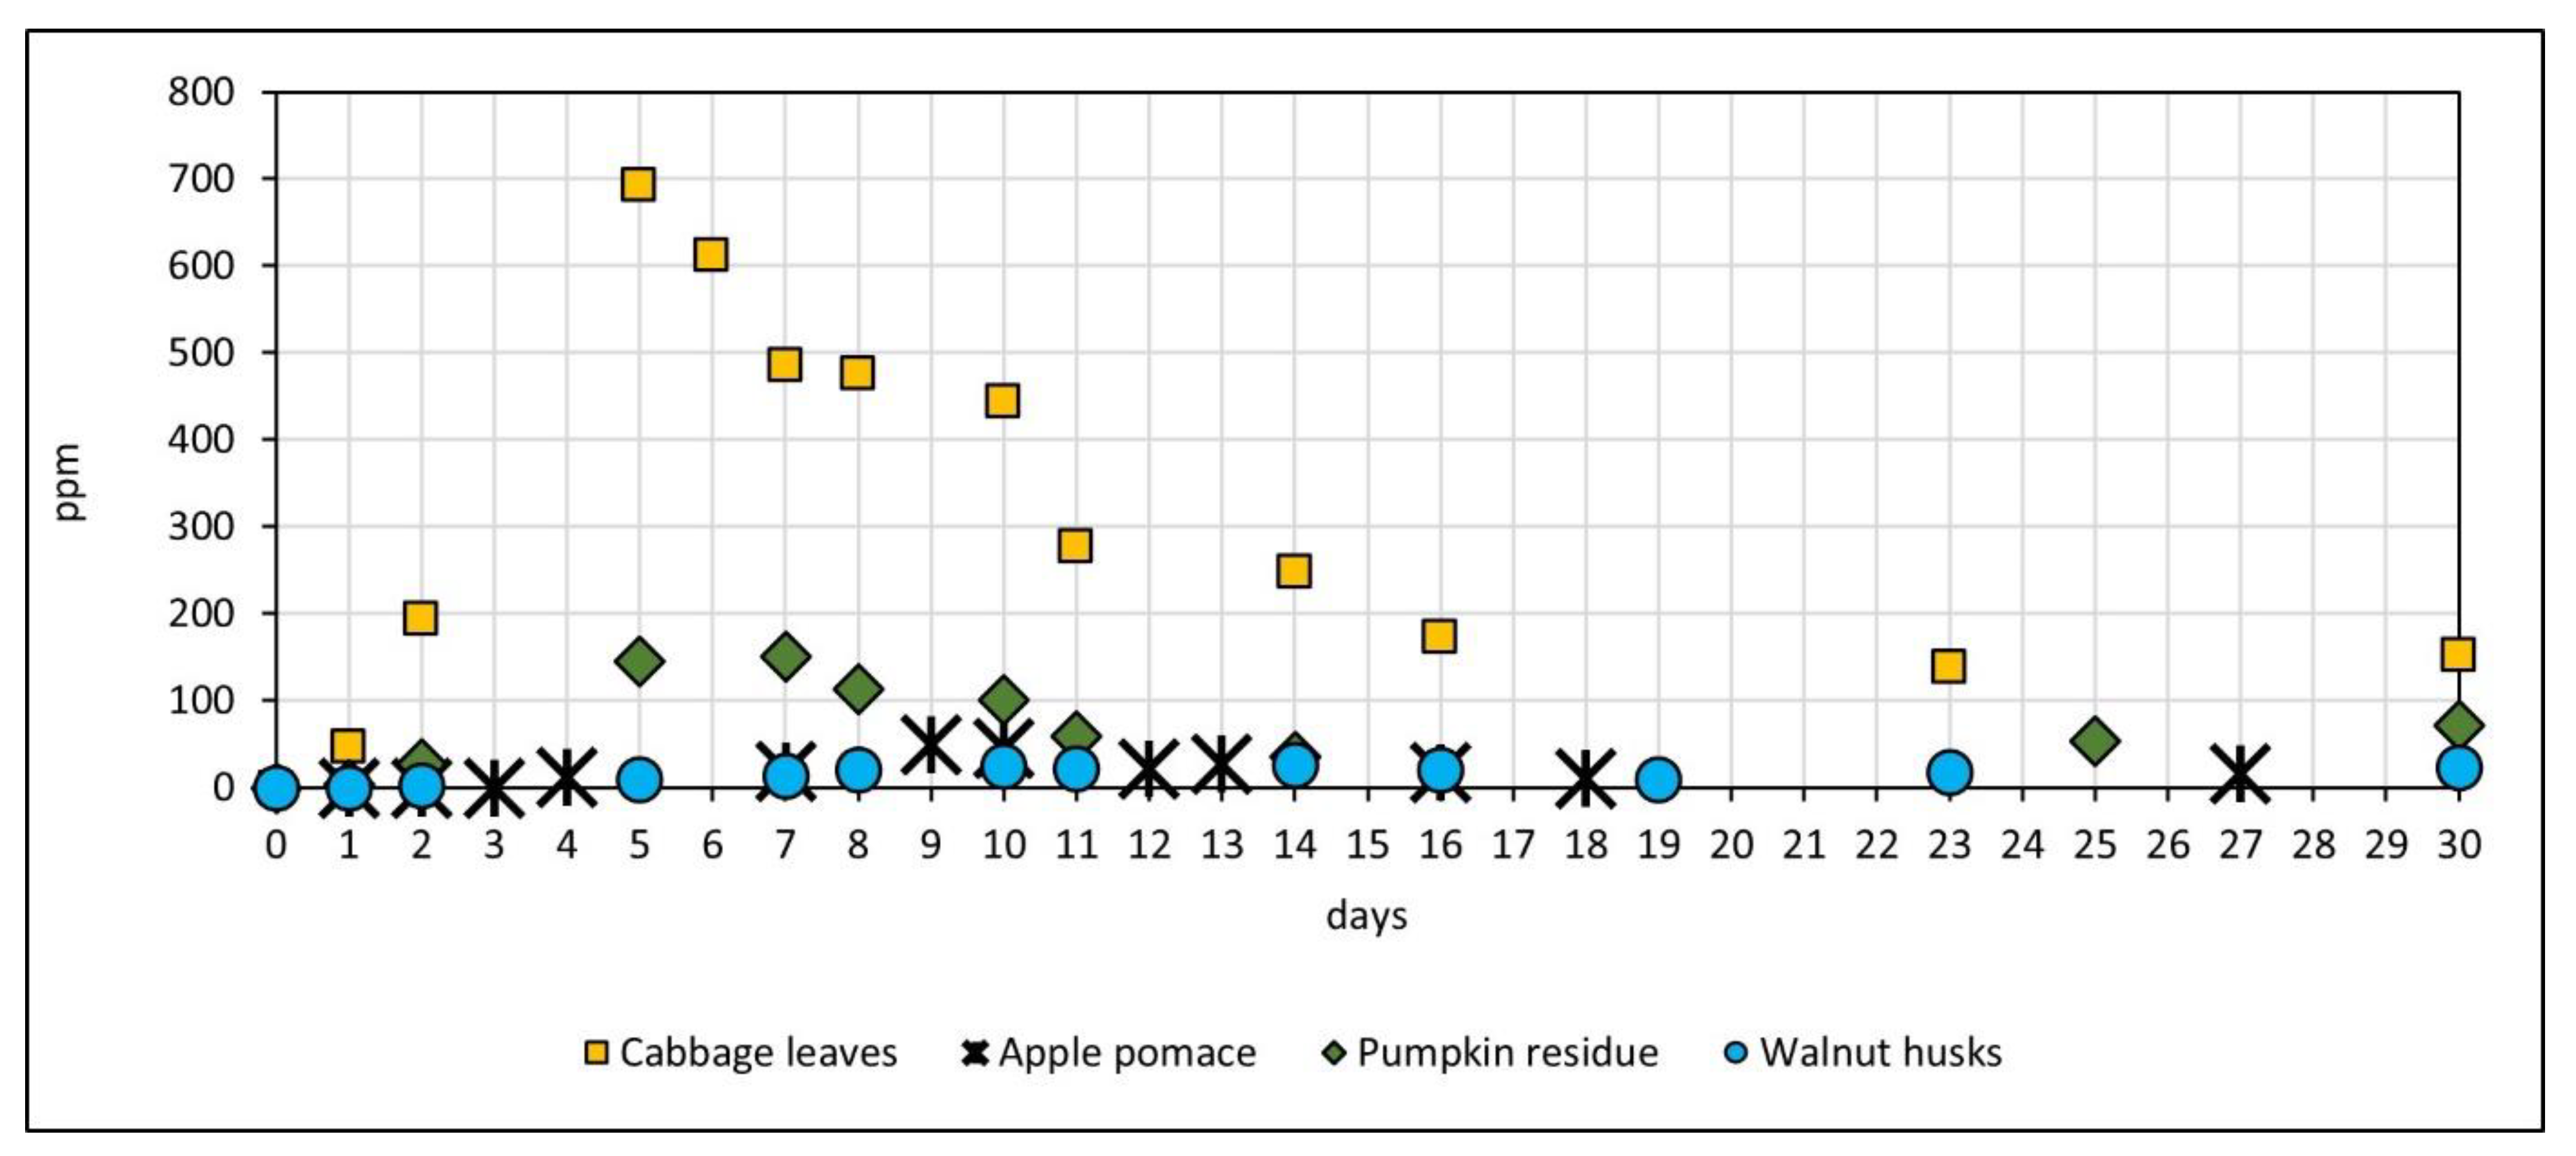
In this study, for most of the substrates, the NH3 and H2S concentrations were low and did not affect the AD process (Figure 4 and Figure 5). The NH3 concentration in biogas produced from walnut husks and apple pomace was the lowest, followed by biogas produced from pumpkin residue. The highest NH3 concentration was observed in biogas from cabbage leaves. The AD of apple pomace and walnut husks produced biogas with a similar NH3 concentration throughout the whole period of the experiment. The NH3 concentration ranged from 1.5 ppm to 26.0 ppm and between 10.0 ppm and 49.5 ppm in biogas from walnut husk and apple pomace, respectively. The AD of pumpkin residue resulted in increasing NH3 concentration to 145.0 ppm on day 5. After 2 days, the NH3 concentration decreased to values below 100 ppm. The biogas produced from cabbage leaves was characterised by a higher NH3 concentration, increasing up to 700 ppm on day 5, followed by a decrease to 150–180 ppm which values were observed until the end of the experiment.
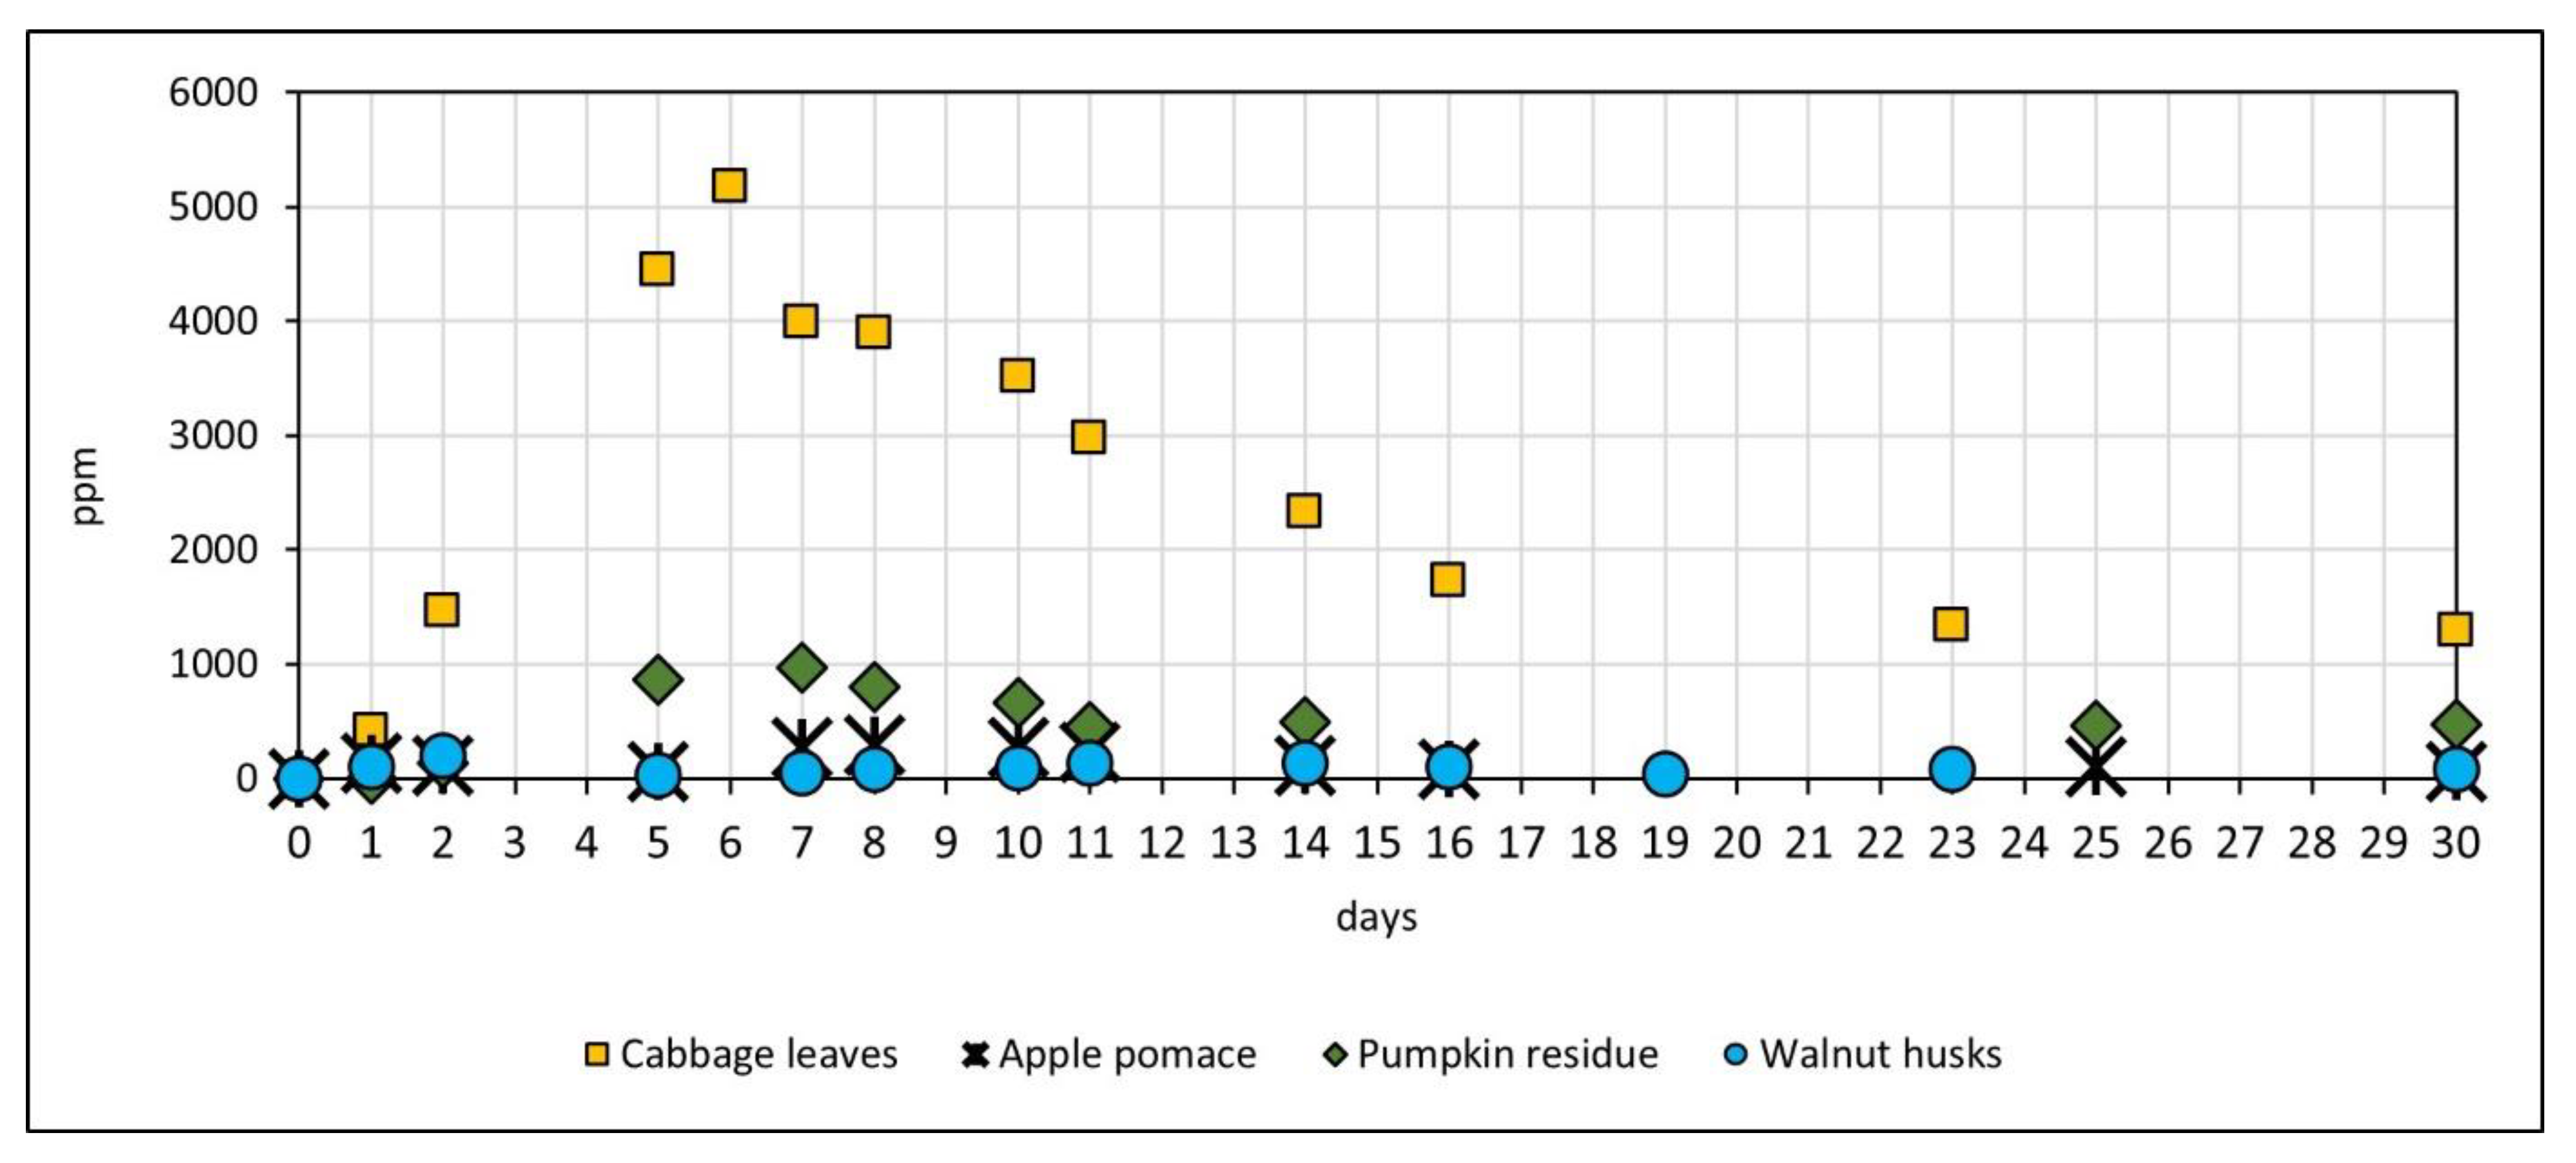
The H2S concentration was the highest in the biogas produced from cabbage leaves. The changes in the H2S concentration followed the same pattern as the NH3 concentration. The H2S concentration increased during the course of the experiment and reached the maximum value (5180 ppm) on day 6, then decreased to the level of 1300 ppm which lasted until the end of the experiment. The H2S concentration in biogas produced from pumpkin residue was much lower and reached ca. 1000 ppm on days 5 and 7, then dropped to ca. 500 ppm. This value was observed until the end of the experiment. The lowest H2S concentrations between 30 ppm and 296 ppm were found in biogas from the AD of walnut husks and apple pomace.

3.3. Energy Production and Potential GHG Reduction

Even though the amounts of energy generated from biogas produced from the analysed substrates are lower than energy generated from biogas produced from maize silage, it should be noted that energy generated from biogas produced from FVR constitutes a very significant source of energy. The amount of energy per tonne of VS that can be obtained from the residues originated from the processing of cabbage, apple, pumpkin, and walnut constituted 86, 67, 58 and 38% of the amount of energy that could be obtained from maize silage, respectively (Table 3). However, considering the FVR yields, the energy per hectare generated from the AD of studied FVR is much lower than that obtained from maize.
Walnut husks, apple pomace, cabbage outer leaves, pumpkin peels and fibrous strands are residues which are obtained from the area already used for crop production. Therefore, those residues used as substrates in biogas production may limit the demand of biogas producers for land-use change to maize cultivation. In Table 4, the cultivated area of each studied crop is given as an equivalent to 1 ha of maize. Apple pomace and cabbage leaves are those substrates which have the greatest potential for the protection of agricultural land.

4. Discussion

The present results show that FVR are a suitable source of substrate for biogas production. In general, food waste moisture content is in the range of 48–95% depending on the source and type of waste [56]. Apple pomace typically contains 66.4–81% of moisture [58,59], and cabbage contains more than 90% of moisture [60]; however, de Rezende et al. [61] reported that the moisture content of cabbage waste was equal to 86%. The moisture content of cabbage waste including cores and leaves was even lower and amounted to 75.12% [20]. Pumpkin, depending on the species and part of the vegetable (flesh, peel, seed), contains 2.8–96.8% of moisture [62]. Pumpkin peels and pulp contain typically more than 85% moisture [63,64]. The high moisture content negatively affects the applicability for incineration and composting [56], while this is an advantageous feature in the case of biogas production. The TS values of the studied residues were in good agreement with the literature. A similar TS value of apple pomace to the one obtained in this study was reported by Calvete-Torre et al. [65]. The TS content of cabbage leaves was in the range reported for cabbage waste. The TS content of cabbage waste depends on the species and ranges from 5.64% for white cabbage to 16.3% for brussels sprouts [66]. The VS values found in studied residues were in good agreement with the results reported for food waste, which contains 73–98% of VS. Such a high level of VS is favourable for composting, biogas production and other biological technologies as well as incineration [66]. The TKN and TP content of all studied wastes is in the range of 13.0–32.5 g kgDM−1 and 0.5–9.8 g kgDM−1, respectively, reported in the literature for food waste [56]. The TK content of pumpkin, walnut and cabbage wastes was much higher than the maximum value (14.3 g kgDM−1) reported for the food waste [56].
The optimal C:N ratio in composting and biogas production should be 30:1 [67,68,69,70]. The C:N ratio obtained in this study for pumpkin residue and cabbage leaves was too low for both treatments; therefore, the addition of a carbon-rich bulk agent in the case of composting and carbon-rich waste in the case of AD might be necessary. On the other hand, very high C:N ratios obtained for apple pomace and walnut husks indicate a need for the addition of other nitrogen-rich substrates for both composting and AD processes.
The SMY of studied residues, except for walnut husks, was in the range of methane potential of fruit and vegetable waste which is reported between 160 and 350 NL kgVS−1 [16]. The fruit and vegetable residues are very heterogeneous and may contain leaves, peels, skins, rinds, cores, pits, pulp, stems, seeds, etc. The variety of fruit and vegetable species also affects the potential methane production. Nevertheless, the methane yield from studied residues is much lower than that from the most popular feedstock for biogas production, i.e., maize which produces 345 NL CH4 kgVS−1 on average [71]. The SMY obtained for cabbage leaves is in good agreement with Gunaseelan [72] who reported an SMY equal to 309 ± 13 L kgVS−1 and 291 ± 12 L kgVS−1, for cabbage leaves and stems, respectively. However, the SMY shown by Sapkota et al. [73] was higher compared to the results of this study. Anaerobic digestion of whole cabbages gives contradictory results. Yan et al. [39] reported an SMY equal to 204 L kgVS−1 while Smurzyńska et al. [74] obtained a much higher SMY value (370.84 L kgVS−1).
The SMY of pumpkin residue obtained in this study is much lower than that shown in the literature. Smurzyńska et al. [74] reported an SMY of pumpkin equal to 372.41 NL kgVS−1 while Dubrovskis and Plume [75] showed even higher SMY values (422 ± 4 NL kgVS−1). Those differences between the values from the literature and the results of this study can be attributed to the differences in the substrate used in BMP. In this study, the pumpkin residue consisted of peels and fibrous strands while in studies of Smurzyńska et al. [74] and Dubrovskis and Plume [75] the whole fruit was used.
The differences in methane production concerned not only the SMY but also the kinetics of the process. Different peaks of daily methane production in the AD of studied residues denote the discrepancy in fermentation kinetics. Since fruits and vegetables are characterised with low cellulose, hemicellulose and lignin content [76,77], the hydrolytic process is not a limiting factor and a high VS content with a low TS content results in rapid hydrolysis [78]. Therefore, the first peak may result from the conversion of pre-existing soluble organic matter. The second peak represents the further solubilization of the easy-to-digest substances lightly bound with particulate organics, while the last peak is the result of solubilization and methanization of tightly bound biodegradable substances [38].
Another important indicator for methane production is the rate of the decomposition of the biodegradable material. The time needed to obtain 50% (T50) of potential methane production for all studied residues was 8–13 days and was similar to the values obtained for the AD of ensilaged wetland plants, harvested as a vegetation management measure in nature-protected areas, considered as a problematic waste difficult to the utilization but useful for biogas production [79]. The T95 was much shorter for pumpkin residue than for wetland plants which needed 25–41 days to reach 95% of potential methane production [79]. In turn, the walnut husks and cabbage leaves produced 95% of methane in a similar period as was reported for Carex elata and Phalaris arundinacea reported by Czubaszek et al. [79] and for Phragmites australis reported by Dragoni et al. [80].
The anaerobic mono-digestion of FVR promotes rapid acidification which results in the inhibition of methanogenic microorganisms and leads to nutritional deficiencies caused by an improper C:N:P:S ratio. Therefore, the co-digestion of selected FVR or the co-digestion of those residues with agricultural waste may stabilize the AD through avoidance of the scarcity or excess of nutrients and enhance the methane production [16]. Co-digestion of vegetable waste with slaughter waste increased the methane yield by 74.2% compared to the mono-digestion of vegetable wastes [43], while co-digestion of fruit and vegetable wastes with municipal sewage sludge led to an improvement in the stability of the process and enhanced biogas production [81]. The possibility of co-digestion of ensiled apple pomace and maize silage was studied by Kupryś-Caruk and Kołodziejski [82]. The production of biogas from a mixture of these two substrates was ca. 15% lower than that of maize silage alone and ca. 17% higher than that of the apple pomace.
The decision to co-digest the FVR should be based on the identification of inhibitors which may be introduced to the biogas plant with this feedstock or may be released during its digestion. Degradation of proteins, nucleic acids and/or uric acid/urea during the AD process leads to the release of ammonium (NH4+) which is not degraded under anaerobic conditions [83,84,85,86]. The NH4+ is in equilibrium with NH3; however, the NH3 concentration increases with temperature and pH. A high concentration of free NH3 affects the community structure of archaea, which are responsible for CH4 production [87]. This leads to an increase in volatile fatty acids (VFA) and consequently to a reduction in the pH value [88]. The threshold values for the NH3 concentration range from 80 to 400 ppm. The AD of nitrogen-rich feedstock such as grass silage, poultry manure or slaughterhouse waste is most at risk of inhibition resulting from a high NH3 concentration [89]. To prevent process failures due to NH3 toxicity, different conventional strategies such as stripping, chemical precipitation, adjustment of C:N ratios, immobilization and adaption of microorganisms, bioaugmentation, dilution of substrates and/or co-digestion of nitrogen-rich wastes have been used [90]. In this study, the NH3 concentration varied from 1.5 ppm up to 700 ppm and was much lower than ten, the threshold value, except for cabbage leaves. Therefore, all the studied residues can be used as co-substrates in the AD process; however, in the case of cabbage, there is a risk of process inhibition.
The H2S is another inhibitor which causes a decrease in methane production and in addition negatively affects the installation and engine. The concentration of H2S in biogas depends on the feedstock and AD technology and ranges between 50 and 10,000 ppm [91]. The H2S in biogas is a product of the decomposition of sulphur-containing compounds such as amino acids, sulphoxides and sulphonic acids and a product of the biological reduction in sulphates in the feedstock. The presence of H2S in the reactor inhibits the AD process because H2S is capable of diffusing through cell membranes and causing the denaturation of proteins thus disturbing the metabolism of microorganisms [83]. This acidic and toxic gas together with water present in biogas creates the condensate which causes the corrosion of installation and negatively affects the condition of the engine [92,93]. A high concentration of H2S causes an increase in the cost of biogas production due to the necessity of H2S removal. The main technologies such as adsorption into liquid either water or caustic soda; adsorption on a solid or a biological conversion by sulphide oxidizing microorganisms with the addition of air or oxygen require capital, energy and media additional costs [91].
The H2S concentration in biogas was higher in the case of most studied materials, except walnut husk in comparison to the H2S concentration in biogas produced from mixed fruit and mixed fruit and vegetable waste which amounted from 120 to 250 ppm depending on the feedstock, organic load rate and temperature of digestion [94]. Much higher H2S concentration (up to 1700 ppm) was observed in biogas from the AD of food waste and the liquid fraction of dairy manure after solid–liquid separation [95]. In this case, high protein concentration in food might be the reason for such high H2S concentrations.
The differences in protein content in the studied wastes affected the NH3 and H2S concentration in the biogas. According to the literature, the highest protein content is in cabbage and varies from 15.6%DM to 24.8%DM [60,66]; however, in most studies, values of around 18–19.5%DM were found [96,97,98]. Lower protein contents were reported for pumpkin fruit. However, the concentrations vary significantly depending on the species and part of the fruit. The highest values were reported for seeds (28.26–33.35%DM) while much lower (6.44–7.09%DM; 6.8–14.45%DM) for peel and pulp, respectively. In this study, pumpkin residue consisted of peels and fibrous strands; therefore, the lower protein content resulted in low NH3 and H2S concentrations. The lowest protein content is reported in walnut (5%DM) [99] and apple pomace (1.2–9.81%DM) [100,101] with most common values between 3 and 5%DM [59,100,102,103,104].
Maize as feedstock for biogas production has several advantages such as high biomass performance, good preservability of ensilage, steady yields and high specific methane yield. The AD process is steady and maize silage guarantees a year-round supply for biogas plants. Well-known production and preservation methods also make maize one of the most popular feedstocks. The high level of subsidies in many EU countries also increased the profitability of biogas production from maize. However, the increasing price of this feedstock together with limitations for renewable energy sources subsidies introduced in many countries and the RED II policy force the biogas plant operators to look for new feedstock [105]. FVR are characterised by a lower SMY than maize and may elevate the H2S concentration in biogas, and therefore, the co-digestion of FVR may have adverse effects on biogas production from maize [82]. However, the addition of fruit and vegetable waste to other substrates such as slaughter waste or municipal sewage sludge stabilized the process and enhanced biogas production [43,81].
Biogas production is a continuous process which demands the supply of the feedstock throughout the year. Unlike the agricultural wastes and energy crops, FVR generated from fruit and vegetable processing may be available throughout the almost whole year since fruits and vegetables are stored or imported for the whole year of production. Cabbage and apples can be stored from 3 to 6 months, and white cabbage even up to 12 months [106] depending on the storage method. Fresh pumpkin can be stored for 2–3 months [107]. In addition, cabbage leaves, apple pomace and pumpkin residue can be preserved by ensilaging [61,82,108,109]. However, the supply of FVR still may be uneven throughout the year. The co-digestion of maize and FVR may also be logistically difficult. The coordination among several suppliers and biogas plant operators at a spatial scale is required to minimize the transport costs [110].
The advantage of partial substitution of maize with FVR through co-digestion is a decrease in GHG emissions. The life cycle assessment (LCA) of maize production as a substrate for biogas plants revealed GHG emissions equal to 3521 kg CO2 ha−1 with 43% resulting from machinery [40]. The boundary of the LCA included seed-bed preparation and fertilization, followed by drilling and sowing followed further by shredding during harvest, transportation of maize chips and ensilaging in a concrete bunker silo. The LCA calculations included direct energy input from fuel and indirect energy input from materials, machinery and labour [40]. Similar results were reported by Camargo et al. [111] and were higher than those shown by Holka and Bieńkowski [112]. The current use of agricultural land in Poland for the cultivation of apples, cabbage, pumpkins, and walnuts is ca. 186,000 ha. Therefore, the use of FVR as feedstock for biogas production would contribute to the reduction in GHG emissions by 43,682 t CO2 eq.

5. Conclusions

FVR are often treated as waste and generates costs of utilization and/or storage. The FVR utilization as biogas plant feedstock may decrease those costs. This feedstock may be also beneficial for biogas plant operators, decreasing the costs of supplied substrates. In many countries, the current biogas production system is based on feedstock coming from energy crops production requiring large financial and energy costs. Our studies revealed that FVR have the potential for at least partial maize substitution. The apple pomace, cabbage leaves and pumpkin residues are the substrates with optimal moisture and VS content for the AD process. These three residues with SMY ranging from 199.18 ± 12.45 to 297.81 ± 0.65 NL CH4 kgVS−1, may be used as valuable co-substrates in biogas production.
Considering the overall cultivation area of apple trees, cabbage, pumpkin and walnut trees in Poland and the data provided by Statistics Poland [113] on the annual energy consumption per 1 m2 of the floor area of residence (27.89 kWh of electricity and 0.77 GJ of thermal energy obtained from coal), the amount of electricity produced by the AD of the studied FVR may supply ca. 65,000 houses and the thermal energy may heat ca. 7500 houses. In addition, FVR used as substrates instead of maize silage in biogas plants can also contribute to the reduction in GHG emissions. Apple pomace used as a feedstock for AD has the greatest potential in reducing GHG emissions because of the cultivation area, yield and thus amount of generated waste. Considering the total apple cultivation area in Poland, the use of apple waste as a feedstock in biogas production instead of maize silage may contribute to the reduction in GHG emissions by 41,066 t CO2 eq. which is equal to lifetime GHG emissions from 829 passenger cars.
Implementing FVR in the biogas production system requires a steady round-year supply and a network of biogas plants operating on several types of feedstock. The supply of FVR can be ensured continuously since residues can be preserved as silages. However, the scattered distribution of fruit and vegetable processing plants may be logistically challenging.

Author Contributions

Conceptualization, R.C., A.W.-C. and R.T.; methodology, R.C., A.W.-C. and R.T.; investigation, R.C. and R.T.; data curation, A.W.-C.; writing—original draft preparation, R.C., A.W.-C. and R.T.; writing—review and editing, R.C. and A.W.-C.; visualization, R.C.; funding acquisition, R.C. All authors have read and agreed to the published version of the manuscript.

Funding

This work was financially supported by the Ministry of Science and Higher Education as part of the project WZ/WB-IIŚ/1/2020.

Institutional Review Board Statement

Not applicable.

Informed Consent Statement

Not applicable.

Data Availability Statement

Not applicable.

Conflicts of Interest

The authors declare no conflict of interest. The funders had no role in the design of the study; in the collection, analyses, or interpretation of data; in the writing of the manuscript, or in the decision to publish the results.

References

  1. Patel, S.N.; Sharma, M.; Lata, K.; Singh, U.; Kumar, V.; Sangwan, R.S.; Singh, S.P. Improved Operational Stability of d -psicose 3-epimerase by a Novel Protein Engineering Strategy, and d -psicose Production from Fruit and Vegetable Residues. Bioresour. Technol. 2016, 216, 121–127. [Google Scholar] [CrossRef] [PubMed]
  2. Porter, S.D.; Reay, D.S.; Higgins, P.; Bomberg, E. A Half-Century of Production-Phase Greenhouse Gas Emissions from Food Loss & Waste in the Global Food Supply Chain. Sci. Total Environ. 2016, 571, 721–729. [Google Scholar] [CrossRef] [PubMed] [Green Version]
  3. FAO. The State of Food and Agriculture 2019. In Moving Forward on Food Loss and Waste Reduction; Food and Agriculture Organization of the United Nations: Rome, Italy, 2019. [Google Scholar]
  4. Gustavsson, J. (Ed.) Global Food Losses and Food Waste: Extent, Causes and Prevention; Study Conducted for the International Congress Save Food! At Interpack 2011, [16–17 May], Düsseldorf, Germany; Food and Agriculture Organization of the United Nations: Rome, Italy, 2011; ISBN 978-92-5-107205-9. [Google Scholar]
  5. Šelo, G.; Planinić, M.; Tišma, M.; Tomas, S.; Koceva Komlenić, D.; Bucić-Kojić, A. A Comprehensive Review on Valorization of Agro-Food Industrial Residues by Solid-State Fermentation. Foods 2021, 10, 927. [Google Scholar] [CrossRef] [PubMed]
  6. O’Shea, N.; Arendt, E.; Gallagher, E. Enhancing an Extruded Puffed Snack by Optimising Die Head Temperature, Screw Speed and Apple Pomace Inclusion. Food Bioprocess Technol. 2014, 7, 1767–1782. [Google Scholar] [CrossRef]
  7. KOWR. Poland Tastes Good. A Brief Guide to Polish Agri-Food Offer; National Support Centre for Agriculture: Warsaw, Poland, 2021. [Google Scholar]
  8. Statistics Poland. Production of Agricultural and Horticultural Crops in 2021, 1st ed.; Zakład Wydawnictw Statystycznych: Warsaw, Poland, 2022. [Google Scholar]
  9. Eurostat. Crop Production in EU Standard Humidity. Available online: https://ec.europa.eu/eurostat/databrowser/view/APRO_CPSH1__custom_2724766/default/table?lang=en (accessed on 28 April 2022).
  10. FAOSTAT. Crops and Livestock Products. Available online: https://www.fao.org/faostat/en/#data/QCL (accessed on 30 April 2022).
  11. Płocharski, W.; Mieszczakowska-Frąc, M.; Rutkowski, K.; Konopacka, D. Traditional and Innovative Directions of Apple Management in Poland; Instytut Ogrodnictwa: Skierniewice, Poland, 2019. (In Polish) [Google Scholar]
  12. Vendruscolo, F.; Albuquerque, P.M.; Streit, F.; Esposito, E.; Ninow, J.L. Apple Pomace: A Versatile Substrate for Biotechnological Applications. Crit. Rev. Biotechnol. 2008, 28, 1–12. [Google Scholar] [CrossRef] [PubMed]
  13. De Laurentiis, V.; Corrado, S.; Sala, S. Quantifying Household Waste of Fresh Fruit and Vegetables in the EU. Waste Manag. 2018, 77, 238–251. [Google Scholar] [CrossRef]
  14. Seabra, I.J.; Braga, M.E.M.; Oliveira, R.A.; de Sousa, H.C. Two-Step High Pressure Solvent Extraction of Walnut (Juglans regia L.) Husks: ScCO2 + CO2/Ethanol/H2O. J. CO2 Util. 2019, 34, 375–385. [Google Scholar] [CrossRef]
  15. Directive (EU) 2018/851 of the European Parliament and of the Council of 30 May 2018 Amending Directive 2008/98/EC on Waste (Text with EEA Relevance). O. J. Eur. Union L. 2018, 328, 82–209.
  16. Neto, J.G.; Ozorio, L.V.; Campos de Abreu, T.C.; Ferreira dos Santos, B.; Pradelle, F. Modeling of Biogas Production from Food, Fruits and Vegetables Wastes Using Artificial Neural Network (ANN). Fuel 2021, 285, 119081. [Google Scholar] [CrossRef]
  17. Md Noh, N.A.N.; Karim, L.; Omar, S.R. Value-Added Products from Pumpkin Wastes: A Review. Malays. J. Sci. Health Technol. 2022, 8, 77–84. [Google Scholar] [CrossRef]
  18. Bijmans, M.F.M.; Buisman, C.J.N.; Meulepas, R.J.W.; Lens, P.N.L. Sulfate Reduction for Inorganic Waste and Process Water Treatment. In Comprehensive Biotechnology, 2nd ed.; Moo-Young, M., Ed.; Academic Press: Burlington, NJ, USA, 2011; pp. 435–446. ISBN 978-0-08-088504-9. [Google Scholar]
  19. Mu, H.; Zhao, C.; Zhao, Y.; Li, Y.; Hua, D.; Zhang, X.; Xu, H. Enhanced Methane Production by Semi-Continuous Mesophilic Co-Digestion of Potato Waste and Cabbage Waste: Performance and Microbial Characteristics Analysis. Bioresour. Technol. 2017, 236, 68–76. [Google Scholar] [CrossRef] [PubMed]
  20. Tamelová, B.; Malaťák, J.; Velebil, J. Hydrothermal Carbonization and Torrefaction of Cabbage Waste. Agron. Res. 2019, 17, 862–871. [Google Scholar] [CrossRef]
  21. Dahunsi, S.O.; Olayanju, A.; Izebere, J.O.; Oluyori, A.P. Data on Energy and Economic Evaluation and Microbial Assessment of Anaerobic Co-Digestion of Fruit Rind of Telfairia occidentalis (Fluted Pumpkin) and Poultry Manure. Data Brief 2018, 21, 97–104. [Google Scholar] [CrossRef] [PubMed]
  22. Dahunsi, S.O.; Oranusi, S.; Owolabi, J.B.; Efeovbokhan, V.E. Comparative Biogas Generation from Fruit Peels of Fluted Pumpkin (Telfairia occidentalis) and Its Optimization. Bioresour. Technol. 2016, 221, 517–525. [Google Scholar] [CrossRef]
  23. Dahunsi, S.O.; Olayanju, T.M.A.; Adesulu-Dahunsi, A.T. Data on Optimization of Bioconversion of Fruit Rind of Telfairia occidentalis (Fluted Pumpkin) and Poultry Manure for Biogas Generation. Chem. Data Collect. 2019, 20, 100192. [Google Scholar] [CrossRef] [Green Version]
  24. Scarlat, N.; Dallemand, J.-F.; Fahl, F. Biogas: Developments and Perspectives in Europe. Renew. Energy 2018, 129, 457–472. [Google Scholar] [CrossRef]
  25. Obaideen, K.; Abdelkareem, M.A.; Wilberforce, T.; Elsaid, K.; Sayed, E.T.; Maghrabie, H.M.; Olabi, A.G. Biogas Role in Achievement of the Sustainable Development Goals: Evaluation, Challenges, and Guidelines. J. Taiwan Inst. Chem. Eng. 2022, 131, 104207. [Google Scholar] [CrossRef]
  26. UN. Transforming Our World: The 2030 Agenda for Sustainable Development. Available online: https://sdgs.un.org/2030agenda (accessed on 4 May 2022).
  27. Feiz, R.; Larsson, M.; Ekstrand, E.-M.; Hagman, L.; Ometto, F.; Tonderski, K. The Role of Biogas Solutions for Enhanced Nutrient Recovery in Biobased Industries—Three Case Studies from Different Industrial Sectors. Resour. Conserv. Recycl. 2021, 175, 105897. [Google Scholar] [CrossRef]
  28. Esposito, E.; Dellamuzia, L.; Moretti, U.; Fuoco, A.; Giorno, L.; Jansen, J.C. Simultaneous Production of Biomethane and Food Grade CO2 from Biogas: An Industrial Case Study. Energy Environ. Sci. 2019, 12, 281–289. [Google Scholar] [CrossRef]
  29. Golmakani, A.; Nabavi, S.A.; Manović, V. Production of Negative-Emission Biomethane by Twin Double-Bed Pressure Swing Adsorption with Tail Gas Sequestration. Chem. Eng. J. 2021, 408, 127312. [Google Scholar] [CrossRef]
  30. Fagerström, A.; Al Seadi, T.; Rasi, S.; Briseid, T.; Murphy, J.D.; IEA Bioenergy Task 37; IEA Bioenergy Programme. The Role of Anaerobic Digestion and Biogas in the Circular Economy; IEA Bioenergy: Cork, Ireland, 2018; ISBN 978-1-910154-45-8. [Google Scholar]
  31. Banaszuk, P.; Wysocka-Czubaszek, A.; Czubaszek, R.; Roj-Rojewski, S. Implications of Biomass Use for Energy Production. Wieś I Rol. 2015, 169, 139–152. (In Polish) [Google Scholar]
  32. Prochnow, A.; Heiermann, M.; Plöchl, M.; Linke, B.; Idler, C.; Amon, T.; Hobbs, P.J. Bioenergy from Permanent Grassland—A Review: 1. Biogas. Bioresour. Technol. 2009, 100, 4931–4944. [Google Scholar] [CrossRef]
  33. Feiz, R.; Metson, G.S.; Wretman, J.; Ammenberg, J. Key Factors for Site-Selection of Biogas Plants in Sweden. J. Clean. Prod. 2022, 354, 131671. [Google Scholar] [CrossRef]
  34. Golmakani, A.; Ali Nabavi, S.; Wadi, B.; Manovic, V. Advances, Challenges, and Perspectives of Biogas Cleaning, Upgrading, and Utilisation. Fuel 2022, 317, 123085. [Google Scholar] [CrossRef]
  35. Gupta, A.; Behl, T.; Panichayupakaranan, P. A Review of Phytochemistry and Pharmacology Profile of Juglans regia. Obes. Med. 2019, 16, 100142. [Google Scholar] [CrossRef]
  36. Kafle, G.K.; Kim, S.H. Effects of Chemical Compositions and Ensiling on the Biogas Productivity and Degradation Rates of Agricultural and Food Processing By-Products. Bioresour. Technol. 2013, 142, 553–561. [Google Scholar] [CrossRef]
  37. Scano, E.A.; Grosso, M.; Pistis, A.; Carboni, G.; Cocco, D. An In-Depth Analysis of Biogas Production from Locally Agro-Industrial by-Products and Residues. An Italian Case. Renew. Energy 2021, 179, 308–318. [Google Scholar] [CrossRef]
  38. Zhen, G.; Lu, X.; Kobayashi, T.; Kumar, G.; Xu, K. Anaerobic Co-Digestion on Improving Methane Production from Mixed Microalgae (Scenedesmus sp., Chlorella sp.) and Food Waste: Kinetic Modeling and Synergistic Impact Evaluation. Chem. Eng. J. 2016, 299, 332–341. [Google Scholar] [CrossRef]
  39. Yan, H.; Zhao, C.; Zhang, J.; Zhang, R.; Xue, C.; Liu, G.; Chen, C. Study on Biomethane Production and Biodegradability of Different Leafy Vegetables in Anaerobic Digestion. AMB Express 2017, 7, 27. [Google Scholar] [CrossRef] [Green Version]
  40. Czubaszek, R.; Wysocka-Czubaszek, A.; Banaszuk, P. GHG Emissions and Efficiency of Energy Generation through Anaerobic Fermentation of Wetland Biomass. Energies 2020, 13, 6497. [Google Scholar] [CrossRef]
  41. Sagagi, B.; Garba, B.; Usman, N. Studies on Biogas Production from Fruits and Vegetable Waste. Bayero J. Pure Appl. Sci. 2010, 2, 115–118. [Google Scholar] [CrossRef]
  42. Chakravarty, I.; Mandavgane, S.A. Valorization of Fruit and Vegetable Waste for Biofertilizer and Biogas. J. Food Process. Eng. 2021, 44, e13512. [Google Scholar] [CrossRef]
  43. Miramontes-Martínez, L.R.; Rivas-García, P.; Albalate-Ramírez, A.; Botello-Álvarez, J.E.; Escamilla-Alvarado, C.; Gomez-Gonzalez, R.; Alcalá-Rodríguez, M.M.; Valencia-Vázquez, R.; Santos-López, I.A. Anaerobic Co-Digestion of Fruit and Vegetable Waste: Synergy and Process Stability Analysis. J. Air Waste Manag. Ass. 2021, 71, 620–632. [Google Scholar] [CrossRef]
  44. Sitorus, B.; Sukandar; Panjaitan, S.D. Biogas Recovery from Anaerobic Digestion Process of Mixed Fruit -Vegetable Wastes. Energy Procedia 2013, 32, 176–182. [Google Scholar] [CrossRef] [Green Version]
  45. Pilarska, A.A.; Pilarski, K.; Ryniecki, A.; Tomaszyk, K.; Dach, J.; Wolna-Maruwka, A. Utilization of Vegetable Dumplings Waste from Industrial Production by Anaerobic Digestion. Int. Agrophys. 2017, 31, 93–102. [Google Scholar] [CrossRef]
  46. Morales-Polo, C.; Cledera-Castro, M.M.; Soria, B.Y.M. Biogas Production from Vegetable and Fruit Markets Waste—Compositional and Batch Characterizations. Sustainability 2019, 11, 6790. [Google Scholar] [CrossRef] [Green Version]
  47. Tura, A.M.; Lemma, T.S. Production and Evaluation of Biogas from Mixed Fruits and Vegetable Wastes Collected from Arba Minch Market. Am. J. Appl. Chem. 2019, 7, 185. [Google Scholar] [CrossRef]
  48. Pavi, S.; Kramer, L.E.; Gomes, L.P.; Miranda, L.A.S. Biogas Production from Co-Digestion of Organic Fraction of Municipal Solid Waste and Fruit and Vegetable Waste. Bioresour. Technol. 2017, 228, 362–367. [Google Scholar] [CrossRef]
  49. Phetyim, N.; Wanthong, T.; Kannika, P.; Supngam, A. Biogas Production from Vegetable Waste by Using Dog and Cattle Manure. Energy Procedia 2015, 79, 436–441. [Google Scholar] [CrossRef] [Green Version]
  50. Shen, F.; Yuan, H.; Pang, Y.; Chen, S.; Zhu, B.; Zou, D.; Liu, Y.; Ma, J.; Yu, L.; Li, X. Performances of Anaerobic Co-Digestion of Fruit & Vegetable Waste (FVW) and Food Waste (FW): Single-Phase vs. Two-Phase. Bioresour. Technol. 2013, 144, 80–85. [Google Scholar] [CrossRef]
  51. Deressa, L.; Libsu, S.; Chavan, R.B.; Manaye, D.; Dabassa, A. Production of Biogas from Fruit and Vegetable Wastes Mixed with Different Wastes. Environ. Ecol. Res. 2015, 3, 65–71. [Google Scholar] [CrossRef]
  52. Wilinska-Lisowska, A.; Ossowska, M.; Czerwionka, K. The Influence of Co-Fermentation of Agri-Food Waste with Primary Sludge on Biogas Production and Composition of the Liquid Fraction of Digestate. Energies 2021, 14, 1907. [Google Scholar] [CrossRef]
  53. Wang, K.; Yun, S.; Xing, T.; Li, B.; Abbas, Y.; Liu, X. Binary and Ternary Trace Elements to Enhance Anaerobic Digestion of Cattle Manure: Focusing on Kinetic Models for Biogas Production and Digestate Utilization. Bioresour. Technol. 2021, 323, 124571. [Google Scholar] [CrossRef] [PubMed]
  54. Clesceri, L.S.; American Public Health Association; American Water Works Association; Water Pollution Control Federation (Eds.) Standard Methods: For the Examination of Water and Wastewater, 20th ed.; American Public Health Association: Washington, DC, USA, 1998; ISBN 978-0-87553-235-6. [Google Scholar]
  55. Curkowski, A.; Mroczkowski, P.; Oniszk-Popławska, A.; Wiśniewski, G. Agricultural Biogas—Production and Usage; Mazowiecka Agencja Energetyczna: Warszawa, Poland, 2009. [Google Scholar]
  56. Selvam, A.; Ilamathi, P.M.K.; Udayakumar, M.; Murugesan, K.; Banu, J.R.; Khanna, Y.; Wong, J. Food Waste Properties. In Current Developments in Biotechnology and Bioengineering; Elsevier: Amsterdam, The Netherlands, 2021; pp. 11–41. ISBN 978-0-12-819148-4. [Google Scholar]
  57. Al Seadi, T.; Rutz, D.; Prassl, H.; Köttner, M.; Finsterwalder, T.; Volk, S.; Janssen, R. Biogas Handbook; University of Southern Denmark Esbjerg: Esbjerg, Denmark, 2008. [Google Scholar]
  58. Jung, J.; Cavender, G.; Zhao, Y. Impingement Drying for Preparing Dried Apple Pomace Flour and Its Fortification in Bakery and Meat Products. J. Food Sci. Technol. 2015, 52, 5568–5578. [Google Scholar] [CrossRef]
  59. Fernandes, P.A.R.; Ferreira, S.S.; Bastos, R.; Ferreira, I.; Cruz, M.T.; Pinto, A.; Coelho, E.; Passos, C.P.; Coimbra, M.A.; Cardoso, S.M.; et al. Apple Pomace Extract as a Sustainable Food Ingredient. Antioxidants 2019, 8, 189. [Google Scholar] [CrossRef] [Green Version]
  60. Gajewski, M.; Radzanowska, J. Chemical Composition and Sensory Quality of White Cabbage Depending on the Cabbage Cultivar and Nitrogen Dose as Applied in Mineral Fertilization. Żywność. Nauka Technol. Jakość. 2004, 2, 108–120. [Google Scholar]
  61. de Rezende, A.V.; Rabelo, C.H.S.; da Silva, M.R.M.; Härter, C.J.; Veiga, R.M. Wasted Cabbage (Brassica oleracea) Silages Treated with Different Levels of Ground Corn Andsilage Inoculant. R. Bras. Zootec. 2015, 44, 296–302. [Google Scholar] [CrossRef] [Green Version]
  62. Kim, M.Y.; Kim, E.J.; Kim, Y.-N.; Choi, C.; Lee, B.-H. Comparison of the Chemical Compositions and Nutritive Values of Various Pumpkin (Cucurbitaceae) Species and Parts. Nutr. Res. Pract. 2012, 6, 21. [Google Scholar] [CrossRef] [Green Version]
  63. Valdez-Arjona, L.P.; Ramírez-Mella, M. Pumpkin Waste as Livestock Feed: Impact on Nutrition and Animal Health and on Quality of Meat, Milk, and Egg. Animals 2019, 9, 769. [Google Scholar] [CrossRef] [Green Version]
  64. Nansikombi, N.; Muyonga, J.H.; Byaruhanga, Y.B. Association between Fruit Characteristics and Postharvest Stability of Different Pumpkin (Cucurbita) Species. J. Food Res. 2019, 8, 131. [Google Scholar] [CrossRef]
  65. Calvete-Torre, I.; Muñoz-Almagro, N.; Pacheco, M.T.; Antón, M.J.; Dapena, E.; Ruiz, L.; Margolles, A.; Villamiel, M.; Moreno, F.J. Apple Pomaces Derived from Mono-Varietal Asturian Ciders Production Are Potential Source of Pectins with Appealing Functional Properties. Carbohydr. Polym. 2021, 264, 117980. [Google Scholar] [CrossRef] [PubMed]
  66. de Evan, T.; Vintimilla, A.; Marcos, C.N.; Ranilla, M.J.; Carro, M.D. Evaluation of Brassica Vegetables as Potential Feed for Ruminants. Animals 2019, 9, 588. [Google Scholar] [CrossRef] [PubMed] [Green Version]
  67. Shilev, S.; Naydenov, M.; Vancheva, V.; Aladjadjiyan, A. Composting of Food and Agricultural Wastes. In Utilization of By-Products and Treatment of Waste in the Food Industry; Oreopoulou, V., Russ, W., Eds.; Springer: New York, NY, USA, 2007; pp. 283–301. ISBN 978-0-387-33511-7. [Google Scholar]
  68. Cardenas, R.R.; Wang, L.K. Composting Process. In Solid Waste Processing and Resource Recovery; Wang, L.K., Pereira, N.C., Eds.; Humana Press: Totowa, NJ, USA, 1980; pp. 269–327. ISBN 978-1-4612-5994-7. [Google Scholar]
  69. Tanimu, M.I.; Ghazi, T.I.M.; Harun, R.M.; Idris, A. Effect of Carbon to Nitrogen Ratio of Food Waste on Biogas Methane Production in a Batch Mesophilic Anaerobic Digester. Int. J. Innov. 2014, 5, 116–119. [Google Scholar]
  70. Kwietniewska, E.; Tys, J. Process Characteristics, Inhibition Factors and Methane Yields of Anaerobic Digestion Process, with Particular Focus on Microalgal Biomass Fermentation. Renew. Sustain. Energy Rev. 2014, 34, 491–500. [Google Scholar] [CrossRef]
  71. European Commission. Joint Research Centre. Solid and Gaseous Bioenergy Pathways: Input Values and GHG Emissions: Calculated According to the Methodology Set in COM(2016) 767; Publications Office: Luxembourg, 2017. [Google Scholar]
  72. Gunaseelan, V.N. Biochemical Methane Potential of Fruits and Vegetable Solid Waste Feedstocks. Biomass Bioenergy 2004, 26, 389–399. [Google Scholar] [CrossRef]
  73. Sapkota, T.; Aryal, J.; Thapa, S.; Karki, A.B. Biogas Production from Anaerobic Digestion of Different Biodegradable Materials. Nepal J. Sci. Technol. 2012, 13, 123–128. [Google Scholar] [CrossRef] [Green Version]
  74. Smurzyńska, A.; Czekała, W.; Lewicki, A.; Cieślik, M.; Kozłowski, K.; Janczak, D. The Biogas Output of Vegetables Utilized in the Polish Market Due to the Introduction of the Russian Embargo. Tech. Rol. Ogrod. Leśna 2016, 6, 24–27. [Google Scholar]
  75. Dubrovskis, V.; Plume, I. Biogas from Wastes of Pumpkin, Marrow and Apple. Agron. Res. 2017, 15, 069–078. [Google Scholar]
  76. Nawirska, A.; Sokół-Łętowska, A.; Kucharska, A.Z.; Biesiada, A.; Bednarek, M. Comparing the contents of dietary fibre fractions in some varieties of Cucurbita maxima and Cucurbita pepo. Żywność. Nauka Technol. Jakość. 2008, 1, 65–73. (In Polish) [Google Scholar]
  77. Komolka, P.; Górecka, D.; Dziedzic, K. The Effect of Thermal Processing of Cruciferous Vegetables on Their Content of Dietary Fiber and Its Fractions. Acta Sci. Pol. Technol. Aliment. 2012, 11, 347–354. [Google Scholar]
  78. Ji, C.; Kong, C.-X.; Mei, Z.-L.; Li, J. A Review of the Anaerobic Digestion of Fruit and Vegetable Waste. Appl. Biochem. Biotechnol. 2017, 183, 906–922. [Google Scholar] [CrossRef] [PubMed]
  79. Czubaszek, R.; Wysocka-Czubaszek, A.; Wichtmann, W.; Banaszuk, P. Specific Methane Yield of Wetland Biomass in Dry and Wet Fermentation Technologies. Energies 2021, 14, 8373. [Google Scholar] [CrossRef]
  80. Dragoni, F.; Giannini, V.; Ragaglini, G.; Bonari, E.; Silvestri, N. Effect of Harvest Time and Frequency on Biomass Quality and Biomethane Potential of Common Reed (Phragmites australis) Under Paludiculture Conditions. Bioenerg. Res. 2017, 10, 1066–1078. [Google Scholar] [CrossRef]
  81. Anhuradha, S.; Arrrivukkarasan, S. Potentiality of Fruit and Vegetable Waste by Anaerobic Co-Digestion with Municipal Sewage Sludge and Biogas Yield; AIP Publishing: Puducherry, India, 2020; p. 070003. [Google Scholar]
  82. Kupryś-Caruk, M.; Kołodziejski, R. Evaluation of Ensilaged Apple Pomace Usefulness for Biogas Production. Post. Nauk. Technol. Przem. Roln. Spoż. 2014, 69, 5–13. [Google Scholar]
  83. Chen, Y.; Cheng, J.J.; Creamer, K.S. Inhibition of Anaerobic Digestion Process: A Review. Bioresour. Technol. 2008, 99, 4044–4064. [Google Scholar] [CrossRef]
  84. Rajagopal, R.; Massé, D.I.; Singh, G. A Critical Review on Inhibition of Anaerobic Digestion Process by Excess Ammonia. Bioresour. Technol. 2013, 143, 632–641. [Google Scholar] [CrossRef]
  85. Westerholm, M.; Moestedt, J.; Schnürer, A. Biogas Production through Syntrophic Acetate Oxidation and Deliberate Operating Strategies for Improved Digester Performance. Appl. Energy 2016, 179, 124–135. [Google Scholar] [CrossRef] [Green Version]
  86. Tian, H.; Fotidis, I.A.; Kissas, K.; Angelidaki, I. Effect of Different Ammonia Sources on Aceticlastic and Hydrogenotrophic Methanogens. Bioresour. Technol. 2018, 250, 390–397. [Google Scholar] [CrossRef] [Green Version]
  87. Yang, Z.; Wang, W.; He, Y.; Zhang, R.; Liu, G. Effect of Ammonia on Methane Production, Methanogenesis Pathway, Microbial Community and Reactor Performance under Mesophilic and Thermophilic Conditions. Renew. Energy 2018, 125, 915–925. [Google Scholar] [CrossRef]
  88. Kalamaras, S.D.; Vitoulis, G.; Christou, M.L.; Sfetsas, T.; Tziakas, S.; Fragos, V.; Samaras, P.; Kotsopoulos, T.A. The Effect of Ammonia Toxicity on Methane Production of a Full-Scale Biogas Plant—An Estimation Method. Energies 2021, 14, 5031. [Google Scholar] [CrossRef]
  89. Theuerl, S.; Klang, J.; Prochnow, A. Process Disturbances in Agricultural Biogas Production—Causes, Mechanisms and Effects on the Biogas Microbiome: A Review. Energies 2019, 12, 365. [Google Scholar] [CrossRef] [Green Version]
  90. Krakat, N.; Demirel, B.; Anjum, R.; Dietz, D. Methods of Ammonia Removal in Anaerobic Digestion: A Review. Water Sci. Technol. 2017, 76, 1925–1938. [Google Scholar] [CrossRef] [PubMed]
  91. Mamun, M.R.A.; Torii, S. Removal of Hydrogen Sulfide (H2S) from Biogas Using Zero-Valent Iron. J. Clean Energy Technol. 2015, 3, 428–432. [Google Scholar] [CrossRef] [Green Version]
  92. Żarczyński, A.; Rosiak, K.; Anielak, P.; Wolf, W. Practical Methods of Cleaning Biogas from Hydrogen Sulphide. Part 1. Application of Solid Sorbents. Acta Innov. 2014, 12, 24–34. [Google Scholar]
  93. Czatzkowska, M.; Harnisz, M.; Korzeniewska, E.; Koniuszewska, I. Inhibitors of the Methane Fermentation Process with Particular Emphasis on the Microbiological Aspect: A Review. Energy Sci. Eng. 2020, 8, 1880–1897. [Google Scholar] [CrossRef] [Green Version]
  94. Tahir, M.S.; Shahzad, K.; Shahid, Z.; Sagir, M.; Rehan, M.; Nizami, A. Producing Methane Enriched Biogas Using Solvent Absorption Method. Chem. Eng. Trans. 2015, 45, 1309–1314. [Google Scholar] [CrossRef]
  95. Choudhury, A.; Shelford, T.; Felton, G.; Gooch, C.; Lansing, S. Evaluation of Hydrogen Sulfide Scrubbing Systems for Anaerobic Digesters on Two U.S. Dairy Farms. Energies 2019, 12, 4605. [Google Scholar] [CrossRef] [Green Version]
  96. Nkosi, B.; Meeske, R.; Ratsaka, M.; Langa, T.; Motiang, M.; Groenewald, I. Effects of Dietary Inclusion of Discarded Cabbage (Brassica Oleracea Var. Capitata) on the Growth Performance of South African Dorper Lambs. S. Afr. J. Anim. Sci. 2016, 46, 35. [Google Scholar] [CrossRef] [Green Version]
  97. Tanongkankit, Y.; Chiewchan, N.; Devahastin, S. Physicochemical Property Changes of Cabbage Outer Leaves upon Preparation into Functional Dietary Fiber Powder. Food Bioprod. Process. 2012, 90, 541–548. [Google Scholar] [CrossRef]
  98. Nilnakara, S.; Chiewchan, N.; Devahastin, S. Production of Antioxidant Dietary Fibre Powder from Cabbage Outer Leaves. Food Bioprod. Process. 2009, 87, 301–307. [Google Scholar] [CrossRef]
  99. Ramos, D.E. Walnut Production Manual; UCANR Publications: Oakland, CA, USA, 1997; ISBN 978-1-879906-27-3. [Google Scholar]
  100. Lyu, F.; Luiz, S.F.; Azeredo, D.R.P.; Cruz, A.G.; Ajlouni, S.; Ranadheera, C.S. Apple Pomace as a Functional and Healthy Ingredient in Food Products: A Review. Processes 2020, 8, 319. [Google Scholar] [CrossRef] [Green Version]
  101. Njokweni, S.G.; Weimer, P.J.; Botes, M.; van Zyl, W.H. Effects of Preservation of Rumen Inoculum on Volatile Fatty Acids Production and the Community Dynamics during Batch Fermentation of Fruit Pomace. Bioresour. Technol. 2021, 321, 124518. [Google Scholar] [CrossRef]
  102. Erinle, T.J.; Adewole, D.I. Fruit Pomaces—Their Nutrient and Bioactive Components, Effects on Growth and Health of Poultry Species, and Possible Optimization Techniques. Anim. Nutr. 2022, 9, 357–377. [Google Scholar] [CrossRef] [PubMed]
  103. Lu, Z.; Ye, F.; Zhou, G.; Gao, R.; Qin, D.; Zhao, G. Micronized Apple Pomace as a Novel Emulsifier for Food O/W Pickering Emulsion. Food Chem. 2020, 330, 127325. [Google Scholar] [CrossRef] [PubMed]
  104. Madrera, R.R.; Bedriñana, R.P.; Valles, B.S. Enhancement of the Nutritional Properties of Apple Pomace by Fermentation with Autochthonous Yeasts. Food Sci. Technol. 2017, 79, 27–33. [Google Scholar] [CrossRef]
  105. Mazurkiewicz, J.; Marczuk, A.; Pochwatka, P.; Kujawa, S. Maize Straw as a Valuable Energetic Material for Biogas Plant Feeding. Materials 2019, 12, 3848. [Google Scholar] [CrossRef] [Green Version]
  106. Przerwa, M. Innovative Methods of Vegetable Storage; Centrum Doradztwa Rolniczego w Brwinowie, Oddział w Radomiu: Radom, Poland, 2015. [Google Scholar]
  107. Watkins, C.B.; Nock, J.F. Production Guide for Storage of Organic Fruits and Vegetables; Department of Horticulture, Cornell University: New York, NY, USA, 2012. [Google Scholar]
  108. Halik, G.D.; Łozicki, A.; Koziorzębska, A.; Dymnicka, M.; Arkuszewska, E. Effect of Ensiling Pumpkin Cucurbita Maxima with the Addition of Inoculant or without It on Chemical Composition and Quality of Silages. Ann. Wars. Univ. Life Sci. SGGW Anim. Sci. 2014, 53, 103–110. [Google Scholar]
  109. Ülger, İ.; Kaliber, M.; Büyükkiliҫ Beyzi, S.; Konca, Y. Possible Ensiling of Pumpkin (Cucurbita pepo) Residues. Turk. J. Vet. Anim. Sci. 2020, 44, 853–859. [Google Scholar] [CrossRef]
  110. Koppelmäki, K.; Helenius, J.; Schulte, R.P.O. Nested Circularity in Food Systems: A Nordic Case Study on Connecting Biomass, Nutrient and Energy Flows from Field Scale to Continent. Resour. Conserv. Recycl. 2021, 164, 105218. [Google Scholar] [CrossRef]
  111. Camargo, G.G.T.; Ryan, M.R.; Richard, T.L. Energy Use and Greenhouse Gas Emissions from Crop Production Using the Farm Energy Analysis Tool. BioScience 2013, 63, 263–273. [Google Scholar] [CrossRef] [Green Version]
  112. Holka, M.; Bieńkowski, J. Carbon Footprint and Life-Cycle Costs of Maize Production in Conventional and Non-Inversion Tillage Systems. Agronomy 2020, 10, 1877. [Google Scholar] [CrossRef]
  113. Walkowska, K. Energy Consumption in Households in 2018; Statistics Poland, Enterprises Department, Zakład Wydawnictw Statystycznych: Warsaw, Poland, 2019. Available online: https://stat.gov.pl/en/topics/environment-energy/energy/energyconsumption-in-households-in-2018,2,5.html (accessed on 8 June 2022).
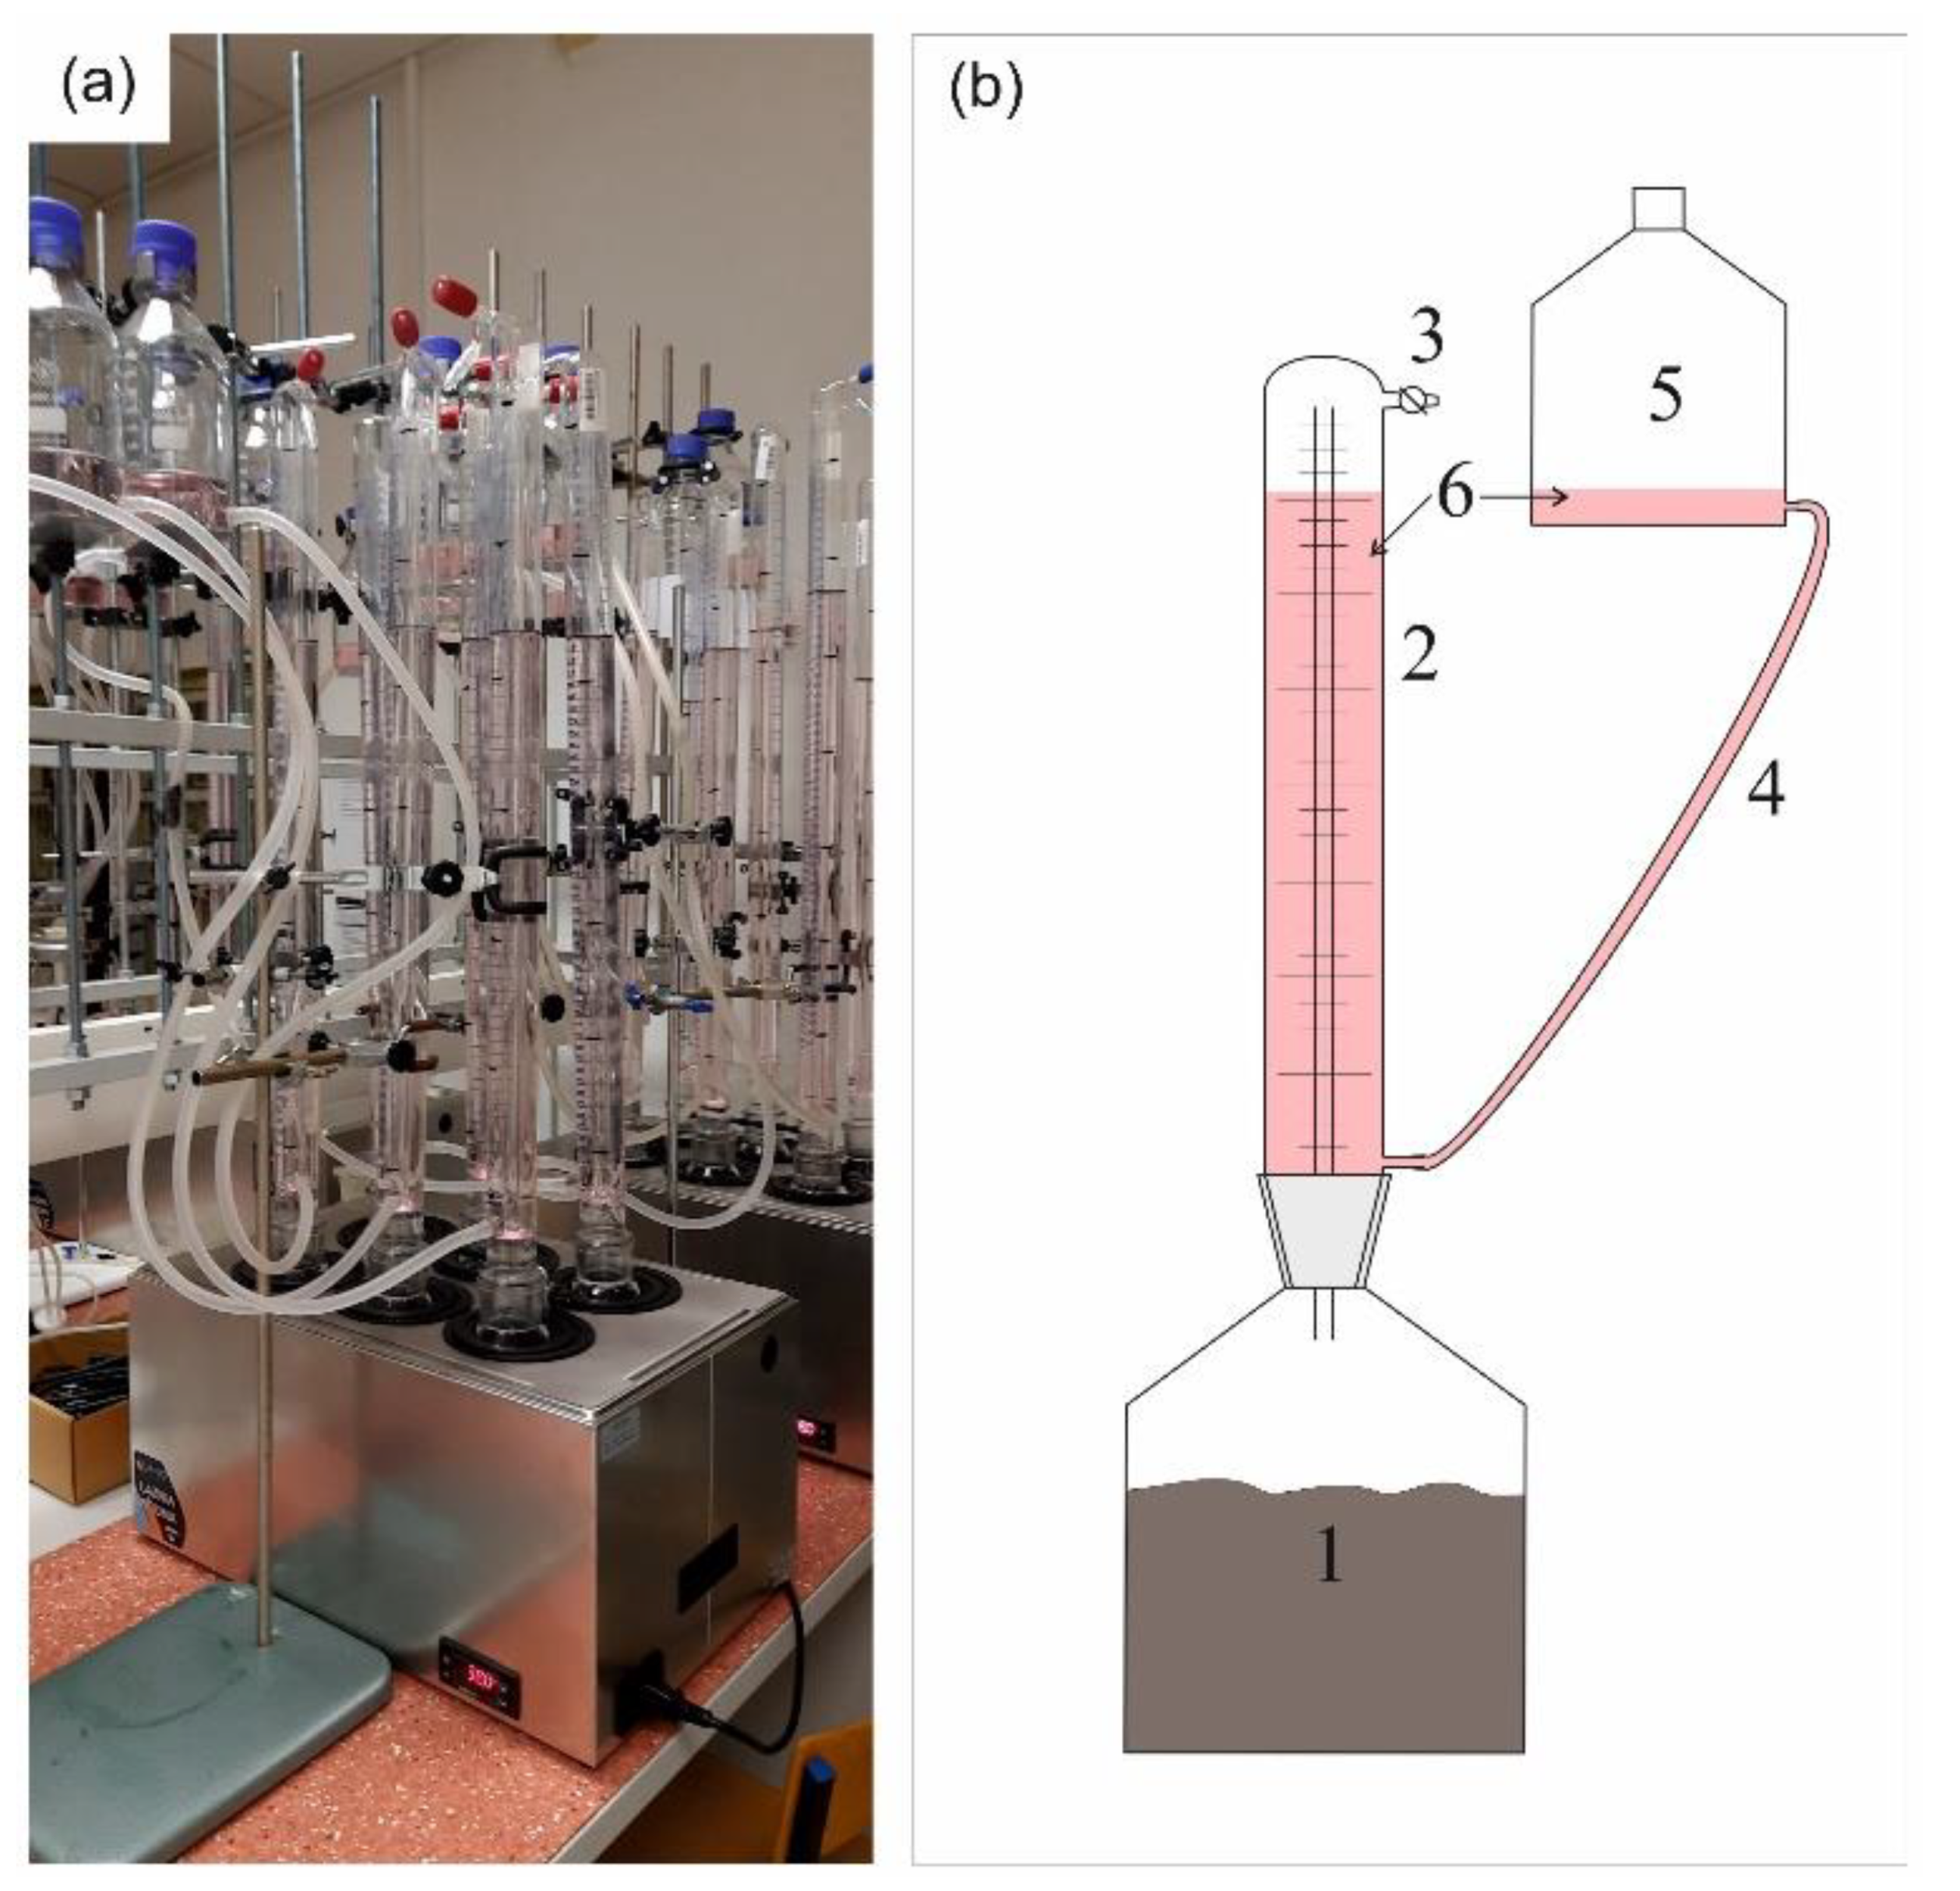
Figure 1. The BMP experiment (a) eudiometer sets in water bath; (b) the eudiometer set: 1—glass bottle (reactor) with mixture of inoculum and substrate, 2—the eudiometer with internal glass tube for gas transport, 3—valve for gas sampling, 4—connecting tube, 5—pressure compensation reservoir, 6—confining liquid.
Applsci 12 06128 g001
Figure 2. Daily methane production of four fruit and vegetable residues. Standard errors are shown as vertical bars.
Applsci 12 06128 g002
Figure 3. Cumulative methane production of four fruit and vegetable residues. Standard errors are shown as vertical bars. The yellow squares and green diamonds mean T50 and T95, respectively.
Applsci 12 06128 g003
Figure 4. Concentration of the ammonia in biogas produced from four fruit and vegetable residues.
Applsci 12 06128 g004
Figure 5. Concentration of hydrogen sulphide in biogas produced from four fruit and vegetable residues.
Applsci 12 06128 g005
Table 1. Chemical composition of inoculum and residues.
InoculumApple PomacePumpkin ResidueWalnut HusksCabbage Leaves
Total solids (TS),%4.52 ± 0.03 a*19.41 ± 0.01 b6.13 ± 1.33 ac14.54 ± 1.09 d7.45 ± 0.85 c
Volatile solids (VS), %TS74.53 ± 0.01 a98.75 ± 0.36 b85.74 ± 2.18 c89.11 ± 1.09 d90.31 ± 2.40 d
Total Kjeldahl nitrogen (TKN), g kgDM−129.45 ± 4.84 a9.16 ± 3.82 b31.00 ± 6.43 a8.26 ± 0.04 b26.05 ± 0.88 a
Total phosphorus (TP), g kgDM−112.37 ± 0.18 a0.92 ± 0.01 b4.76 ± 0.95 c0.62 ± 0.05 b4.12 ± 0.36 c
Total potassium (K), g kgDM−160.54 ± 188 a6.69 ± 0.07 b57.12 ± 4.27 a41.36 ± 5.03 c27.51 ± 0.26 d
Total organic carbon (TOC), g kgDM−1410.78 ± 2.19 a432.77 ± 5.24 b425.26 ± 1.28 ba442.15 ± 0.97 b426.27 ± 21.44 ba
C:N1447145416
N:P2107136
* Lowercase letters—statistical differences at p < 0.05 among residues and inoculum.
Table 2. Methane production (NL kgVS−1) and lag phase (days) of studied residues during 30 days of the experiment.
ResiduesMethane ProductionMaximum of Daily Methane ProductionLag Phase
Cabbage leaves297.81 ± 0.6522.05 ± 2.564.31 ± 0.68
Apple pomace232.20 ± 6.8826.83 ± 7.004.18 ± 0.11
Pumpkin residue199.18 ± 12.4530.18 ± 3.044.01 ± 0.13
Walnut husks131.07 ± 1.3012.98 ± 1.383.87 ± 0.06
Table 3. Energy generation in anaerobic digestion of studied residues calculated based on the BMP results.
ResiduesElectricityHeatElectricityHeat
kWh tVS−1GJ tVS−1kWh ha−1GJ ha−1
Cabbage leaves944.35 ± 2.062.96 ± 0.01594.94 ± 1.301.86 ± 0.004
Apple pomace736.32 ± 21.822.31 ± 0.071060.30 ± 31.423.32 ± 1.09
Pumpkin residue631.58 ± 39.491.98 ± 0.12284.21 ± 17.770.89 ± 0.06
Walnut husks415.62 ± 4.131.30 ± 0.0162.34 ± 0.620.20 ± 0.002
Maize sillage1093.993.4314,703.2346.07
Table 4. The GHG reduction due to maize silage replacement with FVR in biogas production.
ResiduesCultivated Area of Crops in PolandMaize Field Area Equivalent to 1 ha of CropsMaize Field Area Equivalent to Area of Crop Cultivation in PolandReduction in GHG Emissions Resulting from the Use of Waste for Biogas Production
[ha][ha][ha][t CO2]
Cabbage leaves14,5990.0415982106
Apple pomace161,9480.07211,66041,066
Pumpkin residue67000.020134472
Walnut husks27000.0041138
Publisher’s Note: MDPI stays neutral with regard to jurisdictional claims in published maps and institutional affiliations.