The Influence of the Quality of Digital Elevation Data on the Modelling of Terrain Vehicle Movement
Abstract
:1. Introduction
2. Materials and Methods
2.1. Utilised Methods
2.2. Selected Digital Elevation Models
2.3. Selection of Areas for Testing
2.4. Selection of Vehicles for Testing
- Off-road light vehicle—Land Rover DEFENDER 110 (LRD 110);
- Wheeled truck—TATRA T815 6 × 6 (T815);
- Infantry armoured tracked vehicle—Bojové vozidlo pěchoty 2 (BVP-2).
3. Results
3.1. Comparison of the Accuracy of Slopes Derived from Digital Terrain Models
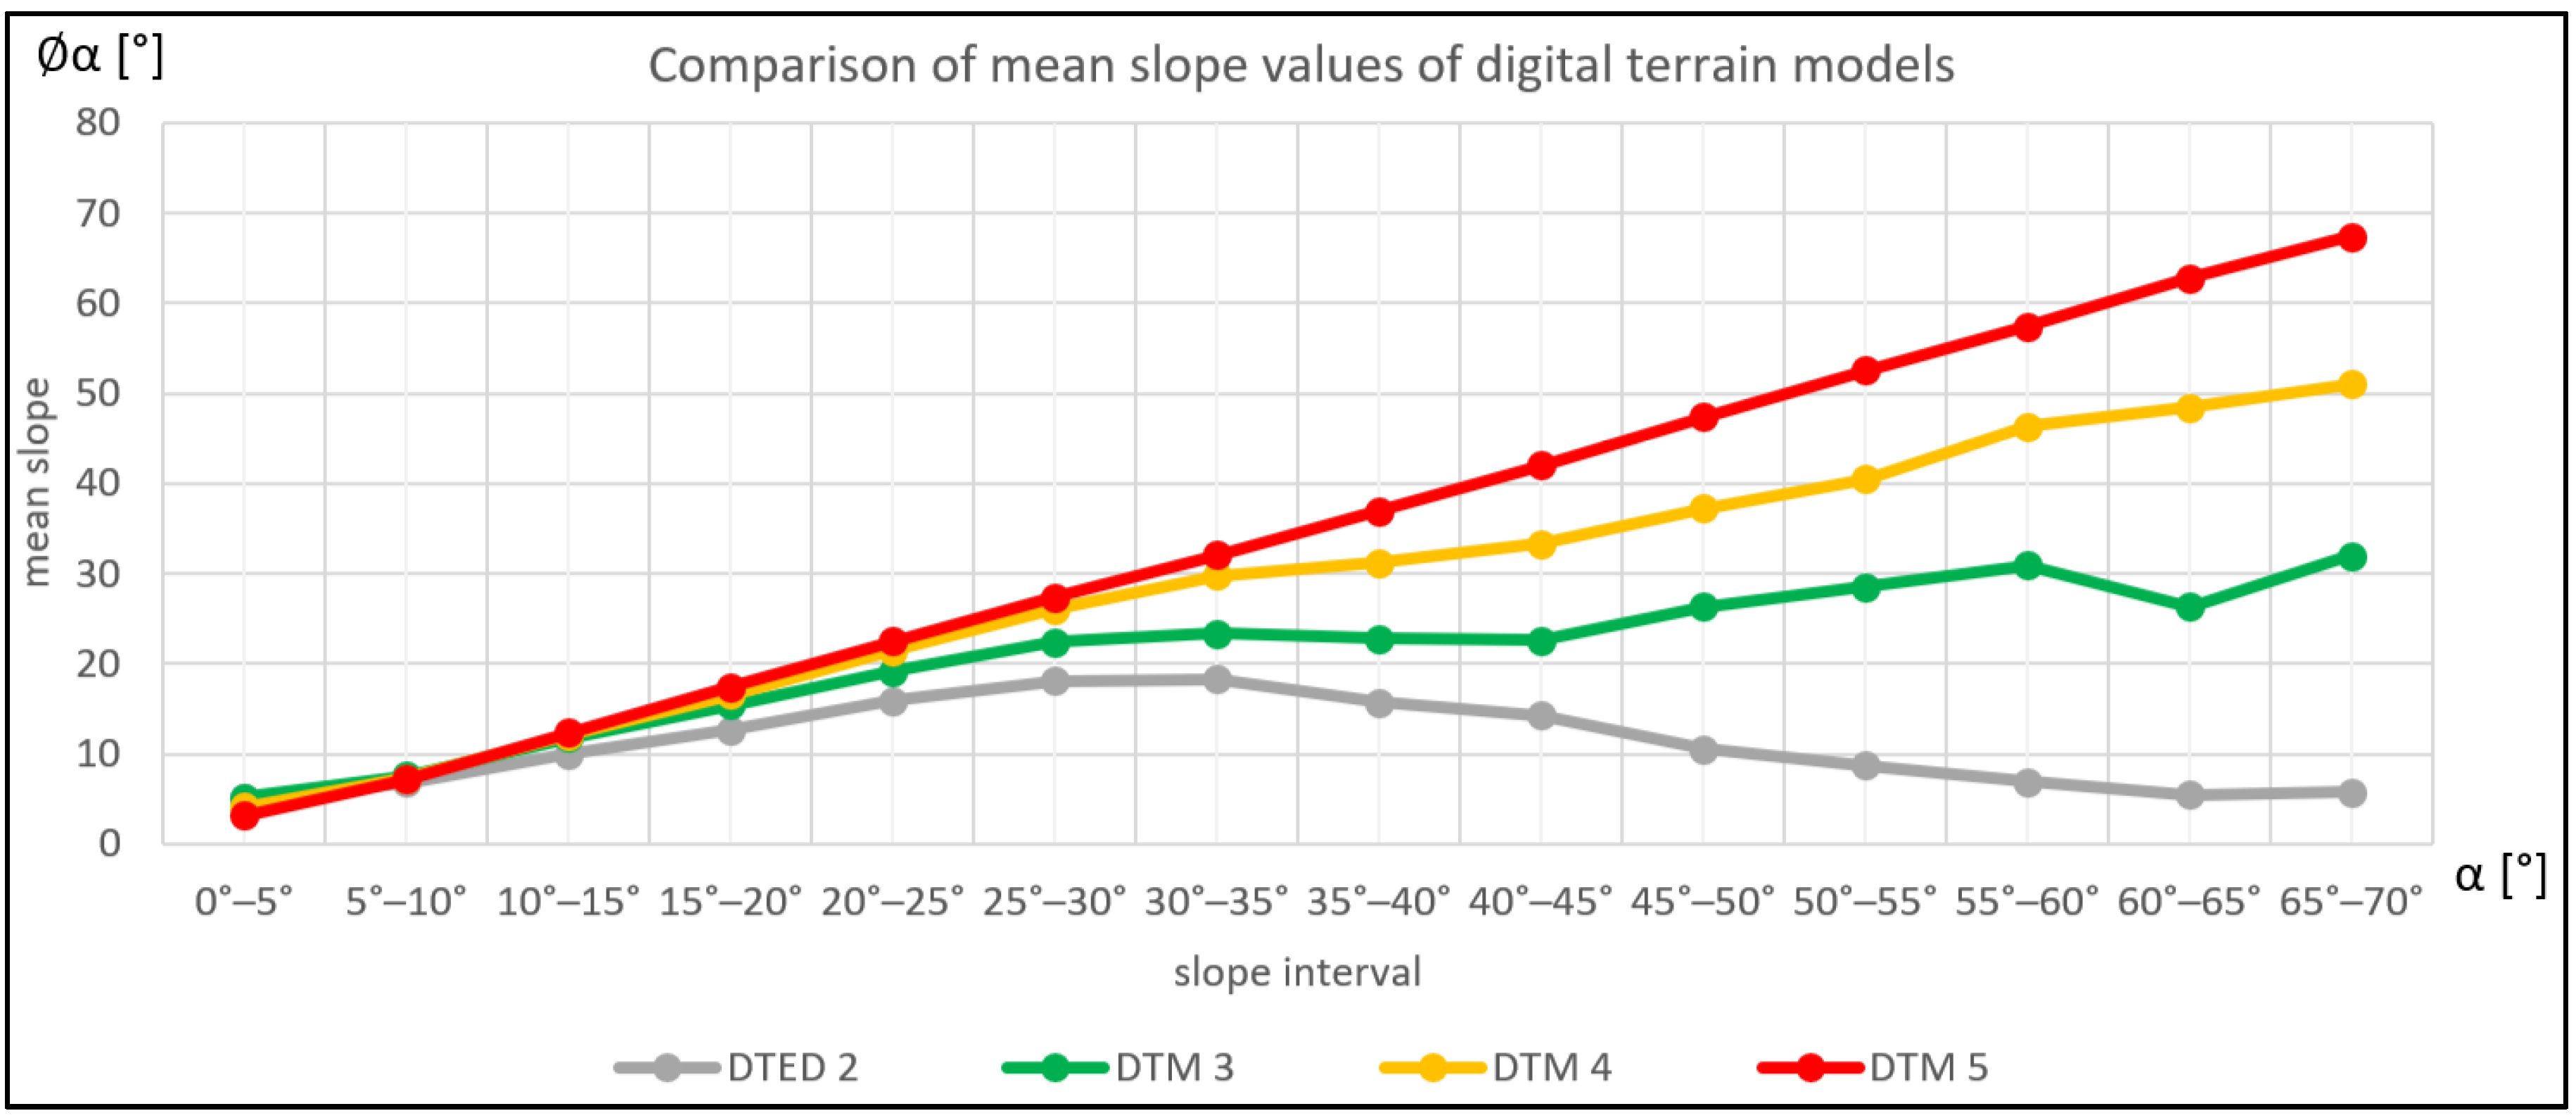
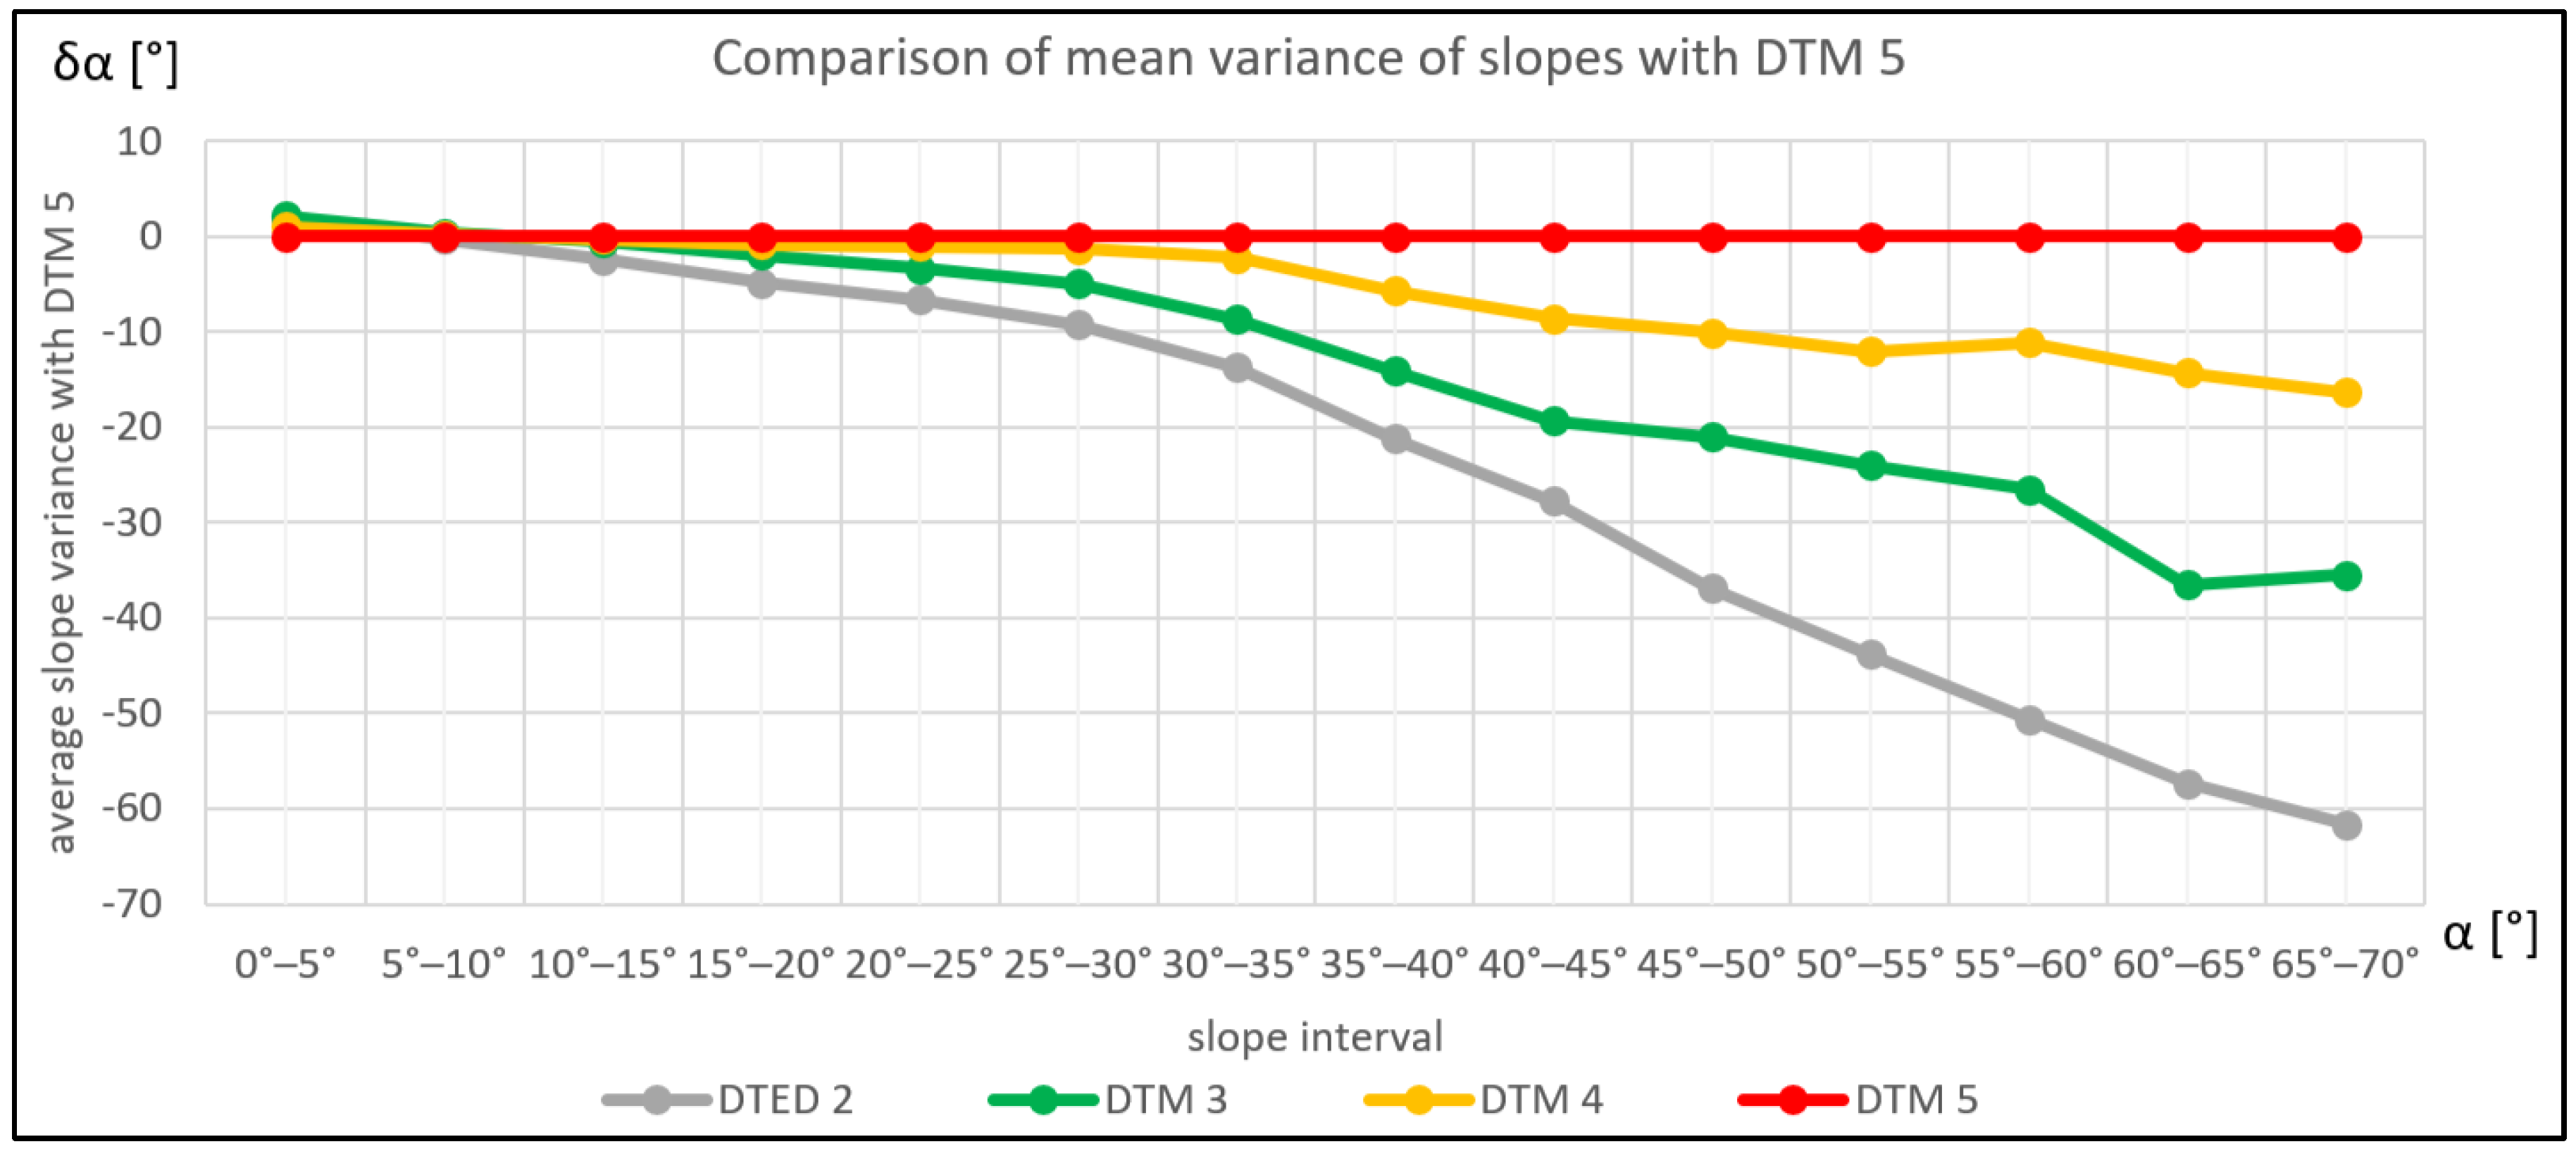
- Low-detail elevation models did not differ from high-detail ones for lower slope values (slope values were very similar). The basic threshold was up to 10° for lower-detailed models (10–30 m) and up to 30° for medium-detailed models (5 m).
- Slopes up to 5°—The average slope value was higher in all tested models than in DTM 5. More detailed terrain models (DTM 5) had a more gradual slope in the lowest class. This inversed effect was specifically found in the flat areas only.
- Slopes 5–10°—The average values of slopes were very close for all models and the standard deviations were not very high either. It is possible to use less-detailed models in terrain analyses for slopes up to 10°.
- Slopes 10–30°—Almost a linear increase in slope could be observed depending on the resolution of a model. The average deviations with DTM 5 also had a linear increase. The more detailed the model, the greater the proportion of higher slopes. This slope class was still relatively reliable in all models (except DTED 2).
- Slopes above 30°—The comparative graphs deviated from the trend of the curves due to a smaller number of values, especially above 40° (see Figure 4).
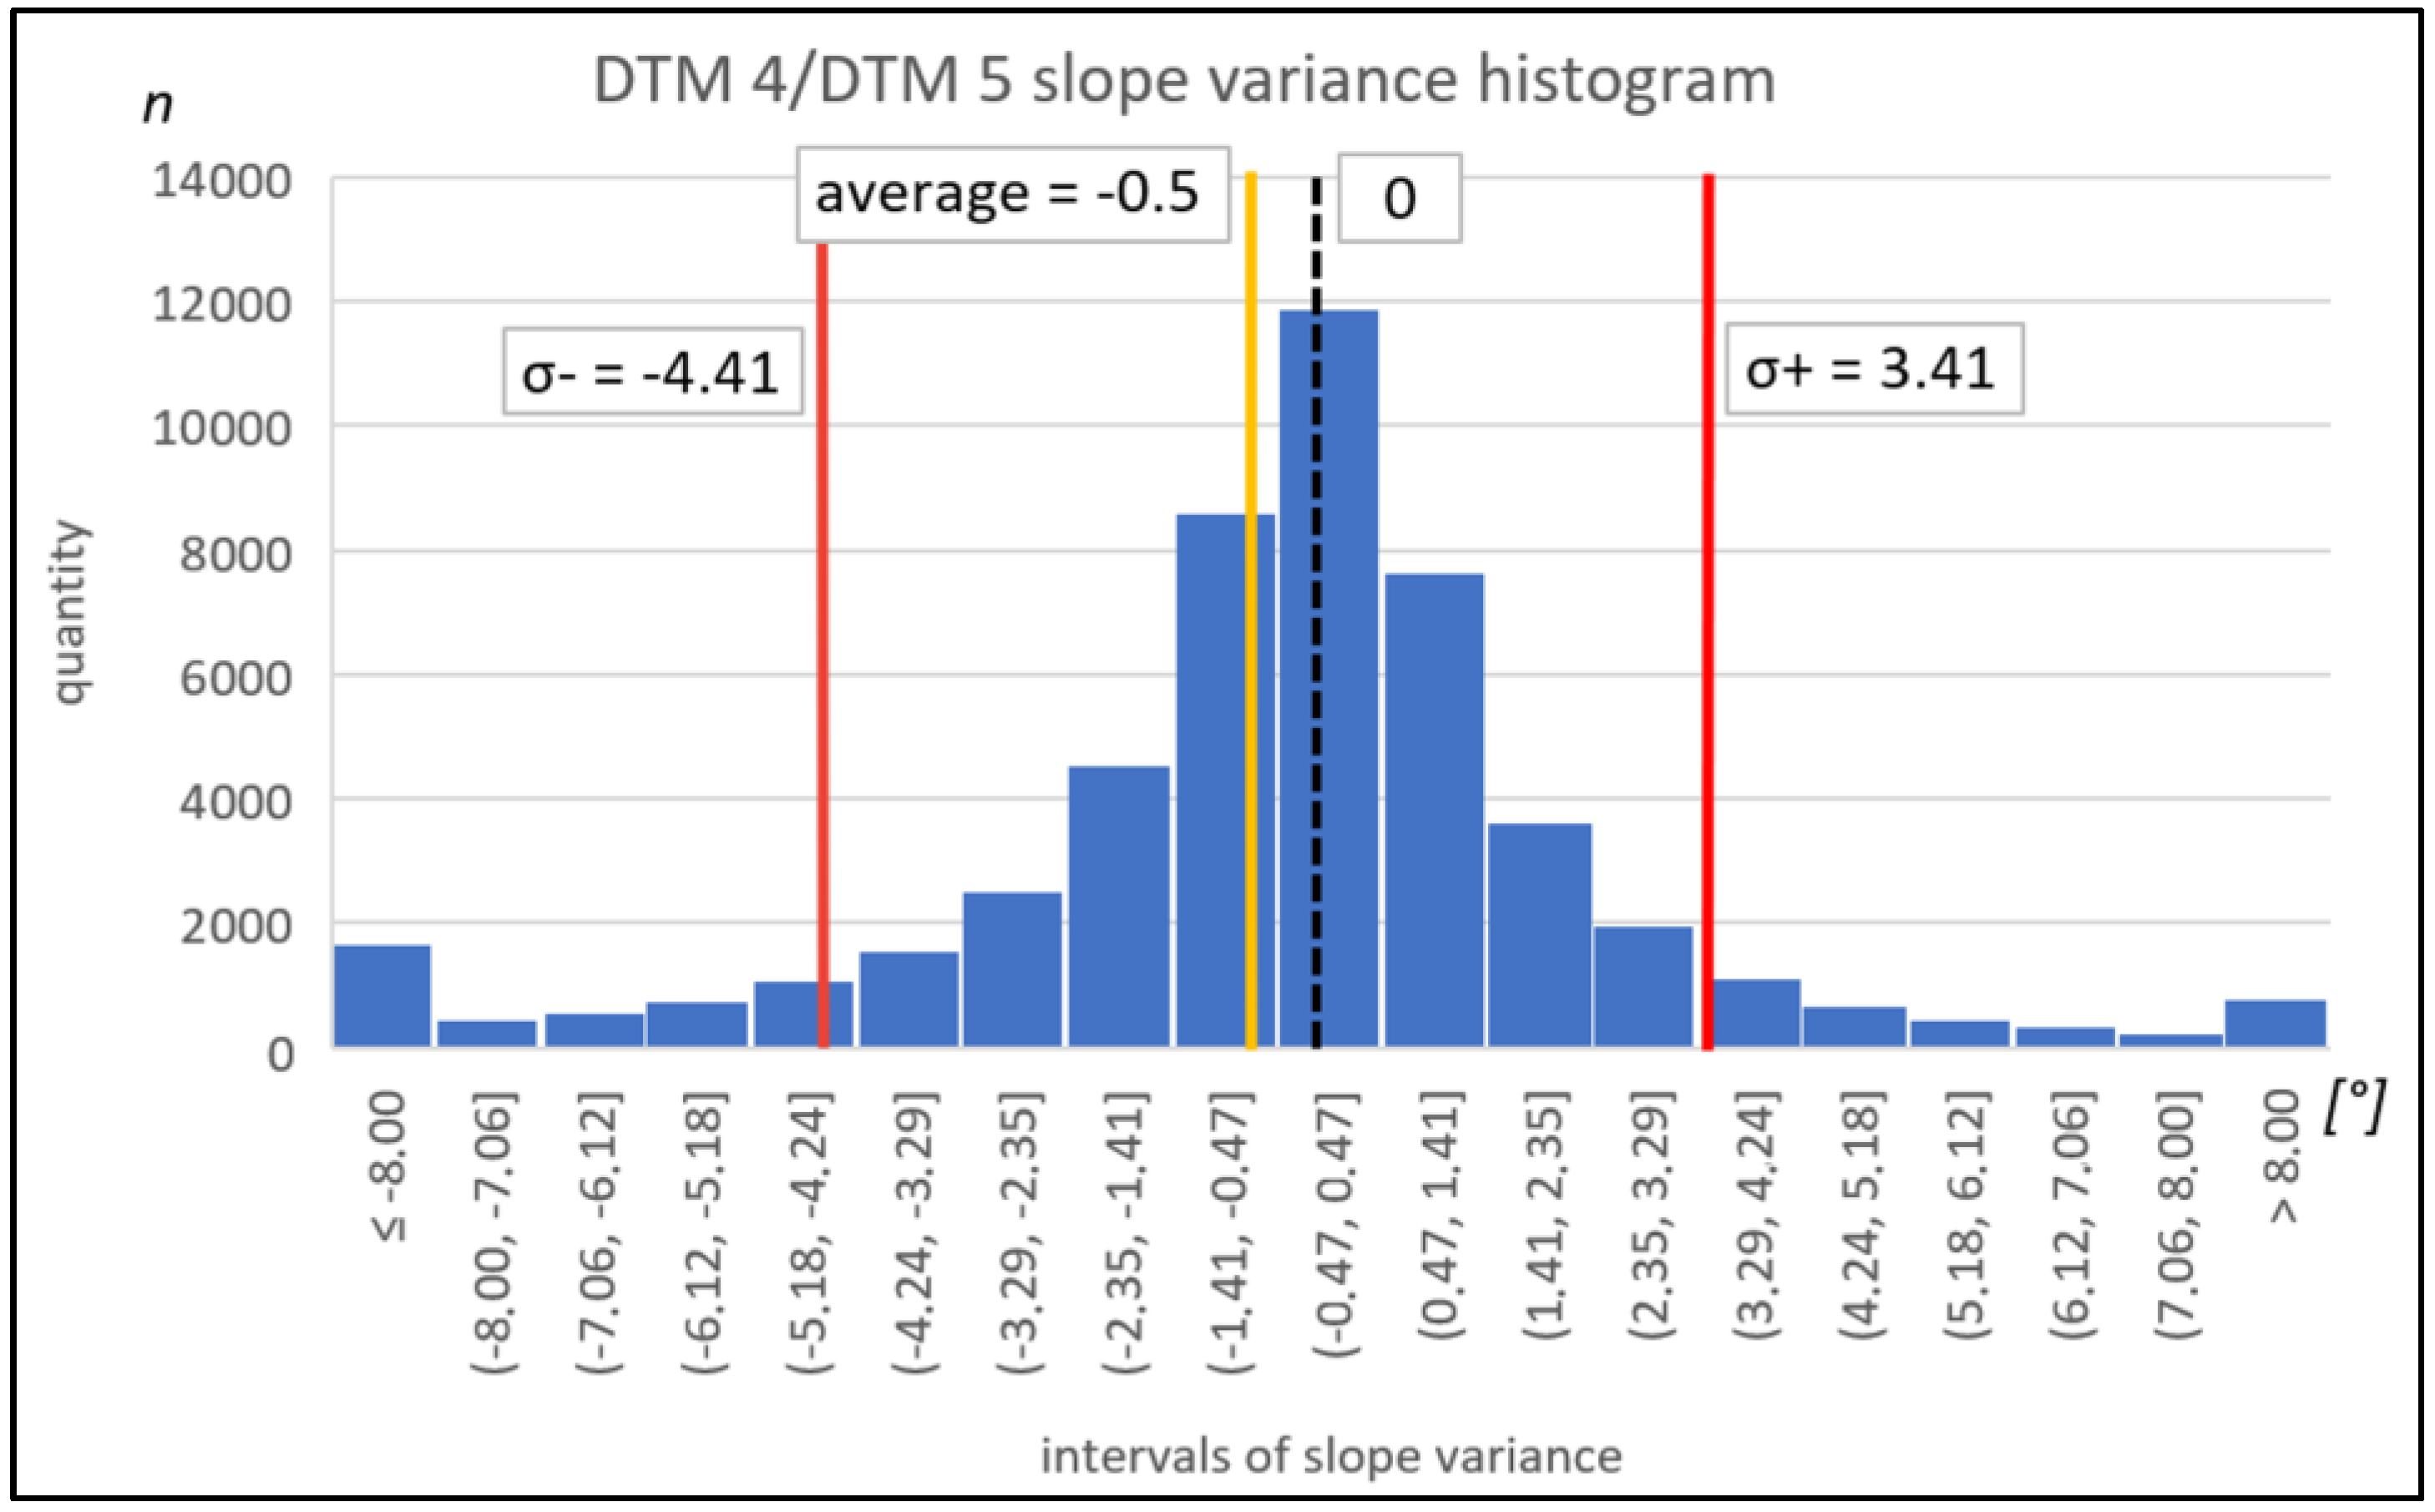
- The less detailed the model, the bigger the deviation of the average slope and the bigger the variance in the standard deviation.
- The 5 m × 5 m models (DTM 4)—Achieved small deviations below 1° for slopes up to 20°. For bigger slopes, especially above 40°, the slope was almost less than one-third lower than in DTM 5. DTM 4 was suitable for slopes up to 20°, the use is not recommended for slopes above 40°.
- The 10 m × 10 m models (DTM 3)—Achieved small deviations below 1° for slopes up to 15°, and at 30°, the slope exceeded the limit of one-third of the slope difference compared to DTM 5. DTM 3 was suitable for slopes up to 15°; for slopes above 30°, it is not recommended.
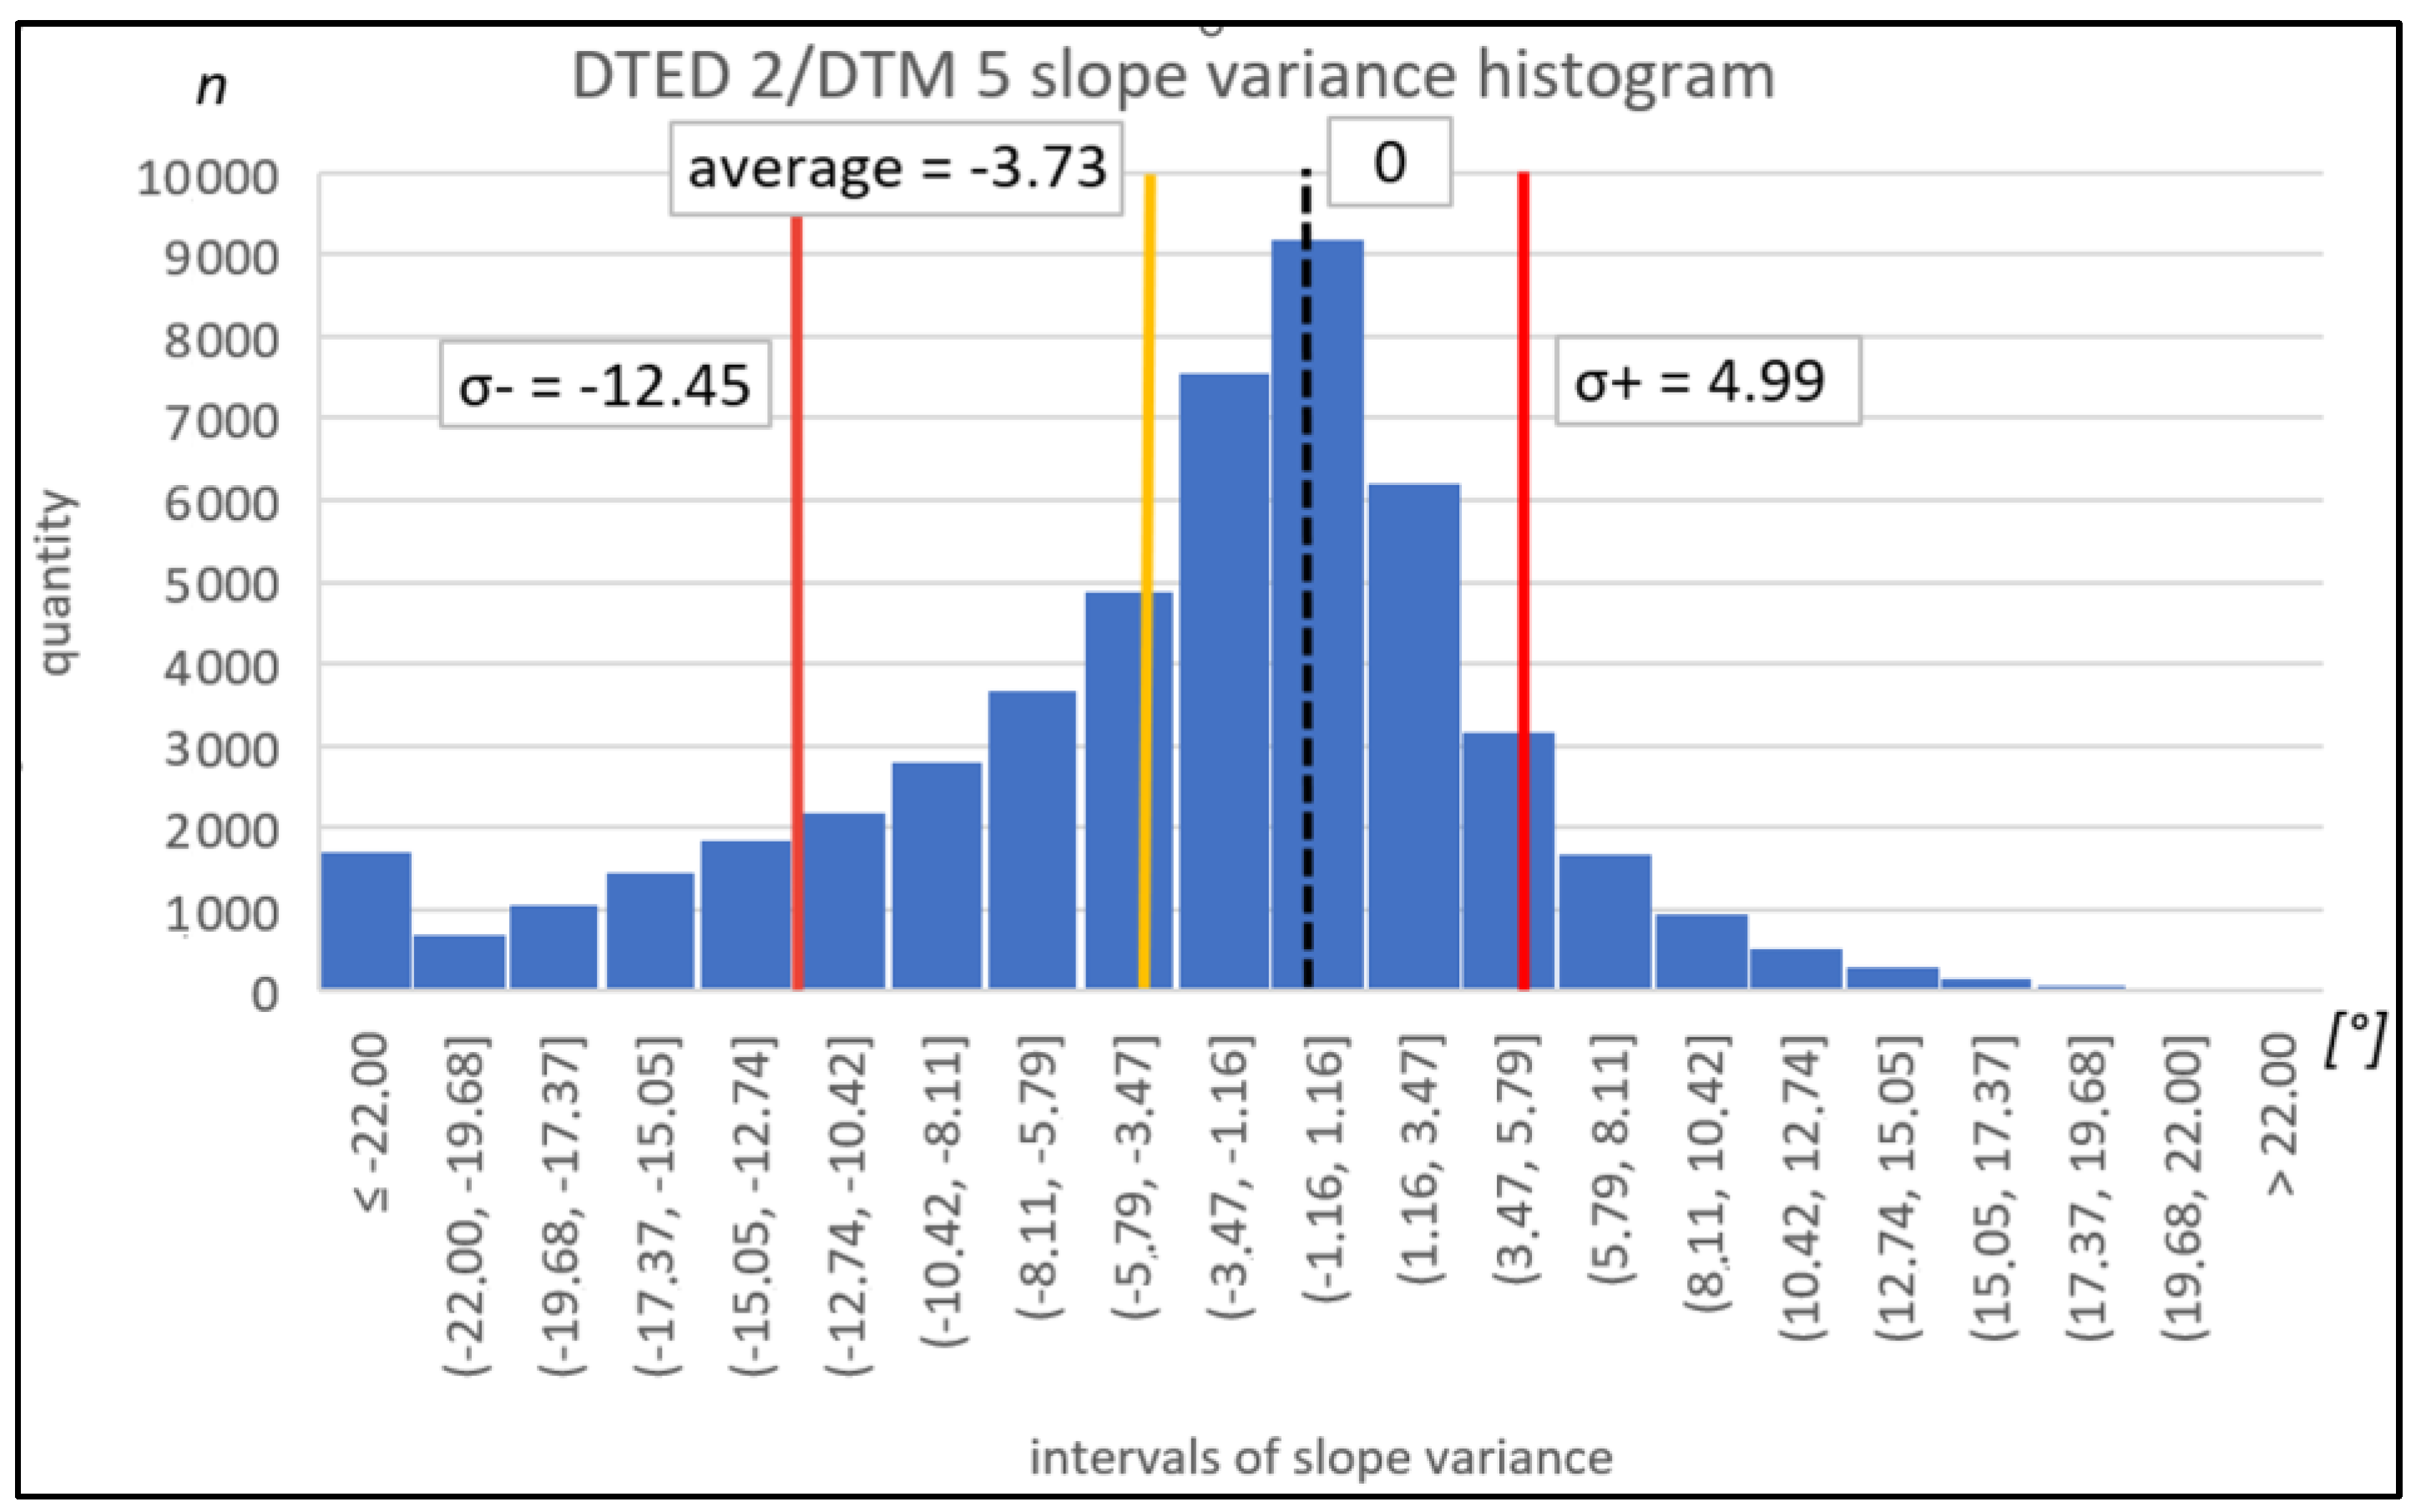
- The 30 m × 30 m models (DTED 2)—They differed from DTM 5 by 1° already after 10° of slope inclination; from this value, the difference in inclination compared to DTM 5 was lower by more than one-third. Areas with inclinations above 50° in DTM 5 had less than 10° in DTED 2. The detail of the DTED 2 network of 30 m × 30 m points did not allow for identifying a more fragmented terrain relief. DTED 2 could only be used to determine slopes up to 10°.
3.2. Comparison of the Accuracy of Digital Terrain Models Using Raster Passability Analysis
- 1.
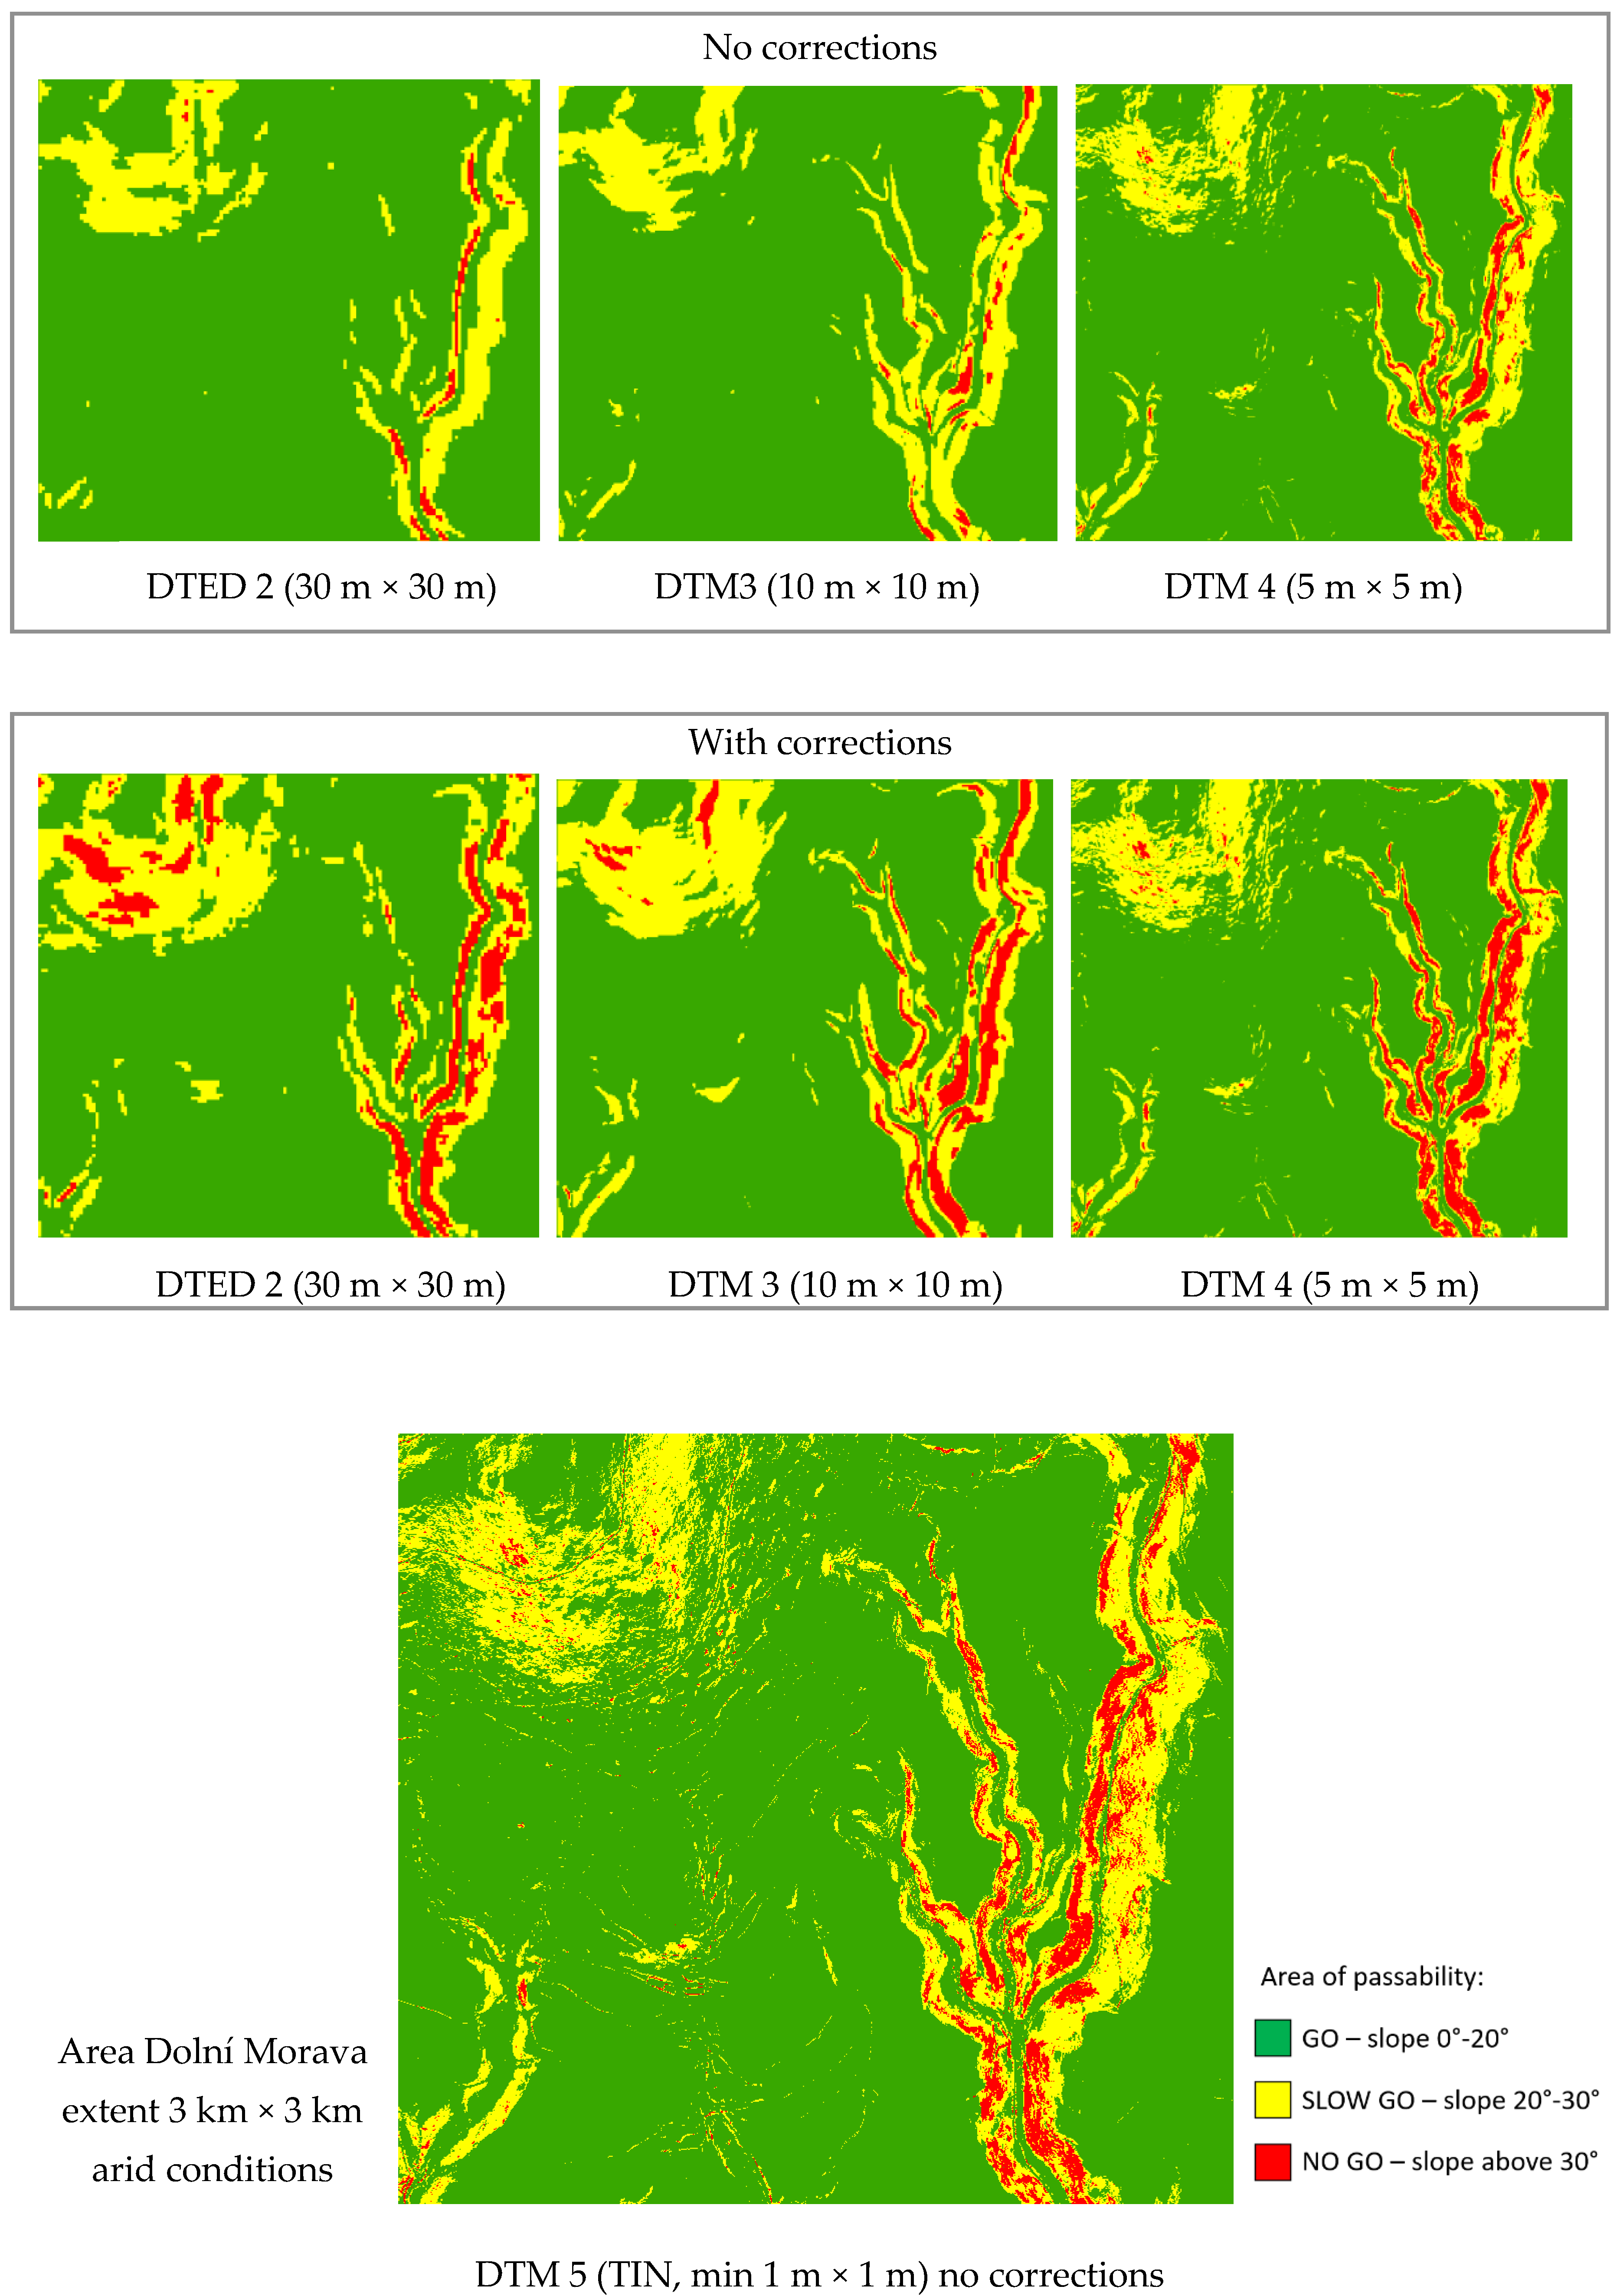
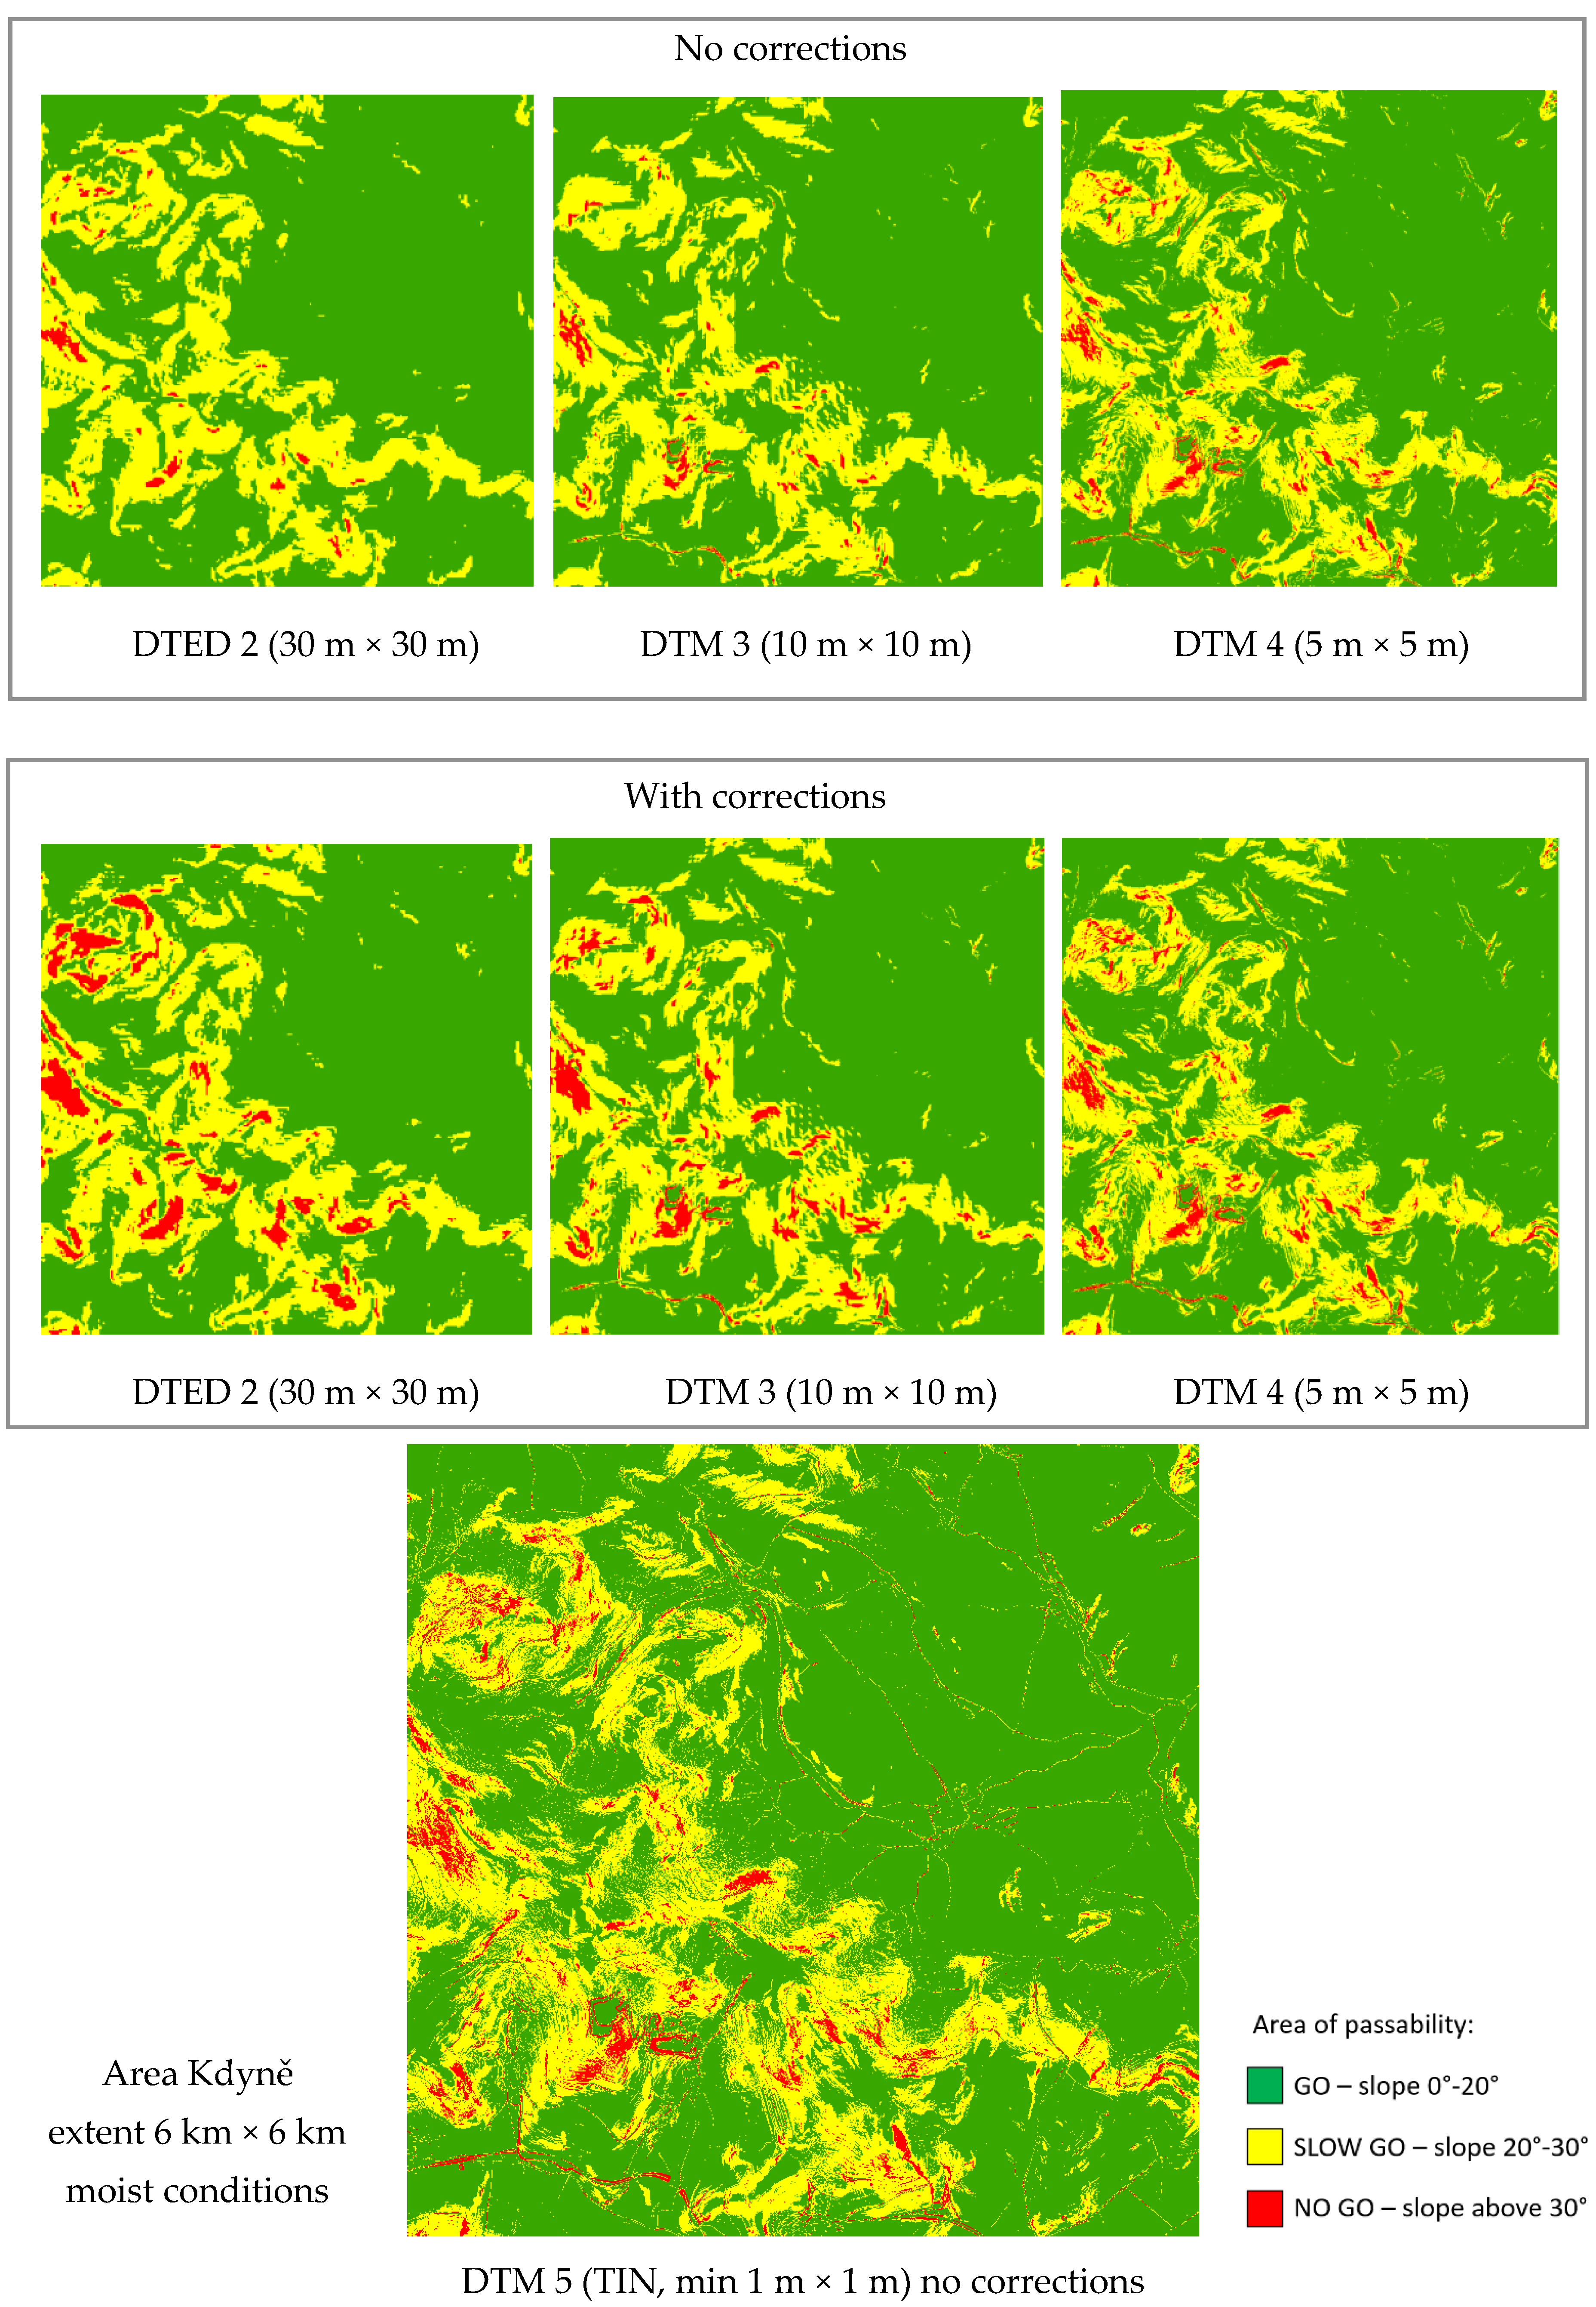
- Deviations in passable area (GO):
- The more detailed the model of terrain, the smaller the passable area.
- The passable area of 851 ha (out of a total of 900 ha of one 3 km × 3 km area) in DTM 5 represented
- ○
- 860 ha in DTM 4 (1% larger passable area);
- ○
- 870 ha in DTM 3 (2% larger passable area);
- ○
- 880 ha in DTED 2 (3% larger passable area).
- These ratios may significantly vary in different types of landscape (mountains) or surface conditions (impassable soils) but have the same trend.
- 2.
- Deviations in the hardly passable area (SLOW GO):
- The position and structure of hardly passable area remained unchanged in all models.
- 3.
- Deviations in the impassable area (NO GO):
- The total area of impassable territory increased with the detail of a used model.
- The impassable area in DTM 5 (15 ha) represented
- ○
- 75% of the area in DTM 4 (12 ha);
- ○
- 33% of the area in DTM 3 (5 ha);
- ○
- 20% of the area in DTED 2 (3 ha).
- 4.
- Influence of other factors on the deviation of the passable area:
- The better the passability conditions, the smaller the area deviation when using less accurate relief models (see Table 4); this applied to the following conditions:
- ○
- lower soil moisture;
- ○
- more suitable soil types (clayey-sandy);
- ○
- more powerful vehicles (suitable for cross-country movement).
- 5.
- Evaluation of digital terrain models:
- The 1 m × 1 m models (DTM 5):
- ○
- The accurate model was suitable for detailed CCM analysis.
- The 5 m × 5 m models (DTM 4):
- ○
- The deviation of the area of the passable terrain was small;
- ○
- DTM 5 was more suitable for fragmented terrain in detailed CCM analyses.
- The 10 m × 10 m models (DTM 3):
- ○
- The impassable area was not usually displayed in flat territories in these models (steeper slopes with shorter lengths);
- ○
- The area of the impassable territory was close to DTM 5 in mountainous areas with long slopes;
- ○
- The model could be used for less detailed CCM analyses.
- The 30 m × 30 m models (DTED 2):
- ○
- The impassable area was not usually displayed in flat areas in these models;
- ○
- The impassable area was close to DTM 5 in mountainous areas with long slopes;
- ○
- Reliable results of CCM analysis could not be achieved with DTED 2.
3.3. Efficiency Improvements of the Elevation Models
4. Discussion
4.1. Evaluation of Digital Terrain Models
4.2. Usability of Soil Databases in CCM Analyses
4.3. Recommendations for Improvements of Elevation Models
5. Conclusions
Author Contributions
Funding
Institutional Review Board Statement
Informed Consent Statement
Data Availability Statement
Acknowledgments
Conflicts of Interest
References
- Muzirafuti, A.; Boualoul, M.; Barreca, G.; Allaoui, A.; Bouikbane, H.; Lanza, S.; Crupi, A.; Randazzo, G. Fusion of Remote Sensing and Applied Geophysics for Sinkholes Identification in Tabular Middle Atlas of Morocco (the Causse of El Hajeb): Impact on the Protection of Water Resource. Resources 2020, 9, 51. [Google Scholar] [CrossRef]
- Muzirafuti, A.; Cascio, M.; Lanza, S. UAV Photogrammetry-based Mapping the Pocket Beach of Isola Bella, Taormina (Northeastern Sicily). In Proceedings of the 2021 IEEE International Workshop on Metrology for the Sea (MetroSea 2021), Reggio Calabria, Italy, 4–6 October 2021. [Google Scholar]
- Melis, M.T.; Pisani, L.; De Waele, J. On the Use of Tri-Stereo Pleiades Images for the Morphometric Measurement of Dolines in the Basaltic Plateau of Azrou (Middle Atlas, Morocco). Remote Sens. 2021, 13, 4087. [Google Scholar] [CrossRef]
- Hubacek, M.; Kratochvil, V.; Zerzan, P.; Ceplova, L.; Brenova, M. Accuracy of the new generation elevation models. In Proceedings of the International Conference on Military Technologies (ICMT), IEEE, Brno, Czech Republic, 19–21 May 2015; pp. 1–6. [Google Scholar]
- Braun, T.; Bitsch, H.; Berns, K. Visual terrain traversability estimation using a combined slope/elevation model. In Proceedings of the IEEE/RSJ International Conference on Intelligent Robots and System, Berlin, Germany, 22–26 September 2008; pp. 177–184. [Google Scholar]
- Hirt, C. Digital terrain models. In Encyclopedia of Geodesy; Springer: Berlin/Heidelberg, Germany, 2016. [Google Scholar] [CrossRef]
- Qiming, Z.; Xuejun, L. Assessing uncertainties in derived slope and aspect from a grid DEM. In Advances in Digital Terrain Analysis; Springer: Berlin/Heidelberg, Germany, 2008; pp. 279–306. [Google Scholar]
- Belka, L. TREx—New international project for creation of elevation data. Mil. Geogr. Rev. 2015, 58, 9–11. [Google Scholar]
- DLR. Global 3D Elevation Model of the Mission TanDEM-X Widely Available; Deutsches Zentrum für Luft und Raumfahrt: Kölle, Germany, 2018; Available online: https://www.dlr.de/content/de/artikel/news/2018/4/20181008_3d-hoehenmodell-tandem-x-mission.html (accessed on 20 December 2021).
- Zhang, K.; Chen, S.C.; Whitman, D.; Shyu, M.L.; Yan, J.; Zhang, C. A progressive morphological filter for removing nonground measurements from airborne LIDAR data. IEEE Trans. Geosci. Remote Sens. 2003, 41, 872–882. [Google Scholar] [CrossRef] [Green Version]
- Bortl, D. Looking Back on the Action of Geospatial Military Specialists in the Province Reconstruction Team. Mil. Geogr. Rev. 2014, 1, 3–8. [Google Scholar]
- Bradbury, M.; Dasch, J.; Gonzalez-Sanchez, R.; Hodges, H.; Iagnemma, K.; Jain, A.; Jayakumar, P.; Letherwood, M.; McCullough, M.; Priddy, J.; et al. Next-Generation NATO Reference Mobility Model (NRMM) Development (Développement de la Nouvelle Génération du Modèle de Mobilité de Référence de l’OTAN (NRMM)); NATO Science and Technology Organization: Neuilly-Sur-Seine, France, 2018. [Google Scholar]
- McCullough, M.; Jayakumar, P.; Dasch, J.; Gorsich, D. The next generation NATO reference mobility model development. J. Terramech. 2017, 73, 49–60. [Google Scholar] [CrossRef]
- Gorsich, D.; Gerth, R.; Bradley, S.; Letherwood, M. An Overview of the Next-Generation NATO Reference Mobility Model (NG-NRMM) Cooperative Demonstration of Technology (CDT). In Proceedings of the 2019 NDIA Ground Vehicle Systems Engineering and Technology Symposium, Novi, MI, USA, 13–15 August 2019. [Google Scholar]
- Wong, J.Y.; Jayakumar, P.; Toma, E.; Preston-Thomas, J. Comparison of simulation models NRMM and NTVPM for assessing military tracked vehicle cross-country performance. J. Terramech. 2018, 80, 31–48. [Google Scholar] [CrossRef]
- Rada, J. Analysis of Geospatial Data Used in Cross-Country Mobility Modelling. Dissertation Thesis, University of Defence, Brno, Czech Republic, 2021; p. 206. [Google Scholar]
- NATO. The Area of Responsibility. NATO Declassified. 23 February 2013. Available online: https://www.nato.int/ebookshop/video/declassified/en/encyclopedia (accessed on 20 December 2021).
- NSO. AJP-3.17 Allied Joint Doctrine For Geospatial Support Edition B Version 1 WD 1.0; NATO Standardization Office: Brussels, Belgium, 2022. [Google Scholar]
- Hubacek, M.; Almasiova, L.; Brenova, M.; Bures, M.; Mertova, E. Assessing quality of soil maps and possibilities of their use for computing vehicle mobility. In Proceedings of the 23rd Central European Conference, Brno, Czech Republic, 8–9 January 2016; pp. 99–110. [Google Scholar]
- Hubacek, M.; Kovarik, V.; Talhofer, V.; Rybansky, M.; Hofmann, A.; Brenova, M.; Ceplova, L. Modelling of geographic and meteorological effects on vehicle movement in the open terrain. Cent. Eur. Area View Curr. Geogr. 2016, 11, 149–159. [Google Scholar]
- Rybansky, M. Determination the ability of military vehicles to override vegetation. J. Terramech. 2020, 91, 129–138. [Google Scholar] [CrossRef]
- Capek, J.; Zerzan, P.; Simkova, K. Influence of tree spacing on vehicle manoeuvers in forests. In Proceedings of the 7th International Conference on Military Technologies, ICMT 2019, Brno, Czech Republic, 30–31 May 2019. [Google Scholar]
- Rada, J.; Rybansky, M.; Dohnal, F. Influence of Quality of Remote Sensing Data on Vegetation Passability by Terrain Vehicles. ISPRS Int. J. Geo-Inf. 2020, 9, 684. [Google Scholar] [CrossRef]
- Dohnal, F.; Hubacek, M.; Sturcova, M.; Bures, M.; Simkova, K. Identification of microrelief shapes along the line objects over DEM data and assessing their impact on the vehicle movement. In Proceedings of the 2017 International Conference on Military Technologies (ICMT), Brno, Czech Republic, 31 May–2 June 2017; pp. 262–267. [Google Scholar] [CrossRef]
- Dohnal, F.; Hubacek, M.; Simkova, K. Detection of microrelief objects to impede the movement of vehicles in terrain. ISPRS Int. J. Geo Inf. 2019, 8, 101. [Google Scholar] [CrossRef] [Green Version]
- Talhofer, V.; Bures, M. The Solution of the Mobility Model Using the Database of Roads and Terrain Relief. In GIS Ostrava 2018 GIS for Support of Security and Crisis Management; Technical University of Ostrava: Ostrava, Czech Republic, 2018; ISBN 978-80-248-4166-3. [Google Scholar]
- Talhofer, V.; Rybansky, M.; Bureš, M.; Šimková, K. The Influence of Spatial Database Quality on Modelling of Vehicle Movement in Terrain. In Proceedings of the 19th International & 14th European-African Regional Conference of the International Society for Terrain-Vehicle Systems, Budapest, Hungary, 25–27 September 2017; pp. 1–15, ISBN 978-1-942112-49-5. [Google Scholar]
- Rybansky, M. The Cross-Country Movement—The Impact and Evaluation of Geographic Factors; CERM: Brno, Czech Republic, 2009; p. 113. ISBN 978-80-7204-661-4. [Google Scholar]
- Rybansky, M.; Hofmann, A.; Hubacek, M.; Kovarik, V.; Talhofer, V. Modelling of cross-country transport in raster format. Environ. Earth Sci. 2015, 74, 7049–7058. [Google Scholar] [CrossRef] [Green Version]
- Talhofer, V.; Hoskova-Mayerova, S.; Hofmann, A. Quality of Spatial Data in Command and Control System. In Studies in Systems, Decision and Control; Springer International Publishing: Warszawa, Poland, 2019. [Google Scholar]
- Pokonieczny, K. Automatic Military Traverseability Map Generation System. In Proceedings of the 2017 International Conference on Military Technologies (ICMT), IEEE, Brno, Czech Republic, 31 May–2 June 2017; pp. 285–292. [Google Scholar]
- Pokonieczny, K. Methods of Using Self-Organising Maps for Terrain Classification, Using an Example of Developing a Military Traverseability Map. Dynamics in GIscience. In Lecture Notes in Geoinformation and Cartography; Ivan, I., Horák, J., Inspektor, T., Eds.; Springer International Publishing: Cham, Switzerland, 2018; pp. 359–371. [Google Scholar]
- Dawid, W.; Pokonieczny, K. Analysis of the Possibilities of Using Different Resolution DEMs in the Study of Microrelief on the Example of Terrain Passability. Remote Sens. 2020, 12, 4146. [Google Scholar] [CrossRef]
- Bellone, M.; Bellone, M.; Spedicato, L.; Giannoccaro, N.I. 3D traversability awareness for rough terrain mobile robots. Sens. Rev. 2014, 34, 220–232. [Google Scholar] [CrossRef]
- Ivanisevic, V.V.; Lozynskyy, A.; Demkiv, L.; Klos, S. A Foundation for Realtime Tire Mobility Estimation and Control. In Proceedings of the 19th International & 14th European-African Regional Conference of the ISTVS, Budapest, Hungary, 25–27 September 2017. [Google Scholar]
- Hubacek, M.; Mertova, E. The Influence of Weather on Soil Properties and on Terrain Traverseability. In GIS Ostrava 2018: GIS for Supporting Security and Crisis Management; VSB Technical University of Ostrava: Ostrava, Czech Republic, 2018; pp. 1–6. ISBN 978-80-248-4166-3. [Google Scholar]
- Hubacek, M.; Rybansky, M.; Brenova, M.; Ceplova, L. The Soil Traficability Measurement in the Czech Republic for Military and Civil Use. In Proceedings of the 18th International Conference of the ISTVS, Seoul, Korea, 22–25 September 2014; p. 8, ISBN 978-1-942112-45-7. [Google Scholar]
- Padarian, J.; Minasny, B.; McBratney, A.B. Using deep learning for digital soil mapping. SOIL 2019, 26, 79–89. [Google Scholar] [CrossRef] [Green Version]
- Wildmann, R.; Bělka, L.; Kotlář, V. Production of foreign territory maps: MGCP derived graphics. ArcRevue 2009, 3, 6–9. [Google Scholar]
- OSM. Project OpenStreetMap. 2021. Available online: https://www.openstreetmap.org/about (accessed on 13 December 2021).
- Weibel, R.; Heller, M. Digital Terrain Modelling. Geographical Information Systems: Principles and Applications; Longman Scientific & Technical: London, UK, 1991. [Google Scholar]
- USGS. Shuttle Radar Topography Mission (SRTM); U. S. Geological Survey: Reston, VI, USA, 2021. Available online: https://www.usgs.gov/centers/eros/science/usgs-eros-archive-digital-elevation-shuttle-radar-topography-mission-srtm-1?qt-science_center_objects=0 (accessed on 10 December 2021).
- NGA. Digital Terrain Elevation Data; National Geospatial-Intelligence Agency: Springfield, VA, USA, 2021; Available online: https://www.nga.mil/ProductsServices/TopographicalTerrestrial/Pages/DigitalTerrainElevationData.aspx (accessed on 20 December 2021).
- ČÚZK. Digital Elevation Model of the Czech Republic of the 5th Generation (DMR5G). 2021. Available online: https://geoportal.cuzk.cz/(S(xg531xtrv3wnozbfp2hdiitu))/Default.aspx?mode=TextMeta&side=vyskopis&metadataID=CZCUZKDMR5GV&head_tab=sekce02gp&menu=30 (accessed on 12 December 2021).
- MOČR. Weapons and Equipment of the Armed Forces of the Czech Republic; Ministry of Defence of the Czech Republic: Praha, Czech Republic, 2021; Available online: https://www.acr.army.cz/technika/default.htm (accessed on 4 December 2021).
- Hlavacek, V. Evaluation of Dynamics of Vehicle Movement in the Terrain. Diploma Thesis, University of Defence, Brno, Czech Republic, 2017. [Google Scholar]
- Vala, M.; Zalud, Z.; Neumann, V. Theory and Construction of Military and Special Vehicles, Chapter III. Safety and Testing of Vehicles; Textbook; Faculty of Military Technology, University of Defence: Brno, Czech Republic, 2017; ISBN 978-80-7582-023-5. [Google Scholar]
- Rada, J. Smart defence: Joint Geospatial Support in NATO. GeoScape 2019, 13, 98–105. [Google Scholar] [CrossRef] [Green Version]
- McGuire, P.C.; Vidale, P.L.; Best, M.; Case, D.H.; Duran Rojas, C.; Dharssi, I.; Hatcher, R.S.; Lister, G.M.; Martinez-de la Torre, A.; Montzka, C.; et al. Improving the global modeling of soils in JULES and the Unified Model: Updating from UM/HWSD to SoilGrids soil properties and from the Brooks & Corey to the van Genuchten soil-hydraulics model. 2020. In AGU Fall Meeting Abstracts; American Geophysical Union: Washington, DC, USA, 2020; Volume 2020, p. H199-0014. [Google Scholar]
- Poggio, L.; Gimona, A. Assimilation of optical and radar remote sensing data in 3D mapping of soil properties over large areas. Sci. Total Environ. 2017, 579, 1094–1110. [Google Scholar] [CrossRef] [Green Version]
- Rada, J.; Rybansky, M.; Dohnal, F. The Impact of the Accuracy of Terrain Surface Data on the Navigation of Off-Road Vehicles. ISPRS Int. J. Geo-Inf. 2021, 10, 106. [Google Scholar] [CrossRef]
- Štroner, M.; Urban, R.; Línková, L. A New Method for UAV Lidar Precision Testing Used for the Evaluation of an Affordable DJI ZENMUSE L1 Scanner. Remote Sens. 2021, 13, 4811. [Google Scholar] [CrossRef]
- Surový, P.; Kuželka, K. Acquisition of Forest Attributes for Decision Support at the Forest Enterprise Level Using Remote-Sensing Techniques—A Review. Forests 2019, 10, 273. [Google Scholar] [CrossRef] [Green Version]
- Krůček, M.; Král, K.; Cushman, K.; Missarov, A.; Kellner, J.R. Supervised Segmentation of Ultra-High-Density Drone Lidar for Large-Area Mapping of Individual Trees. Remote Sens. 2020, 12, 3260. [Google Scholar] [CrossRef]
- Rybansky, M. Determination of Forest Structure from Remote Sensing Data for Modeling the Navigation of Rescue Vehicles. Appl. Sci. 2022, 12, 3939. [Google Scholar] [CrossRef]



| Terrain Models | Resolution (m) | Vertical Accuracy (m) |
|---|---|---|
| Global Models | ||
| SRTM 1 | 30 m × 30 m | 16–20 m |
| SRTM 3 | 90 m × 90 m | 16–20 m |
| DTED 1 | 90 m × 90 m | 3–20 m |
| DTED 2 | 30 m × 30 m | 3–15 m |
| TREx | 12 m × 12 m | 2–10 m |
| Czech National Models | ||
| DTM 3 | 10 m × 10 m | 1–7 m |
| DTM 4 | 5 m × 5 m | 0.3–1 m |
| DTM 5 | TIN—min. 1 m × 1 m | 0.18–0.3 m |
| Local Models | ||
| LIDAR data | TIN—min. 1 m × 1 m | 0.3 m |
| Area | Mean Slope | Mean Altitude (Above Sea Level) | Coordinates (WGS84) |
|---|---|---|---|
| Dobruška | 6° | 420 m | 50.31° N, 16.22° E |
| Horní Cerekev | 5° | 645 m | 49.32° N, 15.25° E |
| Znojmo | 3° | 211 m | 48.83° N, 16.16° E |
| Kdyně | 9° | 576 m | 49.39° N, 13.11° E |
| Dolní Morava | 15° | 670 m | 50.11° N, 16.86° E |
| Slope Classes | Mean Slope (°) | Mean Slope Difference from DTM 5 (°) | ||||||
|---|---|---|---|---|---|---|---|---|
| Quantity | Slope | DTM 5 | DTM 4 | DTM 3 | DTED 2 | DTM 4 | DTM 3 | DTED 2 |
| 10,134 | 0–5° | 3.14 | 4.09 | 5.21 | 5.17 | 0.95 | 2.07 | 2.02 |
| 12,389 | 5–10° | 7.17 | 7.28 | 7.54 | 6.82 | 0.11 | 0.37 | −0.35 |
| 6946 | 10–15° | 12.37 | 12.07 | 11.74 | 9.94 | −0.30 | −0.62 | −2.43 |
| 5933 | 15–20° | 17.45 | 16.59 | 15.42 | 12.59 | −0.87 | −2.03 | −4.86 |
| 5696 | 20–25° | 22.49 | 21.41 | 19.11 | 15.85 | −1.08 | −3.39 | −6.64 |
| 4987 | 25–30° | 27.38 | 26.05 | 22.37 | 18.09 | −1.33 | −5.01 | −9.29 |
| 2679 | 30–35° | 32.10 | 29.81 | 23.37 | 18.33 | −2.29 | −8.72 | −13.77 |
| 740 | 35–40° | 36.95 | 31.24 | 22.80 | 15.75 | −5.72 | −14.15 | −21.20 |
| 191 | 40–45° | 42.00 | 33.36 | 22.64 | 14.23 | −8.64 | −19.36 | −27.77 |
| 96 | 45–50° | 47.41 | 37.25 | 26.36 | 10.48 | −10.16 | −21.05 | −36.93 |
| 54 | 50–55° | 52.53 | 40.48 | 28.51 | 8.73 | −12.05 | −24.02 | −43.80 |
| 55 | 55–60° | 57.48 | 46.31 | 30.92 | 6.90 | −11.17 | −26.56 | −50.58 |
| 41 | 60–65° | 62.82 | 48.48 | 26.30 | 5.42 | −14.34 | −36.51 | −57.39 |
| 35 | 65–70° | 67.43 | 51.05 | 31.97 | 5.80 | −16.38 | −35.46 | −61.63 |
| 50,000 | Total | 14.27 | 13.77 | 12.64 | 10.54 | −0.50 | −1.63 | −3.73 |
| CCM Parameters | Average Deviations of Passable Area in Comparison with DTM 5 (%) | ||
|---|---|---|---|
| DTM 4 | DTM 3 | DTED 2 | |
| T815 GO moist (max slope = 6.25°) | 1.32 | 2.71 | 4.39 |
| T815 GO semi-moist (max slope = 12.08°) | 1.31 | 2.54 | 3.32 |
| LRD GO dry (max slope = 16.17°) | 1.11 | 2.32 | 3.45 |
| LRD GO + SLOW GO semi-moist (max slope = 21.82°) | 0.77 | 1.83 | 2.37 |
| BVP2 GO + SLOW GO semi-moist (max slope = 28.81°) | 0.33 | 0.98 | 1.08 |
| GO or SLOW GO Slope Value (°) | Reduced Slope Values (°) | ||
|---|---|---|---|
| DTM 4 | DTM 3 | DTED 2 | |
| 10 | 9.9 | 9.6 | 9.3 |
| 15 | 14.5 | 13.4 | 12.8 |
| 20 | 19.0 | 17.3 | 16.4 |
| 25 | 23.5 | 21.2 | 19.8 |
| 30 | 27.8 | 25.1 | 23.6 |
| 35 | 32.0 | 29.0 | 27.0 |
| 40 | 36.0 | 32.8 | 30.5 |
| 45 | 40.0 | 36.5 | 34.0 |
| DTM 5 Area (%) | DTM 4 Area (%) | DTM 3 Area (%) | DTED 2 Area (%) | ||
|---|---|---|---|---|---|
| No slope corrections | GO | 72.01 | 73.17 | 74.44 | 73.04 |
| SLOW GO | 24.71 | 24.70 | 24.40 | 26.07 | |
| NO GO | 3.28 | 2.13 | 1.15 | 0.90 | |
| With slope corrections | GO | 72.01 | 72.65 | 72.06 | 69.19 |
| SLOW GO | 24.71 | 24.35 | 24.77 | 26.59 | |
| NO GO | 3.28 | 3.00 | 3.17 | 4.23 | |
| DTM 5 Area (%) | DTM 4 Area (%) | DTM 3 Area (%) | DTED 2 Area (%) | ||
|---|---|---|---|---|---|
| No slope corrections | GO | 43.67 | 44.25 | 43.77 | 43.72 |
| SLOW GO | 36.36 | 37.37 | 40.79 | 42.53 | |
| NO GO | 19.97 | 18.38 | 15.44 | 13.76 | |
| With slope corrections | GO | 43.67 | 43.61 | 41.12 | 38.89 |
| SLOW GO | 36.36 | 35.49 | 35.16 | 37.03 | |
| NO GO | 19.97 | 20.90 | 23.72 | 24.08 | |
| DTM 5 Area (%) | DTM 4 Area (%) | DTM 3 Area (%) | DTED 2 Area (%) | ||
|---|---|---|---|---|---|
| No slope corrections | GO | 80.03 | 81.62 | 84.56 | 86.24 |
| SLOW GO | 16.12 | 15.29 | 14.38 | 12.89 | |
| NO GO | 3.85 | 3.09 | 1.06 | 0.87 | |
| With slope corrections | GO | 80.03 | 79.10 | 76.28 | 75.92 |
| SLOW GO | 16.12 | 15.50 | 18.70 | 17.81 | |
| NO GO | 3.85 | 5.40 | 5.02 | 6.27 | |
| DTM 5 Area (%) | DTM 4 Area (%) | DTM 3 Area (%) | DTED 2 Area (%) | ||
|---|---|---|---|---|---|
| No slope corrections | GO | 77.34 | 78.55 | 79.28 | 80.54 |
| SLOW GO | 16.64 | 16.35 | 16.72 | 16.27 | |
| NO GO | 6.02 | 5.09 | 4.00 | 3.19 | |
| With slope corrections | GO | 77.34 | 78.24 | 77.91 | 76.82 |
| SLOW GO | 16.64 | 15.86 | 15.61 | 15.55 | |
| NO GO | 6.02 | 5.90 | 6.48 | 7.63 | |
Publisher’s Note: MDPI stays neutral with regard to jurisdictional claims in published maps and institutional affiliations. |
© 2022 by the authors. Licensee MDPI, Basel, Switzerland. This article is an open access article distributed under the terms and conditions of the Creative Commons Attribution (CC BY) license (https://creativecommons.org/licenses/by/4.0/).
Share and Cite
Rybansky, M.; Rada, J. The Influence of the Quality of Digital Elevation Data on the Modelling of Terrain Vehicle Movement. Appl. Sci. 2022, 12, 6178. https://doi.org/10.3390/app12126178
Rybansky M, Rada J. The Influence of the Quality of Digital Elevation Data on the Modelling of Terrain Vehicle Movement. Applied Sciences. 2022; 12(12):6178. https://doi.org/10.3390/app12126178
Chicago/Turabian StyleRybansky, Marian, and Josef Rada. 2022. "The Influence of the Quality of Digital Elevation Data on the Modelling of Terrain Vehicle Movement" Applied Sciences 12, no. 12: 6178. https://doi.org/10.3390/app12126178
APA StyleRybansky, M., & Rada, J. (2022). The Influence of the Quality of Digital Elevation Data on the Modelling of Terrain Vehicle Movement. Applied Sciences, 12(12), 6178. https://doi.org/10.3390/app12126178


