Abstract
The rapid and accurate detection of soil nutrient content through spectral technology is one of the requisite technologies for precision fertilization, which, however, is an unsolved issue. In order to achieve this purpose, a more robust and accurate model is established in this study. The regression algorithm is integrated with effective wavelength selection to construct the prediction model for total nitrogen, available phosphorus, and available potassium (N, P, and K), which removes the need for complex pretreatment and algorithm constraints. According to the research results, with regard to the prediction of soil nitrogen, phosphorus, and potassium contents, the joint interval support vector regression (Si-SVR) model performed best in modeling, with the root mean square error of prediction (RMSEP) limited to 0.0231%, 1.0554%, and 3.4225%, respectively. In addition, the relative percentage deviation (RPD) values were restricted to 2.68, 2.12, and 2.37, respectively. As indicated by the prediction results obtained for the above three nutrient contents, the RPD values of the Si-SVR model prediction accuracy evaluation indicators exceeded 2.0, which evidences a high level of prediction accuracy. This method makes it possible for spectral data to be applied in practical production, and these results provide a valuable reference for the effective detection of major soil nutrients.
1. Introduction
Located in the hinterland of Eurasia and affected by the typical temperate continental arid climate, the Xinjiang Uygur Autonomous Region [1] is endowed with various unique advantages in the development of cotton industry, such as the abundance of light and heat resources, as well as distinct regional characteristics [2]. With its cotton plantation area accounting for 74.92% of Chinese cotton acreage, Xinjiang contributed 87.32% to Chinese total cotton production in 2020, with the average increase of cotton production reaching 5.72% from 2011 to 2020 [3]. At present, Xinjiang has become one of the bases of high-quality cotton production and planting for China (Figure 1).
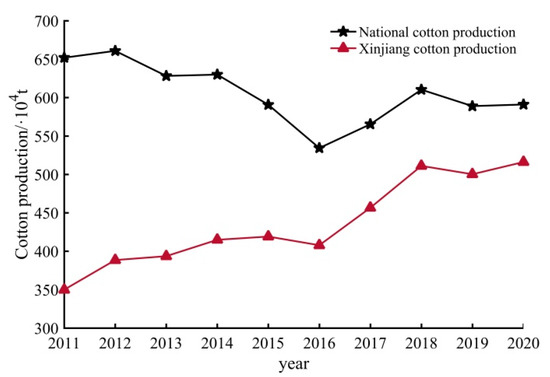
Figure 1.
Variation of cotton yield in Xinjiang and total domestic yield of China.
Fertilization is not only one of the main solutions to boosting cotton yield but is also a crucial link of cotton planting [4]. In this regard, the balance of soil nutrients plays a vital role in the healthy growth and high yield of cotton. Through the prediction of soil nutrients, better-informed decisions can be made on land selection, and the soil nutrient content can be better adjusted with the support of appropriate technical means [5]. However, according to an investigation conducted into the practice of fertilization among those cotton growers in the main cotton-producing areas across Xinjiang, the average application rate of cotton chemical fertilizer reached merely 600 kg/hm2, with the overall application rate being as low as 56.98%. Due to the heavy dressing of nitrogen and phosphorus fertilizer, little or even no application of potassic fertilizer, micro-fertilizer, and organic fertilizer, the ratio of nitrogen to phosphorus and potassium in the soil fell within the range of 1:0.14~2.90:0~0.28, which is a significant deviation from the normal ratio of 3:1:3 [6,7]. Consequently, there has not been any significant increase in cotton production, but the production costs have risen. At the same time, it leads to a series of problems, such as low fertilizer utilization rate, declining cotton quality and soil productivity, the destruction of soil micro-ecological environment, and so on [8,9]. Therefore, it is imperative to implement variable rate fertilization in a scientific way for the sustainable development of agriculture, which is also essential for the smooth transformation of cotton planting from traditional agriculture to precision agriculture.
The prediction of soil nutrient data based on spectral information is characterized by a low-cost, high-density, high-precision, and real-time nature. This method addresses the weaknesses of traditional chemical determination methods, such as the substantial time, labor, and financial costs. With large-scale, rapid, and nondestructive monitoring turned into reality [10,11], the constraint on the development of variable rate precision fertilization has been addressed. With the extensive application of spectral technology in the detection of soil nutrient content, there has been a significant improvement made to the level of automation and efficiency for soil dynamic monitoring, which enables the real-time variable rate fertilization. In practice, however, soil spectral signal can be affected by a range of external environmental parameters, such as soil moisture content [12], soil salt content [13], soil particle size [14], soil texture [15], and outdoor temperature, and especially soil moisture content. It was revealed by a study that soil hyperspectral detection can be severely disrupted by soil moisture content in the water absorption bands (1400, 1900, and 2200 nm) [16], thus resulting in a poor applicability of the prediction model [17]. In this respect, external parameter orthogonalization (EPO) and machine learning can be combined to improve the accuracy of organic carbon prediction in semiarid soils with varying water contents [18]. The soil organic matter estimation model is established by using the hyperspectral data processed by EPO, which prevents the potential impact of soil moisture [17]. This method is also applicable to eliminate the impact of soil moisture on the model as constructed to predict the content of organic carbon and clay [19,20,21,22,23]. Through the development of a portable total nitrogen content detector based on a near-infrared spectrum instrument (NIRS), An et al. proposed the absorbance correction method and mixed correction method to correct the original spectral data while eliminating the interference caused by soil moisture and particle size, respectively [24].
So far, there has been study conducted both at home and abroad on the use of hyperspectral information to predict the content of soil organic matter and other nutrients. From a practical point of view, different methods of data preprocessing and modeling will lead to the variation in prediction accuracy. To ensure the adequate responsiveness to the nondestructive testing of soil nutrients, a high-precision prediction model of soil nutrient regression was developed by using hyperspectral information in the main producing areas of southern Xinjiang. High-precision modeling methods such as complex preprocessing and algorithms were explored, with soil N, P, and K contents predicted by using different methods. In addition, the generalizability of the models was discussed on the basis of comparing the statistical characteristics of these models. To sum up, this study provides a valuable theoretical reference for the further development of an expert decision system for precision fertilization.
2. Materials and Methods
2.1. Study Area and Soil Sample Collection
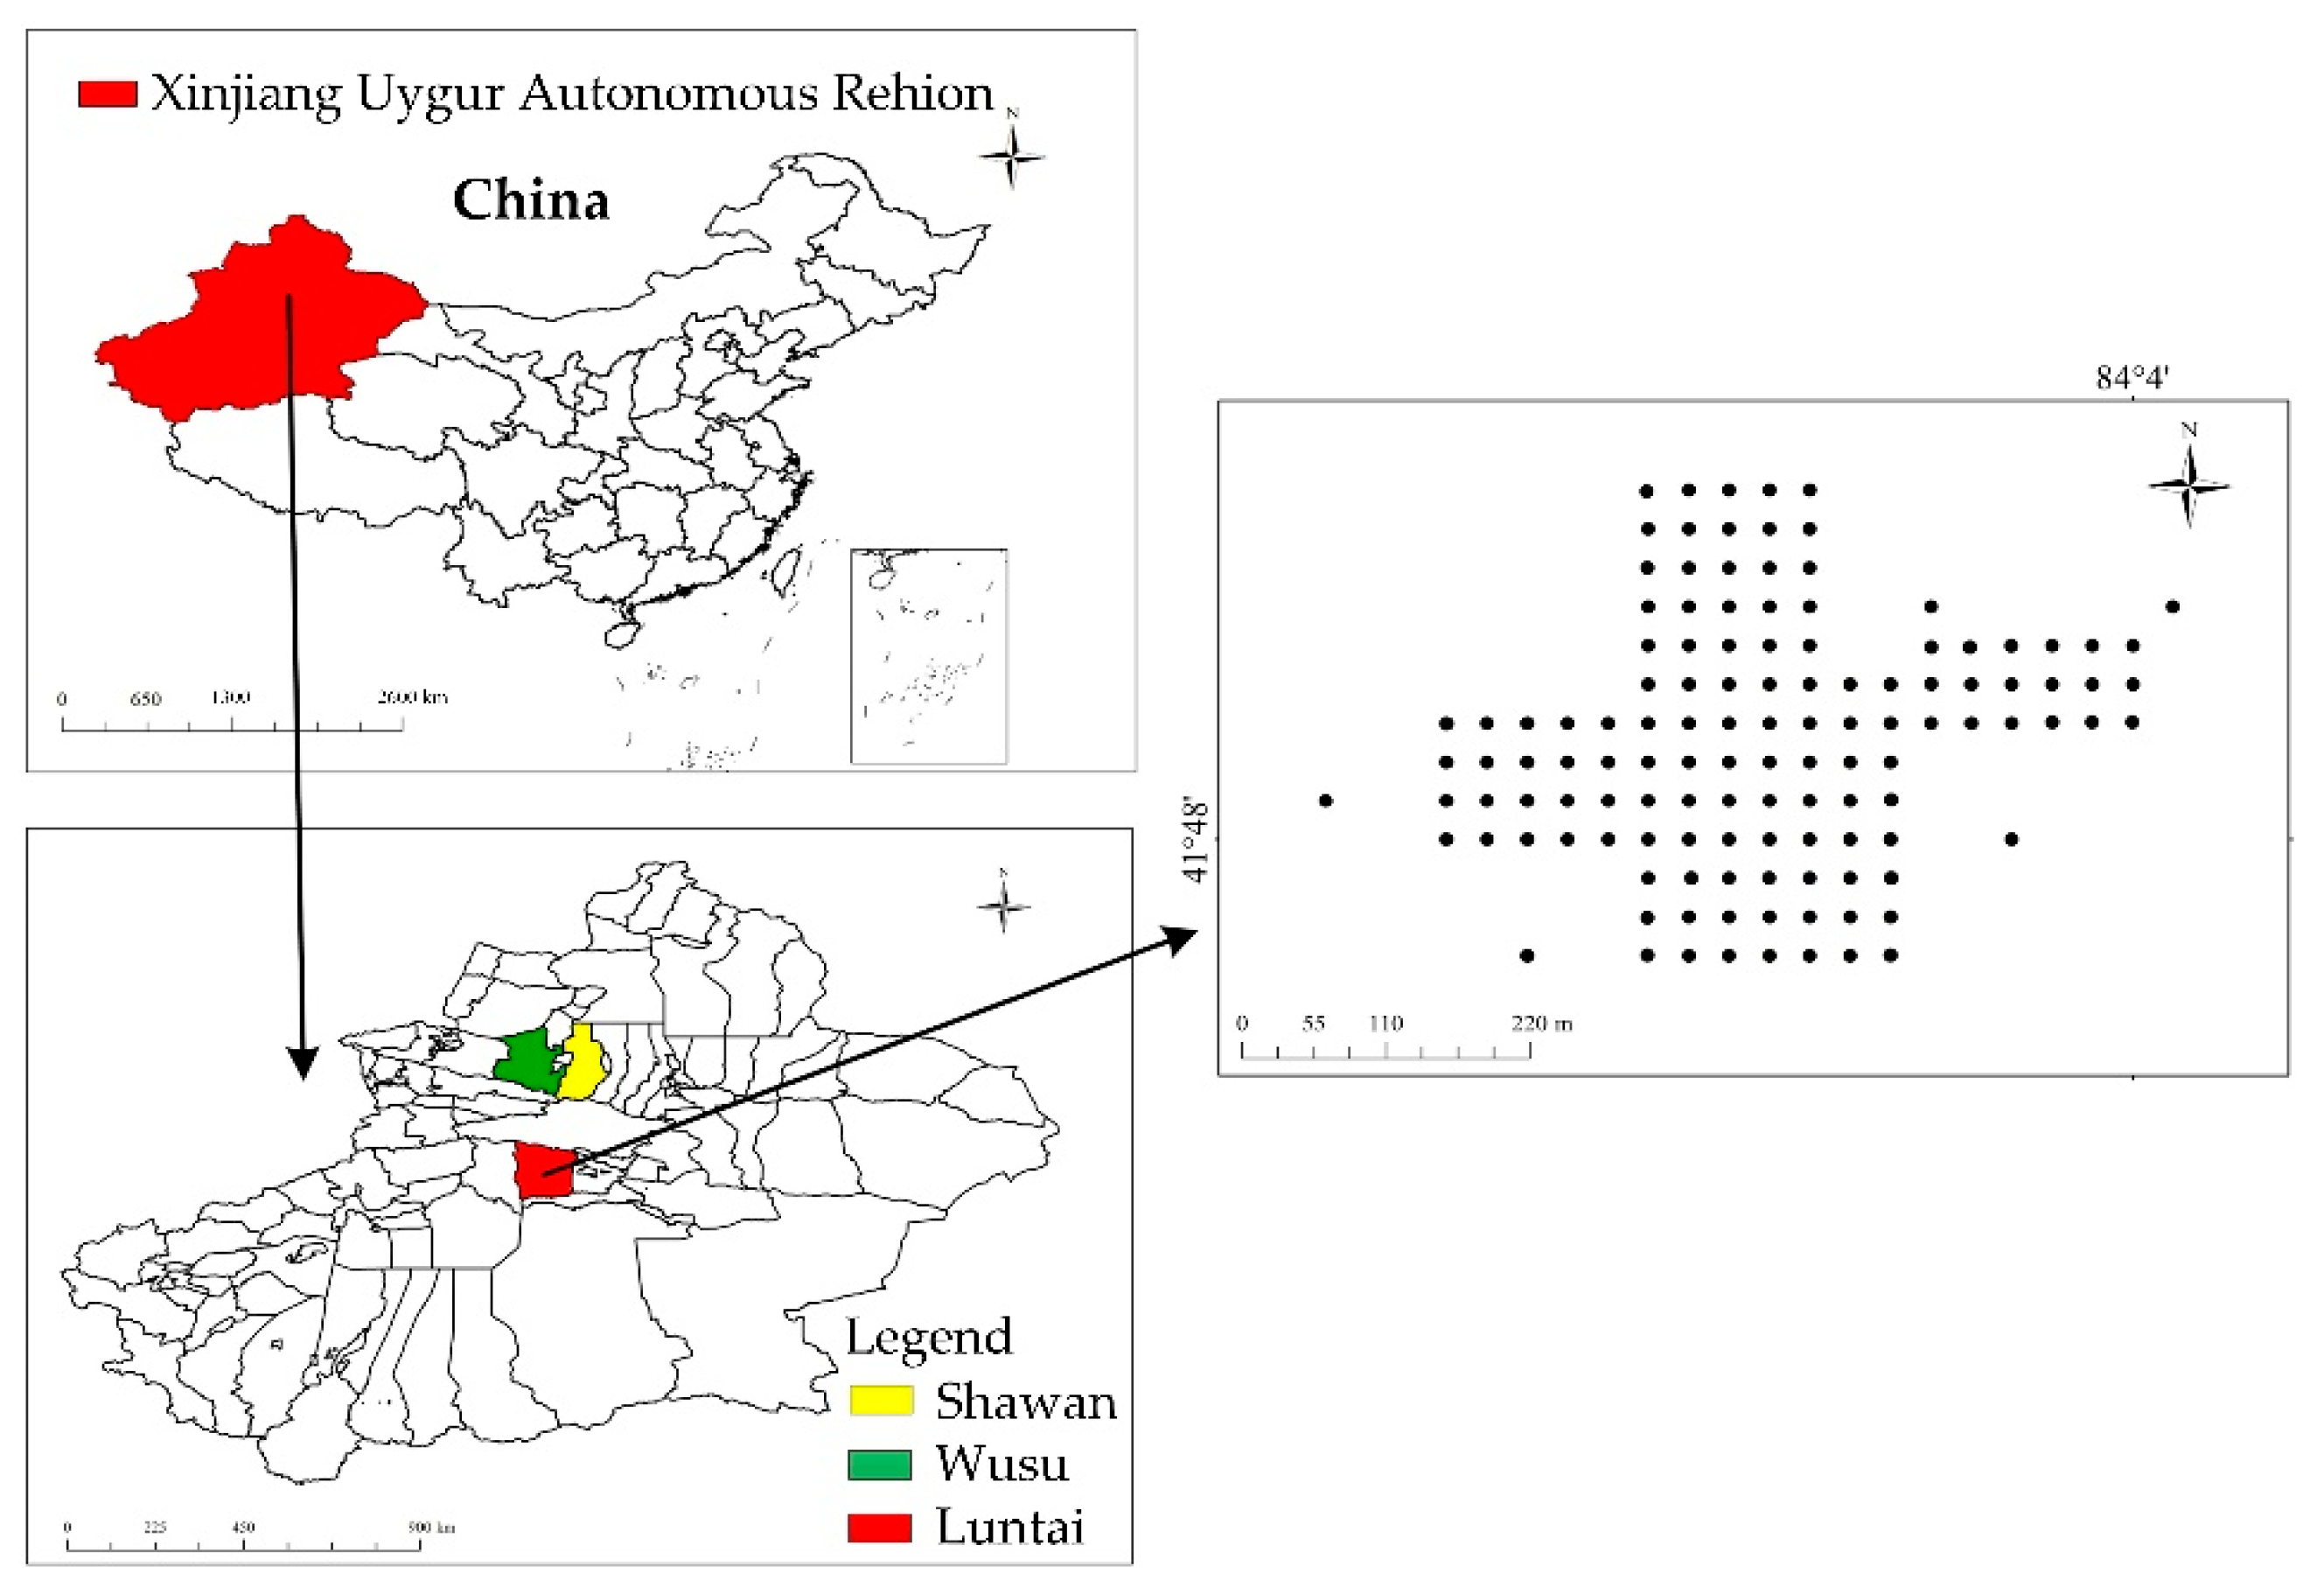
The study area was located in Luntai County, Bayingoleng Mongol Autonomous Prefecture, Xinjiang Uygur Autonomous Region, China. The soil samples were collected from an experimental cotton field (41°47′29′′–41°47′40′′ E, 84°3′40′′–84°4′1′′ N) located in Luntai County, Xinjiang Uygur Autonomous Region in November of 2020. The five-point sampling method [25] was adopted to collect and encapsulate the mixed soil samples of cultivated soil at a depth of 0–30 cm. Finally, a total of 124 soil samples were collected. Figure 2 shows the location of this study area and the layout of these sampling points.
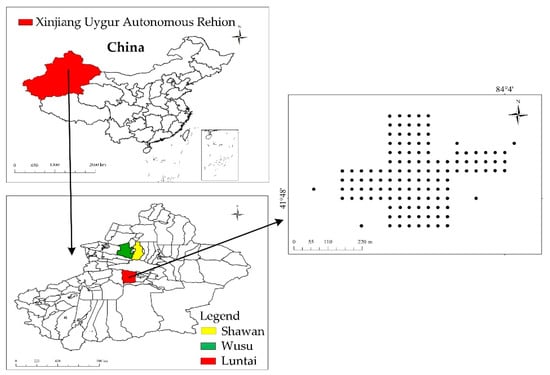
Figure 2.
Study area and sampling points.
2.2. Preparation and Experimental Treatment of Soil Samples
Firstly, the obtained soil samples were thoroughly mixed and then air-dried. Secondly, they were crushed with wooden rods, and then sifted through the 2 mm and 1 mm sieves to obtain powdery soil [26]. Thirdly, the powdery soil was divided into four parts and placed into glass jars for soil nutrient agrochemical analysis and spectrum data collection. Lastly, the contents of N, P, and K were determined by means of the semimicro Kjeldahl method, sodium bicarbonate extraction–molybdenum antimony anti-spectrophotometric method, NH4OAc extraction, and flame photometry, respectively. Table 1 shows the results of agrochemical analysis.

Table 1.
Statistical results of the determination of soil nutrient content values in calibration set and prediction set.
To reveal the impact of different moisture contents on the spectrum characteristic curve of soil nutrients, 120 soil samples were studied, given varying moisture contents. Each 50 g of soil sample was placed in a transparent glass Petri dish with a diameter of 9 cm and a depth of 1.5 cm. Then, the overall mass of the sample was weighed and recorded. After the sample was dried for 8 h at a temperature of 95 °C, its mass was weighed and spectral measurement was performed to obtain the spectrum of the dried soil. After being saturated with water to produce specular reflection [27], the sample was weighed and the overall mass was recorded. Then, the soil sample was dried in an oven at 42 °C, and the spectral measurement was performed hourly, with the dried soil (moisture content: 0) as the control. In addition, the overall mass of the sample was measured and recorded to calculate the soil moisture content. The calculation equation is expressed as follows.
where W represents the water content of the soil sample in %; M denotes the mass of wet soil in g; M0 refers to the mass of completely dry soil in g.
The dried soil sample cracked during the process. However, given the thin soil layer, the soil sample was considered to have homogeneous moisture content during this process, with its impact on spectral measurement being negligible. Table 2 shows the measurement results of soil moisture content.
Table 2.
Measured values of soil moisture content.
2.3. Collection of Sample Spectra
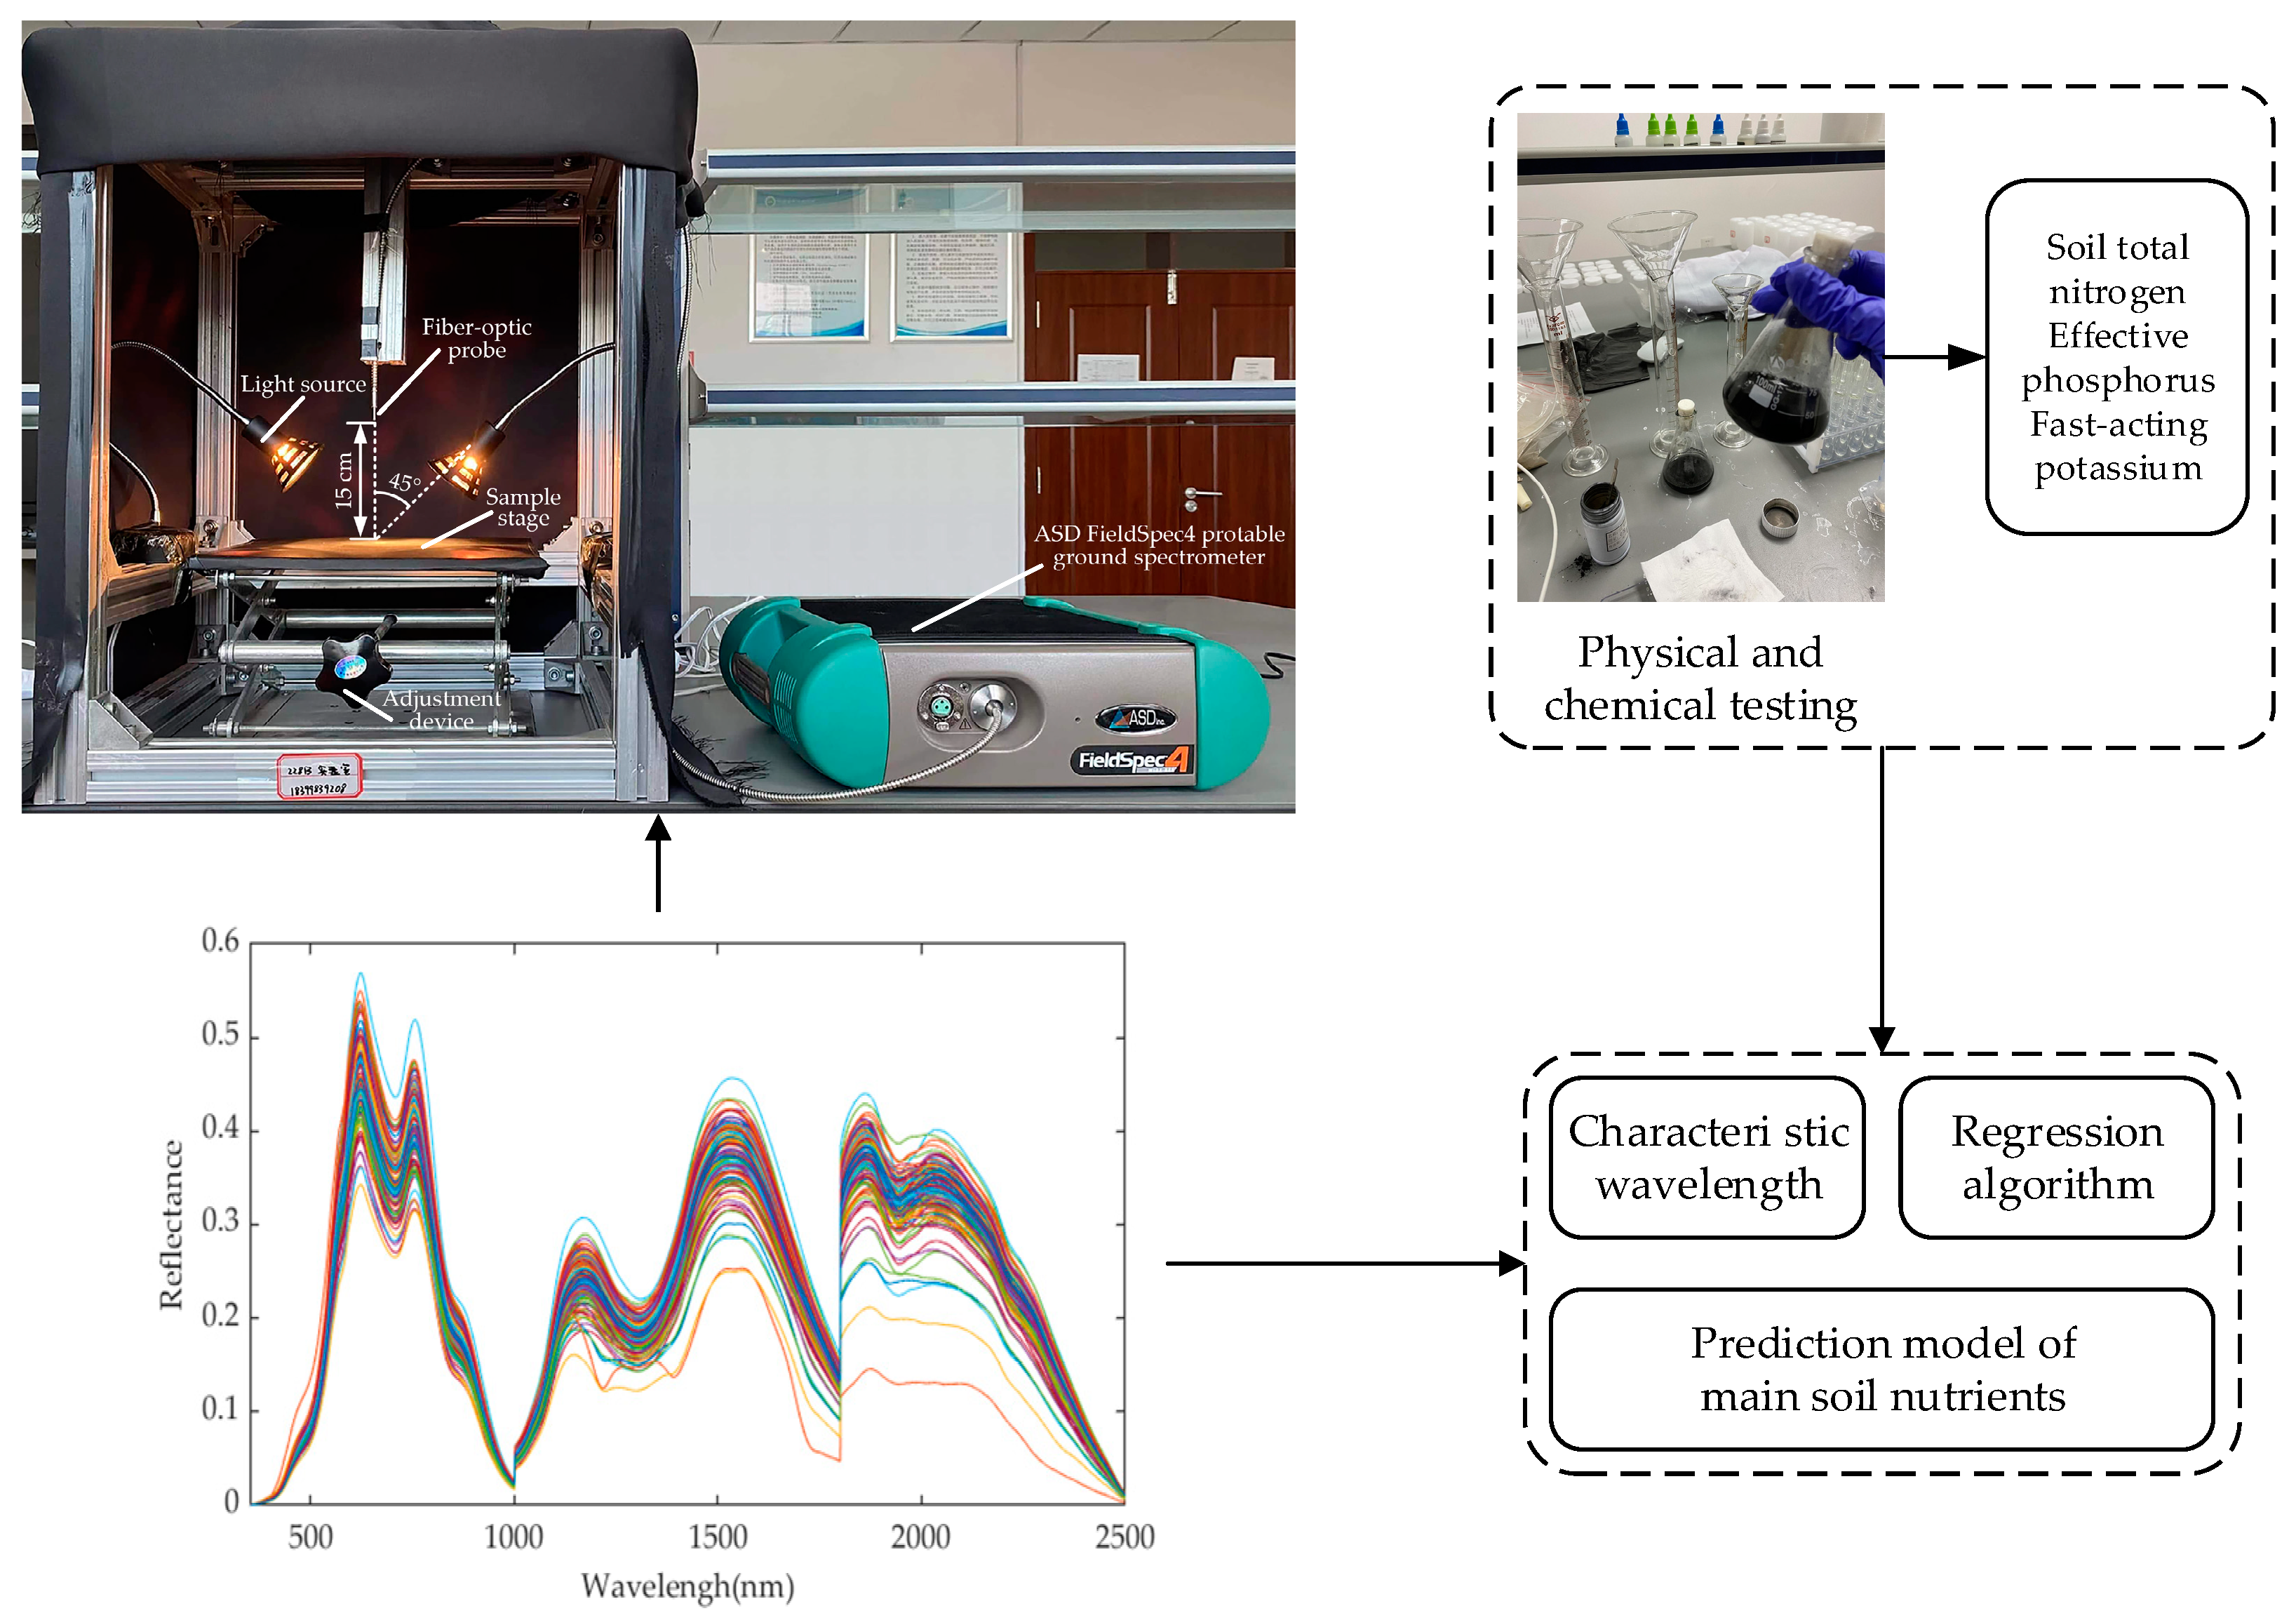
The ASD FieldSpec4 portable ground spectrometer produced by Analytical Spectral Device (ASD, USA) was applied to measure the level of soil spectrum reflectance. Figure 3 illustrates the process of how the portable ground spectral data acquisition system works. The spectrum was in the range of 350–2500 nm, and the number of output bands was 2151. A fiber-optic probe was used, whose angular field of view is 25°, and two 35 W halogen lamps were symmetrically fixated on both sides of the soil sample placement table as the light source. The incident angle (α) was set to 45°, and the distance (L) from the light source to the soil sample surface was set to 15 cm. Placed in a transparent glass Petri dish, the soil samples had a diameter of 9 cm and a depth of 1.5 cm. Then, the soil sample was scraped flat with the lower straight edge of the protractor, and the spectral measurement was performed in a darkroom. Before each test, the instrument was corrected in black and white. The spectrum acquisition Rs3. Software © was applied to collect each measurement data automatically for the one-off acquisition of spectrum information, and the operation was conducted on each soil sample in triplicate.
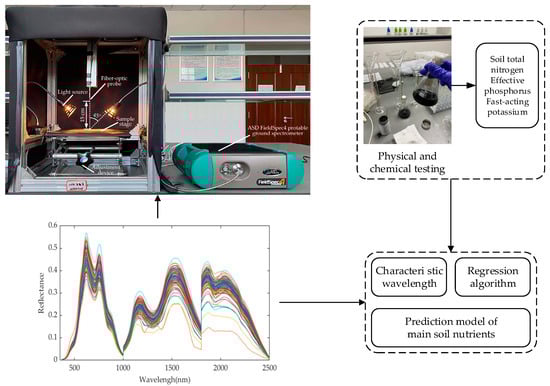
Figure 3.
Spectral data acquisition system flowchart.
2.4. Spectral Analysis and Data Preprocessing
Due to the low signal-to-noise ratio caused by the low photosensitivity of the ASD spectrum meter and the low soil spectral reflectance in the bands of 350–400 nm and 2400–2500 nm (Yu L et al. (2017)), the 2400–2500 nm band spectral data were excluded from the study. Then, soil reflectance spectra were analyzed but only for the 401–2400 nm band of three nutrients: N, P, and K. The preliminary processing of spectral data was conducted using View SpecPro.Software ©. After splice correction, the obtained spectral information was arithmetically averaged to obtain the actual reflection spectral data.
In this study, the moving average method was used to denoise the measured spectra, i.e., the value at each point was calculated as a local average on a band centered at this point, according to the following formula:
where indicates the reflectance value (mean value) of the soil sample at that point and ; k denotes the number of spectral acquisition, and the value of k is 3 in this study.
The actual reflectance spectral data of the sample were obtained after smoothing and filtering of the spectral data measured in numerous bands using the abovementioned method.
2.5. Modeling and Verification
As shown in Figure 2, the four points distributed along the edge were removed, and 120 soil samples were taken as the research object. Based on the randomness of sample data, the 120 samples were divided into two parts, 90 of which were used for modeling, with the rest intended for model validation. To prevent the impact of moisture on soil nutrient (N, P, and K) prediction, the prediction models of main soil nutrients N, P, and K were constructed through a combination of partial least squares (PLS), the simultaneous partial least squares (Si-PLS), the support vector regression (SVR), and the simultaneous support vector regression (Si-SVR) methods.
The prediction models were validated against various criteria, including root mean square error of calibration (RMSEC), root mean square error of prediction (RMSEP), modeling coefficient of determination (Rc), prediction set correlation coefficient (Rp), and relative percent deviation (RPD). More specifically, RMSEC and RMSEP must be minimized as much as possible. In addition, the closer RMSEC and RMSEP are to each other, the more consistently the model performs and the greater its predictive power is. RPD can be calculated by using Equation (3).
where SD represents the standard deviation of verification samples. When RPD ≥ 2.0, the model is considered as being capable to resist the interference of soil moisture with spectra; when 1.4 < RPD ≤ 2.0, the model is regarded as applicable for rough sample estimation; and when RPD ≤ 1.4, the model is deemed inaccurate.
3. Results and Analysis
3.1. Spectral Feature Analysis of Soil Samples with Different Moisture Content
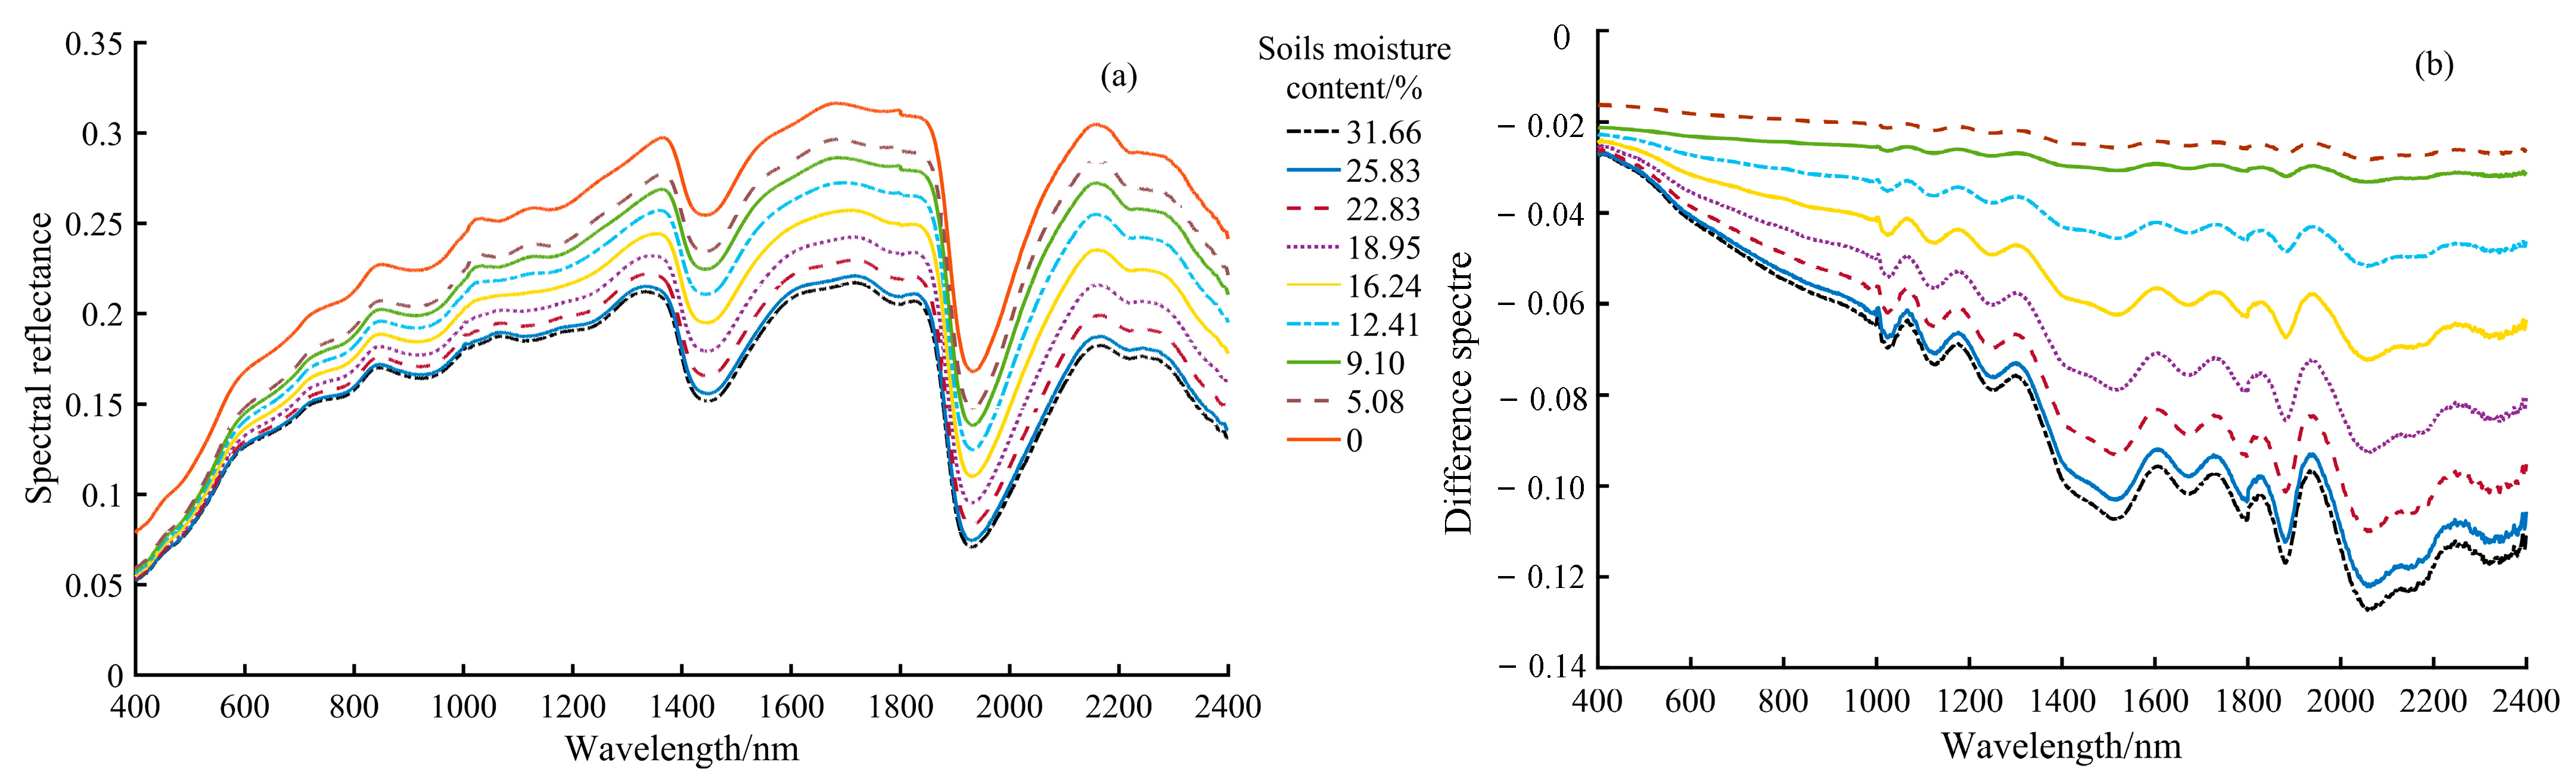
Figure 4a shows the average spectral reflectance characteristic curves of soil samples given different moisture levels. It can be seen clearly from this figure that soil spectral reflectance increased with the reduction of soil moisture content within the visible light range. Within the near-infrared spectrum range, soil spectral reflectance continued to decline with the rise of moisture level (including dried soil). When the moisture level in soil dropped from the saturation level (when specular reflection occurred) to 22.83%, soil spectral reflectance still increased but at a slower pace. However, it began to increase substantially when the moisture level in soil further declined from 22.83% to 18.95%. Although moisture exerted a significant effect on the variation of soil spectral reflectance when the moisture level in soil fell below 22.83%, such impact ceased to be significant when the moisture level in soil reached or exceeded 22.83%. Additionally, soil spectral reflectance decreased at a slower rate. In particular, the spectral reflectances within the spectrum range of 400–800 nm basically overlapped each other. As the level of soil moisture rose, there was an increasing trend shown by both the depth and area of the spectral absorption near the wavelengths of 1435 nm and 1935 nm.
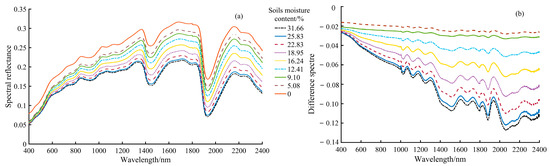
Figure 4.
Spectral characteristic curve of soil samples with different moisture content: (a) spectral characteristic curve of soil samples under different moisture gradients, and (b) dried soil samples.
Figure 4b shows the differences in average spectral reflectance between the soil samples obtained at varying moisture levels and the dried soil sample. It can be seen from this figure that the spectral absorption trough near the wavelength of 1940 nm was the largest one across the waveband range. According to Figure 4a,b, the effect of soil moisture content on soil spectral reflectance in the near-infrared band was clearly more significant compared to the visible light band. This is largely attributed to the apparent absorption of the –OH bond in soil moisture by near-infrared spectroscopy [28].
3.2. Effective Wavelengths Selection
Considering the water content of the selected soil sample, which is not a horizontal value, and the impact on the spectrum by the vibration multiple of O–H, N–H, and C–H groups in the soil [29], partial least squares (PLS) regression algorithm and support vector regression (SVR) algorithm were adopted in this study for modeling. Given the aim of this study, to build an effective prediction model for main soil nutrients, attention should be paid to timeliness for the processing of spectral data. Due to different variables that will affect the stability of the model, the redundant information of the input model can be minimized by the combination of effective wavelength selection and regression algorithm in the experimental process. Therefore, the joint interval method in the effective wavelength selection method was adopted in this study to screen variables, extract the information contained in the specific interval related to soil nutrients as the input information of the model, and establish the main soil nutrient content prediction model, which is effective in significantly reducing the redundant information between variables and improving the efficiency and accuracy of operation for the model. Below are the main steps taken towards the selection of effective bands of spectral information for three main soil nutrients: N, P, and K.
Before the prediction model of soil nitrogen content is constructed, it is necessary to select the full wavelength spectral information of the original spectral data. To begin with, the full spectral wavelength is divided into 10, 11, 12, …, 30 subintervals with equal width. The impact caused by the number of sub spectral regions on the prediction performance of the sample model was explored. If the best effect can be achieved in the 30th subinterval, it is necessary to continue dividing the full spectrum wavelength into 31, 32, …, 40 subintervals. PLS prediction models were established by combining two, three, and four subintervals, respectively. Herein, the range of efficiency wavelength selection for SVR is consistent with that for PLS.
The dependent variable set and independent variable set corresponding to the joint subinterval are expressed as
where F0 represents the dependent variable and E0 refers to the randomly selected subinterval.
The accuracy measurement standard applied to the modeling of a certain characteristic interval is purposed to leave a cross-validation root mean square error of calibration (VRMSEC). The calculation formula is expressed as
where represents the estimated value of the ith sample, denotes the actual value of the ith sample, and n refers to the number of samples in the calibration sample set. By comparing the VRMSEC values of N, P, and K in each subinterval, the optimal subinterval set can be selected to establish the PLS model. The smaller the VRMSEC value of each subinterval model, the better the effect produced by the interval model. Therefore, the subinterval with the smallest VRMSEC was selected. The basic process of how the algorithm works is as follows:
- (1)
- The global PLS model of the sample to be tested is established within the full spectrum range, with the VRMSEC values of N, P, and K calculated by using formula (5) as the threshold VRMSEC for feature interval screening VRMSEC-N, VRMSEC-P, and VRMSEC-K.
- (2)
- h (10 ≤ h ≤ 40) cycles are set, the whole spectral region is divided into h subintervals of equal width, the local PLS regression models of N, P, and K in the sample to be measured at each subinterval are, respectively, established, and the VRMSEC values of N, P, and K of h local PLS regression models are obtained.
- (3)
- The VRMSEC values of the full spectrum model and each local model are compared, respectively, the VRMSEC which is greater than the global VRMSEC-N, VRMSEC-P, and VRMSEC-K is removed, and the remaining q subintervals with smaller VRMSEC are selected.
- (4)
- l (1 ≤ l ≤ q) intervals in q subintervals are combined for PLS regression modeling, and the VRMSEC value of PLS regression model established by all possible combination intervals is calculated according to Formula (5).
- (5)
- Similarly, the VRMSEC value is taken as the accuracy measurement standard of the model established for each combination interval. The interval combination of the joint regression model corresponding to the minimum VRMSEC is treated as the last selected joint interval of the characteristic wavelength.
According to the above steps, the number of spectral information variables involving n was reduced from 2000 to 171. The final three subintervals, 12, 24, and 34, are preferable, while the effective wavelength ranges are 1033~1089, 1717~1773, and 2287~2343 nm. The number of spectral information variables involving P was reduced from 2000 to 182. The final preferable subranges are 5, 19, and 22, while the effective wavelength ranges are 645~705, 1499~1559, and 1681~1740 nm. The number of spectral information variables related to K was reduced from 2000 to 182. Finally, the three subintervals 4, 19, and 28 are preferred, while the effective wavelength ranges are 584~644, 1499~1559, and 2041~2100 nm.
The schematic diagram of characteristic wavelength selection is shown in Figure 5, in which the width of the rectangular box is equivalent to the range of the wavelength.
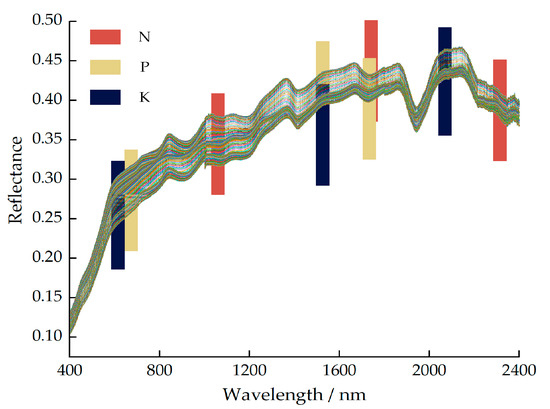
Figure 5.
The schematic diagram of characteristic wavelength selection.
3.3. Accuracy Comparison and Analysis of Predictive Models
After spectral raw data preprocessing and characteristic wavelength selection, the regression algorithm was programmed with MATLAB software ©, with four prediction models of PLS, Si-PLS, SVR, and Si-SVR established, respectively. The prediction performance of the model was analyzed by using RMSEC, RMSEP, Rc, Rp, and RPD values as response indicators. In addition, a comparison was drawn between the PLS, Si-PLS, SVR, and Si-SVR models. To ensure comparability, the same independent samples were used for verification.
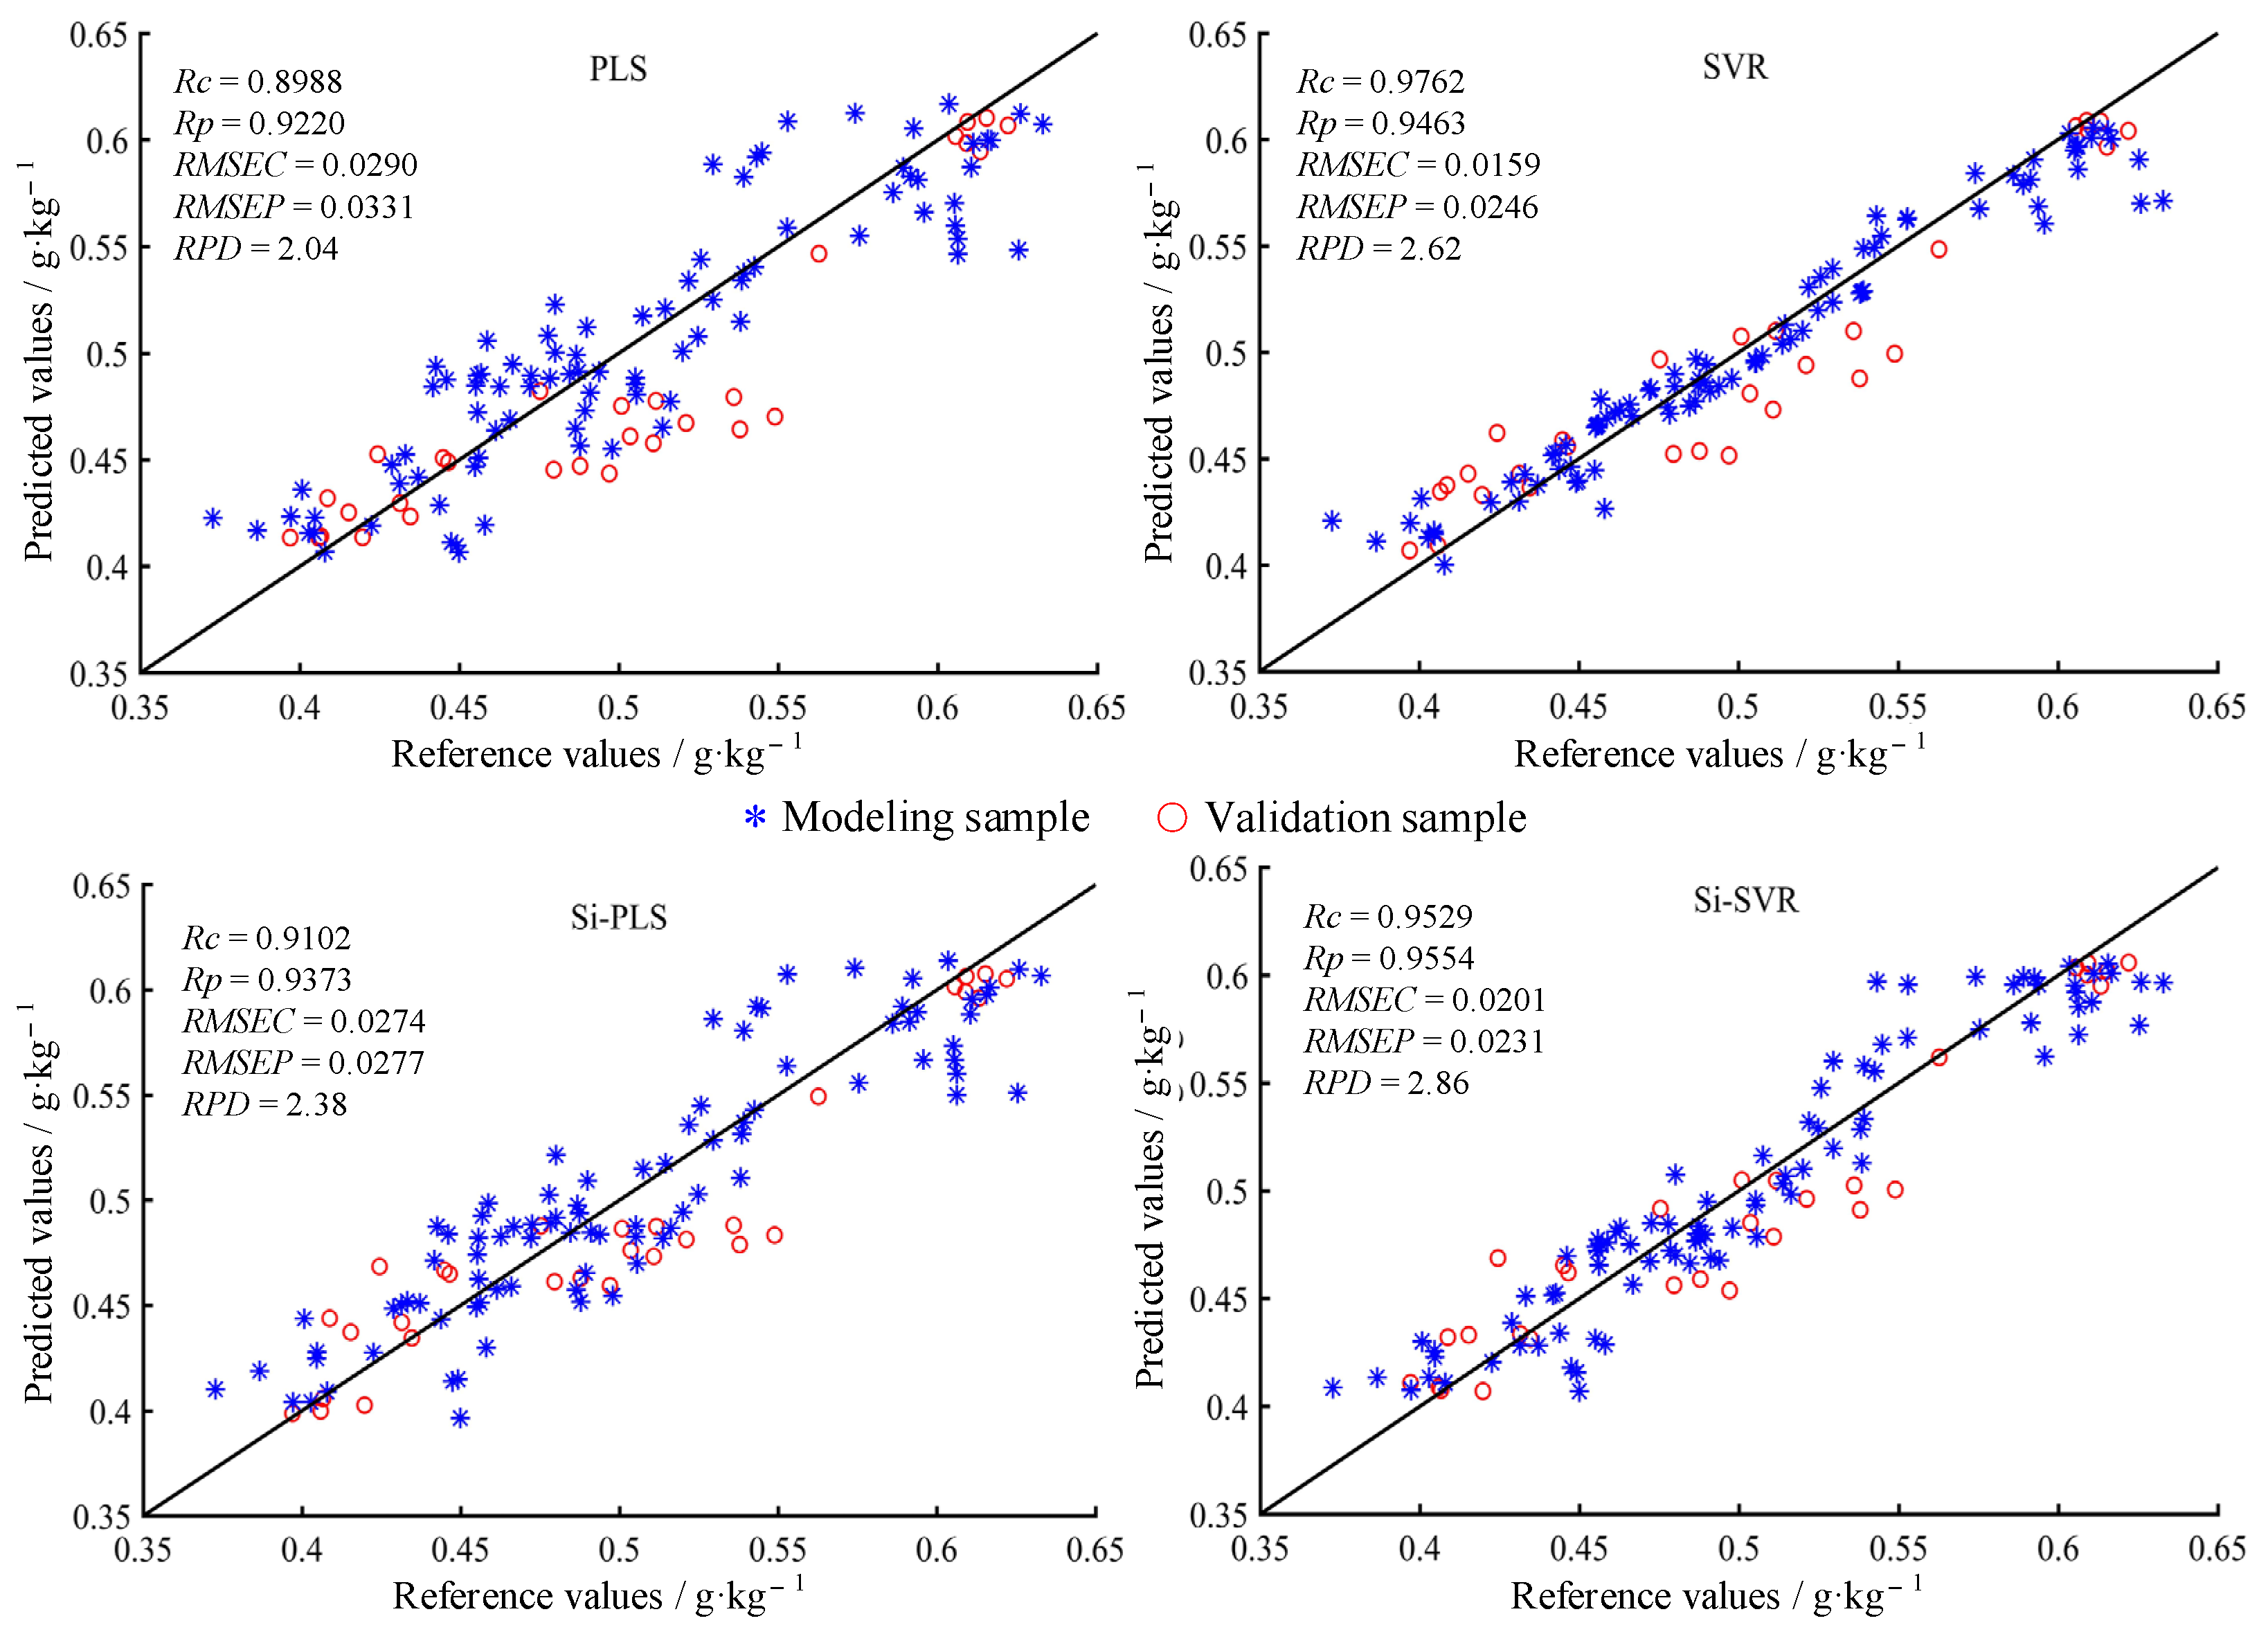
Figure 6 shows the results of estimating soil N content through the sample spectra.
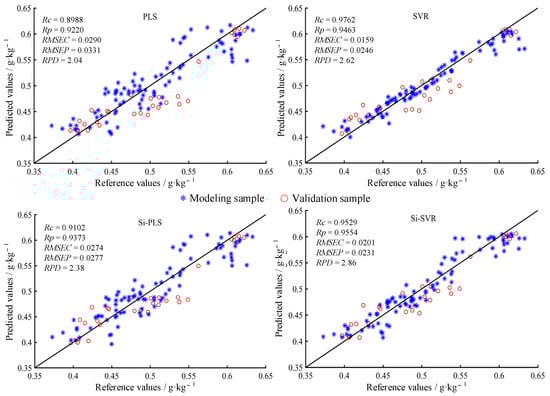
Figure 6.
Scatter plots of measured and predicted values of nitrogen (N) content.
According to the prediction results produced by the hyperspectral prediction model of soil N content on the basis of regression analysis, the SVR model performs best in terms of modeling effect, with the modeling determination coefficient Rc value being 0.9762 and RMSEC value being 0.0159%. The second-best performer is the Si-SVR model, with the modeling determination coefficient Rc value being 0.9529 and the RMSEC value being 0.0201%. In terms of model verification effect, the Si-SVR model performs best, with the RPD value being 2.86. The determination coefficient Rc value of PLS model verification is 0.8988, while the RMSEP and RPD values are 0.0331% and 2.04%, respectively. The Si-SVR model, SVR model, and Si-PLS model outperform the PLS model in terms of verification results. Although the PLS model is the simplest, its accuracy is relatively poor. Compared with the Si-PLS model and the SVR model, the relative standard deviation RPD value of the Si-SVR model is 2.86, which exceeds 2.0, and the level of its prediction accuracy is high. When the prediction accuracy of soil nitrogen content reaches a satisfactory level, it is preferred as the estimation method.
Figure 7 shows the model used to estimate soil P content based on the modeled sample data.
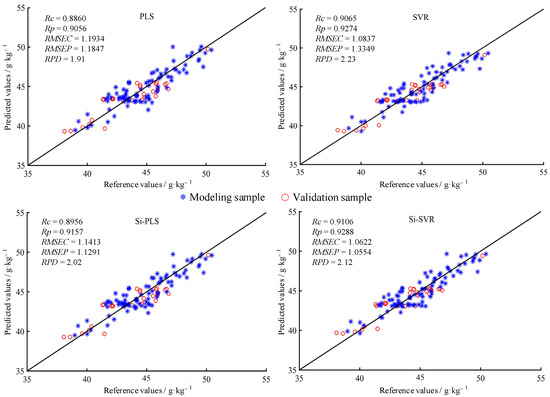
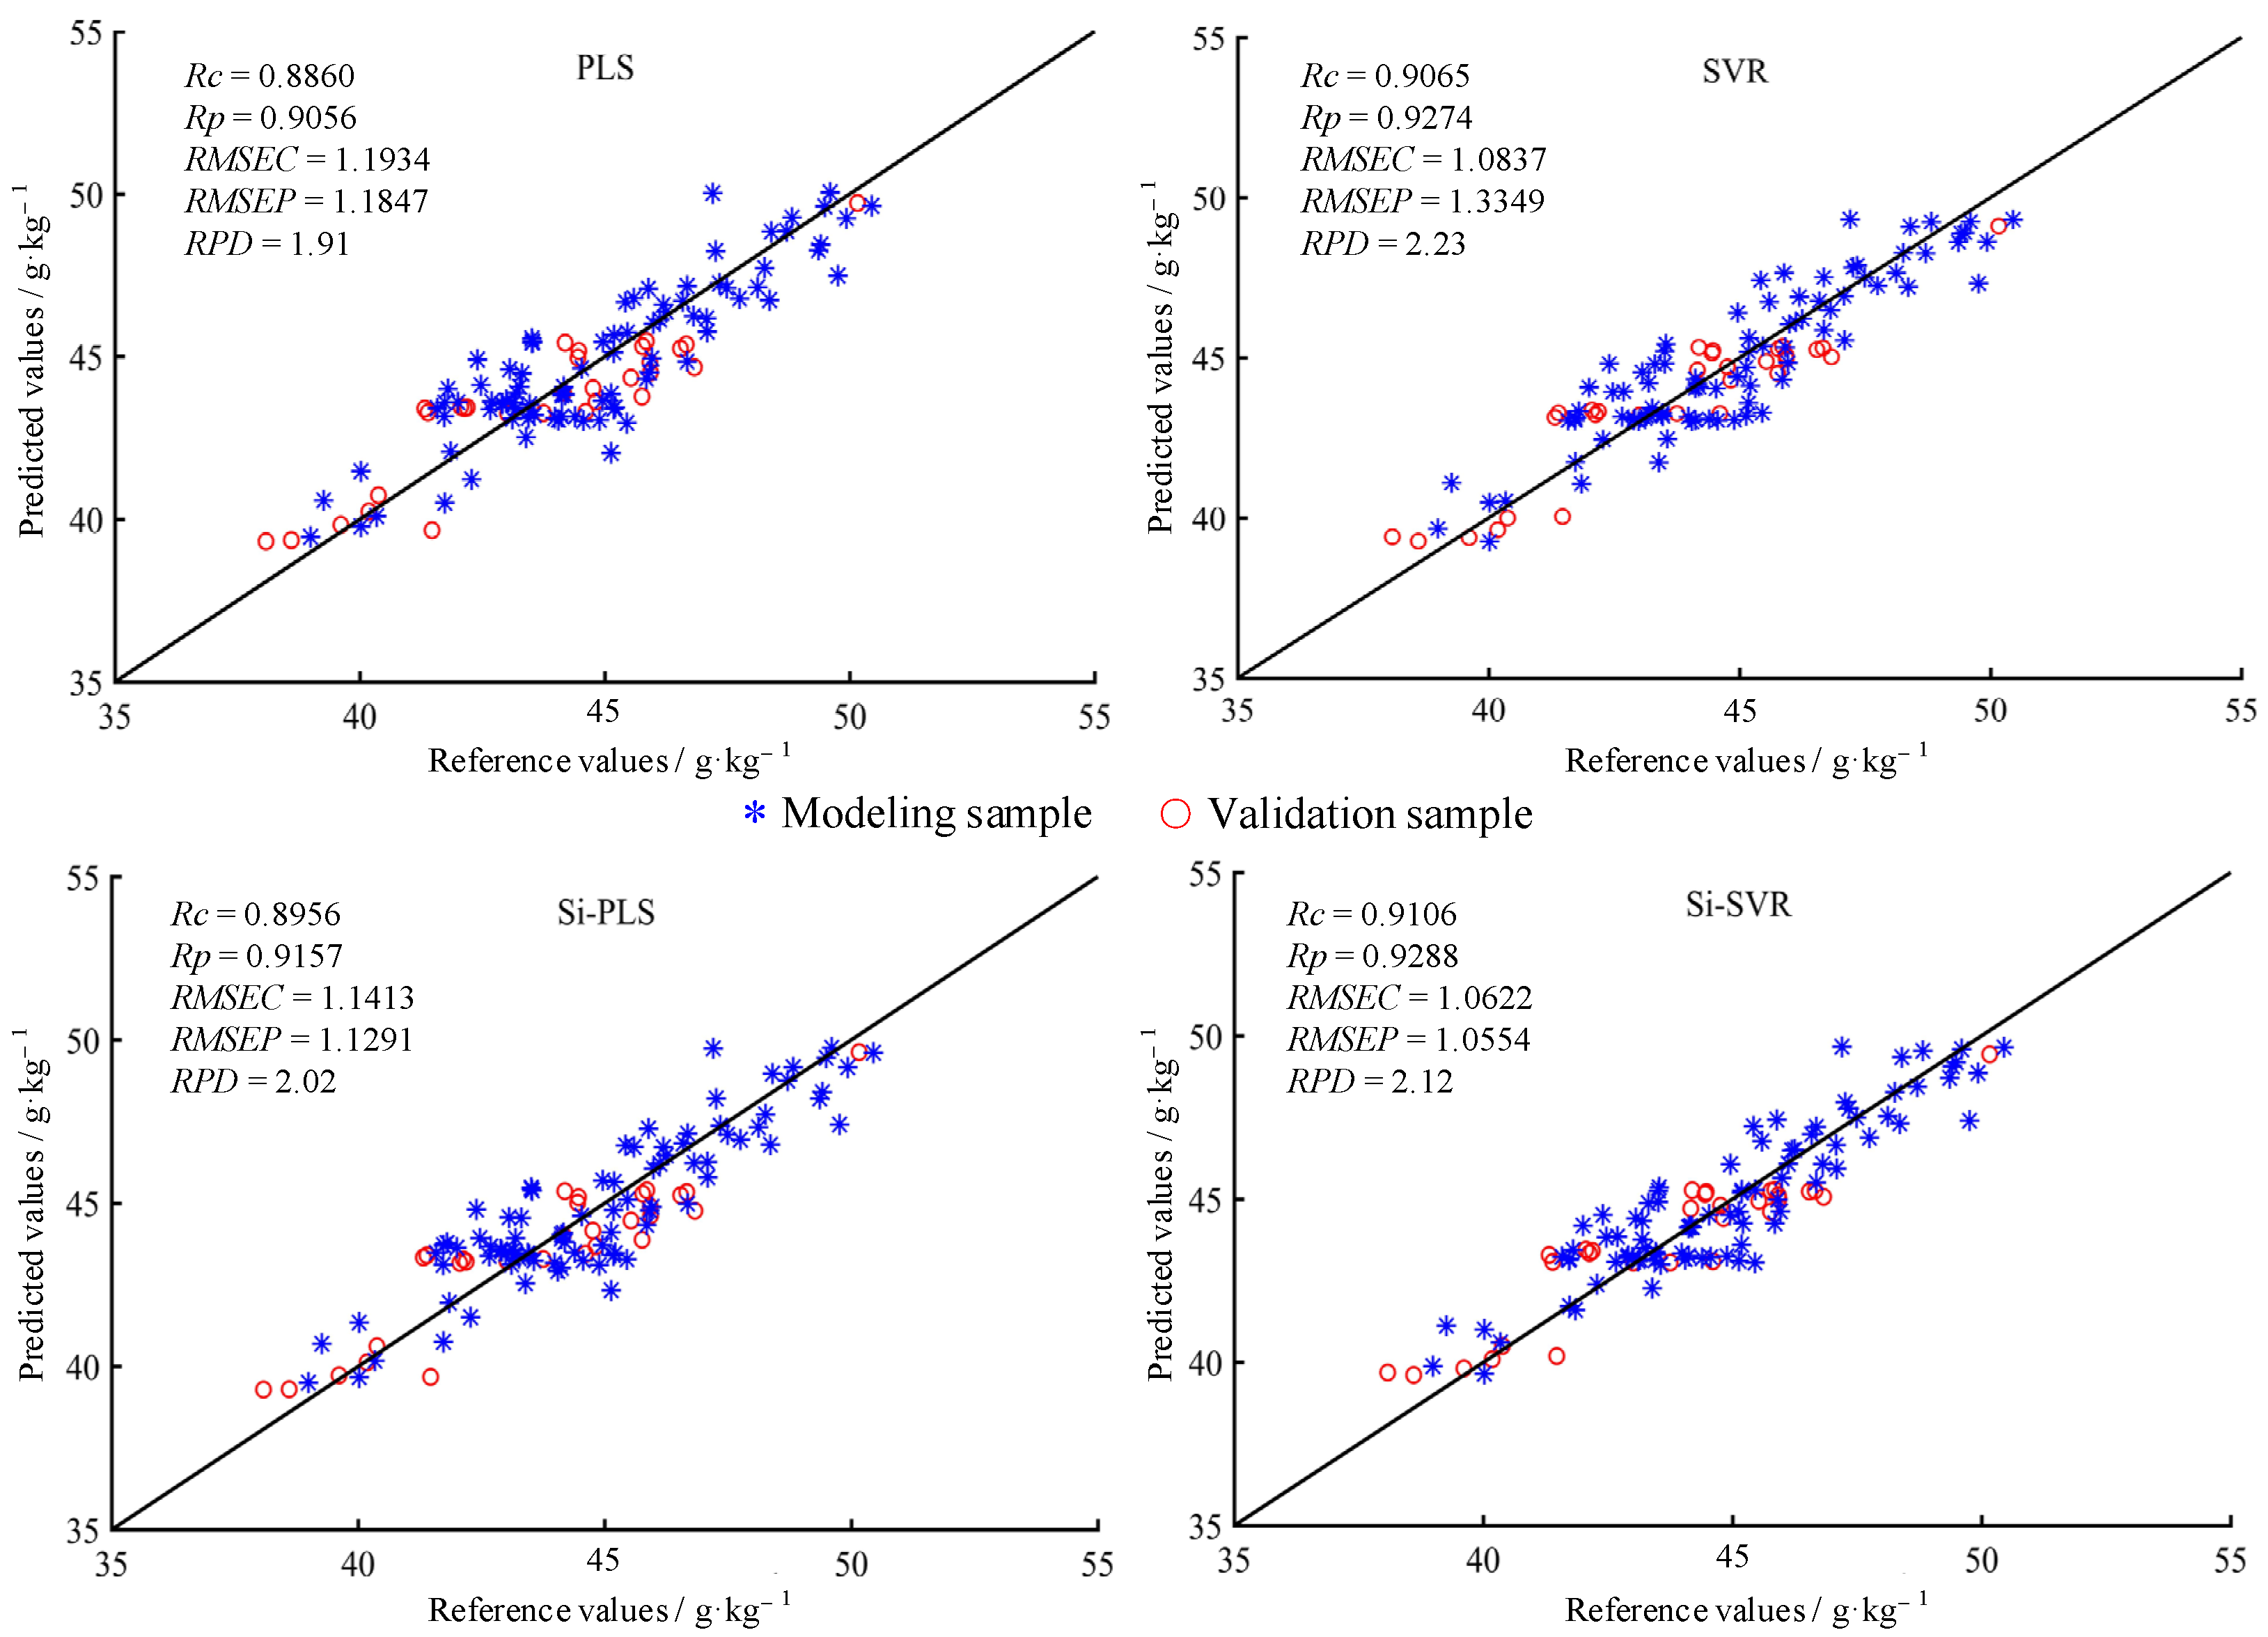
Figure 7.
Scatter plots of measured and predicted values of phosphorus (P) content.
According to the results produced by the hyperspectral prediction model of soil phosphorus content based on regression analysis, the modeling effects of Si-SVR and SVR are highly comparable, with the termination coefficient Rc of Si-SVR modeling being 0.9106 and the RMSEC value being 1.0622%. The determination coefficient Rc value of SVR model modeling is 0.9065, and the RMSEC value is 1.0837%. In terms of model verification effect, SVR model performs best, with RPD being 2.23. The RPD value of Si-SVR model also exceeds 2.0, reaching 2.12. The two models perform well in quantitative prediction effect and achieve a high prediction accuracy for P. When this method can be used to meet the requirement on prediction accuracy for soil available phosphorus content, these two methods are preferable.
The model used to estimate soil K content based on the modeled sample data is shown in Figure 8.
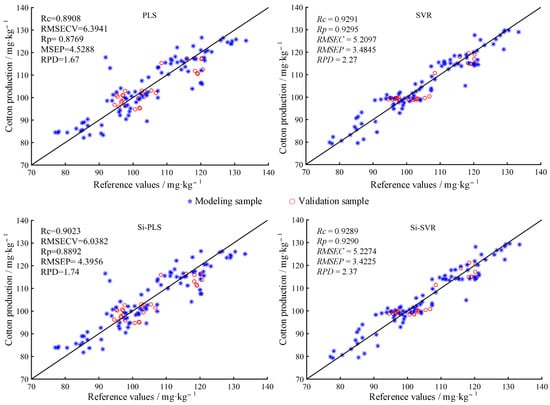
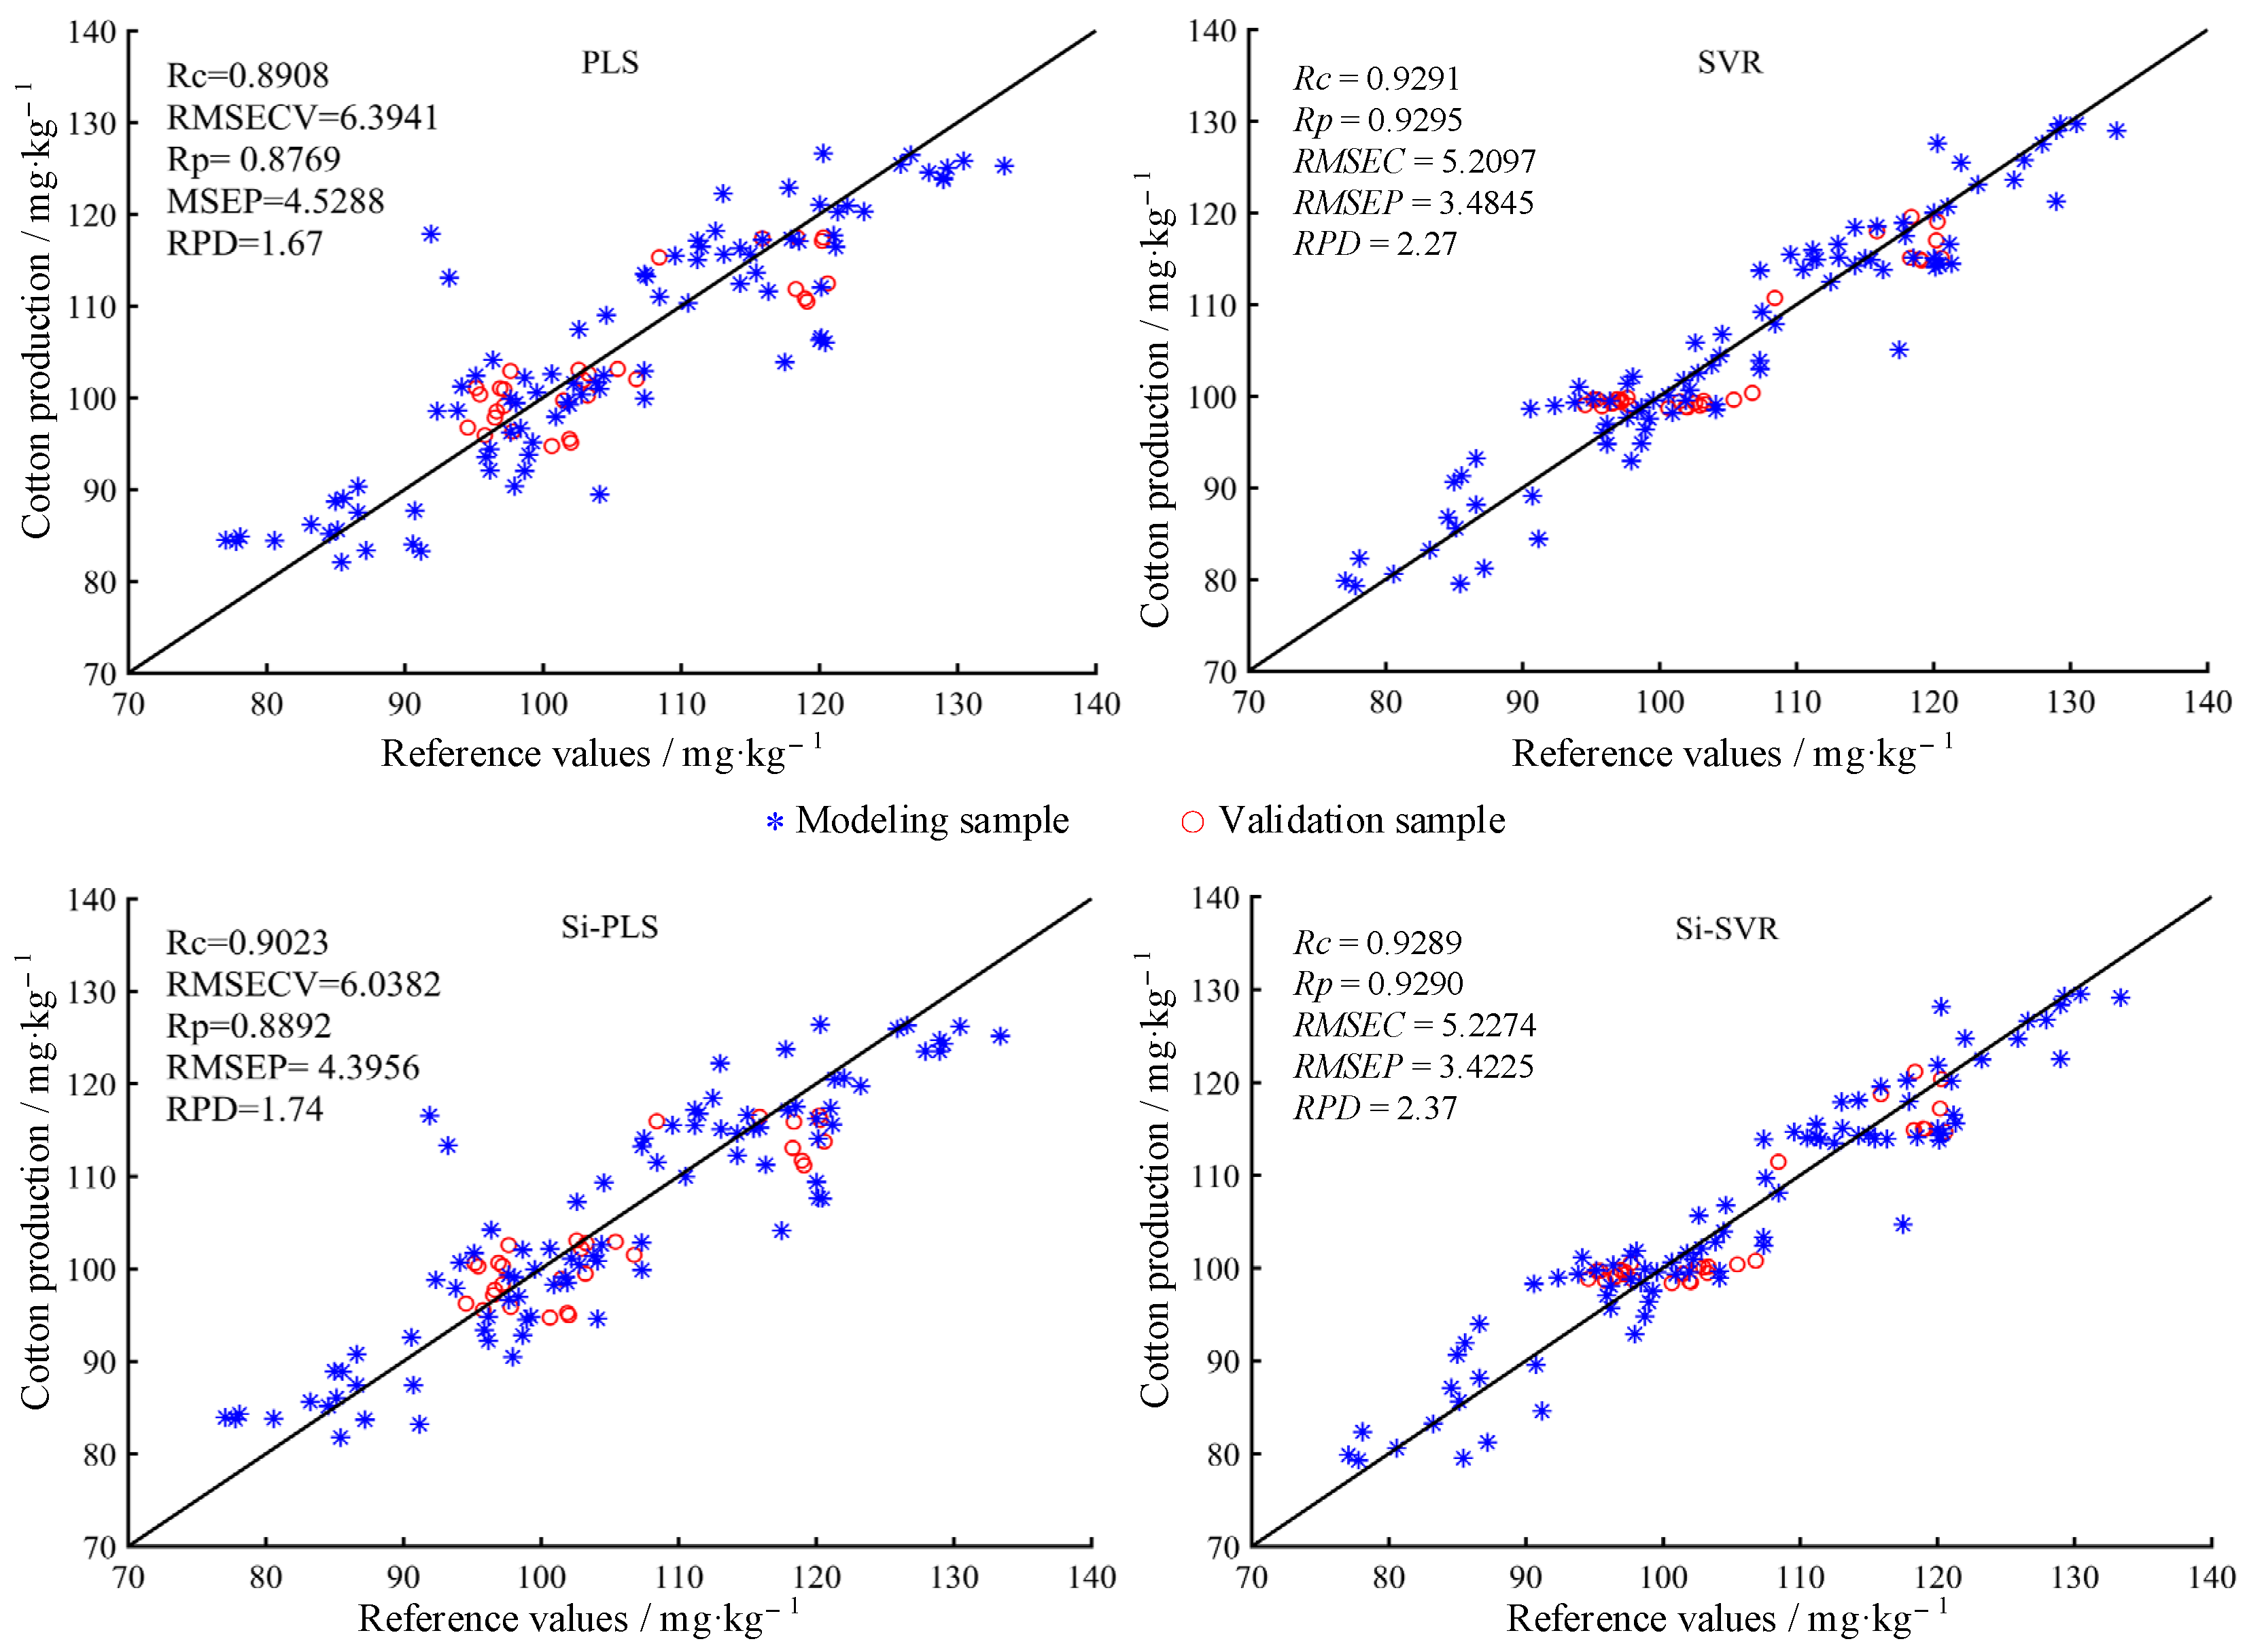
Figure 8.
Scatter plot of measured and predicted values of potassium (K) content.
According to the results produced by the hyperspectral prediction model of soil K content based on regression analysis, the SVR model performs best in modeling effect, with the modeling determination coefficient Rc value being 0.9291 and RMSEC value being 5.2097%. The second-best performer is the Si-SVR model, with the modeling determination coefficient Rc value being 0.9289 and the RMSEC value being 5.2247%. In terms of model verification effect, the Si-SVR model performs best, with the RPD value being 2.37. Despite the simplicity of the PLS model, its accuracy is relatively poor. The validation determination coefficient Rc value is merely 0.8908, while the RMSEP and RPD are 4.5288% and 1.67, respectively. In terms of validation effect, the Si-SVR model, the SVR model, and the Si-PLS model outperform the PLS model. Since the RPD value of the Si-SVR model is higher than that of the Si-PLS model and the Si-SVR model, which is 2.27, exceeding 2.0, and the prediction accuracy is high, this method is preferable when the prediction accuracy of soil available K content is met.
By summarizing the evaluation parameters of the prediction accuracy of soil nutrient content (N, P, and K) estimation models established by using four regression analysis methods, it can be concluded that the SVR model and the Si-SVR model are advantageous in modeling and prediction. However, the Si-SVR model achieves a higher prediction accuracy, which makes it the preferable method for the construction of a soil nutrient prediction model.
4. Conclusions
With the decrease of soil water content, soil spectral reflectance increased nonlinearly. The soil spectrum is largely affected by soil water content, which masks the spectral absorption information of the main soil nutrients (N, P, and K). In this study, the samples were not treated with special water content, and the uniform soil particles naturally dried and sieved were taken as the research object. In addition, integrated PLS, Si-PLS, SVR, and Si-SVR models were adopted to predict the contents of N, P, and K in soil samples. In the stage of spectral preprocessing, the moving average method was used to denoise the measured spectrum.
In this paper, PLS and SVR, as the two most widely used methods of quantitative analysis, were applied to establish the prediction model of soil main nutrient elements (N, P, and K) based on spectral information under laboratory conditions. However, the spectral data carried a lot of information about the samples to be measured, and there was some redundant information in these data. In order to reduce the impact of such information on prediction accuracy while improving the robustness and accuracy of the prediction model, effective wavelength selection was carried out for the full spectrum band. The results show that under the same conditions of data preprocessing, the prediction accuracy of the Si-SVR model was the highest for N and K, with the RPD values reaching 2.68 and 2.37, respectively. The RPD value of the prediction model for P is relatively lower compared to the SVR model, but the RPD of the Si-SVR exceeds 2. In addition, the prediction effect of the model is better. Upon comprehensive comparison, the Si-SVR model is considered better in terms of generalization.
The ultimate purpose of this study is to provide a theoretical reference for the construction of cotton precision fertilization decision-making systems. In practice, there are demanding requirements placed on the timeliness of testing instruments, which means the testing speed must be higher. In this study, an effective model was constructed to predict the main soil nutrients. To sum up, attention should be paid to the timeliness when spectral data are processed, so as to minimize the redundant information of the input model, which is conducive to improving the detection efficiency. Therefore, characteristic band screening and regression model were combined in this study to screen the input original spectra and extract the variables related to soil nutrients as the input information of the model, which significantly reduces the redundant information between variables. On this basis, a high-accuracy prediction model of main soil nutrients was established, which lays a foundation for the research on feasibility of rapid detection of soil nutrients, thus meeting the requirements of precision agriculture.
Author Contributions
This study was conducted jointly by all team members. The work undertaken by each member is as follows: Conceptualization, S.Y.; methodology, S.Y. and H.B.; software, S.Y.; validation, Z.J., W.D. and H.B.; formal analysis, S.Y.; investigation, Z.J.; writing—original draft preparation, S.Y.; visualization, Y.X. and L.Z.; supervision, L.Z.; project administration, W.D.; funding acquisition, Y.X. All authors have read and agreed to the published version of the manuscript.
Funding
This work is funded by the Science and Technology Bureau of Xinjiang production and Construction Corps, the key field science and technology research project No. 2020AB002 (“research and development of cotton sowing, fertilization and mulching combined machine based on Beidou Positioning intelligent control”).
Institutional Review Board Statement
Not applicable.
Informed Consent Statement
Informed consent was obtained from all subjects involved in the study.
Data Availability Statement
The datasets generated and analyzed during the present study have not been published yet, because the data obtained from the experiments in this manuscript remain essential for the follow-up research in the laboratory and constitute a core part of the project to some extent. However, they are accessible from the corresponding authors upon reasonable request.
Acknowledgments
We acknowledge Haoran bu, Zhen Jiang, and Wancheng Dong for their assistance with the soil sampling process. At the same time, we also express gratitude to the key laboratory of Shihezi University for the experimental conditions that allowed us to successfully complete this experiment. Finally, we appreciate the instructor for his constructive comments on the previous version of the manuscript.
Conflicts of Interest
The authors declare no conflict of interest.
References
- Yang, L.P. Characteristics and development of agricultural natural resources in Xinjiang. Xinjiang Agric. Sci. 1989, 01, 34–36. [Google Scholar]
- Statistics Bureau of Xinjiang Uygur Autonomous Region, Xinjiang Statistical Yearbook; Xinjiang Yearbook Publishing: Xinjiang, China, 2021.
- Li, S.T.; Liu, X.Y.; He, P. Analyses on nutrient requirements in current agriculture production in China. Plant Nutr. Fertil. Sci. 2017, 23, 1416–1432. [Google Scholar]
- He, S.; Sun, Y.Y.; Shen, Z.Q.; Wang, K. Advances in coupling big data technique with nutrient site-specific management: Scheme, methods and outlook. Plant Nutr. Fertil. Sci. 2017, 23, 1514–1524. [Google Scholar]
- Lu, F.; Jianlong, D.; Liwen, T.; Huijun, Z.; Weijiang, L.; Dong, H. Review of the technology for high-yielding and efficient cotton cultivation in the northwest inland cotton-growing region of China. Field Crops Res. 2017, 208, 18–26. [Google Scholar]
- Lai, B.; Yang, M.R.; Chai, Z.P.; Chen, B.L.; Li, Q.J.; Dong, J.H.; Wang, F.; Tian, C.Y. Investigation and evaluation of the chemical fertilizer application situation of farmland in Xinjiang. Arid. Zone Res. 2014, 31, 1024–1030. [Google Scholar]
- Song, C.X. Techniques of reducing fertilizer quantity while increasing its efficiency through cotton water–fertilizer integration for cotton in Luntai County, Xinjiang. Appl. Eng. Technol. 2021, 41, 38; 40. [Google Scholar]
- Lin, Y.; Xia, Z.; Encai, B.; Jianshe, L.; Zhirong, Z.; Kai, C. Bio-organic fertilizer with reduced rates of chemical fertilization improves soil fertility and enhances tomato yield and quality. Sci. Rep. 2020, 10, 177. [Google Scholar]
- Rani, P.; Rao, C.P.; Kumari, A.L.; Rao, P.J.; Prasad, P.R.K. Yield and Fiber Qualities of Cotton (Gossypium hirsutum) as Influenced by long-term Manures and Fertilizers on Cotton Mono-Cropping. Agric. J. 2017, 64, 120–122. [Google Scholar]
- Yongsheng, H.; Yiyun, C.; Lei, Y.; Yanfang, L.; Yaolin, L.; Yong, Z.; Yi, L.; Hang, C. Combining Fractional Order Derivative and Spectral Variable Selection for Organic Matter Estimation of Homogeneous Soil Samples by VIS–NIR Spectroscopy. Remote Sens. 2018, 10, 479. [Google Scholar]
- Yang, Y.C.; Zhao, Y.J.; Qin, K.; Yang, C.; Zhang, D.H.; Cui, X. Prediction of black soil nutrient content based on airborne hyperspectral remote sensing. Trans. Chin. Soc. Agric. Eng. 2019, 35, 94–101. [Google Scholar]
- Wang, S.F.; Cheng, X.; Song, H.Y. Analysis of the effect of moisture on soil organic matter determination and anti-moisture interference model building based on vis-nir spectral technology. Spectrosc. Spectr. Anal. 2016, 36, 3249–3253. [Google Scholar]
- Zhang, Z.P.; Ding, J.N.; Zhu, C.M.; Wang, J.Z.; Ma, G.L.; Ge, X.Y.; Li, Z.S.; Han, L.J. Strategies for the efficient estimation of soil organic matter in salt-affected soils through Vis-NIR spectroscopy: Optimal band combination algorithm and spectral degradation. Geoderma 2021, 382, 114729. [Google Scholar] [CrossRef]
- Wu, C.W.; Zheng, Y.; Yang, H.; Yang, Y.; Wu, Z.Y. Effects of different particle sizes on the spectral prediction of soil organic matter. Catena 2021, 196, 104933. [Google Scholar] [CrossRef]
- Divya, Y.; Sanjeevi, S.; Ilamparuthi, K. A study on the hyperspectral signatures of sandy soils with varying texture and water content. Arab. J. Geosci. 2014, 7, 3537–3545. [Google Scholar] [CrossRef]
- Liu, Y.; Pan, X.Z.; Wang, C.K.; Li, Y.L.; Shi, R.J. Predicting Soil Salinity with Vis–NIR Spectra after Removing the Effects of Soil Moisture Using External Parameter Orthogonalization. PLoS ONE 2015, 10, e0140688. [Google Scholar] [CrossRef] [Green Version]
- Yu, L.; Hong, Y.S.; Zhu, Y.X.; Huang, P.; He, Q.; Qi, F. Removing the effect of soil moisture content on hyperspectral reflectance for the estimation of soil organic matter content. Spectrosc. Spectr. Anal. 2017, 37, 2146–2151. [Google Scholar]
- Cao, Y.; Bao, N.S.; Liu, S.J.; Zhao, W.; Li, S.M. Reducing moisture effects on soil organic carbon content prediction in visible and near-infrared spectra with an external parameter othogonalization algorithm. Can. J. Soil Sci. 2020, 100, 253–262. [Google Scholar] [CrossRef]
- Ge, Y.F.; Morgan, C.L.S.; Ackerson, J.P. VisNIR spectra of dried ground soils predict properties of soils scanned moist and intact. Geoderma 2014, 221–222, 61–69. [Google Scholar] [CrossRef]
- Ji, W.; Viscarra Rossel, R.A.; Shi, Z. Accounting for the effects of water and the environment on proximally sensed vis- NIR soil spectra and their calibrations. Eur. J. Soil Sci. 2015, 66, 555–565. [Google Scholar] [CrossRef]
- Ackerson, J.P.; Demattê, J.A.; Morgan, C.L. Predicting clay content on field-moist intact tropical soils using a dried, ground VisNIR library with external parameter orthogonalization. Geoderma 2015, 259–260, 196–204. [Google Scholar] [CrossRef]
- Peng, X.; Xu, C.; Zeng, W.Z.; Wu, J.W.; Huang, J.S. Elimination of the soil moisture effect on the spectra for reflectance prediction of soil salinity using external parameter orthogonalization method. J. Appl. Remote Sens. 2016, 10, 015014. [Google Scholar] [CrossRef]
- Zhang, Y.; Li, M.Z.; Zheng, L.H.; Zhao, Y.; Pei, X.S. Soil nitrogen content forecasting based on real-time NIR spectroscopy. Comput. Electron. Agric. 2016, 124, 29–36. [Google Scholar] [CrossRef]
- An, X.F.; Li, M.Z.; Zheng, L.H.; Sun, H. Eliminating the interference of soil moisture and particle size on predicting soil total nitrogen content using a NIRS-based portable detector. Comput. Electron. Agric. 2015, 112, 47–53. [Google Scholar] [CrossRef]
- Bao, S.D. Soil Agrochemical Analysi, 3rd ed.; China Agriculture Press: Beijing, China, 2000. [Google Scholar]
- Noda, I. Generalized 2-dimensional correlation method applicable to infrared, raman, and other types of spectroscopy. Appl. Spectrosc. 1993, 47, 1329–1336. [Google Scholar] [CrossRef]
- Cai, L.H.; Ding, J.L. Wavelet transformation coupled with CARS algorithm improving prediction accuracy of soil moisture content based on hyperspectral reflectance. Trans. Chin. Soc. Agric. Eng. 2017, 33, 144–151. [Google Scholar]
- Chu, X.L. Chemometric Methods and Molecular Spectroscopic Analysis Techniques. Molecular Spectroscopy Analytical Technology Combined with Chemometrics and Its Applications; Chemical Industry Press: Beijing, China, 2013. [Google Scholar]
- Haiyan, S. Soil NIR Spectroscopy; Chemical Industry Press: Beijing, China, 2013. [Google Scholar]


Publisher’s Note: MDPI stays neutral with regard to jurisdictional claims in published maps and institutional affiliations. |
© 2022 by the authors. Licensee MDPI, Basel, Switzerland. This article is an open access article distributed under the terms and conditions of the Creative Commons Attribution (CC BY) license (https://creativecommons.org/licenses/by/4.0/).