1. Introduction
Regarding recent requirements for consumer electronics in multimedia communications, applications of display technologies and communication devices have rapidly become universal. It has led to various digital products, such as personal computers, notebook computers, and smartphones, and the rise of software and hardware industries, and supply chains. In recent years, stereo vision, immersive experience, and real-time reception of visual information of virtual reality (VR) and augmented reality (AR) have gained popularity in the general public and manufacturing industries. HMD is considered to have the most potential as the computing and communication platform for the next generation [
1,
2,
3]. Compared with the most popular computing platforms on the market, like personal computers and smartphones, the optoelectronics industry is remarkably important in regards to VR/AR HMD products, due to this industry’s advantages in optical design architectures [
4]. The VR/AR HMD, which is an optical device combining optical lenses and binocular displays, can offer a wide range of visual fields and information in the form of stereoscopic images. However, it is highly reliant on human visual perception and customized design.
Although both VR and AR HMD are virtual imaging devices, there are still some application and design differences. Among them, VR mainly focuses on the immersive experience. Therefore, to ensure the user enters the virtual world as entirely as possible, a larger field of view (FOV) is applied to cover the user’s entire field of view [
5,
6,
7,
8,
9]. The soft black materials, such as sponges, silicone gaskets, soft plastics, etc., are displayed in the non-display area to avoid ambient light interference. Commercially available VR HMDs generally cover most of the user’s field of view with a display range, and the display panel is placed directly in front of the user’s eyes. Many recent studies have shown that VR can be applied in various fields to improve the quality of human life. In medicine [
10], VR training was applied for medical staff to improve techniques and training regarding the correct use of medical equipment, with safety and health in mind. For education, it could be used for sketching and modeling in an immersive environment to introduce modeling concepts and increase understanding of the spatial connection between an object and its 2D projections [
11]. VR has been adopted in inclusive teaching to simulate difficulties, and has been beneficial to deliver materials more engagingly and easily gather required information for dyslexic students [
12]. VR technology in cultural heritage preservation, with gesture interaction-based technology, could achieve the advantages of touchless, distant interaction of users with reconstructed artifacts [
13]. Moreover, most applications pertain to human–computer interaction technology, with VR as the interface between computer technology and people as users [
14,
15,
16]. AR display is based on real-world environmental information with superimposed auxiliary input on display as the core of the application. Thus, the display panel, or light engine module, is placed above, or on the left or right side, of the user’s eyes according to its application, cost, and volume, its counterweight and position, and other inherent constraints, to prevent obscuration of the field of view. Commercially available AR display architectures are usually presented in the form of transparent displays (the transmittance of the ambient light adjusted according to optical efficiency and image contrast) and a small FOV, less than 40 degrees [
17].
From the viewpoint of vision and optics, regardless of the difference in the visual field of view and light transmittance provided by VR and AR, VR/AR HMD still face lots of common problems, such as vergence-accommodation conflict (VAC), screen door effect (SDE) [
18], image distortion [
19], pupil swim, small eye-box [
20], stray light interference, chromatic dispersion, non-uniform color and brightness [
21], latency [
22], cybersickness, motion sickness [
23,
24], etc. Due to their larger field of view, VR users may more easily encounter these phenomena. Hence, image quality variance, influence, and acceptance of VR HMD on human visual perception are worthy of attention, research, and discussion and are expected to extend the experience of AR display applications.
The VR viewing optical module is the most critical core in the VR HMD system, and the control of optical quality is essential to ensure visual quality. There have been many types of research and well-established standard documents in the consumer electronics industry to control optical quality in camera modules. Signal receivers are the most fundamental differential factor when comparing camera modules with VR. Digital camera modules have a charge-coupled device (CCD), or complementary metal oxide semiconductor (CMOS), and the captured signal can be further processed by the software and firmware, based on the requirements and image location, to perform noise suppression and make other adjustments. For the visual optics of VR, the signal receiver is human vision. The eyeball can passively receive all the light from the output of the VR viewing optical module. The human eye contains a series of physiological reflexes. The eyeball has the ability to accommodate the amount of incident light, to focus on different image surfaces of more than ten centimeters to infinity, tremble unconsciously, and can quickly scan an entire visual field of images [
25,
26,
27,
28,
29]. These differences bring difficulties in detecting and suppressing stray light when producing VR display modules.
Stray light generally refers to all rays generated along unexpected paths in an optical system or light noise that is not required by the system, usually caused by multiple interface reflections, refractions, or material scattering. Most of today’s HMDs use a Fresnel lens with a convex lens function as the imaging lens, which increases refractive power, reduces weight, reduces volume, and saves a lot of material costs. However, in the mass production of the Fresnel sawtooth structure, in addition to the expected loss of optical efficiency caused by the ineffective surface, there is also the problem of connection surface inclination. It increases the light-receiving area of the ineffective area, thus resulting in more ineffective stray light generation. When the shape of the sharp corners of the Fresnel sawtooth is farther from the ideal sharp point, the more stray light is generated. The stray light produced by the Fresnel lens is very easy to detect, especially when the brightness and contrast of the showing pattern are relatively high. Therefore, it is dubbed, by VR developers and consumers, as God’s rays or the ring effect.
Observing the current development trends of many electronic products, it is not difficult to infer that there will inevitably be an increasing expectation for better optical system performance in the requirements of visual optical modules. According to the Fresnel equation [
30], it can be expected that the qualitative and quantitative aspects of stray light will become too important to be ignored with increase in the complexity of lenses, films, and other components of visual optical modules and optical transmission interfaces in the future [
31].
The performance of optical imaging systems will be reduced due to the intrusion of stray light from inside and outside of the system’s field of view. Most research results have contributed to the camera [
32,
33,
34,
35,
36]. ISO 12231 standard clearly describes the source of stray light in the field of electronic imaging. It could be foreign material between the light source and the lens, such as fog, dirt on the windshield or lens surface, inter-reflection from the surface of optical components, non-uniformity, which can be reduced by an anti-reflection (AR) coating. Stray light might also be induced by the lens, aperture, shutter, and the parts of the exposure mechanism in the camera, spherical and coma aberration from the lens, and light leakage from the system.
Previous studies have designated various types of stray light generated by different characteristics, such as lens flare, aperture ghosting, and veiling glare, with quantitate standards, such as ISO 9358 [
37], ISO 18844 [
38], and IEC 62676-5 [
39]. The following articles revealed the adverse effects of stray light in different optical systems, and corresponding improvement methods were proposed. The stray light of the optical viewing system from a helmet-mounted display might distract visual attention. Therefore, the far-field model in optical simulation was adopted to search out the position where the light source’s transmission path for the image and the glare were separated to further shield it [
40]. For astronomical or surveillance camera systems, which are often placed outdoors, glare due to water droplets attached to the lens surface is likely to blur the image. The entrance position of the light attached by water droplets could be detected and closed by placing an LCD on the position of the camera’s light barrier as a shutter array [
41]. Using a light-field camera to capture 4D light field instead of general 2D image photography could effectively eliminate stray light signals of various light-emitting positions and apply image synthesis to remove the stray light of the original 2D image [
42].
Compared with the stray light of a camera that could be blocked with physical shielding, absorption, light reduction, polarization control, and image signal processing to suppress stray light for post-processing of images, the research methods for VR/AR stray light are more limited. Some researchers designed the VR optical module based on the architecture of polarized catadioptric optics. In the simulation software, an ideal lens without aberrations was utilized instead of the human eye, and the image surface was used as a simplified retina. The analysis was carried out based on the three primary ghost paths caused by interface reflection and fitting problems of the degree of polarization. The light spot’s size on the image surface of the ghost image was considered in the function for curved surface optimization so that the stray light energy was evenly distributed as low noise during the imaging of the human eye’s retina and this reduced the chance of its being noticed [
43].
At present, the primary sources of stray light in VR are all generated within the effective diameter from the lens of the optical system. Since the image light source and the stray light source have different light emission positions, there is still no way to optimize through image processing.
Therefore, designing a fast and efficient stray light detection method, based on human perception, was the primary purpose of this research. The study combined psychophysical experiments and image-based measurements from three VR devices to establish a set of stray light detection methods based on visual perception. The stray light threshold can be clearly defined by introducing human factors and applying artificial intelligence (AI). It can also be used to design measurement equipment and provide optimized parameters for the VR viewing optical designer when setting the merit function with a goal. The study makes the quantitative evaluation of stray light a critical indicator of image quality and VR/AR content design.
2. Methods
A total of 40 observers, corrected for hyperopia, or near-sightedness, participated in the study. Their binocular parallax was limited to not more than 200° to avoid the different image problems induced by a significant difference in spectacle lens magnification. The observers, 22 males and 18 females, that were recruited had experience in more than two VR HMDs. They were aged between 23 to 35 years of age and had normal color vision. To ensure the accuracy of the experiment, the day before the task, the observers were required to avoid alcohol abuse, excessive caffeine intake, staying up late, etc. Any glasses worn were not to have an anti-blue light function, and contact lenses were to be without dilated pupils or embedded with any style of pattern.
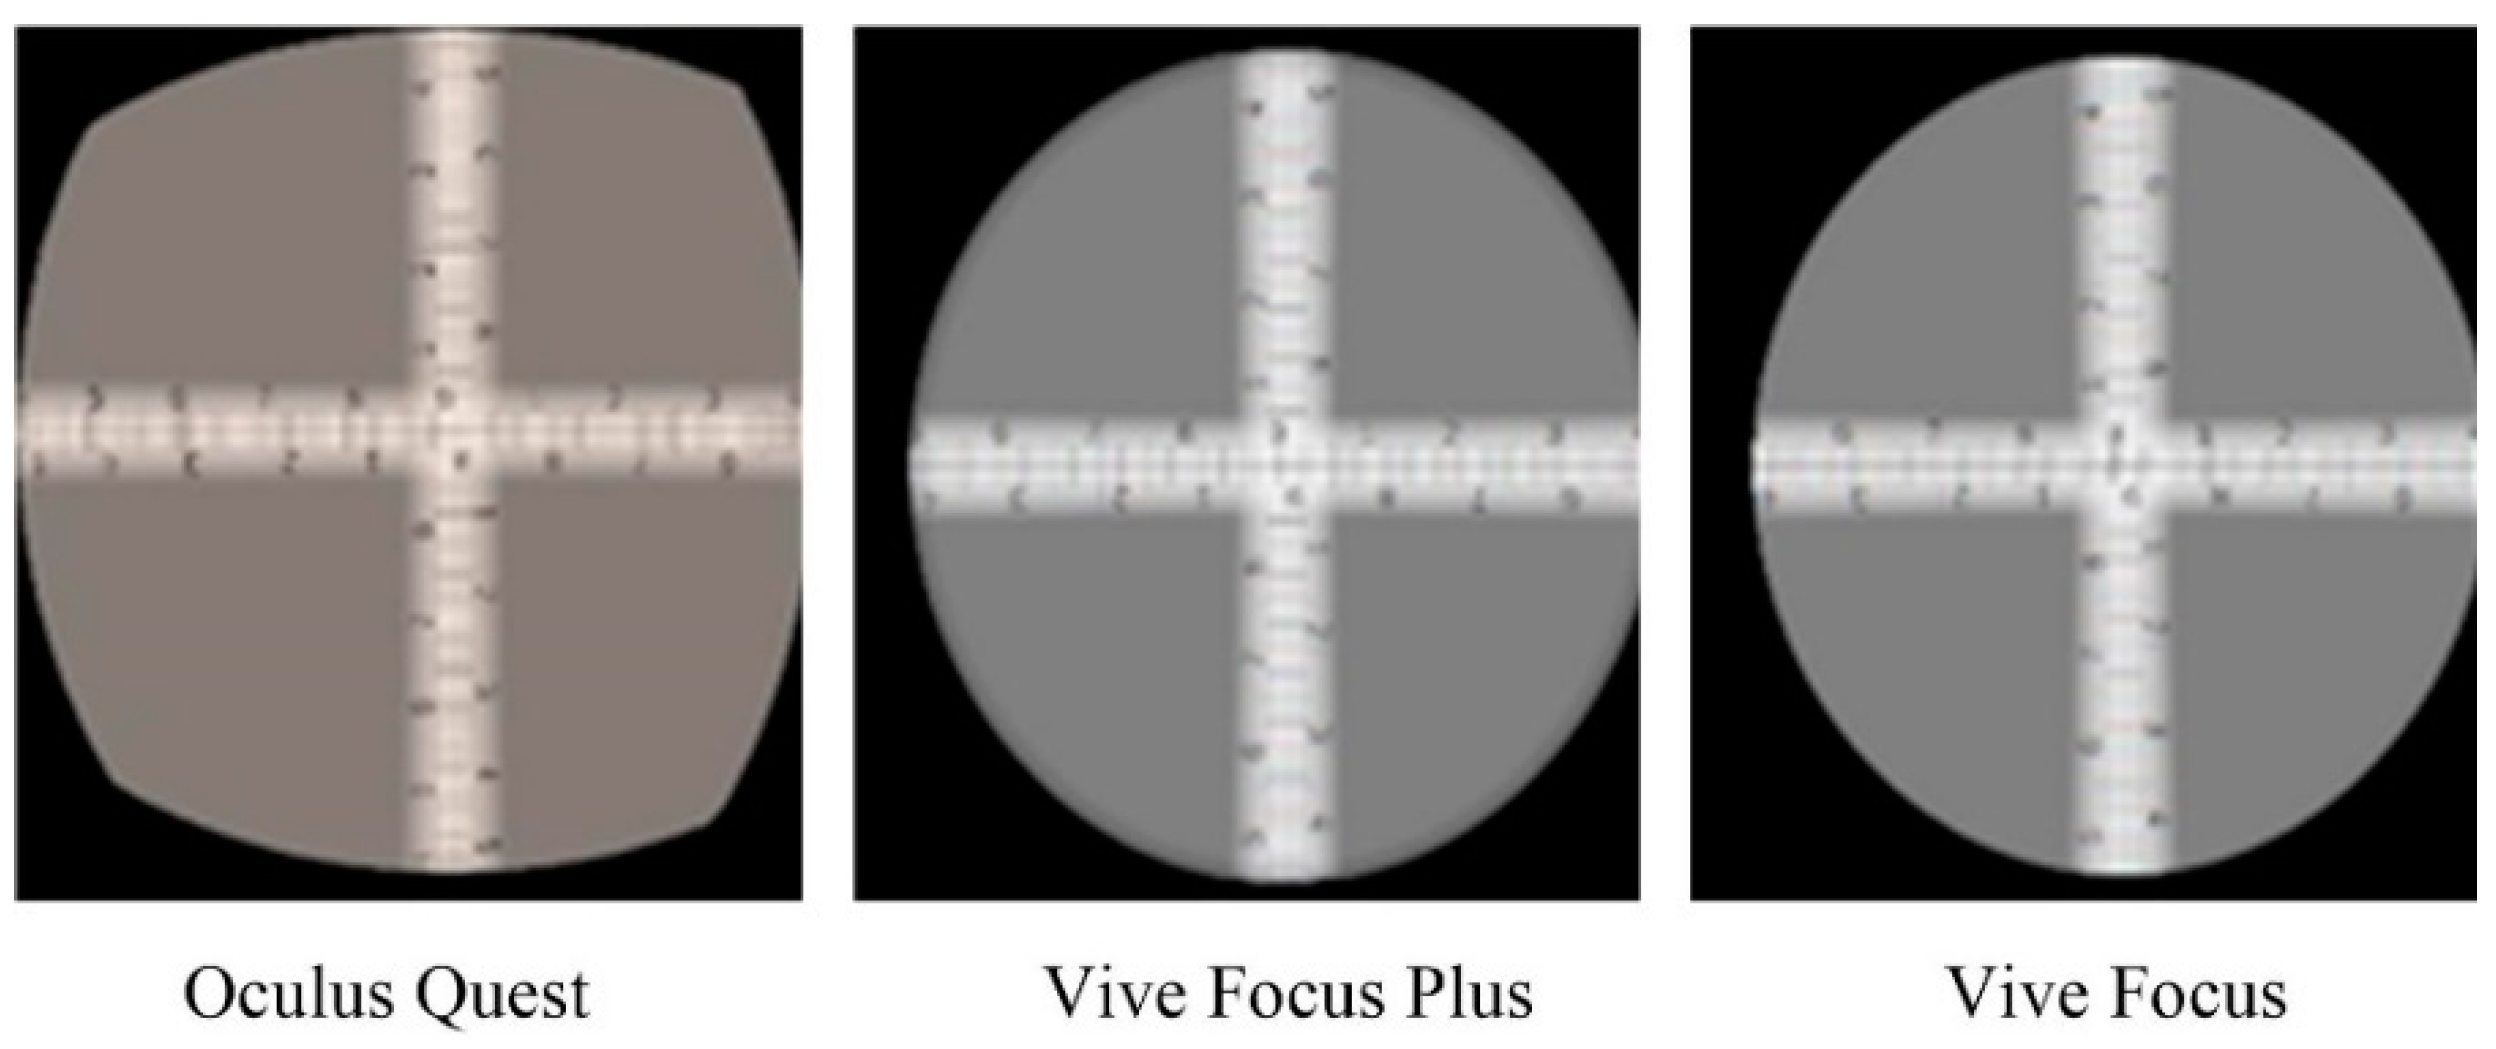
In the psychophysical experiment, three kinds of VR HMDs were selected, as shown in
Figure 1: Oculus Quest, Vive Focus Plus, and Vive Focus. The VR viewing optical modules of these three devices were all designed with Fresnel lenses. The monocular display module was an OLED display with a resolution of 1440 × 1600 pixels. The advantage of the VR HMD with an OLED display as the light source was that the partial black background image would not have the problem of light leakage from the LCD backlight module, so the experiment could eliminate the stray light generated by the display element itself. The measurement was carried out by capturing the image of the VR viewing optical module. The FOV of the current mainstream VR HMD viewing optical module is about 110°, so the FOV range to be obtained in the experiment had to be at least greater than or equal to that. Therefore, a wide-angle lens (Theia ML-183-M) with a horizontal field of view (HFOV) of up to 115° was used with a C-mount industrial camera (IDS UI-3590CP-C-HQ). The power and the operation of the camera were controlled by the USB port of a personal computer. The experiment and measurements were conducted in a low-light dark environment with a temperature of 25 °C and a humidity of 60%.
Three independent variables containing stimuli were investigated in the research to better know how they affect the threshold of stray light perceived by the observer: visual field, grayscale, and the VR HMD device. The stimulus of the visual field was the radius of the light source displayed on the image. The size of the stimulus was defined by adding the inside and outside diameter pixels and dividing by 4. For example, the circle image number of the largest visual field stimulus was 750 ((1550 pixels of outside diameter + 1450 pixels of inside diameter)/4), as shown in
Figure 2. Sixteen ring patterns, with sizes varying from 0 to 750, were acquired, and the difference between the inside and the outside diameter was 50 pixels.
Figure 2 illustrates the images with different visual field stimuli. For grayscale stimuli, all the color depths of the VR HMDs were 8-bit RGB values, and, thus, 20 grayscales, ranging from 10 to 200, with ten intervals were designed and are shown in
Figure 3. The test image background was set as 0 to exclude the stray light from the device itself. Both visual field and grayscale stimuli were controlled by the images presented on the VR HMD. In addition, the dependent variable was the threshold of the stray light perceived by the human eye. According to the observer’s subjective evaluation, the visible stray light’s grayscale value was recorded for each stimulus with different independent variables.
In total 960 images (16 stimuli visual field × 20 stimuli grayscale × 3 VR HMD devices) with a resolution of 1600 × 1600 pixels were tested in the experiment. The information on the parameters is listed in
Table 1. The image VR content from three devices was identical and established by Oculus and Vive Wave software development kit (SDK) with Unity 3D engine. Before starting the experiment, the observers were invited to a completely dark room and adapted to the environment for 10 min. After the adaptation, an experimental assistant helped the observers accurately wear the VR HMD and explained the testing procedure and the points for attention, such as switching the images, recognizing the stray light, and responding.
From
Figure 4, the observer’s HFOV was determined by assessing the range of visible scale from the rendering pattern on VR HMD. To ensure consistency, the HFOV of each observer was recorded before the judgment and measured after completing all evaluations, and the difference was to be less than 1 degree. By comparison, the stability of wearing VR HMD could be verified. For the stray light assessment, the value of stimuli of grayscale was shown from high to low, and the observers were asked to respond if stray light was present on the image. The staircase method, which has been widely applied in psychophysics, was adopted to obtain the just noticeable difference (JND) as the threshold. The method is an adjustment and adaptation method. The principle is to increase or decrease the signal strength of a fixed gradient so that the observer repeatedly evaluates the signal strength of JND until the subject answers the JND level, which has been converged and stabilized as the observer’s perceptual threshold. A full-screen image with R, G, and B values equal to 15 was displayed for one minute between two test images to eliminate the visual afterimage.
3. Results
The 40 observers completed the experiment according to the above experimental procedure. This study separately recorded the HFOV data and the threshold value of just noticeable stray light when using three VR HMDs. The coefficient of variation (CV) was primarily adopted to estimate the inter-observer variability to investigate the agreement between two data sets. The larger the CV value the poorer the deal. The CV values were formulated as Equation (1) for estimating the inter-observer variability. In the equation, Δ
V is the estimation of a stimulus from an individual observer, Δ
E is the geometric mean of Δ
V from all observers, and
is the arithmetic mean of all evaluated stimuli
N. The scaling factor
f was used to adjust the data between Δ
V and Δ
E. Fleiss’ kappa was also used to analyze the level of agreement in the judges between the observers.
Table 2 shows the mean results of the observer variability for each VR HMD. The values of Fleiss’ kappa were 0.671, 0.851, and 0.784 for Oculus Quest, Vive Focus Plus, and Vive Focus and showed good levels of inter-rater agreement. The visual response was analyzed by ignoring the data in which the observer’s CV value was larger than 20%. Hence, the valid data were 93%, 95%, and 85% sets for Oculus Quest, Vive Focus Plus, and Vive Focus, respectively.
The max rendering HFOV of three VR HMDs could be found by a free development software called Vysor, where the Oculus Quest was 92°, Vive Focus Plus was 80°, and Vive Focus was 79°, as shown in
Figure 5. It could be found that even though the three VR HMDs utilized OLED displays with the same size and resolution, the scales and proportions on the screen were different. There were still apparent differences in design and adjustment between the lens and the display. This phenomenon was also reflected in the subject’s actual HFOV size, as shown in
Figure 6. Based on the magnitude reported by most observers, the average HFOVs practically experienced by Oculus Quest, Vive Focus Plus, and Vive Focus were 74°, 73°, and 72°, respectively. The Oculus Quest was the furthest from the theoretical value provided, with a difference of up to 18°, and Vive Focus was 7° between the actual and theoretical values. The phenomenon might have been caused by the distortion of the lens optical design, the matching degree of the eye-box and the user’s eye relief, the size of the black area on the edge of the display, and the different adjustments of Frustum.
The mean threshold of stray light for three kinds of VR HMD devices afterimage with different visual field sizes was analyzed with acceptable visual data, which passed the observer variability exam, as shown in
Figure 7. The results indicated that Oculus Quest reached the maximum number of stimuli visual field, whereas the number for Vive Focus Plus and Vive Focus was equivalent. In the experiments regarding Vive Focus Plus and Vive Focus, some image scenes directly exceeded the image display range that most subjects could observe, such as 650, 700, and 750. Therefore, only the data from 0 to 600 were finally retained. By comparing the overall image output performance, the higher stray light threshold meant that the observer felt more challenged to detect the stray light, even though the three VR HMDs had an essential difference in display luminance conditions. The difference might be caused by the lens design, correction method, pre-set luminance, frame rate, etc. From
Figure 6, it can be seen that Vive Focus Plus had a higher threshold on average, and Oculus Quest had a higher point in parts of the visual fields. However, Vive Focus showed a low threshold in each visual field. The performance seemed to be in accord with the trend of product innovation over time. Additionally, the comparison of Vive Focus Plus and Vive Focus with similar HFOV showed that their stray light distribution characteristics were almost opposite. The visual field of Vive Focus with a higher value was around 250, while the position represented the lower area of Vive Focus Plus. Hence, discussing whether there is a correlation between different models of VR HMDs has no apparent physical meaning when concerning the correlation between HFOV and stray light threshold.
4. Modeling
The stray light evaluation model is a calculation mechanism that further connects the stray light threshold obtained from psychophysical experiments with the image data taken by the camera to generate a corresponding relationship. It is the final critical step in establishing a stray light detection method based on human perception. This section describes the feature selection and extraction of the image, training, and performance in detail to establish the stray light evaluation model. The approach of feature extraction in image processing is shown in
Figure 8.
By applying an image processing algorithm, the outside radius and gray level of circular stimuli, gray level, and standard deviation of the stray light image were extracted as the machine learning model’s inputs to conduct the learning procedure. The outside radius and the gray level of stimuli were selected because they are the independent variables of the psychophysical experiment. The gray level and standard deviation of stray light were selected because there may be stray light outside the area presented by the image pattern, but the human eye may be unable to detect it. In addition, using the standard deviation of stray light concerns the concept of stray light contrast.
The following steps obtained the features of the stray light image. First, we resized the input images to 419 × 368 pixels with cubic interpolation and selected a region of interest (ROI) in which half the width and height was 184 pixels from the central point, respectively, to avoid the impacts of lens distortion. After selecting the ROI, the following procedures focused on acquiring the masks of the stimuli and stray light region, which are complementary in relation, and then multiplying the masks with the original image to separate the stimulus image and the stray light image. Second, we converted the original images to YCbCr color space and obtained the grayscale image (Y channel). After applying histogram equalization for image enhancement to increase the global contrast, the image was processed by edge detection and binary thresholding. A Canny edge detector found the edges with thresholds of 250 and 100 for the upper and lower limits to exclude the non-edge pixels. Since the edge detected by the Canny algorithm is discontinuous, it would obviously influence subsequent contour retrieval. Therefore, morphological image processing was adopted to extend the range for connecting. The dilation with a small elliptical structuring element (3 × 3) was beneficial for repairing the stimulus image’s edges. Third, we adopted contour retrieval to find the contour from the dilated images, and binarized the pixel enclosed by each contour to acquire the mask for the part of stimuli and stray light, and then calculated the outside radius of the circular stimuli. Then, the masks could be multiplied by the captured image to extract the information of stimuli and stray light. Finally, the gray level of stimuli, gray level, and standard deviation of stray light could be calculated according to these valid data and inputted into the classification algorithm for training a stray light evaluation model. The obtained features could be visualized using the t-Distributed Stochastic Neighbor Embedding (t-SNE) technique, which can explore the feature distribution of the dataset and visualize the feature representation of the samples in two dimensions.
Figure 9 illustrates the result of the t-SNE projection.
The initial step for building a machine learning model was to determine the inputs. The outside radius and gray level of circular stimuli, gray level, and standard deviation of the stray light image were utilized to describe the relationship between the input parameters and the visual response. The four features were selected as the inputs for the training procedure. The outputs were the records if the observer perceived the stray light and were labelled 0 when there was no stray light. In contrast, they were labelled as 1 to express that the stray light was present. As a consequence, the task was regarded as a binary classification problem. Four supervised learning algorithms, including K-Nearest Neighbor (KNN), Logistic Regression (LR), Support Vector Machine (SVM), and Random Forest (RF), were tested in the study.
In the field of machine learning, k-fold cross-validation, especially the 10-fold cross-validation, is most commonly used to verify the performance of a model. The parameter k randomly splits the data into k subsets, and one of the subsets is chosen for testing with the remaining k − 1 subsets for training. The procedure is repeated until each subset is treated as a testing set. The total number of original data samples used for training the model was 440. Due to the k-fold cross-validation method with k = 10, the training data accounted for 396, and the verification data accounted for 44. The confusion matrixes, including the true positive count (TP), false positive count (FP), false negative count (FN), and true negative count (TN), are mainly used to evaluate a classification model’s performance. For describing the model’s performance, TP, TN, FP, and FN are frequently combined into several indices, such as accuracy, recall, and precision, and they can be formulated by Equations (2)–(5).
The model performance obtained by the use of the four algorithms is shown in
Table 3. As a result, all models could ideally predict the visible stray light of three types of VR HMDs with high accuracy and acceptable true negative rate, whereas the models needed to improve for the recall. The four approaches’ accuracy was about 90%, and the logistic regression algorithm performed the best. Nevertheless, it is essential that more experiments be conducted and more VR HMDs tested to build a comprehensive model.


