Abstract
The advantages of pulsed low-current high-voltage discharges operated at atmospheric pressure and the ease with which such discharges can be implemented industrially contributed to their popularity. However, the high reactivity of a pulsed plasma implies that thorough diagnostics are needed to fully understand the interactions inside these plasmas. Some of the key parameters determining plasma properties of low-current discharges are the electron number density and the temperature of heavy particles. Both parameters can be determined experimentally with spectroscopic techniques, for example by investigating the broadening of spectral lines due to the Stark effect and by fitting synthetic spectra to molecular transitions. To the authors’ knowledge, experimentally determined electron densities for pulsed low-current discharges operated in a power range between 300 W and 1000 W have not been performed in previous works. Thus, in this work, the electron number density and temperature of heavy particles of one of several commercially available plasma systems are determined by means of emission spectroscopy.
1. Introduction
The advantages of non-equilibrium plasmas generated by pulsed low-current high-voltage discharges at atmospheric pressure have contributed to the fact that such discharges are now well established industrially and are constantly growing [1,2]. In the automotive and packaging industries, for example, surfaces are treated with such plasmas before bonding, printing or painting [3,4,5,6] to improve the quality of the following process. Surfaces are hydrophilized or hydrophobized by the deposition of layers as a result of a chemical reaction induced by such plasmas [7,8]. Various layers of low-melting materials are coated onto temperature-sensitive substrates [9,10,11,12]. The antibacterial properties of non-equilibrium plasmas are used and intensively explored in food and medical industries [13,14,15,16]. In the environmental sector, such plasmas are used to neutralize industrial waste gases by the selective removal of chemical compounds [8,17,18]. Moreover, possible applications to increase efficiency in the production of synthetic fuels are being explored [19,20]. As a result of the ever-widening range of applications, especially in the environmental and health fields [13,20,21,22,23], the need for the comprehensive characterization of non-thermal plasmas seems to become more and more important.
Due to the wide application field and industrial spread of pulsed low-current discharges, a plethora of publications exist in which this type of discharge is studied. However, often it is not the physical effects that occur in plasma that are characterized, but the effects achieved as a result of a plasma treatment, as presented in [4,6,14,24,25,26,27], to name a few. In references dealing with the characterization of such discharges, researchers often describe their behavior using electrical measurements [10,28,29,30] or emission spectroscopy. The latter diagnostic method is primarily used to qualitatively describe the composition of the plasma [12,24,31,32]. Only a few authors estimated the temperature of heavy particles or, more precisely, the rotational and vibrational temperatures of molecular bands based on the fitting of the recorded spectra for pulsed low-current nitrogen discharges in the analyzed power range [3,33,34,35,36,37]. In some cases, the estimation of the gas temperature is also conducted by thermocouple measurements [10,12,38]. The last technique may be easy to implement, but the gas temperature values that can be assessed are significantly limited by the sensor used and are subsequently less accurate than those determined spectroscopically. Furthermore, due to the ratio of the sensor size to the measured object size, this method only allows the recording of integral values. Therefore, spectroscopic measurements or laser scattering diagnostics should be preferred over thermocouple-based ones for the evaluation of the heavy particle temperature with regard to the chemical reactivity of the plasma under study, while calorimetric measurements as presented in [39,40] are preferable if the thermal load of the substrate is to be evaluated.
As mentioned above, the temperature of heavy particles can be assessed experimentally by emission spectroscopy measurements and subsequent fitting of synthetic spectra. In comparison, the determination of the electron parameters of non-equilibrium plasmas based on spectroscopic measurements is not so straightforward. Several research groups estimated the electron density or temperature through modelling [35,37,41,42,43]. Thereby, in addition to the estimation of rotational and vibrational temperatures, the measured spectra are used to estimate the diameter of the discharge channel, which is then used to determine the current density. Thereafter, the electron parameters can be obtained by solving the Boltzmann equation [37], an Elenbaas-Heller [43] or a collisional-radiative model [35]. Such a combined experimental and computational approach is a good estimation method, but cannot be compared with a purely experimental measurement of the electron parameters due to approximations adopted during the calculations (for ex. the assumption of thermal equilibrium). Furthermore, for a pulsed low-current high-voltage discharge in the power range between 300 W and 1000 W, to the best of the authors knowledge, no data on a purely experimentally determined electron number density could be found in published works.
The electron density can be estimated experimentally from the broadening of spectral lines due to the Stark effect. The so-called Stark effect arises in an ionized gas, i.e., plasma, due to the interaction of the atom’s bound electrons with the electric field created by free electrons within the plasma surrounding that atom. Therefore, one of the aims of this work is to experimentally estimate the electron density of a pulsed low-current discharge operated at atmospheric pressure by means of emission spectroscopy. Furthermore, the heavy particle temperature is determined by the fitting of synthetic spectra to molecular bands of nitrogen transitions. The estimated heavy particle temperatures are also used for validation purposes. A commercially available pulsed plasma system Plasmabrush® PB3 produced by Relyon Plasma GmbH, Regensburg, Germany, is chosen as a test object. The system is characterized by a simple design comparable to that of other systems on the market.
2. Theoretical Approach
As stated above, the electron density can be determined from the broadening of spectral lines due to the Stark effect. The following section describes this effect only briefly. For a detailed description, it should be referred to [44,45]. Thereafter, in Section 2.2, only the most relevant aspects of the molecular spectroscopy are discussed. Again, for more details, it should be referred to [46,47,48].
2.1. Stark Broadening
Besides the natural (due to quantum mechanical energy uncertainty) and Doppler broadening (due to thermal velocity of the emitting particle), several further broadening mechanisms of spectral lines exist. Responsible for the broadening are frequent interactions with neutral or charged particles, which are too weak to produce the excitation responsible for a radiation itself but still strong enough to modify the lifetime of the excited electron. These interactions are in general of a electromagnetic nature, with the coupling of any charge q to the electric field being much stronger than to the magnetic field (assuming that the velocity of the charged particle is much lower than the speed of light, which is usually the case). If an interaction with neutral particles is considered, the effect is referred to as pressure broadening. For charged particles, it is referred to as Stark broadening or the Stark effect [44,45]. The Stark effect occurs due to the interaction of the atom’s bound electrons with the plasma’s free electrons and can be mainly described by one of the two following approximations:
- Quasistatic approximation: The electron distribution within the atom is not spherically symmetric (such as in the hydrogen atom) and the atom already displays a permanent electric dipole. In this case, the plasma’s electric free charges can be assumed to act collectively, direct, as a “cloud”, creating the external electric field , which interacts with the atom’s dipole moment. This approximation is also called the linear Stark effect.
- Impact approximation: The electron distribution within the atom is spherically symmetric (such as in a noble gas atom) and there is no permanent electric dipole. In this case, the interaction is mediated by two electrons: the first one, which after approaching the atom polarizes the latter for a very short time interval, and the second one, which during such time interval interacts with the induced, short-lived, electric dipole moment. This effect is referred to as the quadratic Stark effect. Since a consecutive collision with two electrons is seldom enough, the quadratic Stark effect is much weaker than the linear one.
In the case of non-equilibrium plasmas, most commonly hydrogen lines are used to determine the electron number density, for which the quasistatic approximation applies [49,50,51,52,53,54,55]. Typically, the widths of the hydrogen’s alpha line ( = 656.28 nm) for the transition and hydrogen’s beta line ( = 486.13 nm) for the transition are used for the estimation according to the model proposed originally by Gigosos et al. [50] and discussed by Konjević et al. [51]. According to the authors, as well as to Laux et al. [52] and Palomares et al. [53], the line represents a good compromise between an acceptable signal-to-noise ratio and self-absorption, with the latter occurring if the lines are too strong. It is also less dependent on the electron temperature and thus more suitable for electron densities in the range of m, which are expected for the plasma studied in this work at atmospheric pressure [56]. The weak temperature dependence can actually be nearly completely removed if, instead of the full width at half maximum, the full width at half area (area contained inside the broadened spectral line, short FWHA) of the hydrogen line is considered [50]. Therefore, in this work the FWHA of the line is used to estimate the electron density according to the correlation
given by Gigosos et al. in [50].
2.2. Molecular Spectroscopy
In case of a molecule, apart from the internal electronic energy and kinetic energy due to the movement of the whole molecule (i.e., its center of mass) in three directions, the relative, vibrational motion of the atoms along the internuclear axis and the relative, rotational motion about two axes perpendicular to the internuclear axis contribute to molecule’s energy. Since both the vibrational and rotational energy states are quantized, each transition described by the quantum number and J, respectively, emits radiation at a specific frequency , resulting in a much more complex spectrum. The radiation emitted by each transition forms spectral bands that reflect the rotational and vibrational states, as exemplified in Figure 1.

Figure 1.
Rotational structure of a band sequence of the -transition of the system of measured experimentally at peak current for the discharge operated at 60 kHz. Based on the calculated fit, a heavy particle temperature of 6300 K was estimated.
For a known instrumental profile, the molecular spectrum of a particular transition can be calculated if several selection rules are followed, as described in [46,47,48]. Thereafter, the experimentally registered spectral intensity within the infinitesimal spectral window between and can be written as
with being the number density of the emitting molecules and the speed of light. The probability of each rotational transition is represented by the Hönl-London factor as well as by the tabulated Franck–Condon coefficient for vibrational transitions. Furthermore, each transition is described by the according energy difference and temperature, with being the rotational, the vibrational and the electron temperature. The transfer function of the experimental setup, denoted with above, can be determined before measurement with a spectral calibration lamp, whereas the detection sensitivity K is also determined beforehand with a calibrated tungsten ribbon lamp.
As can be deduced from Equation (2), several parameters need to be adjusted iteratively for an experimentally measured spectrum to be fitted with a synthetic one. The ionization and dissociation reactions are governed by the excitation temperature, which can be assumed to be equal to or depending on the plasma state [57,58]. According to Wang et al. [57], for electron densities below m, inelastic atomic and molecular collisions are mainly responsible for the ionization of nitrogen molecules, since the heavy particles collide more frequently with each other under such conditions and, due to a similar mass, more energy is transferred in each collision than in a collision with an electron. Thereafter, if the rotational energy levels are assumed to be populated by heavy particle collisions, the computations can be simplified by assuming that , with being the temperature of heavy particles (i.e., gas temperature) [59]. A detailed discussion of the temperatures governing the dissociation and ionization reactions can also be found in [58,60].
3. Experimental Setup
Apart from the description of the chosen plasma system and the experimental setup, a description of the data evaluation methods can be found in this section.
3.1. Plasma System under Study
The aim of this work is to spectroscopically characterize a pulsed, low-current direct discharge operated at atmospheric pressure. There are several commercially available systems on the market utilizing a more or less similar working principle [3,10,16,61]. In this work, the Plasmabrush® system consisting of a PG31 plasma generator and a PS2000 OEM power supply is used. This generator can be used for surface activation, decontamination or deposition of different materials [9,10,11,15,25].
The PG31 generator has a conventional construction with a positively biased, finger-shaped non-refractory inner electrode and a copper alloy nozzle acting as cathode. A conical shaped nozzle of type A450 with an exit diameter of 4 mm is used exclusively for the experiments. Furthermore, pure nitrogen as well as a mixture of nitrogen and hydrogen of 99/1 vol. %, both at a flow rate of 35 L/min, are used as plasma carrier gases in the following, regulated externally by a mass flow controller of type 8626 produced by Bürkert GmbH & Co. KG, Ingelfingen, Germany. The admixture of 1 vol. % of hydrogen is sufficient to achieve evaluable line intensities, but has no significant effect on the discharge. The discharge is driven by unipolar, triangular current pulses with an variable amplitude of maximal 1 A generated at the output of the PS2000 power supply. The power supply utilizes a single-phase full-bridge push-pull converter design with the rise and fall times of the triangular pulses fixed at 5 s, regardless of the selected pulse frequency. The power supply can be controlled via a PC software, which allows an adjustment of the output power between 70–100%, which corresponds to a current amplitude of 0.7–1.0 A at the exit, whereas the pulse frequency can be varied between 40 kHz and 65 kHz in 1 kHz steps.
The generator is connected to the power supply by a 9 m long triaxial cable (similar to a coaxial cable, but with an additional conductive sheath), which serves as an additional high voltage capacitor by utilizing the properties of such a cable. The total cable length between PG31 and PS2000 is 10 m. For the experiments, the output power of the source was set to 100% and pulse frequency to 60 kHz. The typical voltage and current traces for these parameters are shown in Figure 2 and were measured as close to the discharge as possible, i.e. in the connection point between the high-voltage cable and the plasma generator. The energy delivered by the power supply during one discharge pulse averaged 11.1 ± 0.9 mJ, resulting in an average power of 665 ± 50 mJ.
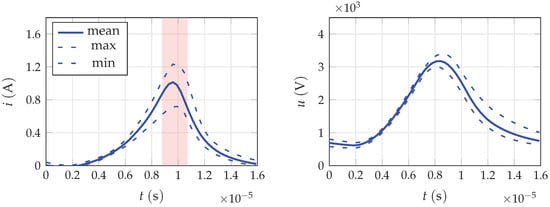
Figure 2.
Typical voltage and current traces recorded prior to the power supply at an operating frequency of 60 kHz and a power setting of 100%. The trigger timeframe at which the experimental setup was triggered is marked in the current plot.
3.2. Emission Spectroscopy
The measurement of the spectral broadening of hydrogen lines as well as molecular spectra requires high spectral resolution. Thus, a similar experimental setup based on a Czerny-Turner spectrograph of type THR1000 made by Jobin-Yvon (now Horiba), Oberursel, Germany, with a focal length of 1000 mm and a diffraction grating of 1200 L/mm is used for both. The horizontally placed effluent plasma jet is projected through a 100 mm planoconvex-fused silica lens onto the vertically oriented entrance slit, as shown in Figure 3. By mounting the plasma generator perpendicularly with respect to the entrance slit, each acquired image contains the spatially resolved intensity distribution in the radial direction. Additionally, the generator is mounted on a micrometer table to vary the axial distance d from the nozzle exit. Hence, the spectra are measured in 1 mm steps starting from the nozzle exit. Lastly, an intensified charged-coupled device camera of type 4 Picos from Stanford Computer Optics, Berkeley, CA, USA, is placed directly in the imaging plane of the spectrometer. The spectral response of the image intensifier of the camera, a Gen II photo-cathode of type S20 with a single-stage microchannel plate and a P43 phosphor screen, is well suited for the measurement of nitrogen molecular bands as well as the hydrogen beta line [62].
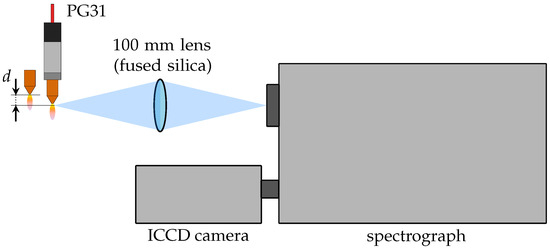
Figure 3.
Schematic diagram of the spectroscopic experimental setup. The plasma generator PG31 is positioned perpendicularly to the vertically oriented entrance slit of the spectrograph on a micrometer table that allows the axial distance d from the nozzle outlet to be varied.
The instrumental profile is estimated by homogeneous illumination of the 100 m wide entrance slit with a krypton spectral calibration lamp of type 6031 produced by Oriel Instruments, Stratford, CT, USA. For the spectral line at = 450.24 nm, the resulting instrumental function depicted in Figure 4 has a full width at half maximum (short FWHM) of 0.1 nm. The spatial resolution is determined to be 0.07 mm/px. Additionally, an absolute calibration of the entire experimental setup is performed using a spectral radiance calibration standard, which is a frosted 50 W quartz-halogen lamp in an integrating sphere of type ISS-8P-HP-V01 made by Gigahertz-Optik, Türkenfeld, Germany.
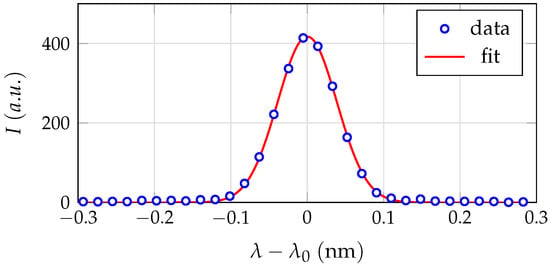
Figure 4.
The instrumental profile of the spectroscopic setup determined by a Gaussian fit of a krypton emission line at = 450.24 nm. The FWHM is 0.1 nm.
The spectroscopic setup is triggered to achieve temporal resolution, with the image intensifier being synchronized to the discharge current. In order to achieve this, the working voltage is stepped down through a resistive voltage divider and triggers a DG645 pulse-delay generator made by Stanford Research Systems, Sunnyvale, CA, USA, which is used to adjust the delay. Accordingly, the microchannel plate of the camera is triggered with the pulse frequency of the plasma generator, utilizing the on-chip integration mode to achieve a better signal-to-noise ratio. The gain voltage is fixed at 800 V, while the exposure time of the microchannel plate was varied from 40 ns to 2 s, depending on the distance from the nozzle outlet. Since the plasma system operates without a control loop, which implies fluctuations in plasma and thus in the tapped electrical signals, no exact trigger time points can be defined. Accordingly, the width of the timeframes in Figure 2 illustrates the approximate jitter of the trigger time point. In the following, only the spectra emitted during the current maximum are evaluated. During the valley current phase between successive pulses, the emitted light intensity is so low that a temporal resolution cannot be achieved due to the required extension of the exposure time in order to obtain evaluable images with the experimental setup.
3.3. Data Evaluation of the Line
To extract the line, a pure nitrogen spectrum and a nitrogen–hydrogen spectrum are recorded, consecutively. In both cases, an average image is first calculated from all recorded images (at least 100) for further processing, and subsequently, each measured pixel line is corrected with the according pixel line of the radiance calibration measurement. Afterwards, due to the fact that the hydrogen line is superimposed on the nitrogen spectrum, as shown in Figure 5, each nitrogen image is multiplied by a variable scaling factor and subtracted from the nitrogen–hydrogen image to obtain an image containing only the hydrogen line. The scaling factor averaged about and was adjusted for each parameter set.
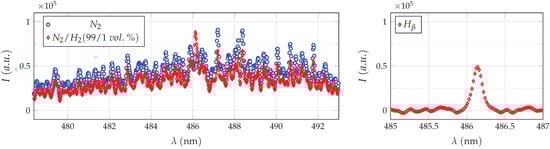
Figure 5.
The left plot shows an and an spectrum after correction with the radiance calibration standard, recorded with similar camera settings at nozzle axis (r = 0 mm) for an axial distance of d = 2 mm. The plasma generator was operated at 60 kHz and the experimental setup was triggered at peak current of ∼1.0 A (power setting of 100%). The hydrogen -line shown in the right plot is obtained after subtracting the pure nitrogen spectrum (multiplied by a variable scaling factor) from the hydrogen-containing measurement.
As briefly mentioned in the previous section, the shape of the recorded hydrogen line is determined by a convolution of several broadening mechanisms, the most significant being: broadening due to instrumental profile, Doppler, van der Waals (short vdW) and Stark broadening. The parameter evaluation is easiest if an assumption can be made that the Stark broadening is dominant and described by a Lorentzian curve. Then, the measured data can be approximated with a Voigt profile, i.e., the convolution of a Gaussian and a Lorentzian profile, where the width of the Gaussian component is taken as the width of the instrumental profile, and the width of the Lorentzian component is taken as the Stark broadening. The additional, weaker influence of the Doppler and vdW components can be estimated by formulas given in [52,54]. For the expected heavy particle temperatures, the Doppler broadening is more pronounced with 0.03 nm than the vdW broadening with 0.01 nm. Nevertheless, the width of the instrumental profile of the spectroscopic setup (depicted in Figure 4) will increase only by less than 5% when convoluted with the above . Thereafter, the Doppler and vdW contributions are neglected in the evaluation.
After the nitrogen background is subtracted, prior to the fitting of a Voigt profile to the resulting data, the local intensity distribution of the hydrogen line is calculated using the Abel transform, assuming that the line is optically thin and axially symmetric. The Voigt profile is recommended for the line [53,54]. The assumption is generally valid if the effluent plasma jet is nearly homogeneous or at least axially symmetric, which is only satisfied if no time resolution is considered. On a short time scale, especially in the region where the discharge is blown out of the nozzle, an assumption of rotational symmetry can only be made locally, i.e., for the region in direct proximity of the nozzle axis. The assumption is further supported by the fact that average images are used for parameter evaluation. Hence, only a radius range of 0.6 mm from the generator axis is analyzed. Thereafter, the local profiles are fitted by a Voigt profile, where the Lorentzian component is varied to achieve the best possible fit of the measured data. With the so determined FWHA, the electron number density is finally calculated using the approximation Formula (1). Furthermore, three measurements are made and evaluated for each parameter set, so that the results discussed in Section 4 represent an average of these measurements.
3.4. Data Evaluation of Molecular Bands
To determine the heavy particle temperature, two molecular transitions in the visible range, the transition of the excited nitrogen molecule called the second positive system (short SPS) and the transition of the ionized nitrogen molecule, called the first negative system (short FNS), are used. More precisely, when the spectral resolution of the experimental setup is taken into account, the -SPS-transition with the band head at 337.13 nm and the -FNS-transition with the band head at 391.44 nm are evaluated in the following.
As can be deduced from Section 2, the fitting procedure of a molecular spectrum is quite complex and cannot be performed manually. Each transition is characterized by a different set of tabulated data and follows different selection rules, which have to be implemented into the fitting procedure. Moreover, several transitions overlap in certain wavelength ranges of a measured spectrum, further complicating the fitting procedure. For these reasons, a commercially available software Specair 3.0 made by SpectralFit S.A.S., Antony, France is used for the parameter evaluation from the measured nitrogen molecular spectra. This software is well established in the scientific world and used by many researchers [41,52,63,64,65]. Before the parameter evaluation, the measured data are prepared as follows. Similarly to the evaluation of , an average is calculated from single images (at least 100), then corrected with the radiance calibration measurement and Abel transformed for local intensities. Afterwards, each pixel line of the locally resolved spectra is imported to Specair, where the synthetic spectra are calculated under consideration of the instrumental profile of the setup. An example of the resulting fit is shown in Figure 1. Again, three measurements are taken for each parameter set, evaluated and averaged, subsequently.
4. Results
As presented in Figure 6, the estimated electron number density on the axis of the plasma jet varies insignificantly, up to a distance d of about 3 mm downstream from nozzle exit when operating at a pulse frequency of 60 kHz. Thereafter, the values decrease for larger distances from the nozzle exit. The radial distribution of the electron number density increases somewhat unexpectedly by about 17% towards larger radial positions r. Nonetheless, after consideration of the measurement error, the electron density can be assumed to be constant at m for distances mm and mm.
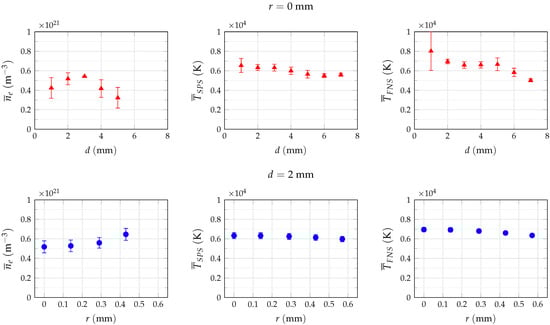
Figure 6.
Average electron density and heavy particle temperatures , estimated on nozzle axis (first row of plots denoted with r = 0 mm) for different distances d downstream from nozzle outlet and for different lateral positions r at a distance d = 2 mm (second row of plots). In both cases, the experimental setup was triggered at peak current.
Similarly to the electron density, the temperature of the excited nitrogen molecule decreases from 6500 K to 5500 K across the analyzed distance of 7 mm downstream from nozzle outlet on the axis of the effluent jet. The temperature along the nozzle axis, i.e., for , can be assumed constant up to 3 mm and then gradually decreases with an approximate gradient of −250 K/mm. A similar behaviour of the estimated temperature values is observed for the -transition of ionized nitrogen molecule, although the temperature difference is more significant within the analyzed distance range of 7 mm in comparison to the excited molecule. The values in the right-hand side of Figure 6 decrease from almost 8000 K to 4600 K on the nozzle axis, although a rather high deviation from the mean values is observed at a distance of 1 mm. This uncertainty is probably caused by imaging errors, as can be observed in Figure 7, and thus should be considered as an outlier. At mm, the temperature falls radially from 7000 K on nozzle axis to about 6300 K at mm, almost twice the value compared to a temperature difference of only 350 K in the case of SPS spectra. A zone of almost constant temperature of approx. 6600 K spreads between 3 mm to 5 mm from the nozzle exit. Nonetheless, considering the measurement errors and inaccuracies in the temperature estimation, the discrepancies of the and estimates appear to be insignificant and can be assumed to be equal in the analyzed distance range. Thus, the heavy particle temperature for the pulsed low-current discharge under study can be assumed to range between 6000 K and 7000 K in the proximity of the jet axis.
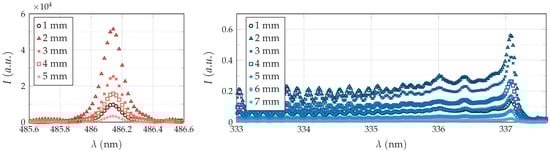
Figure 7.
Experimental data used for estimation of (left hand-side) and (right hand-side). Due to imaging errors, a significantly lower intensity was recorded for a distance of 1 mm downstream from nozzle exit in both cases.
5. Discussion
As mentioned in Section 1, several researchers have analyzed spectroscopically comparable plasma systems to the one studied here [3,24,35,36,40,41], but none have determined the electron number density purely experimentally using hydrogen line broadening. Some, as will be discussed in the following, calculated the electron density based on recorded molecular spectra.
The electron number density is reported to range between m and m for low-current discharges operated with a direct current [56]. However, several researcher groups report slightly higher values for pulsed discharges. Pai et al. determined a density of about m (and electron temperature of about 30,000 K) for the nanosecond pulsed discharge operated in the air by 8.3 kV high voltage peaks pulsed at 30 kHz [41,42]. For these working conditions, Pai et al. measured peak current values of 30 A. The electron density was determined by the authors based on calculations of the discharge radius, which was determined from the SPS -transition spectrum, and collision frequency between electrons and heavy particles. The higher values can be, however, caused by the current peaks, since the current density j is directly proportional to the electron density according to , with being the electron charge and the drift velocity of electrons [66]. An even higher was calculated with a collisional-radiative model by Gröger et al. for a gliding arc plasmatron operated with nitrogen at a constant current of 230 mA [35]. The density was estimated to be m. Moreover, in this case, the calculations were based on the relation between the measured intensity of the SPS - and FNS -transitions of nitrogen molecules [35]. According to observations of Machala et al. [65], an increase in electron density can be observed for gliding arc discharges if they are constricted by a tube, which is the case for the plasmatron studied in [35]. Another possible explanation can be the existance of short duration current peaks, which can occur during an shortening of the discharge channel, as shown by Fulcheri et al., who investigated a compact plasma torch driven by a low-current high-voltage direct current discharge [28]. Such peaks were observed at certain currents in the range between 150 mA and 400 mA, at which the discharge behaved like a gliding arc, i.e., the current peaks were caused by a reignition of the discharge at a shorter distance between the electrodes after it had been blown out by the gas flow. The discharge motion of a gliding arc plasmatron has been described in detail for an operation with by Ramakers et al. [67], but the presented results were not correlated with time-resolved progressions of voltage and current. Thus, although the motion of a discharge channel depends on many factors, such as the geometry of the generator as well as the type and flow rate of the gas used, this effect may lead to an increase in electron density and cannot be excluded.
The electron density values determined experimentally in this work are slightly lower compared to the above references, but this is probably the result of lower pulse current amplitudes, as indicated above. Due to the design of the PG31 plasma generator and the observations made during measurements, the length of the discharge channel does not change significantly when operating at a frequency of 60 kHz. Even though the discharge is pulsed, it behaves similarly to the continuous regime described in [28], where the discharge is blown out of the nozzle, reverses and forms an attachment point at the nozzle lip. Thus, the channel length remains relatively constant, which in turn leads only to a small variation in the voltage and current waveforms, as shown in Figure 2.
Furthermore, it should be noted that the above referenced values are calculated rather than determined experimentally, which also may lead to small discrepancies. Nonetheless, the values estimated in this work are of the same order of magnitude as the referenced ones and thus are assumed to be plausible.
The lower value of electron density at a distance of 1 mm downstream from nozzle outlet, as well as the high deviation from the mean values observed for the molecular temperatures at the same distance, are most likely due to an imaging error. As presented in Figure 7, a significantly lower intensity was recorded for this distance in both cases. At other distances, the progression of recorded intensities is as expected and decreases with increasing distance from the nozzle outlet.
The somewhat counter-intuitive increase in for higher distances from jet axis (see Figure 6) was also observed in [68,69] and might be caused by an effect described by Jonkers et al. [70]. The latter researcher group used laser scattering to estimate electron parameters of a plasma torch with axial gas injection driven by microwaves and operated with argon as well as helium at atmospheric pressure. A significant increase in both electron density and temperature was observed with increasing lateral distance from the torch axis. The effect was reduced by changing the ambient atmosphere from air to argon. Thus, the authors concluded that the increase is attributed to air entrainment from the surrounding cold atmosphere [70]. However, since the discharge in this work is operated with pure nitrogen, the above hypothesis does not seem to prove the effects satisfactorily.
Another possible explanation for such an increase in values in the radial direction can be given if the beam geometry of the spectroscopic setup is considered in detail. A nearly Gaussian distribution can be assumed in a first approximation for the intensity radiated by the discharge plasma channel, which is then imaged by the spectrograph onto the sensor plane of the camera, where an integration of the signal in the viewing direction takes place. However, the integrated signal contains no information about the distribution of the emitted radiation in the direction of observation and thus an additional assumption is needed to describe the intensity distribution in the viewing direction. If again, a nearly Gaussian intensity distribution is assumed in the viewing direction, then as a result the emitted intensity can be approximated by a two-dimensional Gaussian as shown in Figure 8. If the intensity peak is now positioned slightly off-center from the nozzle axis and moves e.g., rotationally, as marked in Figure 8, then a bimodal distribution of the intensity is observed as a result of the integration on the camera sensor. Looking at such a bimodal distribution, it becomes apparent that the estimated values can increase towards further radial positions if the experimental setup is well aligned with the axis of the plasma generator. Thus, according to this discussion, the lateral motion of the discharge channel is most probably responsible for the increase in values for increasing radial distances. The effect is further increased since average images are used for the parameter evaluation.
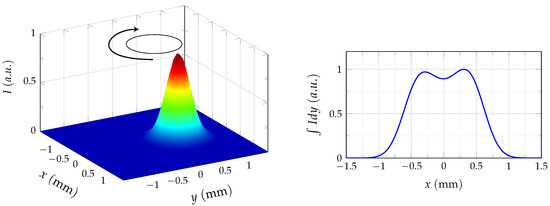
Figure 8.
A two-dimentional Gaussian approximates the intensity emitted by the discharge channel. After integration on a detector, a bimodal intensity distribution can be observed when the movement of the channel is taken into account.
Several authors determined the temperature of molecular transitions for comparable discharges. Thus, these results can be used as a validation of the experimental setup in this work. Thereafter, the above-discussed nanosecond pulsed discharge studied by Pai et al. reached a rotational temperature of 5300 K about 40 ns after a discharge pulse took place. The temperature was determined by fitting synthetic spectra to the SPS -transition [41]. Gröger et al. estimated a temperature of about 6000 K for the gliding arc plasmatron by fitting synthetic spectra to the SPS - and FNS -transitions [35]. According to the discussion given in [35], if the rotational temperature of the excited nitrogen molecule and the rotational temperature of the ionized nitrogen molecule are similar, both states are populated by an electron impact exitation, corresponding to conditions of high electric field and low electron density. This is the case for the discharge under study, considering the results in Figure 6. Furthermore, Kubota et al. analyzed a commercially available plasma system operated at a pulse frequency of 19 kHz with nitrogen flowing at 30 L/min and a peak input power of about 1.5 kW in [36], reported rotational temperatures of about 5000 K inside the plasma generator and between 3000 K and 4000 K at nozzle exit. Similarly to previous references and also to this work, the authors based the estimation on the second positive -transition of molecular nitrogen. For the same plasma system, also pulsed at 19 kHz but working with a compressed air gas flow rate of 76.6 L/min, Dowling et al. estimated a rotational temperature of about 1760 K at nozzle exit using the -transition spectra of the second positive system [3]. If a linear relationship between gas flow and temperature would be assumed in a first approximation for this result, than a rotational temperature of approx. 4500 K at an air flow rate of 30 L/min could be expected. Heavy particle temperatures between 5500 K [43] and 5800 K [56] can be found in further references for low-current discharges driven by direct current under atmospheric pressure. A gas temperature of ∼5500 K was reported in [71] by Lebouvier et al., who modelled the plasma generator investigated by Fulcheri et al. in [28]. The heavy particle temperatures given in Section 4 are in a similar temperature range compared to the above references, and therefore the temperatures presented in this paper are considered plausible, with the exception of the values estimated for an axial distance of 1 mm, where the results were most probably affected by imaging errors, as discussed above.
6. Conclusions
In this work, a pulsed, low-current high-voltage discharge was spectroscopically examined to experimentally determine the electron number density and heavy particle temperature. Up to date, no data on a purely experimentally determined electron number density from the broadening of spectral lines due to the Stark effect could be found in published works for discharges in the power range between 300 W and 1000 W. Based on the broadening of the hydrogen beta line, an electron density of about m was determined for a nitrogen discharge driven by triangular current pulses with an amplitude of 1 A at a pulse frequency of 60 kHz. The electron density values estimated in this work were reached for peak current and are of a similar order of magnitude to the calculated values reported in [35,41] for comparable discharge types. Furthermore, for the same operating conditions, a heavy particle temperature of about 6500 K was determined by the fitting of synthetic spectra to SPS- and FNS-transitions of molecular nitrogen. Moreover, this value appears to be plausible after comparison with various literature references in which comparable discharges have been studied. According to the observations made during the measurements, the voltage and current traces for the parameters studied show small amplitude deviations, indicating only insignificant changes in the length of the discharge channel. Thus, although the discharge is pulsed at 60 kHz, it appears to behave similarly to a dc discharge operated in a continuous regime, as described by Fulcheri et al. in [28]. As discussed in Section 5, higher electron density can be expected for parameters where higher current pulse amplitudes are achieved, for ex. when operating at higher gas flow rates. With this knowledge, a model of the chemical composition of the plasma can be developed in the future.
Author Contributions
Conceptualization, M.S. and J.S.; methodology, M.S. and G.F.; software, M.S. and G.F.; validation, M.S. and J.-L.M.-L.; formal analysis, J.S. and J.-L.M.-L.; investigation, M.S.; resources, M.S. and G.F.; data curation, M.S.; writing—original draft preparation, M.S.; writing—review and editing, J.S.; visualization, M.S.; supervision, J.S.; project administration, M.S.; funding acquisition, J.S. All authors have read and agreed to the published version of the manuscript.
Funding
This research received no external funding.
Institutional Review Board Statement
Not applicable.
Informed Consent Statement
Not applicable.
Data Availability Statement
Not applicable.
Conflicts of Interest
The authors declare no conflict of interest.
Abbreviations
The following abbreviations are used in this manuscript:
| FWHM | Full width at half maximum |
| FWHA | Full width at half area |
| SPS | Second positive system of excited nitrogen molecule |
| FNS | First negative system of ionized nitrogen molecule |
References
- Bogaerts, A.; Neyts, E.; Gijbels, R.; van der Mullen, J.J.A.M. Gas discharge plasmas and their applications. Spectrochim. Acta B 2002, 57, 609–658. [Google Scholar] [CrossRef]
- Weltmann, K.D.; Kolb, J.F.; Holub, M.; Uhrlandt, D.; Šimek, M.; Ostrikov, K.K.; Hamaguchi, S.; Cvelbar, U.; Černák, M.; Locke, B.; et al. The future for plasma science and technology. Plasma Process. Polym. 2019, 16, 1–29. [Google Scholar] [CrossRef]
- Dowling, D.P.; O’Neill, F.T.; Langlais, S.J.; Law, V.J. Influence of a DC pulsed atmospheric pressure plasma jet processing conditions on polymer activation. Plasma Process. Polym. 2011, 8, 718–727. [Google Scholar] [CrossRef]
- Jofre-Reche, J.A.; Pulpytel, J.; Arefi-Khonsari, F.; Martín-Martínez, J.M. Increased adhesion of polydimethylsiloxane (PDMS) to acrylic adhesive tape for medical use by surface treatment with an atmospheric pressure rotating plasma jet. J. Phys. D Appl. Phys. 2016, 49, 334001. [Google Scholar] [CrossRef]
- Kehrer, M.; Rottensteiner, A.; Hartl, W.; Duchoslav, J.; Stehrer, T.; Stifter, D. Cold atmospheric pressure plasma treatment for adhesion improvement on polypropylene surfaces. Surf. Coat. Technol. 2020, 403, 126389. [Google Scholar] [CrossRef]
- Noeske, M.; Degenhardt, J.; Strudthoff, S.; Lommatzsch, U. Plasma jet treatment of five polymers at atmospheric pressure: Surface modifications and the relevance for adhesion. Int. J. Adhes. Adhes. 2004, 24, 171–177. [Google Scholar] [CrossRef]
- Carton, O.; Ben Salem, D.; Bhatt, S.; Pulpytel, J.; Arefi-Khonsari, F. Plasma polymerization of acrylic acid by atmospheric pressure nitrogen plasma jet for biomedical applications. Plasma Process. Polym. 2012, 9, 984–993. [Google Scholar] [CrossRef]
- Dowling, D.P.; Stallard, C.P. Achieving enhanced material finishing using cold plasma treatments. Trans. IMF 2015, 93, 119–125. [Google Scholar] [CrossRef]
- Köhler, R.; Sauerbier, P.; Militz, H.; Viöl, W. Atmospheric pressure plasma coating of wood and MDF with polyester powder. Coatings 2017, 7, 171. [Google Scholar] [CrossRef]
- Korzec, D.; Nettesheim, S. Application of a pulsed atmospheric arc plasma jet for low-density polyethylene coating. Plasma Process. Polym. 2020, 17, 1900098. [Google Scholar] [CrossRef]
- Wallenhorst, L. Protective Particle Coatings Applied by Cold Plasma Spraying. Ph.D. Thesis, Georg-August University School of Science, Göttingen, Germany, 2017. [Google Scholar]
- Pulpytel, J.; Kumar, V.; Peng, P.; Micheli, V.; Laidani, N.; Arefi-Khonsari, F. Deposition of organosilicon coatings by a non-equilibrium atmospheric pressure plasma jet: Design, analysis and macroscopic scaling law of the process. Plasma Process. Polym. 2011, 8, 664–675. [Google Scholar] [CrossRef]
- Aggelopoulos, C.A. Recent advances of cold plasma technology for water and soil remediation: A critical review. Chem. Eng. J. 2022, 428, 131657. [Google Scholar] [CrossRef]
- Dobeic, M.; Vadnjal, S.; Bajc, Z.; Umek, P.; Pintarič, S.; Uranjek, I.; Gačnik, K.Š. Antibacterial properties of a non-thermal, atmospheric, Openair ®, plasma jet in surface decontamination of eggs in shell. Slov. Vet. Res. 2016, 53, 29–41. [Google Scholar]
- Szulc, M.; Schein, S.; Schaup, J.; Schein, J.; Zimmermann, S. Suitability of thermal plasmas for large-area bacteria inactivation on temperature-sensitive surfaces-first results with Geobacillus stearothermophilus spores. J. Phys. Conf. Ser. 2017, 825, 012017. [Google Scholar] [CrossRef]
- Wiegand, C.; Beier, O.; Horn, K.; Pfuch, A.; Tölke, T.; Hipler, U.C.; Schimanski, A. Antimicrobial impact of cold atmospheric pressure plasma on medical critical yeasts and bacteria cultures. Skin Pharmacol. Physiol. 2014, 27, 25–35. [Google Scholar] [CrossRef]
- Chen, B.; Zhu, C.; Chen, L.; Fei, J.; Gao, Y.; Wen, W.; Shan, M.; Ren, Z. Atmospheric pressure plasma jet in organic solution: Spectra, degradation effects of solution flow rate and initial pH value. Plasma Sci. Technol. 2014, 16, 1126. [Google Scholar] [CrossRef]
- Urashima, K.; Chang, J.S. Removal of volatile organic compounds from air streams and industrial flue gases by non-thermal plasma technology. IEEE Trans. Dielectr. Electr. Insul. 2000, 7, 602–614. [Google Scholar] [CrossRef]
- Iwarere, S.; Rohani, V.; Ramjugernath, D.; Fabry, F.; Fulcheri, L. Hydrocarbons synthesis from syngas by very high pressure plasma. Chem. Eng. J. 2014, 241, 1–8. [Google Scholar] [CrossRef]
- Snoeckx, R.; Bogaerts, A. Plasma technology-a novel solution for CO2 conversion? Chem. Soc. Rev. 2017, 46, 5805–5863. [Google Scholar] [CrossRef]
- Mai-Prochnow, A.; Zhou, R.; Zhang, T.; Ostrikov, K.K.; Mugunthan, S.; Rice, S.A.; Cullen, P.J. Interactions of plasma-activated water with biofilms: Inactivation, dispersal effects and mechanisms of action. NPJ Biofilms Microbiomes 2021, 7, 1–12. [Google Scholar] [CrossRef]
- Machala, Z.; Tarabová, B.; Sersenová, D.; Janda, M.; Hensel, K. Chemical and antibacterial effects of plasma activated water: Correlation with gaseous and aqueous reactive oxygen and nitrogen species, plasma sources and air flow conditions. J. Phys. D Appl. Phys. 2019, 52, 034002. [Google Scholar] [CrossRef]
- Zeghioud, H.; Nguyen-Tri, P.; Khezami, L.; Amrane, A.; Assadi, A.A. Review on discharge plasma for water treatment: Mechanism, reactor geometries, active species and combined processes. J. Water Process. Eng. 2020, 38, 101664. [Google Scholar] [CrossRef]
- Kehrer, M.; Duchoslav, J.; Hinterreiter, A.; Mehic, A.; Stehrer, T. Surface functionalization of polypropylene using a cold atmospheric pressure plasma jet with gas water mixtures. Surf. Coat. Technol. 2020, 384, 125170. [Google Scholar] [CrossRef]
- Korzec, D.; Burger, D.; Nettesheim, S. Plasma activation from roll to roll. Adhes. Adhes. Sealants 2015, 12, 36–40. [Google Scholar] [CrossRef]
- Lommatzsch, U.; Pasedag, D.; Baalmann, A.; Ellinghorst, G.; Wagner, H.E. Atmospheric pressure plasma jet treatment of polyethylene surfaces for adhesion improvement. Plasma Process. Polym. 2007, 4, S1041–S1045. [Google Scholar] [CrossRef]
- Starek, A.; Sagan, A.; Andrejko, D.; Chudzik, B.; Kobus, Z.; Kwiatkowski, M.; Terebun, P.; Pawłat, J. Possibility to extend the shelf life of NFC tomato juice using cold atmospheric pressure plasma. Sci. Rep. 2020, 10, 1–13. [Google Scholar] [CrossRef]
- Fulcheri, L.; Rollier, J.D.; Gonzalez-Aguilar, J. Design and electrical charaterization of a low current-high voltage compact arc plasma torch. Plasma Sources Sci. Technol. 2007, 16, 183–192. [Google Scholar] [CrossRef]
- Hsu, C.C.; Wu, C.Y. Electrical characterization of the glow-to-arc transition of an atmospheric pressure pulsed arc jet. J. Phys. D Appl. Phys. 2009, 42, 215202. [Google Scholar] [CrossRef]
- Kalra, C.S.; Cho, Y.I.; Gutsol, A.; Fridman, A.A.; Rufael, T.S. Gliding arc in tornado using a reverse vortex flow. Rev. Sci. Instrum. 2005, 76, 025110. [Google Scholar] [CrossRef]
- Kewitz, T. Diagnostik an Atmosphärendruck-Plasmajets. Ph.D. Thesis, Kiel University, Kiel, Germany, 2017. [Google Scholar]
- Nagamatsu, H.; Ichiki, R.; Yasumatsu, Y.; Inoue, T.; Yoshida, M.; Akamine, S.; Kanazawa, S. Steel nitriding by atmospheric-pressure plasma jet using N2/H2 mixture gas. Surf. Coat. Technol. 2013, 225, 26–33. [Google Scholar] [CrossRef]
- Czernichowski, A.; Nassar, H.; Ranaivosoloarimanana, A.; Fridman, A.A.; Šimek, M.; Musiol, K.; Pawelec, E.; Dittrichova, L. Spectral and electrical diagnostics of gliding arc. Acta Phys. Pol. 1996, 89, 595–604. [Google Scholar] [CrossRef]
- Bruggeman, P.J.; Sadeghi, N.; Schram, D.C.; Linss, V. Gas temperature determination from rotational lines in non-equilibrium plasmas: A review. Plasma Sources Sci. Technol. 2014, 23, 023001. [Google Scholar] [CrossRef]
- Gröger, S.; Ramakers, M.; Hamme, M.; Medrano, J.A.; Bibinov, N.; Gallucci, F.; Bogaerts, A.; Awakowicz, P. Characterization of a nitrogen gliding arc plasmatron using optical emission spectroscopy and high-speed camera. J. Phys. D Appl. Phys. 2018, 52, 065201. [Google Scholar] [CrossRef]
- Kubota, Y.; Ichiki, R.; Hara, T.; Yamaguchi, N.; Takemura, Y. Spectroscopic analysis of nitrogen atmospheric plasma jet. J. Plasma Fusion Res. 2009, 8, 740–743. [Google Scholar]
- Zhu, J.; Ehn, A.; Gao, J.; Kong, C.; Aldén, M.; Salewski, M.; Leipold, F.; Kusano, Y.; Li, Z. Translational, rotational, vibrational and electron temperatures of a gliding arc discharge. Opt. Express 2017, 25, 20243–20257. [Google Scholar] [CrossRef]
- Nunnally, T.; Gutsol, K.; Rabinovich, A.; Fridman, A.A.; Gutsol, A.; Kemoun, A. Dissociation of CO2 in a low current gliding arc plasmatron. J. Phys. D Appl. Phys. 2011, 44, 274009. [Google Scholar] [CrossRef]
- Fröhlich, M.; Bornholdt, S.; Regula, C.; Ihde, J.; Kersten, H. Determination of the energy flux of a commercial atmospheric-pressure plasma jet for different process gases and distances between nozzle outlet and substrate surface. Contrib. Plasma Phys. 2014, 54, 155–161. [Google Scholar] [CrossRef]
- Kewitz, T.; Regula, C.; Fröhlich, M.; Ihde, J.; Kersten, H. Influence of the nozzle head geometry on the energy flux of an atmospheric pressure plasma jet. EPJ Tech. Instrum. 2021, 8, 1. [Google Scholar] [CrossRef]
- Pai, D.Z.; Lacoste, D.A.; Laux, C.O. Nanosecond repetitively pulsed discharges in air at atmospheric pressure-the spark regime. Plasma Sources Sci. Technol. 2010, 19, 065015. [Google Scholar] [CrossRef]
- Pai, D.Z.; Lacoste, D.A.; Laux, C.O. Transitions between corona, glow and spark regimes of nanosecond repetitively pulsed discharges in air at atmospheric pressure. J. Appl. Phys. 2010, 107, 093303. [Google Scholar] [CrossRef]
- Risacher, A.; Larigaldie, S.; Bobillot, G.; Marcellin, J.P.; Picard, L. Active stabilization of low-current arc discharges in atmospheric-pressure air. Plasma Sources Sci. Technol. 2007, 16, 200–209. [Google Scholar] [CrossRef]
- Griem, H.R. Principles of Plasma Spectroscopy; Cambridge Monographs on Plasma Physics; Cambridge University Press: Cambridge, UK, 1997. [Google Scholar]
- Kunze, H.J. Introduction to Plasma Spectroscopy; Springer Series on Atomic, Optical and Plasma Physics; Springer: Berlin/Heidelberg, Germany, 2009. [Google Scholar]
- Demtröder, W. Molekülphysik; Oldenbourg Verlag: München, Germany, 2003. [Google Scholar]
- Lofthus, A.; Krupenie, P.H. The Spectrum of Molecular Nitrogen. J. Phys. Chem. Ref. Data 1977, 6, 113–307. [Google Scholar] [CrossRef]
- Ochkin, V.N. Spectroscopy of Low Temperature Plasma; Wiley: Hoboken, NJ, USA, 2009. [Google Scholar]
- Díaz-Soriano, A.; Alcaraz-Pelegrina, J.M.; Sarsa, A.; Dimitrijević, M.S.; Yubero, C. A simple and accurate analytical model of the Stark profile and its application to plasma characterization. J. Quant. Spectrosc. Radiat. Transf. 2018, 207, 89–94. [Google Scholar] [CrossRef]
- Gigosos, M.A.; Gonzalez, M.A.; Cardenoso, V. Computer simulated Balmer-alpha, -beta and -gamma Stark line profiles for non-equilibrium plasmas diagnostics. Spectrochim. Acta B 2003, 58, 1489–1504. [Google Scholar] [CrossRef]
- Konjević, N.; Ivković, M.; Sakan, N. Hydrogen Balmer lines for low electron number density plasma diagnostics. Spectrochim. Acta B 2012, 76, 16–26. [Google Scholar] [CrossRef]
- Laux, C.O.; Spence, T.G.; Kruger, C.H.; Zare, R.N. Optical diagnostics of atmospheric pressure air plasmas. Plasma Sources Sci. Technol. 2003, 12, 125–138. [Google Scholar] [CrossRef]
- Palomares, J.M.; Hübner, S.; Carbone, E.A.D.; de Vries, N.; van Veldhuizen, E.M.; Sola, A.; Gamero, A.; van der Mullen, J.J.A.M. Hβ Stark broadening in cold plasmas with low electron densities calibrated with Thomson scattering. Spectrochim. Acta B 2012, 73, 39–47. [Google Scholar] [CrossRef]
- Xiao, D.; Cheng, C.; Shen, J.; Lan, Y.; Xie, H.; Shu, X.; Meng, Y.; Li, J.; Chu, P.K. Electron density measurements of atmospheric-pressure non-thermal N2 plasma jet by Stark broadening and irradiance intensity methods. Phys. Plasmas 2014, 21, 053510. [Google Scholar] [CrossRef]
- Yubero, C.; Garcia, M.C.; Dimitrijevic, M.S.; Sola, A.; Gamero, A. Measuring the electron density in plasmas from the difference of Lorentzian part of the widths of two Balmer series hydrogen lines. Spectrochim. Acta B 2015, 107, 164–169. [Google Scholar] [CrossRef]
- Reece Roth, J. Industrial plasma engineering-Volume 1: Principles; Institute of Physics Publishing: Bristol, UK, 1995. [Google Scholar]
- Wang, W.Z.; Rong, M.Z.; Yan, J.D.; Murphy, A.B.; Spencer, J.W. Thermophysical properties of nitrogen plasmas under thermal equilibrium and non-equilibrium conditions. Phys. Plasmas 2011, 18, 113502. [Google Scholar] [CrossRef]
- Yu, L.; Pierrot, L.; Laux, C.O.; Kruger, C.H. Effects of vibrational nonequilibrium on the chemistry of two-temperature nitrogen plasmas. Plasma Chem. Plasma Process. 2001, 21, 483–503. [Google Scholar] [CrossRef]
- Fantz, U. Basics of plasma spectroscopy. Plasma Sources Sci. Technol. 2006, 15, S137–S147. [Google Scholar] [CrossRef]
- Gleizes, A.; Chervy, B.; Gonzalez, J.J. Calculation of a two-temperature plasma composition: Bases and application to SF6. J. Phys. D Appl. Phys. 1999, 32, 2060. [Google Scholar] [CrossRef]
- Kewitz, T.; Fröhlich, M.; von Frieling, J.; Kersten, H. Investigation of a commercial atmospheric pressure plasma jet by a newly designed calorimetric probe. IEEE Trans. Plasma Sci. 2015, 43, 1769–1773. [Google Scholar] [CrossRef]
- Hoess, P. 4 Picos Ultra High Speed ICCD Camera Brochure; Stanford Computer Optics Inc.: Stanford, CA, USA, 2018. [Google Scholar]
- Chen, C.J.; Li, S.Z. Spectroscopic measurement of plasma gas temperature of the atmospheric-pressure microwave incuded nitrogen plasma torch. Plasma Sources Sci. Technol. 2015, 24, 035017. [Google Scholar] [CrossRef]
- Janda, M.; Machala, Z.; Dvonč, L.; Lacoste, D.A.; Laux, C.O. Self-pulsing discharges in pre-heated air at atmospheric pressure. J. Phys. D Appl. Phys. 2015, 48, 035201. [Google Scholar] [CrossRef]
- Machala, Z.; Laux, C.O.; Kruger, C.H.; Candler, G.V. Atmospheric air and nitrogen DC glow discharges with thermionic cathodes and swirl flow. In Proceedings of the 42nd AIAA Aerospace Sciences Meeting and Exhibit, Reno, NV, USA, 7 January 2004. [Google Scholar]
- Raizer, Y.P. Gas Discharge Physics; Springer: Berlin/Heidelberg, Germany, 1991. [Google Scholar]
- Ramakers, M.; Medrano, J.A.; Trenchev, G.; Gallucci, F.; Bogaerts, A. Revealing the arc dynamics in a gliding arc plasmatron: A better insight to improve CO2 conversion. Plasma Sources Sci. Technol. 2017, 26, 125002. [Google Scholar] [CrossRef]
- Hübner, S.; Santos Sousa, J.; Graham, W.G.; van der Mullen, J.J.A.M. Thomson scattering on non-thermal atmospheric pressure plasma jets. Plasma Sources Sci. Technol. 2015, 24, 054005. [Google Scholar] [CrossRef]
- Van Gessel, A.F.H.; Carbone, E.A.D.; Bruggeman, P.J.; van der Mullen, J.J.A.M. Laser scattering on an atmospheric pressure plasma jet: Disentangling Rayleigh, Raman and Thomson scattering. Plasma Sources Sci. Technol. 2012, 21, 015003. [Google Scholar] [CrossRef]
- Jonkers, J.; Selen, L.J.M.; van der Mullen, J.J.A.M.; Timmermans, E.A.H.; Schram, D.C. Steep plasma gradients studied with spatially resolved Thomson scattering measurements. Plasma Sources Sci. Technol. 1997, 6, 533. [Google Scholar] [CrossRef][Green Version]
- Lebouvier, A.; Delalondre, C.; Fresnet, F.; Boch, V.; Rohani, V.; Cauneau, F.; Fulcheri, L. Three-dimensional unsteady MHD modeling of a low-current high-voltage nontransferred DC plasma torch operating with air. IEEE Trans. Plasma Sci. 2011, 39, 1889–1899. [Google Scholar] [CrossRef]
Publisher’s Note: MDPI stays neutral with regard to jurisdictional claims in published maps and institutional affiliations. |
© 2022 by the authors. Licensee MDPI, Basel, Switzerland. This article is an open access article distributed under the terms and conditions of the Creative Commons Attribution (CC BY) license (https://creativecommons.org/licenses/by/4.0/).