Article

Investigation of Classification and Anomalies Based on Machine Learning Methods Applied to Large Scale Building Information Modeling

1
School of Mathematics and Statistics, Northwestern Polytechnical University, 127 Youyi West Road, Xi’an 710072, China
2
Kabandy, 4 Rue des Pères Blancs, 1040 Brussels, Belgium
*
Author to whom correspondence should be addressed.
Appl. Sci. 2022, 12(13), 6382; https://doi.org/10.3390/app12136382
Submission received: 9 September 2021 / Revised: 6 December 2021 / Accepted: 15 June 2022 / Published: 23 June 2022
(This article belongs to the Special Issue Integrated Artificial Intelligence in Data Science)

Abstract

:
Building Information Models (BIM) capable of collecting and synchronizing all the data related to a construction project into a unified numerical model consisting of a 3D representation and additional metadata (e.g., materials, physical properties, cost) have become commonplace in the building sector. Their extensive use today, alongside the increase in experience with BIM models, offers new perspectives and potentials for design and planning. However, large-scale complex data collection leads to two main challenges: the first is related to the automatic classification of BIM elements, namely windows, walls, beams, columns, etc., and the second to detecting abnormal elements without manual intervention, particularly in the case of misclassification. In this work, we propose machine learning for the automated classification of elements, and for the detection of anomalies based on geometric inputs and additional metadata properties that are extracted from the building model. More precisely, a Python program is used to decipher the BIM models (available as IFC files) for a series of complex buildings, and three types of machine learning methods are then tested to classify and detect objects from a large set of BIM data. The approach is tested on a variety of practical test cases.

1. Introduction

In the global trend towards digitization in all engineering fields, Building Information Modeling (BIM) is currently leading a revolution in the construction sector. From the initial design of a building to its construction, operations and maintenance phases, all the data related to a construction project can now be collected and synchronized into a unified numerical model consisting of a 3D representation enriched with all useful properties (structural, thermal, budget, planning, etc.) [1]. Using the BIM platform, the architectural design team, construction unit, operations department and other parties can exchange engineering information in real time and work together, improving work efficiency, saving resources, reducing costs and ultimately achieving sustainable development [2,3,4]. Since the advent of the Industry Foundation Classes (IFC), more integrated methods to share construction data have emerged and have thus become adopted industry-wide [5]. The proliferation of IFC alone has had a major impact on how current tools and methods are developed in research and development [6]. Currently, a simplified procedure named META-FORMA (MEchanical-Typological Approach FOR Masonry Aggregates) is developed to obtain effective results about the seismic vulnerability of masonry aggregates through an automated mechanical-typological approach [7]. However, as a construction project that is constantly evolving, the quality and accuracy of the data related to all the objects of the building must constantly be checked in order to ensure that sufficient data is available at any given moment and for a given task. For example, to perform a structural analysis, the exact geometry of the structure, including all connections and material properties, must be described in the model with sufficient precision. Unfortunately, this data verification for all the concerned objects cannot be easily automated with an explicit set of rules due to the huge number and diversity of possible geometries, objects, etc. [8,9].
The literature reveals that both unsupervised and supervised learning have already been applied to classification and prediction tasks [10,11]. In 2015, Krijnen [4] et al. showed how machine learning methods enable computing systems to derive implicit knowledge from a set of BIM models. In 2018, Lomio [10] et al. used machine learning methods to classify building images extracted from Building Information Modeling (BIM) software. In the same year, Valero [11] et al. used machine learning to detect defects in BIM models and proposed a strategy for monitoring the regression of stone walls in historical monuments through reality capture, data processing (including machine learning) and BIM models. In April 2018, Zhang [12] et al. proposed an approach to automate the multi-dimensional, objective and quantitative evaluation of BIM model quality. In November 2018, Jin [13] et al. proposed a building space function classification method based on BIM data, which mined BIM related attributes using unsupervised learning. In 2019, Jung [14] performed the automatic classification of Building Information Modeling (BIM) using natural language processing (NLP) and unsupervised learning.
Based on the existing body of research, both domestic and international, on this subject [15,16,17], it is not difficult to find that the main direction of the current research on BIM technology using machine learning is building classification. Most research papers are concerned with the image reconstruction of geometric objects, using image processing, including image recognition, image classification, etc. In contrast, the motivation of the current work is to try and solve the problem of element classification and detection of abnormal data in BIM models, using machine learning algorithms applied to the IFC (Industry Foundation Classes) file itself; in other words, the standard format of BIM models.
In the current work, we propose an investigation based on machine learning to first classify the element (e.g., wall, beam, door, etc.), and then detect anomalies in the geometric inputs (e.g., length, perimeter, gross area and gross volume). More precisely, a Python program is used for deciphering the BIM models (IFC files) for a series of complex buildings. Then, three types of machine learning algorithms are tested to classify and detect objects from BIM data. Finally, the approaches are tested on practical test cases and numerical results are obtained.

2. Data Extraction

2.1. Introduction of the Data

The data used in this paper stem from 11 BIM models available in the public domain. Compared with traditional CAD drawings, BIM models have an obvious advantage in that they can intuitively contain three-dimensional information about buildings. Some of the models were directly collected in the IFC format, while others were exported using Autodesk Revit®, as shown in Table 1. The selection criteria of the model are, in order, availability, followed by diversity of the elements.
In addition, the IFC format includes all the data related to the building materials, construction management, cost, maintenance and other data collected during the entire life cycle of the building. As can be seen in Figure 1, there is a large amount of text information stored in the IFC file. For example, 20160125.ifc (referred to as etdi.ifc from this point onwards). TXT total more than 600,000 lines of commands in raw format, hindering readability. It is understandably critical to extract the information stored in this file in an automated and coherent manner.

2.2. Data Extraction

Since the required BIM elements and their attributable data cannot be obtained directly from the IFC model, we needed to consider other methods. By observing and analyzing the format of the IFC files, it is clear that the version of the information in the beginning is removed, the IFC data storage format both begin with “# * * * *”, and the number following this is similar to the bank’s ID, later with specific attributes, and the attribute contains “# * * * *”, according to the figure. Finally, the elements corresponding to all the information can be found in the following example, which illustrates the storage of the data format. Details are given in Figure 2.
The line with “# 34561” represents a SLAB type element with serial number “# 34561”. The 22 in parentheses with an alphanumeric string is its GlobalId, behind the “# 29”, “# 34640”, and “# 34629”, respectively the three different attributes of the SLAB. When we enter “# 34629”, we find that it contains “# 34623”, in which contains “# 34620”. Based on this logical relationship, you can see every attribute contains a new attribute. Therefore, in order to find all of the attributes of the element, you need to find them one layer at a time. Based on the sequence number of each attribute, we can determine all of the necessary attributes. In Figure 2, layer by layer, we can see the different attribute fields such as “Body”, “Area”, “Point”, and numerical-valued attributes such as “0.3”, “(42., 12.)”. The challenge is then finding the best way to form a directly usable data set by matching these attributes with the corresponding fields.
Given the form of the above data structure and being aware of the idea of regular expression in Python, a logical solution would be using Python programming to extract attributes from the IFC files. Using a specific expression, for, e.g., “ #(\d+)[ ]?=[ ]?(.*?)\((.*)\);[\\r]?$ ”, we can capture the features containing the string “#***” as information, related to the corresponding attribute through the keyword. Finally, these are exported as a CSV (Comma Separated Value) format file containing the object properties of interest.

3. Feature Engineering

3.1. Feature Standardization

The essence of feature standardization is being able to conduct dimensionless operations on numerical-valued features, thus eliminating the influence of dimension on data features. For the data set used in this article, the attribute “Volume” had an overwhelmingly large number of values between 0 and 2, while the attribute “Perimeter” was able to reach values higher than 2000. To analyze the impact of these two characteristics on the final classification results, the analysis results will inevitably favor features with larger numerical values. Therefore, in order to obtain more accurate results, it was important to normalize the features to ensure similar orders of magnitude and facilitate subsequent analysis.
Standardizing the features of a numerical type can bring all the features into a roughly identical numerical interval. In subsequent experiments, we adopted the min-max standardization method. Linear transformation was carried out to scale the original data by mapping the values to an interval:
x n o r m = x x min x max x min
where x represents the original data value, and xmax, xmin are the maximum and minimum values of similar features, respectively.

3.2. Imbalance between Classes

The inter-class imbalance refers to an excessive difference in the number of different samples to be classified. In the model, the largest element number is 512 (BEAM), while the lowest element number is 11 (COVERING); in other words, the difference is relatively large. We note that inter-class imbalances are always present.
There are two ways to solve this problem. Let us consider dichotomy as an example and assume that the positive cases far outnumber the negative examples. One approach is to under-sample the positive cases, i.e., select only a portion of the positive examples, thus allowing the number of positive and negative examples to be close to each other. Another approach would then be to oversample the negative cases; that is, to increase the samples of negative cases by some means and finally make the number of positive and negative cases equal. The main idea is illustrated in Figure 3.
The operating cost of the under-sampling method is generally lower than that of the over-sampling method. When the number of samples is large, we generally prefer under-sampling. Here, we must ensure that the new data obtained by (the new) sampling have the same distribution as the original data, otherwise we risk losing critical information. When the amount of data is relatively small, the over-sampling method is preferred. In this paper, since the number of BIM elements in the different categories is not large overall, we use the over-sampling method. Here, we do not simply repeat the sampling, which would potentially lead to severe overfitting. The representative algorithm of the oversampling method is SMOTE, the main idea of which is to generate additional samples using numerical interpolation.

3.3. Feature Selection

In machine learning, the data determine the upper bound of the model, and the algorithm only “approaches” this upper bound. Without considering other factors, Figure 4 shows the general relationship between the number of features of the model and the effect of the model; that is, the number of features reaches the optimal value in the middle [18,19,20,21,22]. In this case, any increase or decrease in the number of features will downgrade the effect of the model.
In this work, combined with the results of the data analysis, the characteristics and types of different BIM elements obtained are shown in Table 2. The final selection of 6 features, including two character features: Is External, Is Load Bearing, represent whether it is outside and whether it is load bearing, respectively; four numerical features including Length, Cross Section Area, Volume and Number of Cartesian points represent Length, Cross Section Area, Volume and Number of Cartesian points, respectively. Perimeter and Area have not been retained, since the two corresponding columns have almost zero attributes out of the four elements we have chosen to categorize.

4. BIM Element Classification

As mentioned above, BIM element classification plays an important role in the construction planning stage, cost estimation process and execution stage. The information obtained by BIM element classification can facilitate effective communication between architectural designers, engineers, cost engineers and contractors. On the basis of the completion of the data set production and the derivation of three machine learning methods including support vector machine, artificial neural network and decision tree, in this work, we adopt the above three methods for the classification of BIM elements and compare them on the basis of the results obtained.

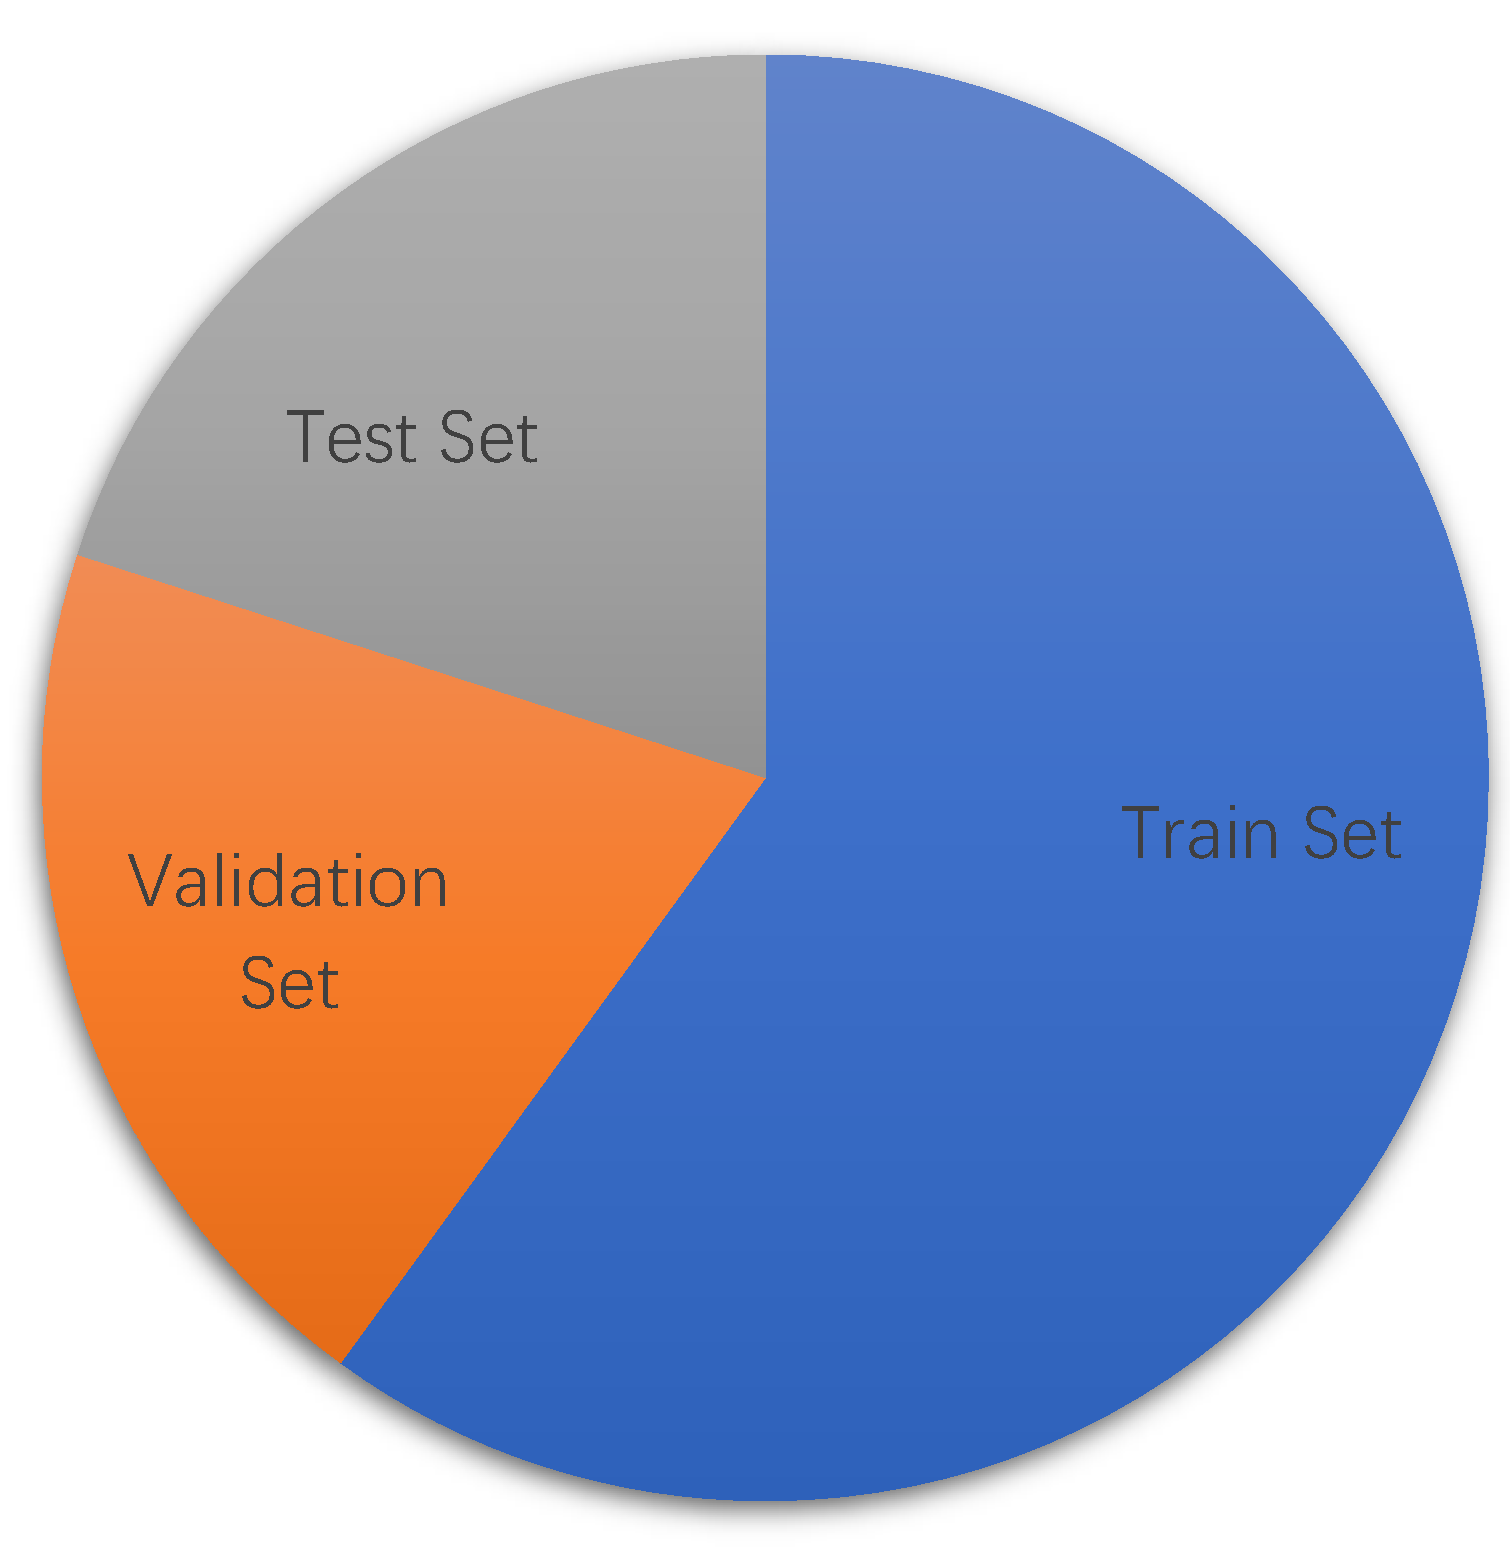
4.1. Data Set and Overall Thinking

As was carried out for the 11 IFC files used for these tests, the information about the original BIM elements was extracted (using Python) to obtain an overview of the number of elements in each data set, as shown in Table 3.
It can be seen from Table 3 that there is significant variation in the total number of selected elements extracted from the different IFC files, ranging from 0 to 11,328. Among the selected elements to be classified, the six data sets (in bold) all contain at least three types of elements, and the number of elements therein accounts for over 50% of the total number of elements, which illustrates the rationale behind the selection of these four types of elements for classification in the first place. We thus attempt to classify elements separately using a single dataset and multiple datasets. We note that in the classification using multiple data sets, we first perform the feature engineering of these data sets, forming a new data set. The reason is that there is significant variation in the volumes of the different buildings, as well as the values of their geometric features. If the buildings were to be directly merged into the feature project, the feature standardization would lead to extremely small buildings, and the value of each feature would subsequently be very small, resulting in distortion of the data set.
Before the BIM element classification, an essential step is partitioning the data set. A data set is usually randomly scrambled and broken into three parts: a training set, a verification set, and a test set. Of these, the function of the training set is to train the model and find the inherent law. The function of the verification set is to tune the hyperparameters of the algorithm, including kernel function types and the parameters in the Support Vector Method (SVM), network architecture and learning rate in the Artificial Neural Network (ANN), number of decision trees in random forest, etc. The purpose of the test set is to test the performance of the model. As shown in Figure 5, the training set accounts for 60%, the verification set accounts for 20%, and the test set accounts for 20%. Generally speaking, the higher the proportion the training set accounts for, the better the performance of the model, without considering fitting. However, we must expect the training time to increase accordingly.
The construction process of the data set used in this paper has been explained in detail in the previous sections. There are three main data sets used, as shown in Table 3. The source of the dataset is the data extracted from the IFC files, each file being represented by two uppercase letters, and the specific referential relationship is seen in Table 2.
Data1 and Data2 are extracted from a single IFC file, while Data3 and Data4 are merged with the data extracted from multiple IFC files. The main purpose of data1 is to test the effectiveness of the machine learning algorithm in BIM element classification; that of Data2 is to oversample Data1, so that we have an equal number of elements to be classified to verify the impact of classification on inter-class imbalance. The five IFC files that make up dataset three are shown in bold in Table 4. All five IFC files contain at least three categories of elements to be classified. Dataset IV consists of three IFC files, all of which contain four elements to be categorized. Data3 and Data4 are used to prove the effectiveness of the machine learning algorithm in sorting tasks on data sets composed of multiple files in the final results and comparison.
The overall idea of element classification in this section is illustrated in Figure 6. Among them, IE, IL and the other six items, respectively, represent the attributes of elements to be classified, the label being the name of the element. The whole process is divided into three steps: first, the three algorithms are trained in the training set to obtain the model; second, the super parameters of the model are adjusted on the verification set; third, the effect of the model is tested on the test set.

4.2. BIM Element Classification Experiment

Here, we adopt various machine learning algorithms for classifying BIM elements.

4.2.1. BIM Element Classification Based on Support Vector Machine

A support vector machine with Gaussian kernel was used to conduct experiments on data set 1. When the Gaussian kernel is used, there are two super parameters σ, C, where σ is the parameter of the kernel function
k ( x i , x j ) = exp ( x i x j 2 2 σ 2 )
also known as the bandwidth of the Gaussian kernel, and C is the regularization term, which can be understood as the weighting factor for adjusting two optimization indices: interval size and classification accuracy. The mesh method was used to optimize the two super parameters, as seen in Table 5.
As we can see from Table 5, a SVM based on Gaussian kernel can achieve the highest accuracy of 1 on the training set and 0.9908 on the test set. Compared with the linear kernel SVM, the accuracies of both SVMs are greatly improved. In addition, we observed that the super parameters corresponding to the highest precision on the training set and the highest precision on the test set are neither unique nor the same. When σ is given to 10, C equals 10, 20, 50, 100, respectively. Even with the highest accuracy of 1 on the training set, the accuracy of the test sets is only 0.8479. This is the machine learning of over fitting phenomenon; the algorithm performance on the training set was very excellent and had a good effect on the test set. When C is 0.01, the accuracies of both the test set and the training set are poor, which illustrates the phenomenon of underfitting.
It is very important in machine learning to optimize the hyperparameter by using the obfuscating matrix corresponding to the optimal hyperparameter. Its main significance lies first in improving the accuracy of the model, followed by preventing the over-fitting and under-fitting phenomena. Combined with the results in Table 5, and combining the two factors of training set accuracy and test set accuracy, the optimal super parameter values are C = 100, σ = 0.01, and the corresponding confusion matrix is shown in Figure 7. It can be seen that all elements are correctly classified, except for a few MEMBER elements that are misclassified as BEAM. This also demonstrates the effectiveness of the support vector machine in BIM element classification.

4.2.2. BIM Element Classification Based on Artificial Neural Network

In this section, an artificial neural network is adopted for classifying BIM elements, and the data set used is Data1. The network architecture used here is shown in Figure 8. The optimization procedure of these super parameters adopts the grid-based search method (we have not shown the specific process but only the optimal super parameters in Table 6).
When selecting the optimal super-parameter, the relationship between the loss of the entire training process and the accuracy and the number of iterations is shown in Figure 9. It can be seen that the value of the loss function decreases with the increase in the number of iterations, while the accuracy increases with the increase in the number of iterations. The above law was satisfied in both the training set and the verification set.
Quantitatively, the accuracy on both the training set and the verification set reached 1, and the loss on the training set was 0.1185 and 0.0144, respectively. The performance of the final model on the test set is shown in Table 7. The final classification accuracy reached 0.9816.

4.2.3. BIM Element Classification Based on Decision Tree and Random Forest

Data1 is still adopted. The visualization results of the decision tree classification are given directly below. As shown in Figure 10, the root node includes 648 classification elements. The minimum Gini index is 0.674 and the number of corresponding decision conditions for Volume is less than or equal to 0.074. According to the two types of classification decision conditions, the number of elements that do not satisfy the conditions of the elements is 334. Subsequently, a new decision node was formed, and the above process was repeated until a new decision condition for the Cross Section Area was chosen, the result of this being less than or equal to 0.027. According to the satisfied conditions, they were further divided into two parts and the same classification was repeated until there remained only two parts and the Gini index was 0. This indicates that the purity of the data set reached the highest level. In the whole process of BIM classification using decision tree, it can be seen in Figure 10 that in all leaf nodes, the Gini index was 0.
Random forest is based on decision tree classifier Bagging learner. Theoretically speaking, the accuracy that can be achieved by using the random forest method should not be lower than that of decision tree. Data set 1 is still tested, and the number of base learners is 10. Since the decision tree starts at the random location of the test set every time, ten groups of experiments are conducted to obtain the results shown in Table 8.
From Table 8, we can see that in 10 groups of experiments, the accuracy of the training set and test set is 1, using the random forest method. This implies that the result of the random forest method has reached the limit of its performance and there can be no further improvement. The random forest method is implemented in parallel to the 10 decision trees to obtain the optimal one, while the precision of each decision tree reached a value of 0.991.
In addition to the final classification results, random forest can also give the impact of each feature on the classification results, as shown in Figure 11.
From Figure 11, we can see that all the six features selected have an influence on the final classification result, which is one of the reasons why we selected these six features. The most important feature has an importance of 0.32. In addition, the total impact of the first four features on the final classification results adds up to 0.9. This essentially provides a new training strategy: when faced with a large number of characteristics in a classification problem, we can apply the random forest method to achieve as much as possible without losing accuracy by reducing the feature dimension, thus improving the training efficiency of the model.

4.3. Results and Discussion

In this section, we first discuss the classification results of BIM element classification for single data sets (data1 and data2), followed by an investigation of the reliability of the machine learning algorithm for the Data3 and Data4 sets.

4.3.1. Comparison of Optimal Classification Results

In the first three stages, the support vector machine, artificial neural network, decision tree and random forest methods were used (in order) to classify BIM elements on data set 1. All four methods show very high accuracy. The optimal classification results of the four methods on data set 1 are shown in Table 9.
From Table 9, we can see that the precision of random forest is the highest, but the difference between this method and the other three is very small, and the final precisions of these methods are all over 0.98, which fully demonstrates the feasibility of using the above algorithm for classifying BIM elements on a single data set.
In order to further verify the effectiveness of BIM element classification using machine learning, we tested the same methods for the other data sets, composed of multiple IFC files.

4.3.2. Comparison of Classification Results in Single Different Dataset

The main purpose of this section is to verify the effectiveness of the machine learning algorithm for the classification of BIM elements on a single different data set, using the grid search method to find the optimal super parameters. The particular single data set selected was ON, NI, and EL, respectively, all of which contain four types of elements: BEAM, DOOR, MEMBER, and PLATE. Due to the large difference in the number of various elements, the resampling method was adopted to ensure that the samples ON each data set are balanced. SVM, ANN, decision tree and random forest were used to obtain the best classification results of these methods on the above three data sets. The parentheses following the dataset name in Table 10 represent the number of elements to be classified in the dataset.
From the horizontal comparison shown in Table 10, we can observe that, in general, all four methods have the highest classification accuracy with the data set “ON”, the lowest with NI, and EL is intermediate, indicating that the main reason for this observation is the data set. In other words, the data set “ON” has the best separability, while “NI” has the worst. The reason is that the data set “NI” is much larger, which increases the complexity of the data set. In machine learning, the features to be “learned” are more complex. However, that does not mean that the greater the number of elements, the worse the separability, as can be confirmed by the classification results with data sets “ON” and “EL”.
From a vertical comparison of the classification results obtained with different methods on the same data set, the accuracy of the RANDOM forest method seems to be the highest, with the test accuracy of “ON”, “NI” and “EL” reaching 1, 0.9454 and 0.9767, respectively. The difference in accuracy between the random forest and the other three methods is within two percent of each other. Furthermore, the accuracy obtained on the test sets are all above 0.94, which proves the feasibility of BIM element classification for different data sets using these four machine learning methods. This provides an answer the question in Section 3.1.

4.3.3. Comparison of Classification Results on Mixed Data Sets

In order to further verify the feasibility and effectiveness of machine learning algorithms in BIM element classification, two mixed data sets (data3 and data4) composed of three types of IFC data were tested.
In order to avoid an inter-class imbalance, resampling was carried out on 18,005 elements of data3, so that the number of elements of each type reached 11,692. At this point, the data set contained 46,768 elements. The data set was divided into training set, verification set and test set in the ratio 6:2:2, and BIM element classification was carried out on the data set by SVM, ANN, decision tree and support vector machine, respectively. The results obtained are shown in Table 11. The optimization of hyperparameters was performed using the grid-based search method.
As can be seen from Table 11, the training and test accuracies for the four methods in Data3 hover around a value of 0.82, which shows a significant decrease compared with the performance for a single data set. The obfuscating matrix for the four methods above Data3, shown in Figure 12, explains the decrease in accuracy.
It can be seen from Figure 12 that the confusion matrices for the SVM, decision tree and random forest methods are all the same, and the difference with ANN lies in the classification of elements such as MEMBER, which is only 0.03. This indicates that the main influence on the classification results is not that of the machine learning method itself, but rather the data set. By comparing the confusion matrices of the four methods, it can be seen that the element affecting the final classification accuracy is mainly MEMBER. An element that should be classified as MEMBER is misclassified as PLATE in 62% of the cases. By looking at the original information in Data3, we can see that the MEMBER element misclassified is consistent with PLATE in terms of features. Therefore, in order to improve the final classification accuracy, more features need to be mined in order to properly distinguish between MEMBER and PLATE. An additional factor (that cannot be ignored) is the three data sets by ON + TH + FO + NI + EL, i.e., the merging of five IFC files to extract information; the TH and FO contain only three elements for classification (excluding BEAM), and the number of elements in 11,396 accounts for more than 60% of the total elements in the collection data. As a result, these two IFC files of information changed the original data distribution. This is the main reason why the efficiency of the machine learning method when applied to the sets of data3 was less prominent.
Next, more complex mixed data are tested with Data4, including all data sets of data3 and the addition of the other two IFC data. We removed TH and FO and selected ON+NI+EL, which are all of the four types of elements, to form Data4. Similarly, the data set was oversampled, resulting in 3533 elements in each category, with a total of 14,132 elements in the data set. Then, the data set was randomly divided according to 6:2:2, and BIM element classification was carried out by four methods. The results are shown in Table 12.
It can be seen from Table 12 that the accuracy of the four methods in data4 is above 0.95, which is quite high for the classification problem. Compared with Table 11, the accuracy increased by more than 12 percentage points. It also illustrates that the poor performance of the four machine learning methods on the three data sets is due to the influence of two data sets: TH and FO and TH and FO, respectively. Because it does not contain BEAM elements, and the total number of elements is larger. This changed the distribution of the whole data set and made it much more difficult to distinguish between MEMBER and PLATE elements. In order to support the above viewpoints, the obfuscation matrix of the optimal classification on data4 by four methods is given, as shown in Figure 13.
It can be seen that in data set 3, the classification accuracy of the MEMBER element, which is difficult to classify, increased from 0.36 to 0.9, thus ensuring good classification. This shift also improved the overall classification accuracy from 0.82 (dataset 3) to 0.95 (dataset 4).
The results in Table 12 are very close to the classification results for a single dataset seen in Table 10. This clearly shows that for the data sets containing BEAM, DOOR, MEMBER and PLATE together, even from different IFC files, the overall distribution of the data is more or less similar, which also validates the theoretical basis for the classification of BIM elements using machine learning. From the classification results, the SVM, ANN, decision tree and random forest methods show ideal classification accuracies.
The above facts show that SVM, ANN, decision tree and random forest are potentially very useful for classifying BIM elements. It must be noted that there are certain differences in the distribution of data sets generated from different IFC files, which are seen in the types and quantities of elements. When several IFC files are identical in element type, their elements can be imported into the same dataset for classification. When the types and quantities of elements vary greatly, it is best to use machine learning to classify their elements using a data set generated from a single IFC file to ensure the accuracy of the final classification.

5. Abnormal Data Detection

5.1. Abnormal Data and Evaluation Indexes

A problem inevitably brought about by the massive amount of BIM data is that errors occur in the modeling process during data generation, even though abnormal data only account for a small percentage compared to normal data. The detection of abnormal data is very difficult but necessary.
If only the index of accuracy was used, it would be very misleading. Assuming that the proportion of abnormal data is 1%, in this case, the output of the setting model is normal; that is, no matter what the input data is, the final output is normal. In this case, the accuracy of abnormal data detection can be as high as 99%, since only 1% of the data is misclassified. This result is obviously unacceptable, because we have not found all the abnormal data, even though the accuracy rate is 99%. This shows that in the special context of anomaly detection, merely using the index of accuracy, is not enough, and a new index is required for objectively evaluating the final experimental results, ideally a combination of Accuracy, Precision, Recall and F1-score.
Next, we define normal and outliers. The so-called normal data refers to data points whose attributes match their labels, and the abnormal data refers to data points whose attributes do not match their labels. The latter may be divided into two categories. For example, BEAM is considered as normal data here, while one is an abnormal attribute value (wrong attribute value appearing, which may be one or more). The other category refers to an abnormal value of the label; that is, the name of the data is not BEAM, but their label has wrongly been added to BEAM, as seen in Table 13.
Taking the BEAM type data as an example, we now need an approach for identifying abnormal data. The solution is: add the label 0 to normal data, and 1 to abnormal data. Of course, the above operation is used for the two types of abnormal data, as seen above. Next, we need to investigate the main sources of abnormal data. Here, we see that there are two main categories again. The first is the data whose label is not BEAM, generally considered to be the data with an abnormal label. For the other one, there is an artificial change in the properties of the normal BEAM that render it abnormal. For example, in the Number of Points in the column attribute, 3 and 16 frequently appear as the normal value of BEAM. Here, we set 6 or 50, and so on as an abnormal value. A similar idea is applied to change the last second attributes of AREA. The normal attributes are denoted as zero, the abnormal ones can be changed by non-zero data, such as 1, 2, 3, and so on.

5.2. Abnormal Data Detection Experiment

According to the category of exception data, three data sets: DATA_L, DATA_F, DATA_LF, were constructed on the basis of dataset 1, which are defined as the label exception data set, attribute exception data set, label and attribute exception data set, respectively. The duplicate data were removed. Due to label anomaly, BEAM class elements were marked as normal data and other elements were marked as abnormal data to form the data set DATA_L. For attribute exceptions, the proportion of exception data was 10%; that is, for every 10 elements, a random feature of an element was selected and changed to a random floating-point number between 0 and 20, and marked as exception data to form data set DATA_F. The dataset DATA_LF was formed by merging the datasets DATA_L and DATA_F. Due to the particularity of anomaly detection, when partitioning data sets, the ratio between the training set, verification set and test set was no longer 6:2:2, but rather 8:1:1, which was chosen according to the current situation. The specific composition of the three data sets were finally generated as shown in Table 14.
Due to the partition proportion and the imbalance between classes, stratified sampling must be adopted in the partitioning of data sets to avoid a situation wherein there are either no abnormal data or excessive abnormal data in the test set, which will subsequently affect the final experimental results. Here, ANN and random forest are used for detecting the abnormal data. The entire procedure of super-parameter optimization is not shown here, and the final experimental results are given in Table 15.
As can be seen from Table 15, ANN and RF have four indices of 1 in DATA_L, indicating that both methods have excellent performance in the case of label exceptions. In DATA_F, the accuracy of ANN and RF were both above 0.95, the accuracy of ANN was 1 higher than that of RF, and the recall rate of RF was 0.9327 higher than that of ANN. The overall performance of the two methods is comparable, and each has its own advantages. In DATA_LF, the accuracy of RF was two percentage points higher than that of ANN, the accuracy of ANN was slightly higher, and the recall rate of RF was slightly higher. Overall, the performance of the two data sets was lower than the first data set, but the recall rate was able to reach more than 0.91 as a whole (for all the abnormal data). We can detect more than 91%, using the algorithm, showing that the two methods for abnormal data detection have high potential. In the future, if the capacity of the data set can be expanded and the quality of the data set can be further improved, ANN and RF will have a better performance in BIM abnormal data detection.

6. Conclusions

In this paper we presented a machine learning approach in the context of large-scale BIM data, with the following salient features:
We used a Python code to parse the IFC files and extract all BIM elements and their properties for data processing; based on the extracted BIM data, support vector machine, simple neural network, decision tree and random forest methods were successfully implemented for the classification of BIM elements. The classification accuracy of the four methods on the test set reached more than 98%, and the classification accuracy of the random forest method with the best classification effect reached a value of 100%. In addition, the random forest method was used to study the influence of different features on BIM element classification results, which provides fresh perspectives for feature reduction.
A definition criterion for anomaly detection was given, and K-means clustering was used to predict the validity of elements. In the context of abnormal data detection, the artificial neural network algorithm was adopted, and the final recall rate was 92%, which allowed effective abnormal data detection.

Author Contributions

Conceptualization, M.X. and R.F.C.; methodology, Z.C.; software, S.T.; validation, M.X., R.F.C. and Z.C.; formal analysis, M.X.; investigation, S.T.; resources, R.F.C.; data curation, S.T.; writing—original draft preparation, M.X.; writing—review and editing, M.X., R.F.C.; visualization, Z.C.; supervision, M.X.; project administration, M.X.; funding acquisition, M.X. All authors have read and agreed to the published version of the manuscript.

Funding

This research was funded by [the National Science and Technology Major Project] grant number [2019-VI-0001-0113] and was supported by [the Natural Science Foundation of Shaanxi Province, China] grant number [2021JM-043].

Institutional Review Board Statement

Not applicable.

Informed Consent Statement

Not applicable.

Acknowledgments

This research study was supported by the Natural Science Foundation of Shaanxi Province, China (Grant No. 2021JM-043).

Conflicts of Interest

The authors declare no conflict of interest.

References

  1. Bradley, A.; Li, H.; Lark, R.; Dunn, S. BIM for infrastructure: An overall review and constructor perspective. Autom. Constr. 2016, 71, 139–152. [Google Scholar] [CrossRef]
  2. Tamke, M.; Myrup, M.; Evers, H.L. D7.7.1-Current State of 3D Object Processing in Architectural Research and Practice. Available online: http://duraark.eu/wp-content/uploads/2014/06/duraark_d7.7.1.pdf (accessed on 15 June 2022).
  3. Tamke, M.; Jensen, M.M.; Beetz, J.; Krijnen, T.; Edvardsen, D.F. Building Information Deduced: State and Potentials for Information Query in Building Information Modelling. In Proceedings of the Fusion: Proceedings of the 32nd eCAADe Conference, Newcastle upon Tyne, UK, 10–12 October 2014; Thompson, E.M., Ed.; 2014; pp. 375–384. [Google Scholar]
  4. Krijnen, T.; Tamke, M. Assessing implicit knowledge in BIM models with machine learning. In Design Modelling Sympoisum: Modelling Behaviour; Springer: Cham, Switzerland, 2015. [Google Scholar] [CrossRef]
  5. Howell, S.; Rezgui, Y. Beyond BIM: Knowledge Management for a Smarter Built Environment; BRE Electronic Publications: Garston, UK, 2018. [Google Scholar]
  6. Kubicki, S.; Guerriero, A.; Schwartz, L.; Daher, E.; Idris, B. Assessment of synchronous interactive devices for BIM project coordination: Prospective ergonomics approach. Autom. Constr. 2019, 101, 160–178. [Google Scholar] [CrossRef]
  7. Leggieri, V.; Ruggieri, S.; Zagari, G.; Uva, G. Appraising seismic vulnerability of masonry aggregates through an automated mechanical-typological approach. Autom. Constr. 2021, 132, 103972. [Google Scholar] [CrossRef]
  8. Batty, M. Digital twins, Environment and Planning B: Urban Analytics and City Science. SAGE J. 2018, 45, 817–820. [Google Scholar]
  9. Boje, C.; Guerriero, A.; Kubicki, S.; Rezgui, Y. Towards a semantic Construction Digital Twin: Directions for future research. Autom. Constr. 2020, 114, 103179. [Google Scholar] [CrossRef]
  10. Lomio, F.; Farinha, R.; Laasonen, M.; Huttunen, H. Classification of Building Information Model (BIM) Structures with Deep Learning. arXiv 2018, arXiv:1808.00601. [Google Scholar]
  11. Valero, E.; Forster, A.; Bosché, F.; Renier, C.; Hyslop, E.; Wilson, L. High Level-of-Detail BIM and Machine Learning for Auto-mated Masonry Wall Defect Surveying. In Proceedings of the 35th International Symposium on Automation and Robotics in Construction, Berlin, Germany, 25–28 July 2018. [Google Scholar]
  12. Zhang, H.; Gu, M. Research and Application of Intelligent BIM Model Checking Tools. J. Inf. Technol. Civ. Eng. Archit. 2018, 10, 1–6. [Google Scholar]
  13. Romero-Jarén, R.; Arranz, J. Automatic segmentation and classification of BIM elements from point clouds. Autom. Constr. 2021, 124, 103576. [Google Scholar] [CrossRef]
  14. Jung, N.; Lee, G. Automated classification of building information modeling (BIM) case studies by BIM use based on natural language processing (NLP) and unsupervised learning. Adv. Eng. Inform. 2019, 41, 100917. [Google Scholar] [CrossRef]
  15. McArthur, J.; Shahbazi, N.; Fok, R.; Raghubar, C.; Bortoluzzi, B.; An, A. Machine learning and BIM visualization for maintenance issue classification and enhanced data collection. Adv. Eng. Inform. 2018, 38, 101–112. [Google Scholar] [CrossRef]
  16. Koo, B.; Shin, B. Applying novelty detection to identify model element to IFC class misclassifications on architectural and infrastructure Building Information Models. J. Comput. Des. Eng. 2018, 5, 391–400. [Google Scholar] [CrossRef]
  17. Bloch, T.; Sacks, R. Comparing machine learning and rule-based inferencing for semantic enrichment of BIM models. Autom. Constr. 2018, 91, 256–272. [Google Scholar] [CrossRef]
  18. Donoho, D.L. High-Dimensional Data Analysis: The Curses and Blessings of Dimensionality. AMS Math Chall. Lect. 2000, 1, 32. [Google Scholar] [CrossRef]
  19. Nagler, T.; Czado, C. Evading the curse of dimensionality in nonparametric density estimation with simplified vine copulas. J. Multivar. Anal. 2016, 151, 69–89. [Google Scholar] [CrossRef] [Green Version]
  20. Salimi, A.; Ziaii, M.; Amiri, A.; Hosseinjanizadeh, M.; Karimpouli, S.; Moradkhani, M. Using a Feature Subset Selection method and Support Vector Machine to address curse of dimensionality and redundancy in Hyperion hyperspectral data classification. Egypt. J. Remote. Sens. Space Sci. 2017, 21, 27–36. [Google Scholar] [CrossRef]
  21. Fernández-Martínez, J.L.; Fernández-Muñiz, Z. The curse of dimensionality in inverse problems. J. Comput. Appl. Math. 2020, 369, 112571. [Google Scholar] [CrossRef]
  22. Grüne, L. Overcoming the curse of dimensionality for approximating Lyapunov functions with deep neural networks under a small-gain condition. IFAC-PapersOnLine 2021, 54, 317–322. [Google Scholar] [CrossRef]
Figure 1. ETDI model TXT display.
Applsci 12 06382 g001
Figure 2. Data storage form of IFC files.
Applsci 12 06382 g002
Figure 3. Schematic diagram of over-sampling and under-sampling.
Applsci 12 06382 g003
Figure 4. Relationship between model effect and number of features.
Applsci 12 06382 g004
Figure 5. Data set partitioning.
Applsci 12 06382 g005
Figure 6. The overall idea of BIM element classification.
Applsci 12 06382 g006
Figure 7. The confusion matrix corresponding to the optimal hyperparameter.
Applsci 12 06382 g007
Figure 8. ANN architecture.
Applsci 12 06382 g008
Figure 9. The relationship diagram of loss and accuracy with iteration times.
Applsci 12 06382 g009
Figure 10. Decision tree results visualization.
Applsci 12 06382 g010
Figure 11. The influence of different characteristics on the classification results.
Applsci 12 06382 g011
Figure 12. Confusion matrix about Data3.
Applsci 12 06382 g012
Figure 13. Confusion matrix about Data4.
Applsci 12 06382 g013
Table 1. Basic information of BIM.
VisualizationNameStandardNum.of Ele
Applsci 12 06382 i00120160125_Existing_Trapelo_Design_IntentIFC2X31479
Applsci 12 06382 i002210_King_TorontoIFC2X38820
Applsci 12 06382 i003Wyandotte_LoftsIFC2X32887
Applsci 12 06382 i00420190104WestRiverSide_
Hospital_Architecture
IFC414,440
Table 2. Feature types and selection.
Characteristics of the NameTypeChoose
Representation Type (R)STRING
Is External (IE)STRING
Is Load bearing (IL)STRING
Length (L)FLOAT
Perimeter (P)FLOAT
Area (A)FLOAT
Cross Section Area (C)FLOAT
Volume (V)FLOAT
Number of Cartesian points (N)INT
Table 3. Number of four elements extracted on the 11 IFC files.
File NameNumber of ElementsTotalMark
BEAMDOORPLATEMEMBERSUM
ETDI.IFC51212223021810821479ON
11…15.IFC0000078TW
21…to.IFC0211375103716232750TH
20…re.IFC044022117122977311,328FO
A…FC.IFC0770077327FI
Co…ng.IFC00000270SI
Re…ct.IFC1370022159231SE
Sim…le.IFC000000EI
Te…ol.IFC141001349329447575284NI
Ur…15.IFC0000023TE
Wa…ts.IFC63203483217701471EL
Table 4. Overview of data set.
DataSourceTotalElement
BEAMDOORPLATEMEMBER
Data1ON1082512122230218
Data2ON2048512512512512
Data3ON+TH+FO+NI+EL18,0055891076484811,692
Data4ON+NI+EL660958942520623533
Table 5. SVM Hyperparameter Optimization.
σ0.010.1110
TrainingTestTrainingTestTrainingTestTrainingTest
0.010.48780.41470.76760.70510.69710.65050.69710.6405
0.10.84620.78800.85200.79260.98500.95850.97910.8341
10.85200.79260.98500.96770.99880.97690.99880.8479
C100.85200.79260.99880.97230.99880.98621.0000.8479
200.98490.96770.99880.98160.99880.98621.0000.8479
500.99420.99080.99880.98160.99880.98621.0000.8479
1000.99880.99080.99880.97691.0000.98621.0000.8479
Table 6. ANN optimal Hyperparameter.
HyperparameterOptimal Value
Network StructureN(6,8,4)
Max Iteration100
Optimization methodSDG
Learning rate0.03
Momentum0.5
Table 7. ANN classifies the optimal results.
TargetResult
Accuracy0.9816
Loss0.1509
Table 8. Random Forest results.
Training AccuracyTest Accuracy
111
211
11
1011
Table 9. Optimal classification results.
OptimizationSVMANNDecision TreeRandom Forest
Training Accuracy0.9988111
Test Accuracy0.99080.98160.99081
Table 10. Optimal classification results for a single different dataset.
ON(2048)NI(13176)EL(1932)
TrainingTestTrainingTestTrainingTest
SVM0.99880.99080.94610.94530.97840.9767
ANN10.98160.94560.94500.96720.9587
DT10.99080.94610.94540.97840.9767
RF110.94610.94540.97840.9767
Table 11. Data3 optimal classification results.
SVMANNDTRF
Hyperparameter C = 20 , σ = 50 r = 0.01 , α = 0.99 DEFAULT n = 10
Train Accuracy0.82550.82210.82520.8252
Test Accuracy0.82240.82150.82410.8241
Table 12. Data4 optimal classification results.
SVMANNDTRF
Hyperparameter C = 20 , σ = 100 r = 0.01 , α = 0.99 DEFAULT n = 10
Training Accuracy0.95420.95100.95580.9558
Test Accuracy0.95220.95080.95580.9558
Table 13. Definition of normal and abnormal value.
normal dataBEAM W-Wide F SweptSoli False True 0.261838 3 0 0 0 0
BEAM C-Channe SwptSoli False True 0.103896 16 0 0 0 0
Normal
Abnormal dataBEAM W-Wide F SwptSoli False True 0.266505 3 0 0 1 0
BEAM W-Wide F SwptSoli False True 0.261838 6 0 0 1 0
Abnormal properties
BEAM Exit Door MappedR False True 0.266505 28 0 0 0 0
BEAM Stair: Steel Brep False True  0.261838 95 0 0 0 0
Abnormal label
Table 14. Overview of experimental data sets.
Data SetNumber Data Set Composition
Normal Abnormal
DATA_L27823939
DATA_F1082973109
DATA_LF13601223137
Table 15. Experimental results of abnormal data detection.
DATA_LDATA_FDATA_LF
ANNRFANNRFANNRF
Accuracy110.96410.95900.94630.9587
Precision1110.98980.96690.9616
Recall110.93270.93270.92860.9512
F1 Score110.96520.96040.94740.9590
HyperparameterAdagrad
r = 0.08
iter = 100
6-8-1
r-si
n = 10 Adagrad
r = 0.07
iter = 200
6-32-16-2
r-r-so
n = 10 Adagrad
r = 0.08
iter = 200
6-36-64-8-1
r-si-r-si
n = 10
Publisher’s Note: MDPI stays neutral with regard to jurisdictional claims in published maps and institutional affiliations.

