Article

Predicting Employee Attrition Using Machine Learning Approaches

1
Department of Computer Science, Khwaja Fareed University of Engineering and Information Technology, Rahim Yar Khan 64200, Pakistan
2
Faculty of Computer Science and IT, Khawaja Fareed University of Engineering & IT, Rahim Yar Khan 64200, Pakistan
3
College of Computer Science and Engineering, University of Hafr Al Batin, Hafr Alabtin 31991, Saudi Arabia
*
Authors to whom correspondence should be addressed.
Appl. Sci. 2022, 12(13), 6424; https://doi.org/10.3390/app12136424
Submission received: 12 May 2022 / Revised: 6 June 2022 / Accepted: 15 June 2022 / Published: 24 June 2022

Abstract

:
Employee attrition refers to the natural reduction in the employees in an organization due to many unavoidable factors. Employee attrition results in a massive loss for an organization. The Society for Human Resource Management (SHRM) determines that USD 4129 is the average cost-per-hire for a new employee. According to recent stats, 57.3% is the attrition rate in the year 2021. A research study needs to be implemented to find the causes of employee attrition and a learning framework to predict employee attrition. This research study aimed to analyze the organizational factors that caused employee attrition and the prediction of employee attrition using machine learning techniques. The four machine learning techniques were applied in comparison. The proposed optimized Extra Trees Classifier (ETC) approach achieved an accuracy score of 93% for employee attrition prediction. The proposed approach outperformed recent state-of-the-art studies. The Employee Exploratory Data Analysis (EEDA) was applied to determine the factors that caused employee attrition. Our study revealed that the monthly income, hourly rate, job level, and age are the key factors that cause employee attrition. Our proposed approach and research findings help organizations overcome employee attrition by improving the factors that cause attrition.

1. Introduction

Employee attrition is expressed as the normal process by which the employees leave the organization due to some reasons, such as the resignation of employees. There are many factors that can cause employee attrition [1]. The employees leave the organization faster than they are hired. When the employee leaves the organization, the vacancies remain unfilled, resulting in a loss for the organization. The employee attrition rate helps to understand the progress level of an organization. The high attrition rate shows that the employees are frequently leaving. The results of the high attrition rate are the loss of organizational benefits [2]. In order to keep the organization in progress, the attrition rate must be controlled.
Many types of employee attrition help us to understand the attrition process. The attrition type is whether an employee chooses to leave the company voluntarily. The involuntary attrition type is when the organization ends the employment process. The external attrition type is referred to when an employee leaves an organization to work for another organization. Internal attrition occurs when an employee is given another position within the same organization as a promotion. The employee attrition rate is the measure of people who leaves the organization. By measuring the attrition rate, we can identify the causes and factors that need to be solved to eliminate employee attrition. The attrition rate is calculated by dividing the number of employees who have left the company by the average number of employees over some time. The attrition rate helps us find the company’s progress over a specific period.
The employee attrition states [1] demonstrate that after six months of job duration, 1/3 of new employees leave the organization. The 3 to 4.5 million employees leave their job every month in the United States, according to the Job Openings and Labor Turnover Survey (JOLTS) [2]. The employee attrition rate is 57.3% in 2021 to the report of the Bureau of Labor Statistics [3]. The report also suggests that in many industries, the employee attrition rate is close to 19% [2]. The cost per hire of new employees is USD 4129 by SHRM [4]. Ninety percent of employee retention rate is considered suitable for a company, and the attrition rate must be less than 10%.
Machine learning [5] in the field of Artificial Intelligence (AI) gives the ability to machines to learn from historical data and make future predictions. Currently, machine learning is a crucial component of the data science field. The goal of machine learning techniques is to achieve higher accuracy results than humans. The machine learning models are utilized for decision-making. The learning process of machines is automated. The refined data are fed to machines to train and obtain decisions from them for new data. The primary aim of machine learning models is to find the patterns in data and learn from them.
The applications of machine learning for today’s technology are growing daily. The key applications of machine learning cover a broader area of real-world domains. The typical real word problems such as image recognition [6], traffic prediction [7], speech recognition, text classification [8], social analysis, stock market trading, health care [9], e-commerce, agriculture, healthcare, and many more are solved by using machine learning techniques. The machine learning models are utilized for the prediction of employee attrition [10]. The followings are the main contributions of our proposed research study in the context of employee attrition prediction:
  • The four advanced machine learning-based techniques Extra Trees Classifier (ETC), Support vector machine (SVM), Logistic Regression (LR), and Decision Tree Classifier (DTC), were applied for predicting employee attrition;
  • The comparative analysis among the four employed machine learning models in terms of accuracy score value was conducted to find the best performance fit evaluation technique;
  • We optimized the proposed ETC technique as an innovation to achieve the highest accuracy scores in comparison with machine learning techniques and also with the state-of-the-art studies;
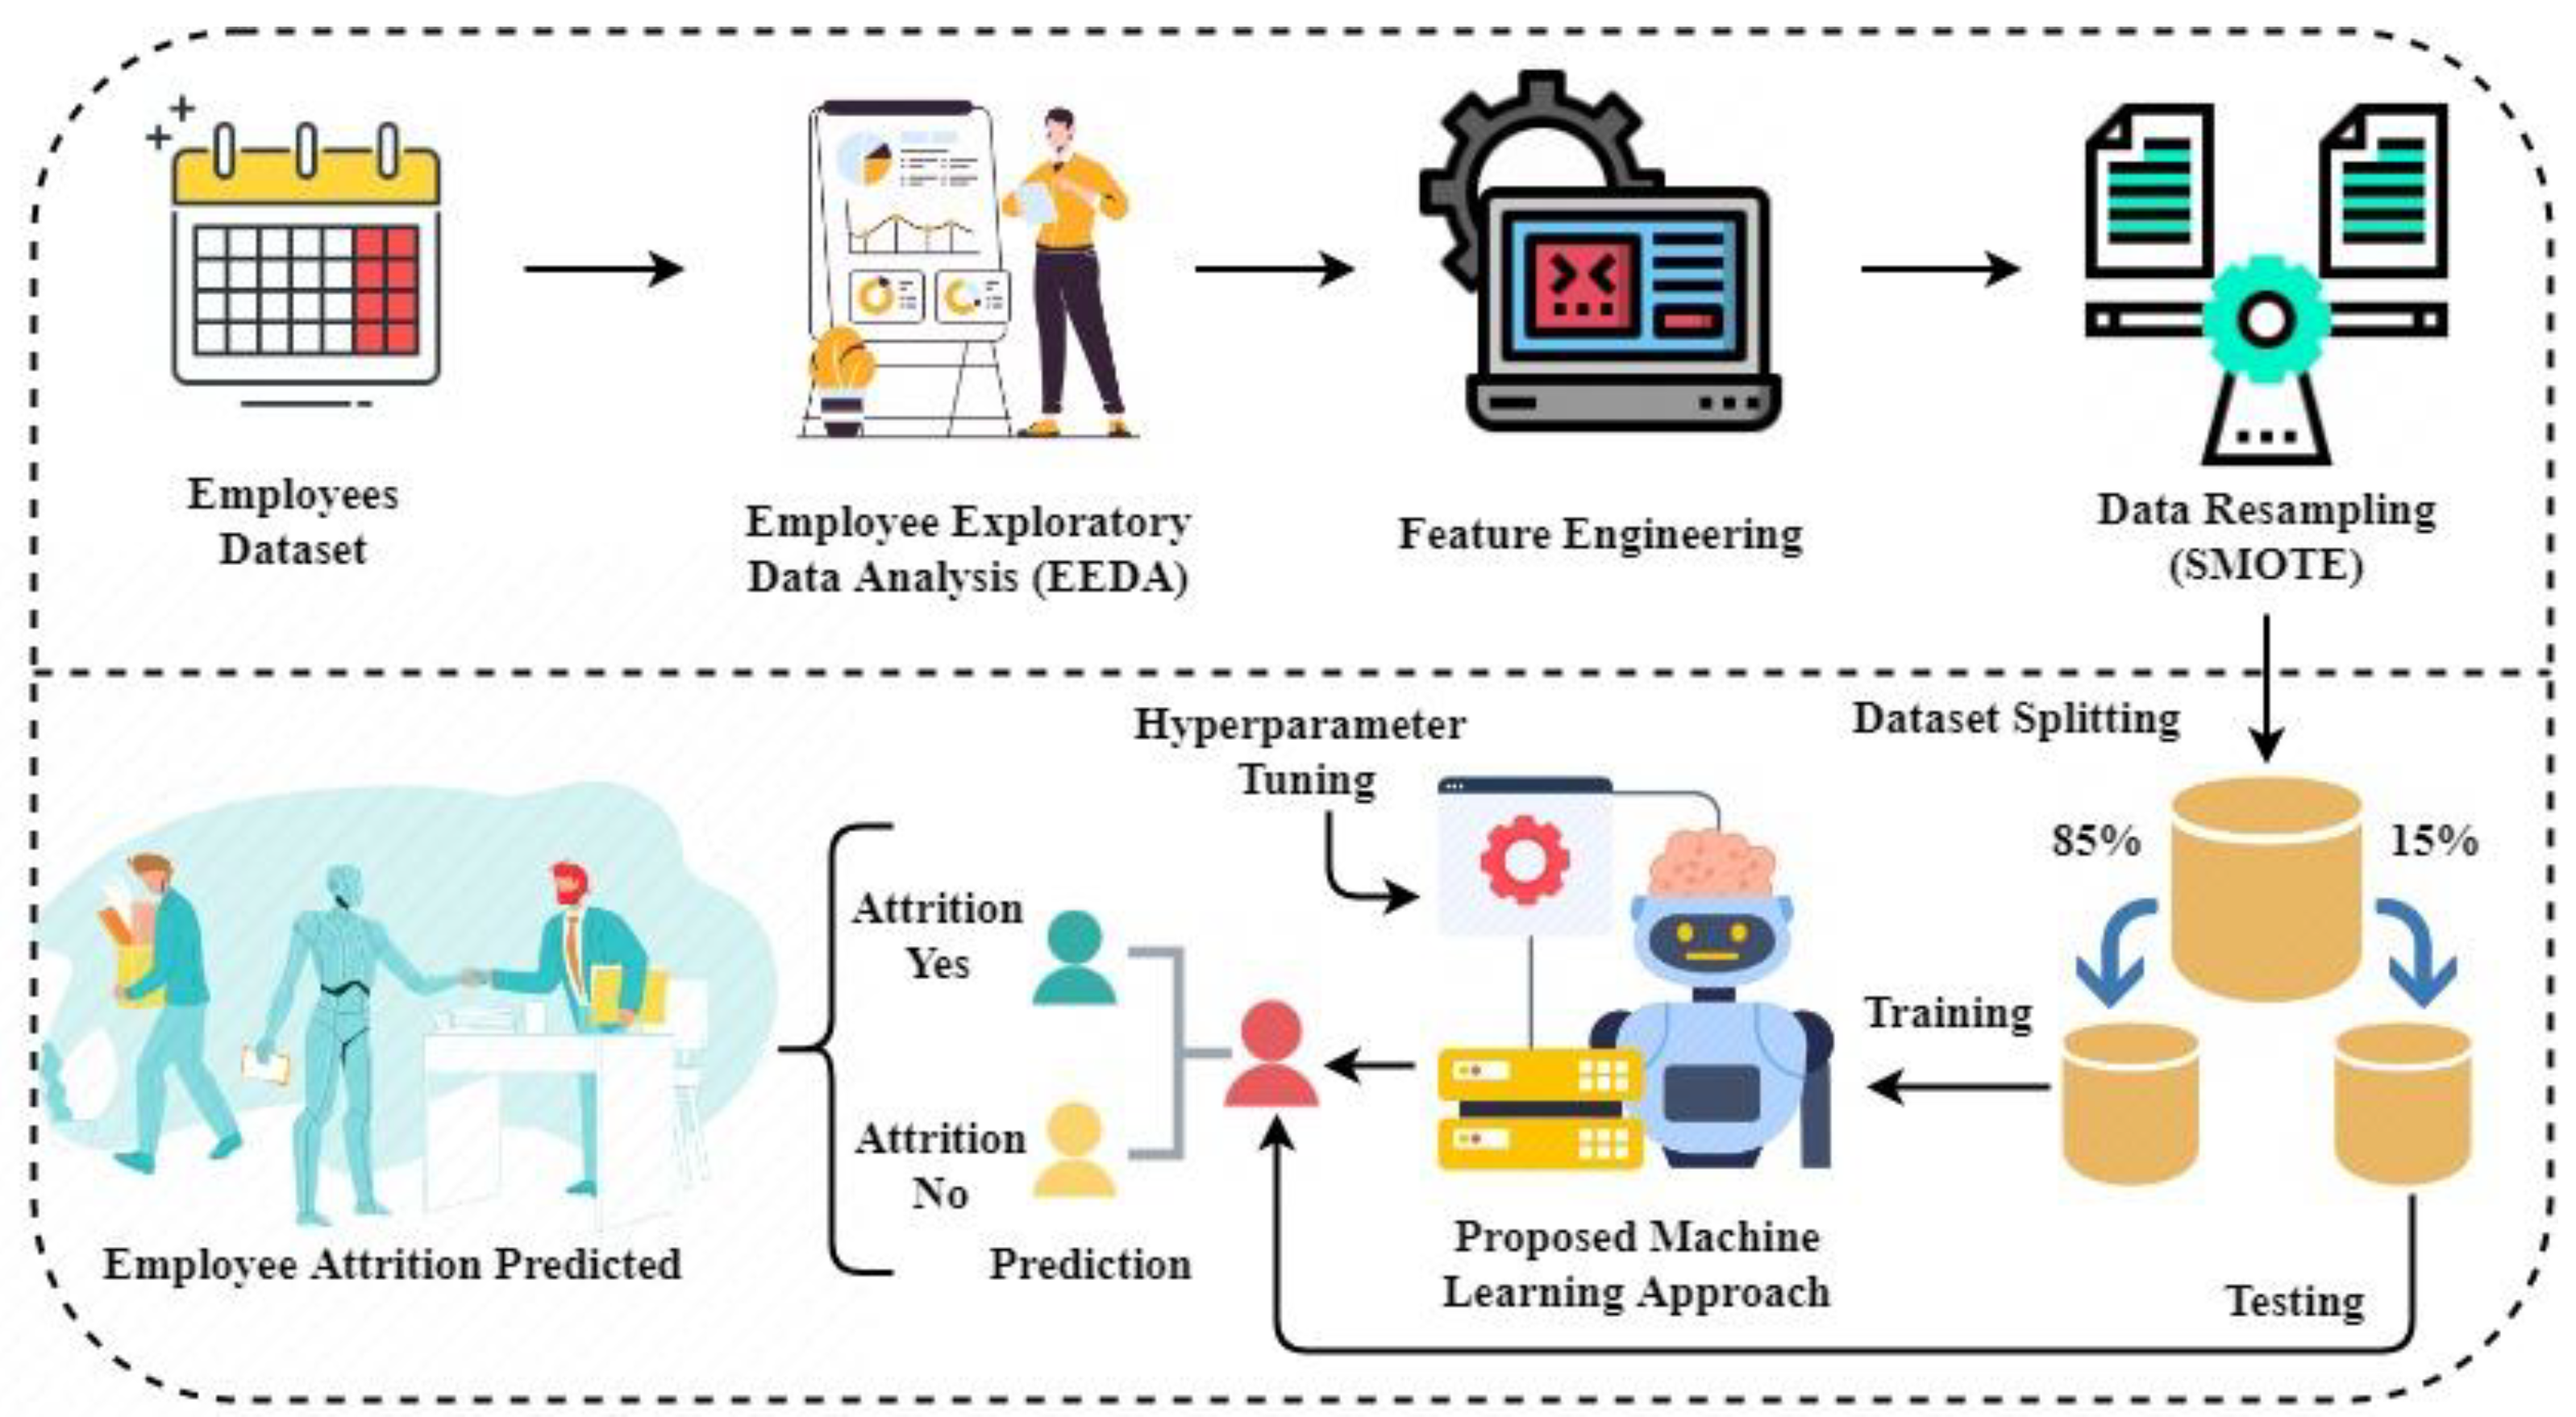
  • The Employee Exploratory Data Analysis (EEDA) was applied to obtain valuable insights from the dataset. The factors that affect employee attrition were examined.
  • The SOMTE (Synthetic Minority Oversampling Technique) dataset resampling was applied to make the dataset balanced. The data balancing reduces the model prediction complexity due to the equal number of target distributions and increased model accuracy scores;
  • The K-Fold cross-validation comparative analysis among the four employed approaches in terms of performance evaluation accuracy score;
  • The confusion matrix and ROC curve analysis of our proposed approach were conducted to examine the performance validation through different evaluation techniques.
The next sections of our research study are organized as follows: The related literature to our research is examined in Section 2. The methodology analysis of our research is reviewed in Section 3. The proposed approaches in the context of employee attrition are discussed in Section 4. The results and evaluations of our proposed research study are examined in Section 5. Section 6 is based on the conclusion of our research study.

2. Related Work

The related literature to our research study is examined in this section. The related literature is based on the summary of past applied approaches and research outcomes for predicting employee attrition. The most recent applied state-of-the-art approaches were selected for the literature review.
In the classification task, the Performance Assessment of Data Balancing Techniques was proposed [11]. The imbalanced dataset causes a major issue in numerous classification problems such as intrusion detection, fraud detection, anomaly detection, and many more. The data balancing was applied to obtain the high accuracy results from prediction models. The research study addresses the performance issues empirically using an imbalanced dataset. Hybrid Sampling (HS), Synthetic Minority Over Sampling (SMOTE), Under Sampling (US), Random Over Sampling Examples (ROSE), Over Sampling (OS), and Clustering-Based Under Sampling (CBUS) balancing techniques were examined. The imbalance ratio (IR) was used as the performance factor. The research experimental results show that data balancing proves helpful in improving the applied classifiers’ performance. The results also indicate that no significant performance difference was found in US, SMOTE, HS, OS, and CBUS balancing techniques.
The introduction and real-world applications of neural network techniques were analyzed [12]. Neural networks are a subtype of the machine learning area. The advantages of neural network techniques are high-speed processing and parallelism with big data. Neural networks are useful and novel techniques for solving learning problems. The working of neural networks is similar to the biological nervous systems of the human brain. The major brain element is the information processing unique design. This is based on the numerous complex neurons that are interconnected. The neural networks contain layers of nodes that are independent of one another. The study analyzed the neural network techniques, performance comparison, and challenges. The research study presented that the feedforward and feedback propagation neural networks techniques were performing better with the huge dataset to solve real-world problems. The analyzed factors were fault tolerance, processing speed, accuracy, latency, scalability, volume, and performance.
The prediction of employee attrition rate using machine learning-based classification algorithms was proposed [13]. The HR employee data collected from Kaggle were utilized for the model-building process. The K-Nearest neighbors, extreme gradient boosting, Ada Boosting, Decision Tree, neural networks, and Random Forest applied machine learning techniques [14] for the classification task. The regularization techniques were applied to find the best-fit parameters for predicting the employee attrition rate. The different steps were applied to obtain an accuracy score of 88%.
The automated prediction of employee attrition based on several machine learning models was proposed in this study [15]. The IBM HR employee dataset was utilized for learning model building and model evaluation process. The Ad boost Model, Random Forest Regressor, Decision Tree, Logistic Regressor, and Gradient Boosting Classifiers were utilized for the prediction task. The Decision Tree and Logistic Regressor achieved an 86% accuracy score. The goal was the accurate detection of employee attrition to help the organizations to boost their employee satisfaction [16].
The three-stage system based on preprocessing, processing, and post-processing techniques was proposed to predict employee attrition [17]. The IBM HR employee dataset was utilized for framework training and testing. The max-out feature selection technique was utilized for the dimension reduction stage. The logistic regression technique was utilized for employee attrition prediction. The model results achieved an 81% of accuracy score. The framework parameters were validated.
The comparison of state-of-the-art machine learning methods was applied to predict employee attrition using the IBM HR employee dataset [18]. The results of the study were utilized to warn managers to update their business strategies [19]. The six machine learning models were utilized. The Random Forest was the proposed approach. The accuracy of the proposed approach was 85% for the prediction of employee attrition. The study findings are based on the factors social, financial, cultural, relational, and professional that caused employee attrition. The prediction of employee attrition using the IBM HR employee dataset was proposed [20]. The seven-machine learning techniques were applied and evaluated. The factors that cause attrition were determined by the gain ratio approach. The dataset balancing was applied using bootstrapping technique. The proposed model achieved an 80% of accuracy score. The factors that cause attrition were ranked according to their gain ratio scores.
The employee attrition prediction using a machine learning pipeline [21] was proposed in this study [22]. The study findings analyze the factors such as the number of years of work experience, educational qualifications, gender, and department were that caused employee attrition. The pipeline was based on gradient boosting and ensemble learning techniques. The hyperparameter tuning was applied to models using a randomized grid search technique. The pipeline algorithm achieved state-of-the-art performance. The k-fold cross-validation was applied for model evaluations.
The emotional assessment and prediction of employee attrition rate of the employee were proposed [23]. The dataset was collected through a survey based on attrition-related questions. The Decision Tree, Random Forest, and Support Vector Machine classifiers were applied for the prediction task. The proposed approach achieved an 86% of accuracy score in predicting attrition rate.
The systematic flow for predicting employee attrition using machine learning techniques was proposed in this research study [24]. The machine learning models Naive Bayes, Random Forest, Decision Tree, Support Vector Machine, and K-Nearest Neighbor were applied using the python tool. The Random Forest was the proposed approach with an accuracy score of 83%. The key causes of employee attrition were found and minimized using data analysis.
The rise of a sudden pandemic in 2020 brought significant losses in employment to the global economy [25]. In China, a governmental force contributed to 50% of tax revenue, 80% of jobs, 60% of GDP, and 70% of innovation. The limited capability results in a higher employee attrition rate. The higher employee attrition rate causes unemployment stress. The studies show that job stress cause problems of job dissatisfaction and burnout, resulting in a higher turnover rate.
The related literature was examined in comparison with our proposed study. The analysis demonstrates that our proposed model outperformed in comparison with machine learning techniques and state-of-the-art studies. We applied hyperparameter optimization and data balancing techniques to achieve the highest accuracy scores for the prediction of employee attrition. The literature analysis concluded that these applied techniques were not performed by past applied techniques in the related literature.

3. Methodology

The methodological working flow of our research study is examined in Figure 1. Our research working flow from start to end was elaborated. The IBM HR employee attrition dataset was utilized for research findings. In order to obtain useful insights, the employee attrition dataset and the factors that are caused by employee attrition were examined by Employee Exploratory Data Analysis (EEDA). The feature engineering technique was applied to find best-fit parameters through feature correlation for model building and prediction purposes. The feature encoding was complete during the feature engineering process. By analyzing the dataset, we found it imbalanced. In order to balance the dataset, the SOMTE data resampling technique was applied. Now a preprocessed dataset was ready for model building. The dataset splitting was performed, and the dataset was split by the ratio of 85:15. The proposed machine learning model was trained with an 85% portion of the dataset and tested with a 15% portion of the dataset. The employed machine learning model was fully parameter tunned. Then a generalized form of the proposed model was ready to predict employee attrition by inputting the details of employees.

3.1. Dataset

The IBM HR Employee Attrition [26] was used for data analytics and generalized machine learning model building for the prediction of employee attrition of valuable employees. The data were created by IBM data scientists. The dataset contains 35 features. The data set was utilized to examine the factors that lead to employee attrition. The dataset has 1470 records of employees. The memory usage by dataset is 402.1 + KB. The information analysis of dataset-related features is examined in Table 1.

3.2. Employee Exploratory Data Analysis (EEDA)

The Employee Exploratory Data Analysis (EEDA) was applied to obtain useful insights from the HR employee attrition dataset. The EEDA was used to critically examine the feature and factors that are the major causes of employee attrition. We examined the feature through numerous kinds of plots and time-series analyses. The EEDA demonstrated the data patterns and proved helpful for data factors analysis in the context of employee attrition.
The data distribution plot for analysis of the monthly income with the total working years features that effects the employee attrition is examined in Figure 2. The total working years data were mapped on the x-axis, and the monthly income data were mapped on the y-axis. The analysis demonstrates that during one year of working, the monthly income is low, and the employee attrition is high. During the working years from one to four, the employee attrition is low. As the monthly income increase, the chances of employee attrition are less. From year four to eleven, the employee attrition is low. For the next working years, the attrition rate is almost low. This analysis shows a higher rate of employee attrition when the monthly income is low and the working year is less. The monthly income is a factor that is affecting employee attrition.
The data distribution plot for analysis of the hourly rate with the total working years features that effects the employee attrition is examined in Figure 3. The analysis demonstrates that during the working of one year and the hourly rate between 30 and 70, the employee attrition is high. From the working year 2 to 10, the employee attrition is low. As the hourly rate increases, employee attrition increases. From the analysis, from working years 20 to 40, there is zero employee attrition when the hourly rate is between 30 and 50. The hourly rate factors affect employee attrition.
The data analysis in distributions and line graphs of the monthly income with the age features is examined in Figure 4. The analysis demonstrates that when the employee age is 10 to 25, the employee attrition rate is high. As the age increase, the attrition rate is low. The employee attrition rate is high when the monthly income is 1000 to 5000. The analysis shows that age affects the attrition rate. In lower age years, the attrition rate is very high, and the monthly income along with.
The pair plot data distribution analysis among various features is examined in Figure 5. The analysis demonstrates that the employee attrition rate is high between levels one and two. The employee attrition rate is high during the one year of working. The total year working with the current manager role also affects the job starting years. These features were analyzed to differentiate the data patterns for employee attrition. Our analysis established the key factors that caused employee attrition using EEDA.

3.3. Feature Engineering

Feature engineering is a crucial part of a learning model. The motive is to speed the data transformation process resulting in achieving higher accuracy from the learning model. The feature engineering techniques were applied in our research study to handle the features of the HR employee dataset and to find the best-fit features used for the learning model. The data correlation analysis was conducted to find the best features, as visualized in Figure 6. By the feature correlation analysis, we dropped the features DailyRate, DistanceFromHome, EmployeeCount, EmployeeNumber, EnvironmentSatis-faction, HourlyRate, JobInvolvement, JobSatisfaction, MonthlyRate, RelationshipSatisfaction, StandardHours, StockOptionLevel, TrainingTimesLastYear, and WorkLifeBalance. The dropped features were due to their high negative correlation among the remaining dataset features. The selected features were encoded by using the one-hot encoding technique [27]. The feature engineering techniques proved very fruitful in our research study to achieve a high accuracy score.

3.4. Data Resampling

The dataset resampling is applied to make the dataset balanced [28]. The SOMTE (Synthetic Minority Oversampling Technique) dataset resampling technique was utilized. By dataset balancing, the model complexity was reduced. An equal number of target distributions are utilized for model training resulting in an increased model accuracy score. Figure 7 contains the analysis of data resampling before and after data balancing.

3.5. Dataset Splitting

The dataset splitting was applied to make our model generalize. The splitting was performed with a ratio of 85:15. The 85% portion of the dataset was utilized for our proposed model training purpose, and the 15% portion of the dataset was utilized for model testing evaluations. The dataset spiting reduces the model overfitting and complexity.

4. Proposed Machine Learning Approaches

The four advanced machine learning-based techniques, Support Vector Machine (SVM), Logistic Regression (LR), Decision Tree Classifier (DTC), and Extra Trees Classifier (ETC), were applied in this research study. The ETC is our proposed approach for predicting employee attrition.
The SVM technique [29] is a family of supervised learning models that are based on support vectors used for classification. The SVM model [30] creates a best-fit decision boundary that divides input n-dimensional feature space data into target classes. The decision boundary is called a hyperplane. A hyperplane is an n-dimensional Euclidean space that divides the space into two disconnected subsets. The iterative manner was used by SVM to create the best fit hyperplane to minimize the error. The SVM selects the extreme vectors that are useful for creating the hyperplane. These extreme vectors are called support vectors. The separating hyperplane is expressed in Equation (1). Where w is the weight matrix, x is the input feature, and b is the biased values.
w . x + b = 0 ,
The LR is a statistical supervised machine learning method used for classification problems. The LR technique [31] was used to describe the relationship between dependent and independent variables. The LR uses the concept of the sigmoid function. The probabilistic values of the sigmoid function lie between zero and one. The S-shaped logistic function is fit for prediction. The LR model is expressed in Equation (2). where the predicted class output is y, the bias term is b0, and the coefficient for input x is b1.
  y = e b 0 + b 1 x 1 + e b 0 + b 1 x ,
The DTC is a supervised machine learning technique utilized for classification problems. The DTC [32] is a tree structure representation where the target class labels represent on the leaf node, decision rules represent by branches, and the attributes are represented on the internal nodes. The motive of DTC [33] is to predict the target class by learning decision rules inferred from training data. The DTC is good to utilize because the decision-making rule is mimicked by human thinking ability. The best attributes are selected by Information Gain and Gini Index in DTC. The Gini Index is calculated as expressed in Equation (3).
  G i n i   I n d e x = 1 j P j 2 ,
The ETC is an extension of the ensemble learning method based on the construction of bagged decision trees [34]. The ETC concept is similar to the Random Forest; however, the difference in forest construction. The ETC aggregates the outcome of multiple de-correlated decision trees to predict the target class for the classification task. The ETC technique works by generating a large number of bagged decision tree samples from the training data. The decision rule is selected randomly. The majority voting is used for predictions from decision trees. The majority voting predictions are aggregated to yield the final prediction. The entropy calculated for ETC is expressed in Equation (4).
  E n t r o p y S = i = 1 c p i l o g 2 p i ,

Hyperparameter Tuning

The hyperparameter tuning was applied to find the best-fit parameters of applied machine learning models [35]. The hyperparameter configuration parameters were examined in Table 2. The hyperparameters were achieved by checking the model’s outcome accuracy results iteratively on the dataset. The parameters on which model performance score are efficiently selected as their hyperparameters. The tuning proved very fruitful in our research study. Our applied machine learning models achieved good accuracy scores.

5. Results and Discussions

The results and evaluations of our proposed research study are examined in this section. All the experiments were run on a machine with specifications of Intel (R) Xeon (R) CPU, 13 GB RAM, 2249.998 MHz CPU, 512KB cache size, and the CPU model name is AMD EPYC 7B12. The results in terms of predicting employee attrition were carefully examined. The evaluation metrics of our machine learning-based research study include the training accuracy, testing accuracy, precision score, recall score, f1 measure score, and ROC curve score. The followings are the important factors of evaluation metrics:
  • True Positive: when both the predicted values and actual values are positive;
  • True Negative: when both the predicted values and actual values are negative;
  • False Positive: when the approach predicts a value as positive but the actual value is negative;
  • False Negative: when the approach predicts a value as negative, but the actual value is positive.
During the training and testing process of our proposed ETC model, the accuracy score results were measured. In order to demonstrate how much our machine learning model is accurate on training and testing data, we found that our model achieved a 93% of accuracy score on unseen data. Then we made our model generalize. In order to calculate the accuracy score, the formula equation is expressed in Equation (5).
Accuracy = True   Positive   value   +   True   Negative   value True   Positive   value   +   False   Positive   value   +   True   Negative   value   + False   Negative   value ,
The precision is the measure of the model that correctly identifies values as positive out of all values. The recall of the model is the measure of correctly identifying true positive values. The recall and precision scores of our proposed model are 93%. The mathematical notations to calculate the precision and recall are expressed in Equations (6) and (7), respectively.
Precision = True   Positive   value True   Positive   value   + False   Positive   value ,
Recall = True   Positive   value   True   Positive   value   + False   Negative   value ,
The f1 score was utilized to summarize the performance of our predictive model. The f1 score combines the recall and precision score values. The f1 score value of our model was 93%. The log loss is a Logarithmic cost function used to find the loss of the model in classification. The log loss value of our model was 2.3337248795797283. The f1 score was calculated as expressed in Equation (8).
F 1 score   = 2     Recall     Precision   Recall   +   Precision ,
The ROC curve accuracy metric was utilized to measure the accuracy of the predictive model in terms of the area under the curve at the different thresholds of the target class. The ROC accuracy of our model was 93%. In order to calculate the ROC accuracy, Equation (9) is expressed.
ROC   accuracy = 0 1 True   Positive   value   False   Positive   value d False   Positive   value ,
The comparative performance analysis among the applied machine learning techniques is examined in Table 3. The analysis demonstrates that the LR technique has a low accuracy score of 72% results among all. The proposed ETC technique achieved the highest accuracy of 93%. Our proposed ETC approach outperformed.
The classification report analysis of all applied machine learning approaches is examined in Table 4. The analysis is based on the performance metrics of precision, recall, f1 score, and support score category-wise. The performance metrics were also analyzed in the average case. The analysis shows that the classification report of proposed ETC techniques achieved higher score results in comparison with other employed machine learning models.
The 10-fold cross-validation was applied to all employed machine learning models. The k-fold cross-validation comparative analysis among the employed approaches is analyzed in Table 5 and Figure 8. The machine learning model increases the accuracy scores by utilizing the k-fold validation. The k-fold technique proves useful as by applying it, the model’s performance accuracy results are increased.
The performance accuracy comparative analysis of our proposed ETC approach with the past applied state of art approaches are examined in Table 6 and Table 7. The recently applied approaches were examined for comparison analysis. The analysis shows that our proposed approach achieved the highest accuracy results. Our proposed model achieved the best result for predicting employee attrition.
The ROC curve analysis of our proposed technique is examined in Figure 9. The higher the area under the curve, the higher the model validation performance in classification. The ROC analysis demonstrated that our proposed model achieved a 93% of accuracy score. This analysis validates our approaches in the prediction performance for employee attrition.
The confusion matrix analysis of our proposed approach is examined in Figure 10. The analysis shows that the 182 samples were identified as the true positive values, and 163 samples were identified as the true negative values out of the test dataset. The 11 samples were identified as false positives, and 14 samples were identified as false negatives. The confusion matrix validated our accuracy score of 93%.

6. Conclusions

The employee attrition prediction by using the four advanced machine learning techniques ETC, SVM, LR, and DTC, were applied in comparison in this study. The applied machine learning techniques achieved accuracy scores of 87% by SVM technique, 72% by LR technique, and 83% by DTC technique. The proposed Extra Trees Classifier (ETC) achieved 93% accuracy, precision, recall, f1 score, and ROC accuracy scores. The data resampling was applied to balance the dataset. The approaches were validated with k-fold validation and with the past applied state-of-the-art studies. By using dataset 10-folds, the SVM technique achieved an 88% of accuracy score, the LR technique achieved a 74% of accuracy score, the DTC technique achieved an 84% of accuracy score, and the proposed achieved a 93% of accuracy score. The EEDA application revealed the key factors that cause employee attrition is the monthly income, hourly rate, job level, and age. Our research findings help organizations overcome employee attrition. The study limitations and in future direction, we will apply the deep learning techniques to predict the employee attrition. Moreover, we will enhance the dataset feature space to obtain more accurate results by using deep learning techniques.

Author Contributions

Conceptualized the study, supervision, conducted the survey and data collection, A.R. and F.Y.; data analysis and writing of the manuscript, resources, data curation, funding acquisition, and project administration M.A., K.M. and M.M.S.F. All authors have read and agreed to the published version of the manuscript.

Funding

This work was supported by University of Hafr Albatin, Saudi Arabia.

Institutional Review Board Statement

Not applicable.

Informed Consent Statement

Informed consent was obtained from all subjects involved in the study.

Data Availability Statement

The supporting data for the findings of this study are available from the corresponding author on reasonable request.

Acknowledgments

The authors would like to thank all participants for their fruitful cooperation and support.

Conflicts of Interest

The authors declare no conflict of interest.

References

  1. Peng, B. Statistical analysis of employee retention. In Proceedings of the International Conference on Statistics, Applied Mathematics, and Computing Science (CSAMCS 2021), Nanjing, China, 26–28 November 2021; Volume 12163, pp. 7–15. [Google Scholar] [CrossRef]
  2. 19 Employee Retention Statistics That Will Surprise You. 2022. Available online: https://www.apollotechnical.com/employee-retention-statistics/ (accessed on 6 May 2022).
  3. Here’s What Your Turnover and Retention Rates Should Look Like. Available online: https://www.ceridian.com/blog/turnover-and-retention-rates-benchmark (accessed on 6 May 2022).
  4. SHRM Survey: Average Cost Per Hire Is $4129. Available online: https://www.businessmanagementdaily.com/46997/shrm-survey-average-cost-per-hire-is-4129/ (accessed on 6 May 2022).
  5. Gandomi, A.H.; Chen, F.; Abualigah, L. Machine Learning Technologies for Big Data Analytics. Electronics 2022, 11, 421. [Google Scholar] [CrossRef]
  6. Jia, X.; Cao, Y.; O’Connor, D.; Zhu, J.; Tsang, D.C.W.; Zou, B.; Hou, D. Mapping soil pollution by using drone image recognition and machine learning at an arsenic-contaminated agricultural field. Environ. Pollut. 2021, 270, 116281. [Google Scholar] [CrossRef] [PubMed]
  7. Reshma Ramchandra, N.; Rajabhushanam, C. Machine learning algorithms performance evaluation in traffic flow prediction. Mater. Today Proc. 2022, 51, 1046–1050. [Google Scholar] [CrossRef]
  8. Aljedani, N.; Alotaibi, R.; Taileb, M. HMATC: Hierarchical multi-label Arabic text classification model using machine learning. Egypt. Inform. J. 2021, 22, 225–237. [Google Scholar] [CrossRef]
  9. Tsai, I.-J.; Shen, W.-C.; Lee, C.-L.; Wang, H.-D.; Lin, C.-Y.; Tsai, I.-J.; Shen, W.-C.; Lee, C.-L.; Wang, H.-D.; Lin, C.-Y.; et al. Machine Learning in Prediction of Bladder Cancer on Clinical Laboratory Data. Diagnostics 2022, 12, 203. [Google Scholar] [CrossRef] [PubMed]
  10. Aggarwal, S.; Singh, M.; Chauhan, S.; Sharma, M.; Jain, D. Employee Attrition Prediction Using Machine Learning Comparative Study. Smart Innov. Syst. Technol. 2022, 265, 453–466. [Google Scholar] [CrossRef]
  11. Jadhav, A.; Mostafa, S.M.; Elmannai, H.; Karim, F.K. An Empirical Assessment of Performance of Data Balancing Techniques in Classification Task. Appl. Sci. 2022, 12, 3928. [Google Scholar] [CrossRef]
  12. Abiodun, O.I.; Jantan, A.; Omolara, A.E.; Dada, K.V.; Mohamed, N.A.E.; Arshad, H. State-of-the-art in artificial neural network applications: A survey. Heliyon 2018, 4, e00938. [Google Scholar] [CrossRef] [Green Version]
  13. Ganthi, L.S.; Nallapaneni, Y.; Perumalsamy, D.; Mahalingam, K. Employee Attrition Prediction Using Machine Learning Algorithms. Lect. Notes Netw. Syst. 2022, 288, 577–596. [Google Scholar] [CrossRef]
  14. Jiang, Z.; Gao, B.; He, Y.; Han, Y.; Doyle, P.; Zhu, Q. Text Classification Using Novel Term Weighting Scheme-Based Improved TF-IDF for Internet Media Reports. Math. Probl. Eng. 2021, 2021, 6619088. [Google Scholar] [CrossRef]
  15. Qutub, A.; Al-Mehmadi, A.; Al-Hssan, M.; Aljohani, R.; Alghamdi, H.S. Prediction of Employee Attrition Using Machine Learning and Ensemble Methods. Int. J. Mach. Learn. Comput. 2021, 11, 110–114. [Google Scholar] [CrossRef]
  16. Habous, A.; Nfaoui, E.H.; Oubenaalla, Y. Predicting Employee Attrition using Supervised Learning Classification Models. In Proceedings of the 2021 Fifth International Conference on Intelligent Computing in Data Sciences (ICDS), Fez, Morocco, 20–22 October 2021. [Google Scholar] [CrossRef]
  17. Najafi-Zangeneh, S.; Shams-Gharneh, N.; Arjomandi-Nezhad, A.; Zolfani, S.H. An Improved Machine Learning-Based Employees Attrition Prediction Framework with Emphasis on Feature Selection. Mathematics 2021, 9, 1226. [Google Scholar] [CrossRef]
  18. Pratt, M.; Boudhane, M.; Cakula, S. Employee attrition estimation using random forest algorithm. Balt. J. Mod. Comput. 2021, 9, 49–66. [Google Scholar] [CrossRef]
  19. Sadana, P.; Munnuru, D. Machine Learning Model to Predict Work Force Attrition. In Proceedings of the 2021 6th International Conference for Convergence in Technology (I2CT), Pune, India, 2–4 April 2021. [Google Scholar] [CrossRef]
  20. Kaya, İ.E.; Korkmaz, O. Machine Learning Approach for Predicting Employee Attrition and Factors Leading to Attrition. Cukurova Univ. J. Fac. Eng. 2021, 36, 913–928. [Google Scholar] [CrossRef]
  21. Mazumder, R.K.; Salman, A.M.; Li, Y. Failure risk analysis of pipelines using data-driven machine learning algorithms. Struct. Saf. 2021, 89, 102047. [Google Scholar] [CrossRef]
  22. Mate, Y.; Potdar, A.; Priya, R.L. Ensemble Methods with Bidirectional Feature Elimination for Prediction and Analysis of Employee Attrition Rate During COVID-19 Pandemic. Lect. Notes Electr. Eng. 2022, 806, 89–101. [Google Scholar] [CrossRef]
  23. Joseph, R.; Udupa, S.; Jangale, S.; Kotkar, K.; Pawar, P. Employee attrition using machine learning and depression analysis. In Proceedings of the 2021 5th International Conference on Intelligent Computing and Control Systems (ICICCS), Madurai, India, 6–8 May 2021; pp. 1000–1005. [Google Scholar] [CrossRef]
  24. Bhartiya, N.; Jannu, S.; Shukla, P.; Chapaneri, R. Employee Attrition Prediction Using Classification Models. In Proceedings of the 2019 IEEE 5th International Conference for Convergence in Technology (I2CT), Bombay, India, 29–31 March 2019. [Google Scholar] [CrossRef]
  25. Lai, H.; Hossin, M.A.; Li, J.; Wang, R.; Hosain, M.S. Examining the Relationship between COVID-19 Related Job Stress and Employees’ Turnover Intention with the Moderating Role of Perceived Organizational Support: Evidence from SMEs in China. Int. J. Environ. Res. Public Health 2022, 19, 3719. [Google Scholar] [CrossRef]
  26. HR-Employee-Attrition-Dataset by Aaizemberg|Data.World. Available online: https://data.world/aaizemberg/hr-employee-attrition (accessed on 6 May 2022).
  27. Karthiga, R.; Usha, G.; Raju, N.; Narasimhan, K. Transfer Learning Based Breast cancer Classification using One-Hot Encoding Technique. In Proceedings of the 2021 International Conference on Artificial Intelligence and Smart Systems (ICAIS), Coimbatore, India, 25–27 March 2021; pp. 115–120. [Google Scholar] [CrossRef]
  28. Shobhanam, K.; Sumati, S. HR Analytics: Employee Attrition Analysis using Random Forest. Int. J. Perform. Eng. 2022, 18, 275. [Google Scholar] [CrossRef]
  29. Baldomero-Naranjo, M.; Martínez-Merino, L.I.; Rodríguez-Chía, A.M. A robust SVM-based approach with feature selection and outliers detection for classification problems. Expert Syst. Appl. 2021, 178, 115017. [Google Scholar] [CrossRef]
  30. Dong, S. Multi class SVM algorithm with active learning for network traffic classification. Expert Syst. Appl. 2021, 176, 114885. [Google Scholar] [CrossRef]
  31. Tigga, N.P.; Garg, S. Predicting Type 2 Diabetes Using Logistic Regression. Lect. Notes Electr. Eng. 2021, 673, 491–500. [Google Scholar] [CrossRef]
  32. Maswadi, K.; Ghani, N.A.; Hamid, S.; Rasheed, M.B. Human activity classification using Decision Tree and Naïve Bayes classifiers. Multimed. Tools Appl. 2021, 80, 21709–21726. [Google Scholar] [CrossRef]
  33. Azad, C.; Bhushan, B.; Sharma, R.; Shankar, A.; Singh, K.K.; Khamparia, A. Prediction model using SMOTE, genetic algorithm and decision tree (PMSGD) for classification of diabetes mellitus. Multimed. Syst. 2021, 1–19. [Google Scholar] [CrossRef]
  34. Ossai, C.I.; Wickramasinghe, N. GLCM and statistical features extraction technique with Extra-Tree Classifier in Macular Oedema risk diagnosis. Biomed. Signal Process. Control 2022, 73, 103471. [Google Scholar] [CrossRef]
  35. Elgeldawi, E.; Sayed, A.; Galal, A.R.; Zaki, A.M. Hyperparameter Tuning for Machine Learning Algorithms Used for Arabic Sentiment Analysis. Informatics 2021, 8, 79. [Google Scholar] [CrossRef]
Figure 1. The methodological analysis of our proposed research study for employee attrition prediction.
Applsci 12 06424 g001
Figure 2. The total working years and monthly income data distribution analysis by employee attrition.
Applsci 12 06424 g002
Figure 3. The hourly rate and total working years data distribution analysis by employee attrition.
Applsci 12 06424 g003
Figure 4. The monthly income and employed age analysis by employee attrition.
Applsci 12 06424 g004
Figure 5. The pair plot data distributions analysis of features monthly income, job level, total working hours, years at the company, and years with the current manager role.
Applsci 12 06424 g005
Figure 6. The dataset correlation analysis for feature engineering.
Applsci 12 06424 g006
Figure 7. The dataset resampling using SMOTE technique was applied: (a) describe the unbalanced target category; (b) describe the target category after balancing the dataset.
Applsci 12 06424 g007
Figure 8. The comparative performance analysis of employed approaches with K-Fold validation.
Applsci 12 06424 g008
Figure 9. The ROC curve analysis of our proposed ETC approach.
Applsci 12 06424 g009
Figure 10. The confusion matrix analysis of the proposed ETC approach.
Applsci 12 06424 g010
Table 1. The dataset feature analyses and related information.
ColumnNon-Null CountData TypeColumnNon-Null CountData Type
Age1470int64MonthlyIncome1470int64
Attrition1470objectMonthlyRate1470int64
BusinessTravel1470objectNumCompaniesWorked1470int64
DailyRate1470int64Over181470object
Department1470objectOverTime1470object
DistanceFromHome1470int64PercentSalaryHike1470int64
Education1470int64PerformanceRating1470int64
EducationField1470objectRelationshipSatisfaction1470int64
EmployeeCount1470int64StandardHours1470int64
EmployeeNumber1470int64StockOptionLevel1470int64
EnvironmentSatisfaction1470int64TotalWorkingYears1470int64
Gender1470objectTrainingTimesLastYear1470int64
HourlyRate1470int64WorkLifeBalance1470int64
JobInvolvement1470int64YearsAtCompany1470int64
JobLevel1470int64YearsInCurrentRole1470int64
JobRole1470objectYearsSinceLastPromotion1470int64
JobSatisfaction1470int64YearsWithCurrManager1470int64
MaritalStatus1470object
Table 2. The hyperparameter configuration parameters of all employed approaches.
Sr No.TechniqueKernel/SolverCRandom StateMax Depth
1ETC‘gini’None5300
2SVM‘poly’9.0500None
3LR‘saga’9.01000None
4DTC‘gini’NoneNone300
Table 3. The accuracy performance metric comparative analysis among the employed approaches.
Sr No.TechniqueAccuracy Score%
1ETC93
2SVM87
3LR72
4DTC83
Table 4. The employed approaches classification report analysis of performance metrics by category and in the average case.
CategoryPrecision %Recall %F1 Score %Support Score
ETC
0939494193
1949293177
Average939393370
SVM
0908386183
1849188187
Average878787370
LR
0766872193
1697773177
Average737372370
DTC
0858384193
1828483177
Average848484370
Table 5. The K-Fold cross-validation comparative analysis among the employed approaches.
Sr No.K-FoldTechniqueAccuracy Score%
110ETC93
210SVM88
310LR74
410DTC84
Table 6. The proposed ETC approach performance metrics results in evaluations.
Proposed TechniquePerformance Metrics
Accuracy Score %Precision %Recall %F1 Score %ROC Accuracy %Geometric Mean ScoreLog Loss
ETC93939393930.972.33
Table 7. The performance validation comparative analysis of our proposed approach with the past applied state of art approaches.
LiteratureYearLearning TypeTechniqueAccuracy Score%
[13]2021Machine LearningDecision Tree88
[15]2021Machine LearningDecision Tree + Logistic Regression86
[17]2021Machine LearningLogistic Regression81
[18]2021Machine LearningRandom Forest85
[20]2021Machine LearningSupport Vector Machines80
Proposed2022Machine LearningETC93
Publisher’s Note: MDPI stays neutral with regard to jurisdictional claims in published maps and institutional affiliations.

