Abstract
This study investigates the effect of distributed Energy Storage Systems (ESSs) on the power quality of distribution and transmission networks. More specifically, this project aims to assess the impact of distributed ESS integration on power quality improvement in certain network topologies compared to typical centralized ESS architecture. Furthermore, an assessment is made to see if the network topology in which an ESS position supports its ability to restore node voltage magnitude within acceptable ranges. The power quality of a benchmark interconnected distribution and transmission network was determined using NEPLAN software. Following that, twelve variants of the benchmark were modeled, each with a different ESS integration architecture and (or) topology. Their power quality performance was compared to that of a benchmark network in addition to several cross analyses to determine the relative impact on power quality within the context of their respective ESS integration methodologies. The findings of this study buttress the understanding that the distributed ESS integration architecture within the distribution network topology, where the majority of consumer loads are connected, provides the strongest case for voltage magnitude power quality compensation, as required by the UK Electrical System Grid Code’s 5% rated node voltage compliance processes regulation.
1. Introduction
Transmission and distribution networks are required in today’s power system, among other things, to maintain a balance between energy supply and demand, regardless of the particular characteristics of the resources used in energy generation or fluctuations in consumer energy use [1]. As a direct result of the balancing efforts, there are certainly predictable occasions when demand on these networks peaks and troughs, resulting in undersupply and oversupply of generated electrical energy. Any demand-supply imbalance is manifested in power quality, which is the degree to which the voltage magnitude (and angle) of the supplied electrical energy to consumers deviates from the rated tolerance limits as determined by their Distribution System Operators (DSOs) or Transmission System Operators (TSOs).
The utilization of Energy Storage Systems (ESSs) in the management of power quality within these networks is not entirely new [2,3]. What is interesting is the rise in ESS energy density innovation, which portends for greater analytical flexibility [4,5,6,7] in where they are situated within the power system’s supply network in order to maximize the benefits of their operational capabilities. The Pumped Hydro Storage System (PHSS) has been used for a long time in ESS technology for the contingent compensation of network electricity supply performance within a centralized framework.
Other solutions have recently emerged because of their technological properties, which include enhanced tractability in where and how they are connected to electrical networks to improve power quality. Flywheels, compressed air storage, molten salts, battery energy storage, superconducting magnetic storage, and super-capacitors are some of the technologies currently being deployed or demonstrated in the electrical sector [8,9]. Each of these technologies is based on the mechanical, electromechanical, thermal, electric, and chemical properties that they possess.
The implementation of ESS, such as BESS, is an important avenue for increasing a distribution network’s energy efficiency. The purpose of this study is to give an overview of the best BESS placement and functioning that will improve the overall network’s performance. There are three goals to this study. The first is an assessment of the impact of ESS integration in transmission and distribution networks on power quality. The second is a comparison of power quality performance resulting from the adopted ESS integration design (centralized versus distributed integration) inside the transmission and distribution network. Finally, an examination of which ESS integration topology (distribution network versus transmission network) has the greatest impact on power quality performance. NEPLAN electric power system simulation and modeling software [10] were used to assess the power quality of a typical interconnected transmission and distribution network.
1.1. Literature Review
In the overall electric power system, energy storage is critical. Batteries are used by Voltage Source Converters (VSC) for dynamic voltage management, which improves transmission voltage stability [11], except for filling occasional energy supply gaps. Furthermore, because of their huge ramping rates capabilities, Battery Energy Storage Systems (BESS) are often promoted as one of the viable solutions to solve the issues associated with reduced levels of system inertia [12].
Previously, network operators might improve network capacity by using fortification measures such as adding extra conductors or de-rating the network’s equipment thermal and current limits. Del Rosso and Eckroad [13] investigated the use of BESS to alleviate the constraints of thermally constrained transmission corridors.
In radial networks, determining the optimal position for integrating and the appropriate amount of ESS in general, as described in [14], has the ability to ensure that power quality remains within expected limits as prescribed by regulators. Similarly, the research work in [15] found that integrating BESS at the optimal place within transmission and distribution networks improves power quality frequency regulation for reducing renewable energy generation unpredictability.
The integration of BESS has demonstrated that the dynamic frequency response due to oscillating voltage changes in load conditions is significantly improved in a more interconnected power system, where power is dispatched or imported depending on the peculiar load requirements of these respective systems [16]. While interconnections and distributed grid architecture continue to offer benefits and show great promise in reducing reliance on fossil fuel generation, increasing efficiency, and increasing operational flexibility for all power system stakeholders, unintended consequences are new challenges that network operators must address.
Energy storage is widely acknowledged as providing network operators, both transmission and distribution, with the capacity to manage volatility in generated energy and connects end users to power in the voltage characteristics they demand. Recent research suggests that the impacts on power quality performance are largely determined by where these systems are linked to the grid rather than their capacity [17,18,19,20,21], which is confirmed by analytical studies. In [22], two battery models for two different time resolutions (1 s and 1 min), as well as their respective operation models described in detail. The so-called degrees of freedom are employed in the operation strategy model for the primary control reserve to lower the energy required to recharge the battery.
Because of the growing number of consumer-integrated distributed energy storage systems behind distribution networks in power systems that are increasingly adopting smart ideology, distribution network operators recognize that developing intelligent, active control of these energy storage systems is critical to minimizing the impact of their interaction with the grid. The issue of how to actively operate energy storage systems in response to changes in consumer demand is addressed in [23], which proposes the Grid Explicit Congestion Notification Mechanism, which is based on a unified control algorithm that relies on internet protocol (IP) technology between the distribution network and energy storage system.
A recent work [24] proposes an energy management system for industrial microgrids connected to the grid, where a BESS can complement the intermittency of the available on-site renewable generation. The results show that the proposed energy management strategy effectively calculates the size of BESS and, at the same time, minimizes the cost of operation for the industrial microgrid. In [25], a control strategy for a BESS is formulated based on two intelligent decoupled controllers. The objective is the system’s voltage and frequency restoration, considering a wide range of disturbances and leading to power quality degradation. The proposed controller is based on hybrid differential evolution optimization and an artificial neural network. The effectiveness of the proposed controller is validated on a power network consisting of a synchronous generator, a photovoltaic power system, and BESS.
References [26,27,28,29,30] examine in-depth how BESS can help to increase voltage support in a grid due to the high rates of distributed generation. The proposed strategy can mitigate the voltage unbalance issue, improve the voltage profile, and correct power factors while supporting sustainable distribution system operation. Many more research works proved how efficient BESS is on the optimum dispatching due to the high penetration of renewable energy sources (RES) that are distributed and not centralized [31,32,33,34].
2. Methodology
Harmonics, system reliability (interruptions due to voltage frequency perturbations arising from insufficient loading or overloading of the network), and voltage characteristics are all factors to consider when evaluating power quality (i.e., voltage swell, short-term voltage sag, or voltage phase angle shift as a result of a load which is usually connected to the network at a particular point).
This study examines the impact of ESS on the transmission and distribution system’s power quality voltage characteristics, specifically the compensatory effect of BESS on the voltage magnitude and phase angle parameters of power quality. It must be mentioned that the voltage angle is an important factor in the system’s power quality since it plays a significant role in the efficiency with which energy flows through the system. The current and voltage waveforms should both be sinusoidal and in-phase (aligned with each other) such that maximum useful power flow is achieved. The power factor describes how much of the voltage and current is producing useful (active) power with respect to the maximum it could be delivering. For linear loads that only have resistance, capacitance, and inductance, the voltage and current waveforms remain sinusoidal, and only the phase/alignment of the waveform changes. When the voltage and current waveforms are not in phase, the power factor drops below 1.
A Static Synchronous Compensator (STATCOM) has not been used in the current analysis. Although STATCOM has excellent behaviour in reactive power control and in voltage stability, it cannot respond to power flow control and harmonic reduction [35]. A BESS has multiple applications as a grid supporting unit. Most common applications consider the ability of a BESS to decouple electric power generation and consumption in different contexts. A grid consisting of renewable energy sources connected with power electronic converters can experience difficulties with harmonic voltages and reactive inrush currents. Reactive currents may cause a voltage drop in the line impedances. A BESS can be used to simultaneously exchange active power between the battery and the grid and improve the power quality of a microgrid. With independent cascaded control of currents and active and reactive power, a BESS can control the reactive power balance and therefore ensure voltage stability [36].
The following research questions determine the scope of this project:
- Determine whether ESS integration within the power system may be used to regulate the defined power quality parameters within the UK Electricity System Grid Code [37] for voltage magnitude and normalize the variation in voltage phase angle within the 5% compliance processes band.
- Compare and contrast the impact of centralized versus distributed ESS integration design on power quality compensation.
- Determine if distributed integration topology has a greater impact on power quality compensation at the distribution or transmission network level.
Voltage rise is the main limiting factor for the integration of photovoltaic (PV) generation in low voltage networks. Inverter voltage control techniques have been developed to provide effective voltage control and support higher penetration of PV generation integration [38]. In most cases, the use of PV-inverter is for overvoltage limitation than to face undervoltage problems. However, PV inverter would be effective in the grid’s topology presented in this paper under certain conditions. The case of PV inverters has not been studied because there are some reasons that BESS are more preferable to PV inverters. To be more specific, BESS operate at night, and their role is crucial when it is getting dark, when the electric load usually has its highest peak, helping as well in voltage regulation. BESS also:
- Have the ability to act as both load and generator, depending on the real power reference and the state of charge;
- Can act as a reference bus in islanded operation, setting frequency and bus voltage;
- Can be used to smooth out power variations produced by the operation of renewable energy resources-based generators and loads.
The aim of this work is to combine the presented research work in the previous Section 1.1 with the use of BESS for the power system. Specifically, it is investigated how the use of BESS in a transmission and distribution system can help improve the voltage limits as they are defined by the Grid’s Code when they are out of range due to increased load and lack of production, which in many cases can be distributed. With this study and specifically from the way the BESS is installed in the transmission system or the distribution network, it will be seen how useful they are for the stability of the system, its more economical operation, as well as the quality of its distributed power.
2.1. Empirical Analysis
The electric power system analysis feature of the NEPLAN software was used to investigate the impact of an established ESS integration design or topology on the power quality of transmission and distribution networks. NEPLAN is an industry-leading intuitive graphical user interface-oriented platform that is widely used to design, simulate, and conduct analyses ranging from basic functions like load flow and short circuit analysis to more dynamic analyses like simulating the intermittency challenges of renewable energy generation systems [10].
In order to generate results for further study, the following tasks were carried out:
- Load flow analysis for a benchmark network in order to acquire voltage magnitude and voltage angle power quality characteristics.
- The benchmark network was modified to reflect centralized and distributed ESS integration architecture, and the corresponding power quality characteristics were determined.
- Power quality characteristics were determined for variations of the benchmark network that represented the integration of ESS within the transmission and distribution topologies.
- After deriving the power quality parameters for the variants, their values were compared to the benchmark network for nodes that performed below the tolerance limits for voltage magnitude specified by the UK National Grid Code.
- In order to get answers for the research topics, various cross-comparisons of the variants’ performances were conducted based on their adopted ESS integration architecture or ESS network location topology.
2.2. Energy Storage Systems (ESS) Characteristics
On the transmission network, centralized and distributed ESS were modeled as PHSS using NEPLAN Synchronous Machine elements (40 MVA, 11 kV Synchronous Generator), while on the distribution network, they were modeled as BESS using the NEPLAN Disperse Generation-Battery Type element of 40 MVA connected at 11 kV. These ESS element representations are “built-in modules” for AC power, eliminating the need to model associated equipment such as converters and other substation equipment that is often necessary to adequately describe these ESS. During load flow, the ESS for each variation operated as swing nodes to replicate their energy flow responsibilities by providing additional energy to satisfy demand or (and) storing excess energy. The capacity of each ESS system and the node that it will be connected to was determined by taking into consideration the N-1 redundancy. This means that the power system will be able to withstand the loss of any of its items (line, transformer, generator, etc.) without loss of load or adverse voltage outcomes, and the system would carry on to all intents as normal.
2.3. Modelled Benchmark Network
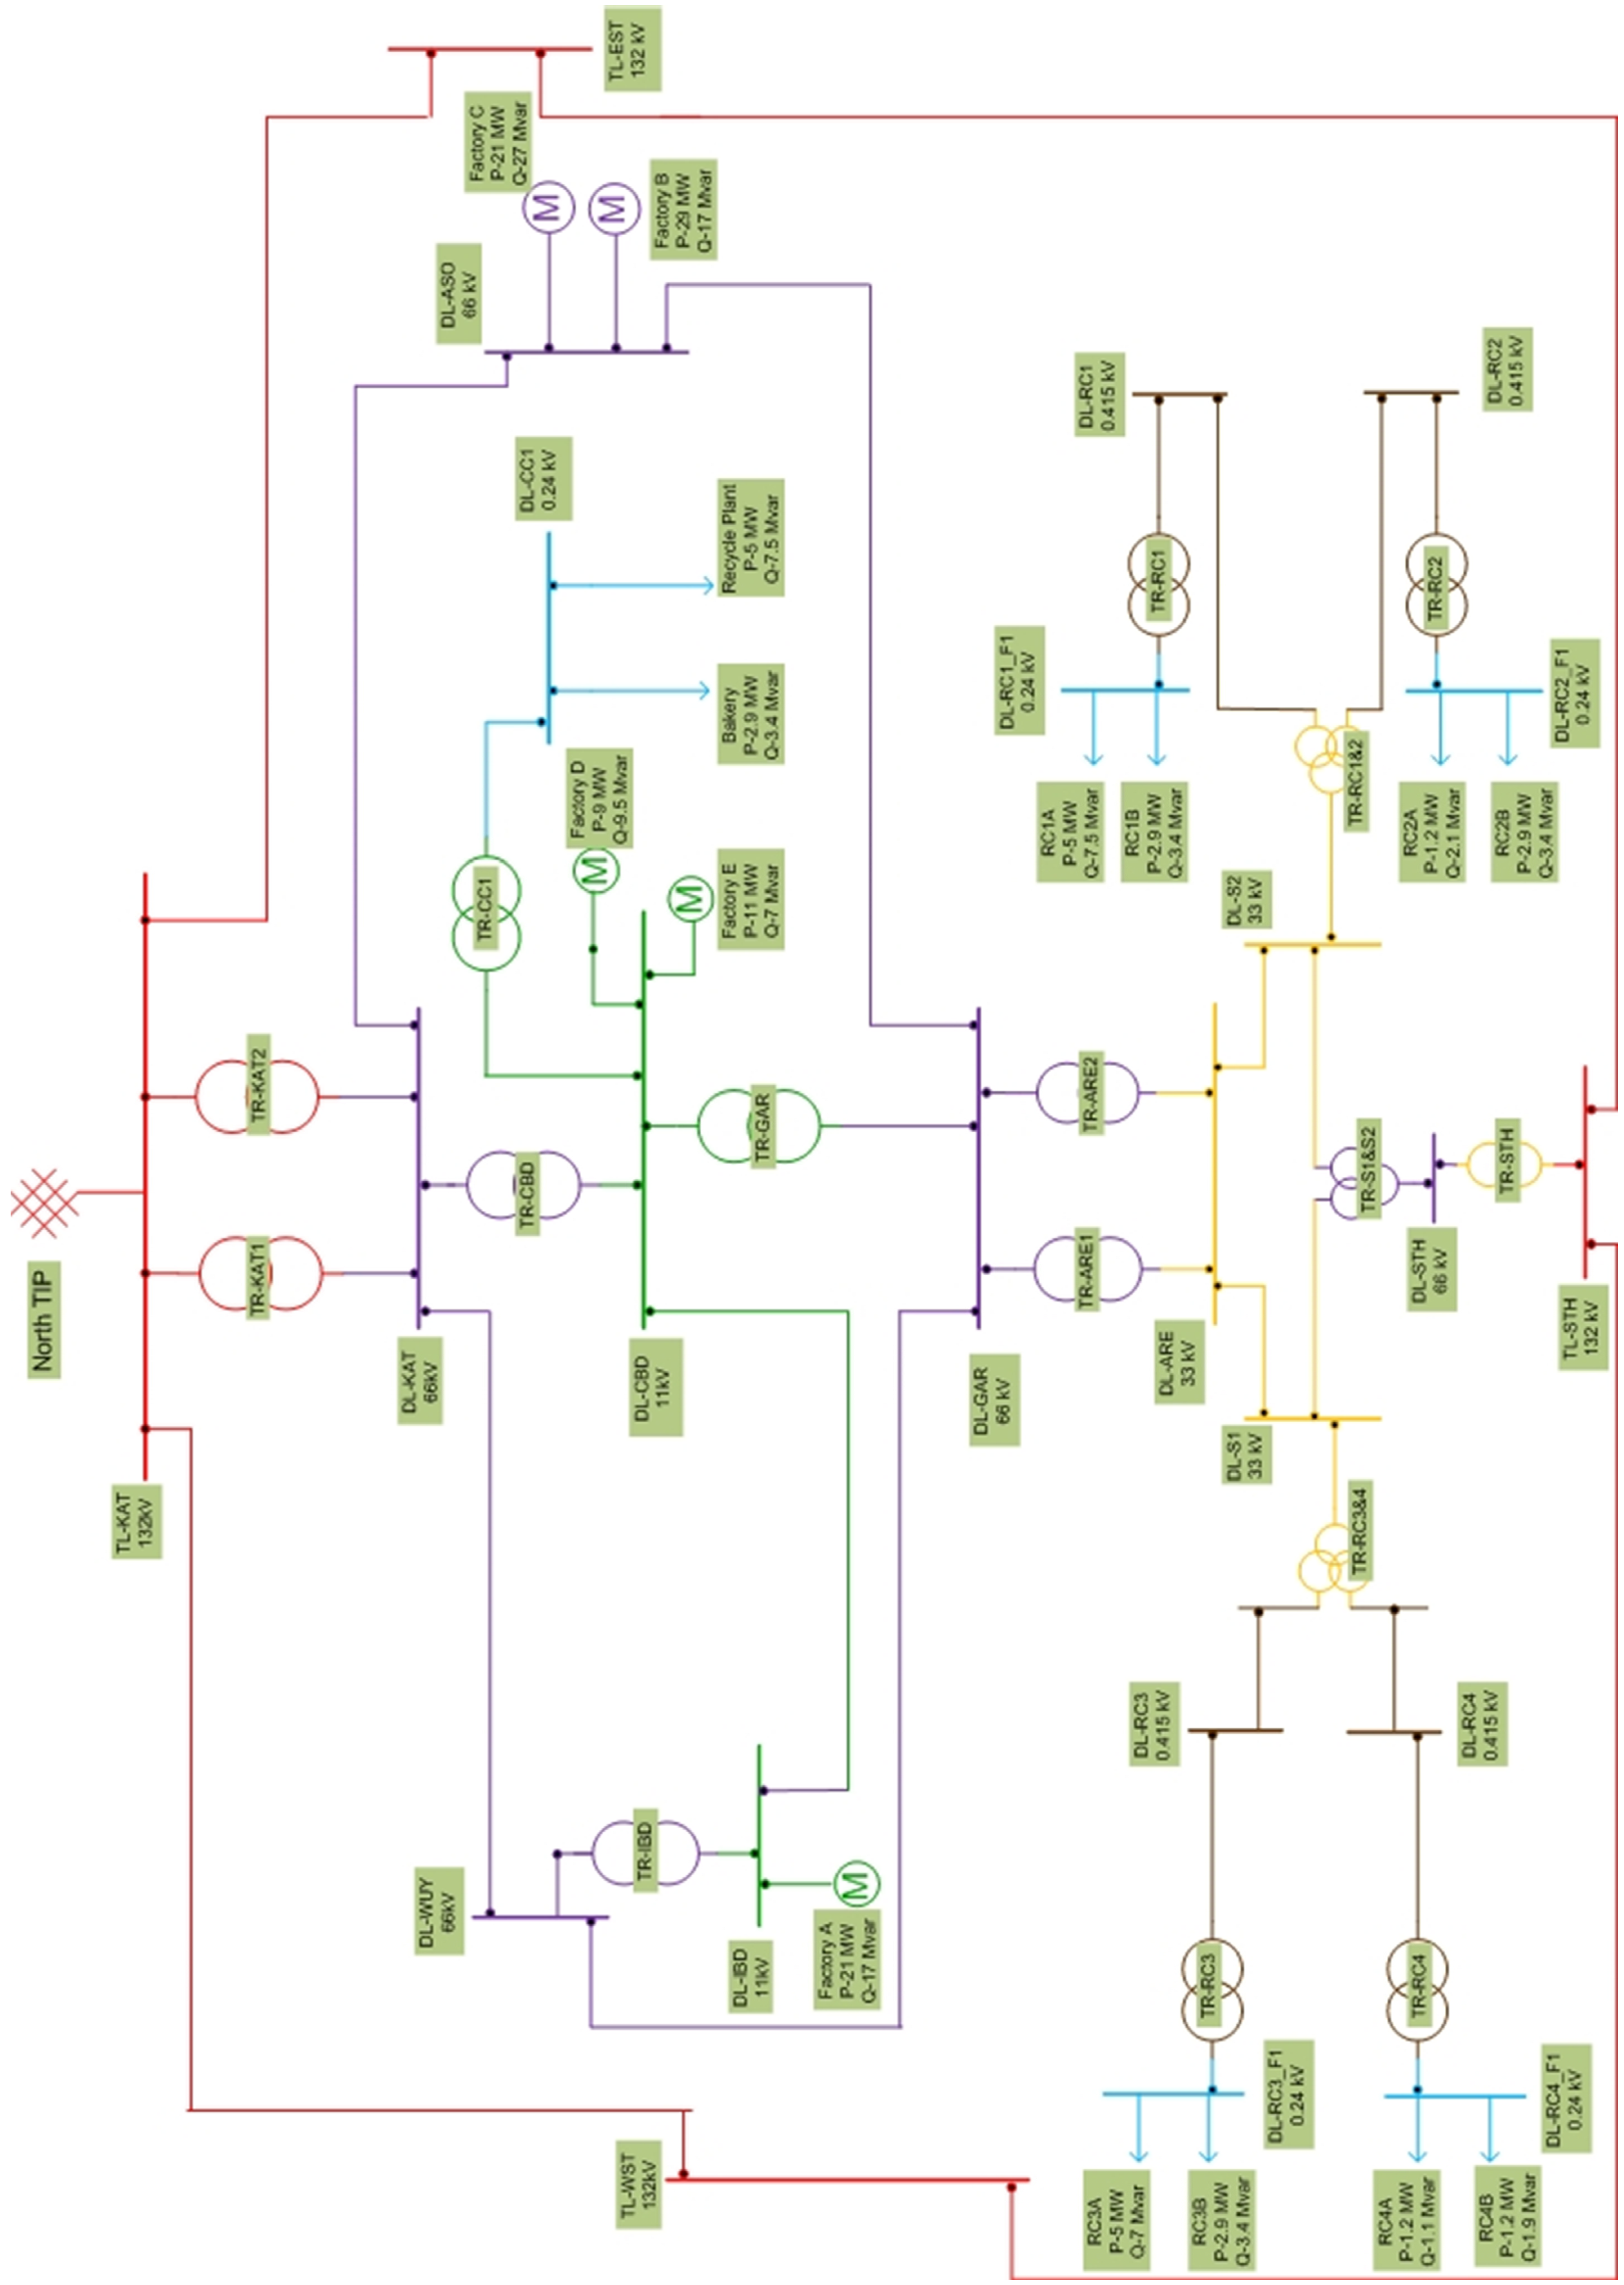
The transmission and distribution network used as a benchmark for this project’s empirical study follows a standard design approach for interconnected transmission and distribution that employs N-1 redundancy to lower the probability of any supply disruptions while increasing supply security. The designed benchmark network (see Figure 1) represents a 50 Hz AC power system network wherein electrical energy provided by a 132 kV network feeder is delivered to three categories of consumers, namely, residential, commercial, and industrial users, connected to distribution nodes (66 kV, 33 kV, and 11 kV) via several network equipment and power lines (132 kV, 66 kV, 33 kV, and 11 kV).
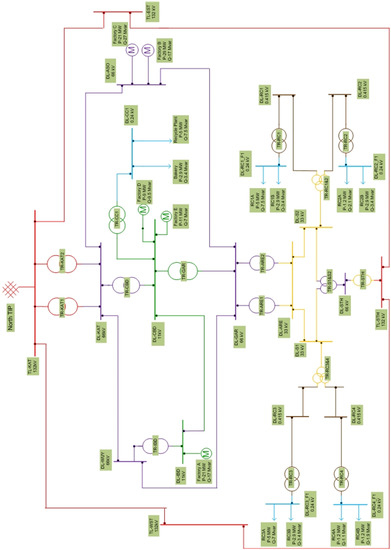
Figure 1.
Benchmark Transmission and Distribution Network Design.
2.4. Variants of Benchmark Network
Each of the benchmark variants depicts changes to the benchmark network as a result of the introduction of a specific ESS integration architecture within a specific network location (topology). ESS integration architecture was either centralized, with a single integrated ESS, or distributed, with many integrated ESS. The integrated ESS topology, on the other hand, is related to the distribution or transmission network. The differentiating peculiarity for each form of the benchmark network is shown in Table 1.

Table 1.
Characteristics of Benchmark ESS Variants.
2.5. Limitation of Methodology
The following are the limitations of the methodology applied to this project:
- The simulation only considers steady-state conditions and ignores transient states, although transient voltage sags are more common in reality, and their duration correlates to poor power quality.
- Second, the presence of grid-connected microgrids and consumer-controlled energy storage devices implies that energy will flow in both directions between customers and the network. Due to the difficulty of designing complex sensing measures that are required to intelligently protect network equipment from overloads caused by power being supplied simultaneously by the consumer load and the grid, this simulation does not include the effect of protection devices on the change direction of energy flow.
3. Data Analysis
3.1. Power Quality Performance of Benchmark Network
The NEPLAN load flow analysis was used to determine the power quality performance of the benchmark network and its variants. According to the findings, the ratio of observed voltage magnitude to the rated node voltage of thirteen nodes in the benchmark network (Table 2) was outside the 5% rated node voltage electricity system compliance tolerance limit.
Table 2.
Benchmark Network Node Voltage outside Tolerance Limits.
In this study, we considered the worst-case scenario where the On Load Tap Changers (OLTC) have reached the highest possible position and there is not any other tap changer adjustment for improving the voltage profile of the transformers. This could be a real case scenario of a transmission system where the system’s load is greater than the predicted load, and therefore, there is undervoltage with the OLTC having reached its highest position for improving the voltage. This is a real scenario that happens very often not only due to the mismatch of the system’s load but also due to production problems (trips of power units or lack of fuels, e.g., natural gas, etc.). Therefore, the impact of distributed energy storage devices such as BESS needs further investigation.
3.2. Power Quality Performance Comparison between Benchmark Network and Centralized ESS Integrated Variants
Following the identification of the benchmark network nodes with poor power quality under steady-state conditions, the individual performance of the centralized ESS integrated variants, as shown in Table 1, was obtained to determine the compensatory effect of the ESS integration on improving the node voltage magnitude deficit.
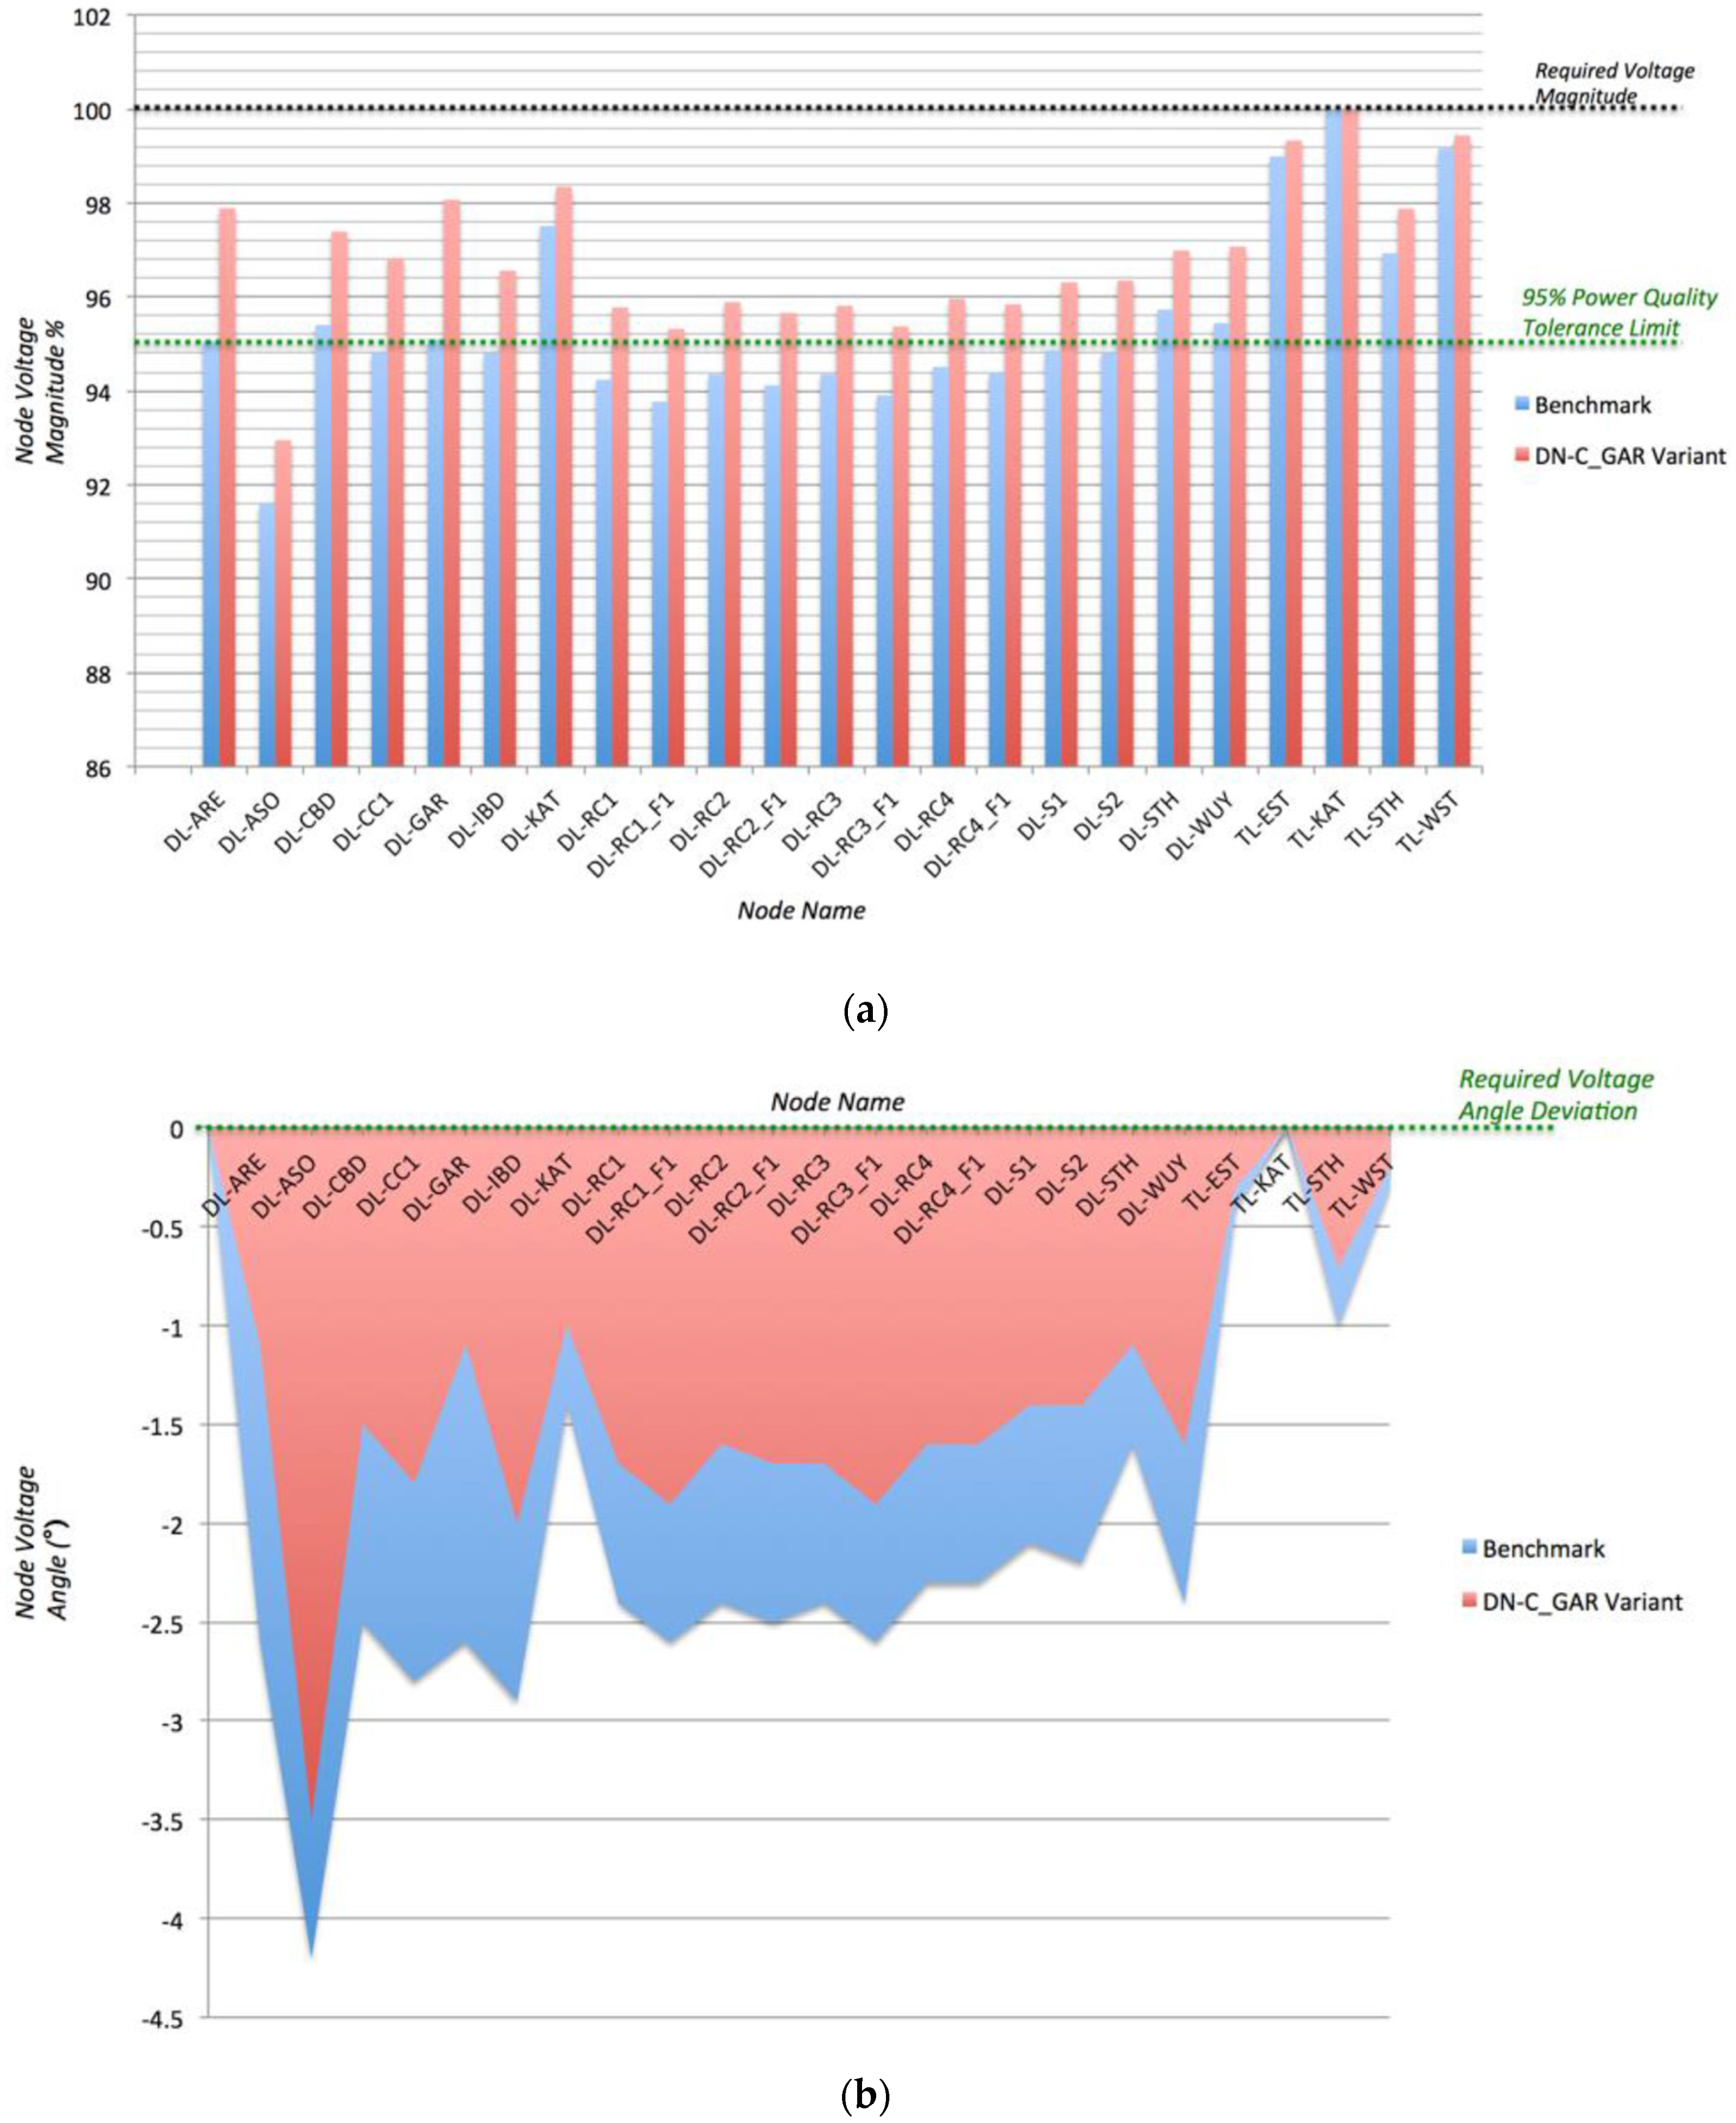
Figure 2 shows the benchmark network’s performance versus the DN-C GAR variant, which represents a single centralized BESS integrated at the 66 kV DL-GAR node. This variant improves power quality performance by 1.44 percent average voltage magnitude compensation and 0.7 degrees average voltage angle compensation. With the exception of the 66 kV DL-ASO node in Figure 2a, most nodes in the benchmark network that were previously outside the 5% of rated voltage compliance requirement are now compliant. Figure 2b shows a small improvement in voltage angle correction; however, the unity angle deviation is only obtained at node TL-KAT.

Figure 2.
Graph indicating the effect of DN-C_GAR variant on (a) the voltage magnitude compensation; (b) the voltage angle deviation compensation.
The same procedure has been followed for the other centralized ESS Integrated Variants (DN-C_ASO, DN-C_KAT, DN-C_WUY, DN-C_STH, TN-C_EST, TN-C_STH, TN-C_WST). Their results are presented together in Table 3.
Table 3.
Power Quality Performance of the Respective Benchmark Network Variants.
3.3. Power Quality Performance Comparison between Benchmark Network and Distributed ESS Integrated Variants
The load flow analysis generated data are also used to evaluate the performance of the distributed BESS integrated variants against the benchmark network under steady-state simulated settings.
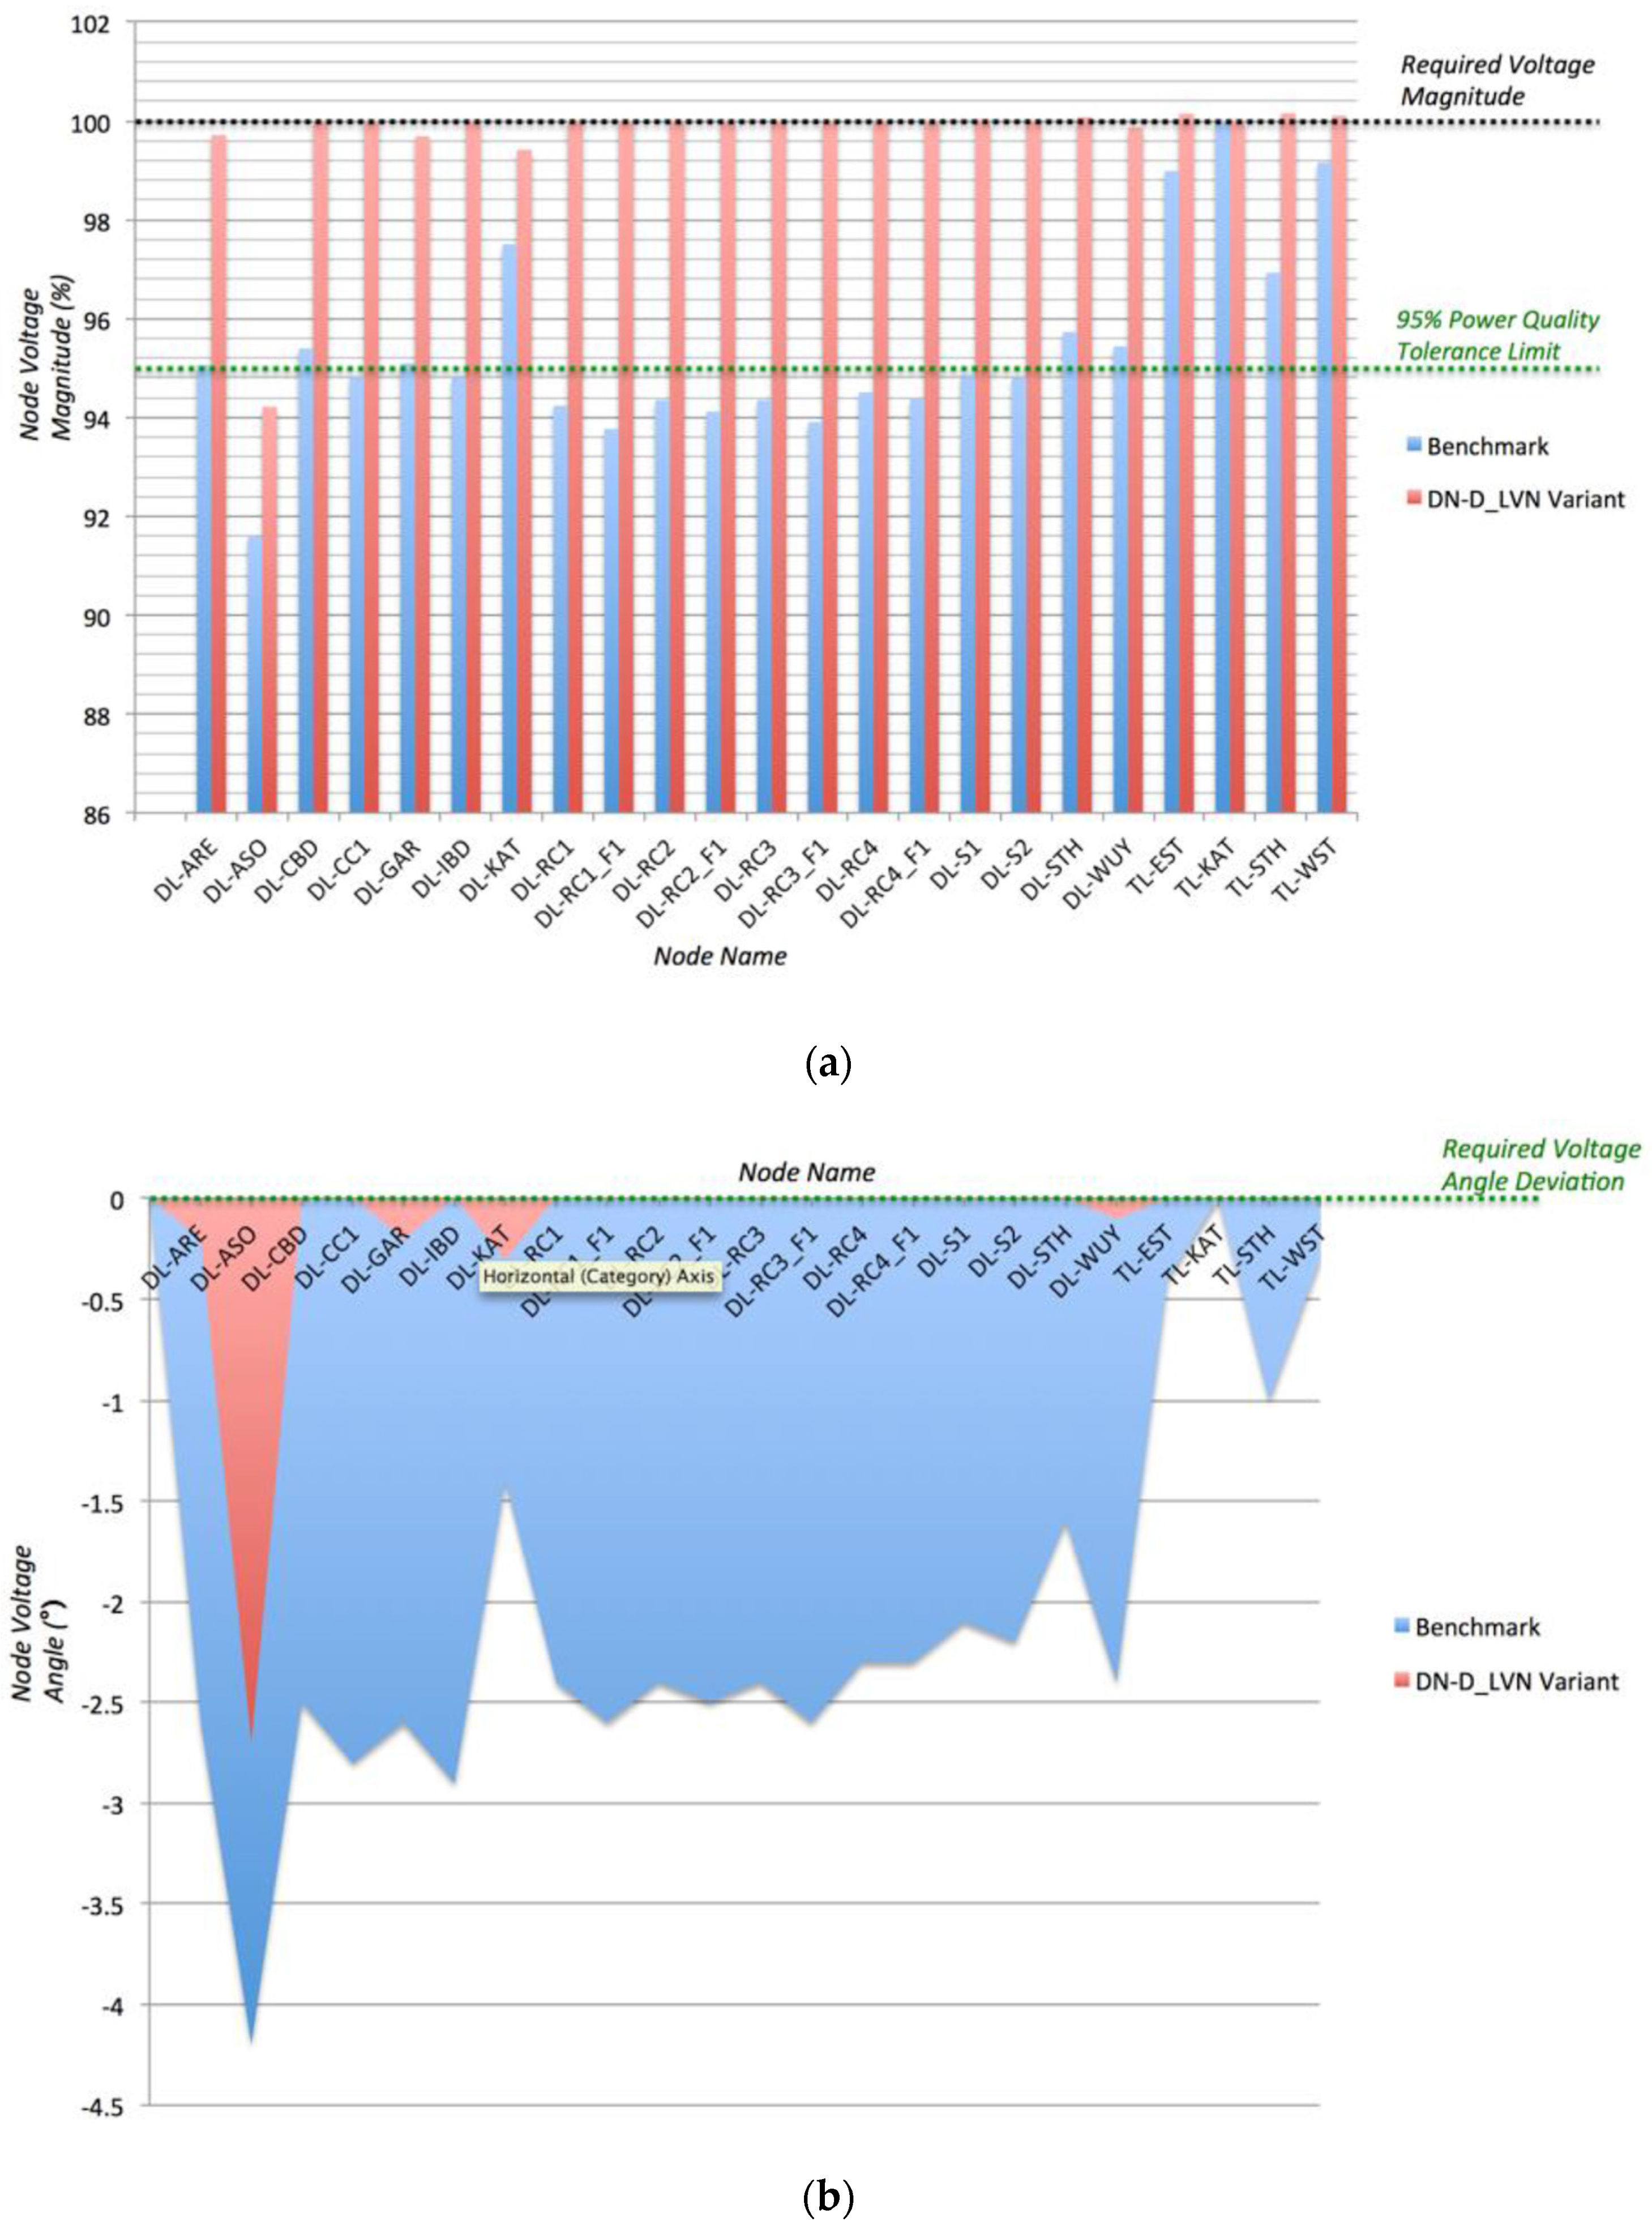
Figure 3 shows the performance of the DN-D LVN variant with BESS distributed over the distribution network topology at nodes with a voltage rating of 11 kV or less. That is, at the 66 kV distribution nodes, there are no BESS. The high average compensation of 4.33% and 1.96° for voltage magnitude and voltage angle, respectively, showed a considerable improvement in average power quality compensation. With the exception of 66 kV DL-ASO, which is now functioning at a voltage magnitude of 94.22 percent from its initial value of 91.59, as shown in Figure 3a, all nodes formerly outside the tolerance band are now operating at the rated voltage. The compensation of voltage angle deviation is also crucial, as shown in Figure 3b, where all nodes except DL-ARE (−0.2°), DL-ASO (−2.7°), DL-GAR (−0.2°), DL-KAT(−0.3°) and DL-WUY(−0.1°) achieved 0° voltage angle deviation.

Figure 3.
Graph indicating the effect of DN-D_LVN Variant on (a) the voltage magnitude compensation; (b) the voltage angle deviation compensation.
The same procedure has been followed for the other distributed ESS Integrated Variants (DN-D_All, TN-D_All, TN&DN-D_All). Their results are presented all together in Table 3.
4. Results
4.1. Main Results of Variant Power Quality Performance Analysis
The relative effect of the integrated ESS architecture and topology on the benchmark network is shown in Table 3. The distributed ESS integrated architecture achieved a better average improvement in voltage magnitude and voltage angle deviation, as can be seen. Equally notable is that the performance also infers that the highest power quality performing variants wherein ESS is integrated within the distribution network topology when compared with their counterparts integrating ESS within the transmission network topology.
4.2. Quantitative Appraisal of Variant Power Quality: Performance (Voltage Magnitude %)
4.2.1. Cross-Comparison of Centralized ESS Integration Architecture Variants
Figure 4 shows the voltage magnitude performance of the Centralized ESS Integration Architecture variants (compared to the rated node voltages of benchmark networks). In general, the DN-C_STH variant was observed to provide the highest compensation towards returning node voltage magnitudes earlier outside power quality thresholds back into compliance, while the TN-C_WST variant represented the lowest compensation effect amongst the Centralized ESS Integration Architecture variants, as highlighted in the graph presented in Figure 4.
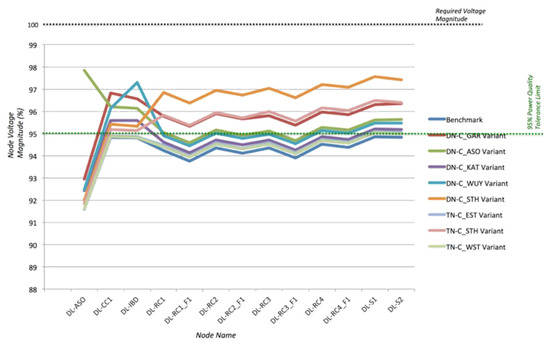
Figure 4.
Graphical representation of relative improvement in voltage magnitude arising from variants employing Centralized ESS Integration Architecture.
4.2.2. Cross-Comparison of Distributed ESS Integration Architecture Variants
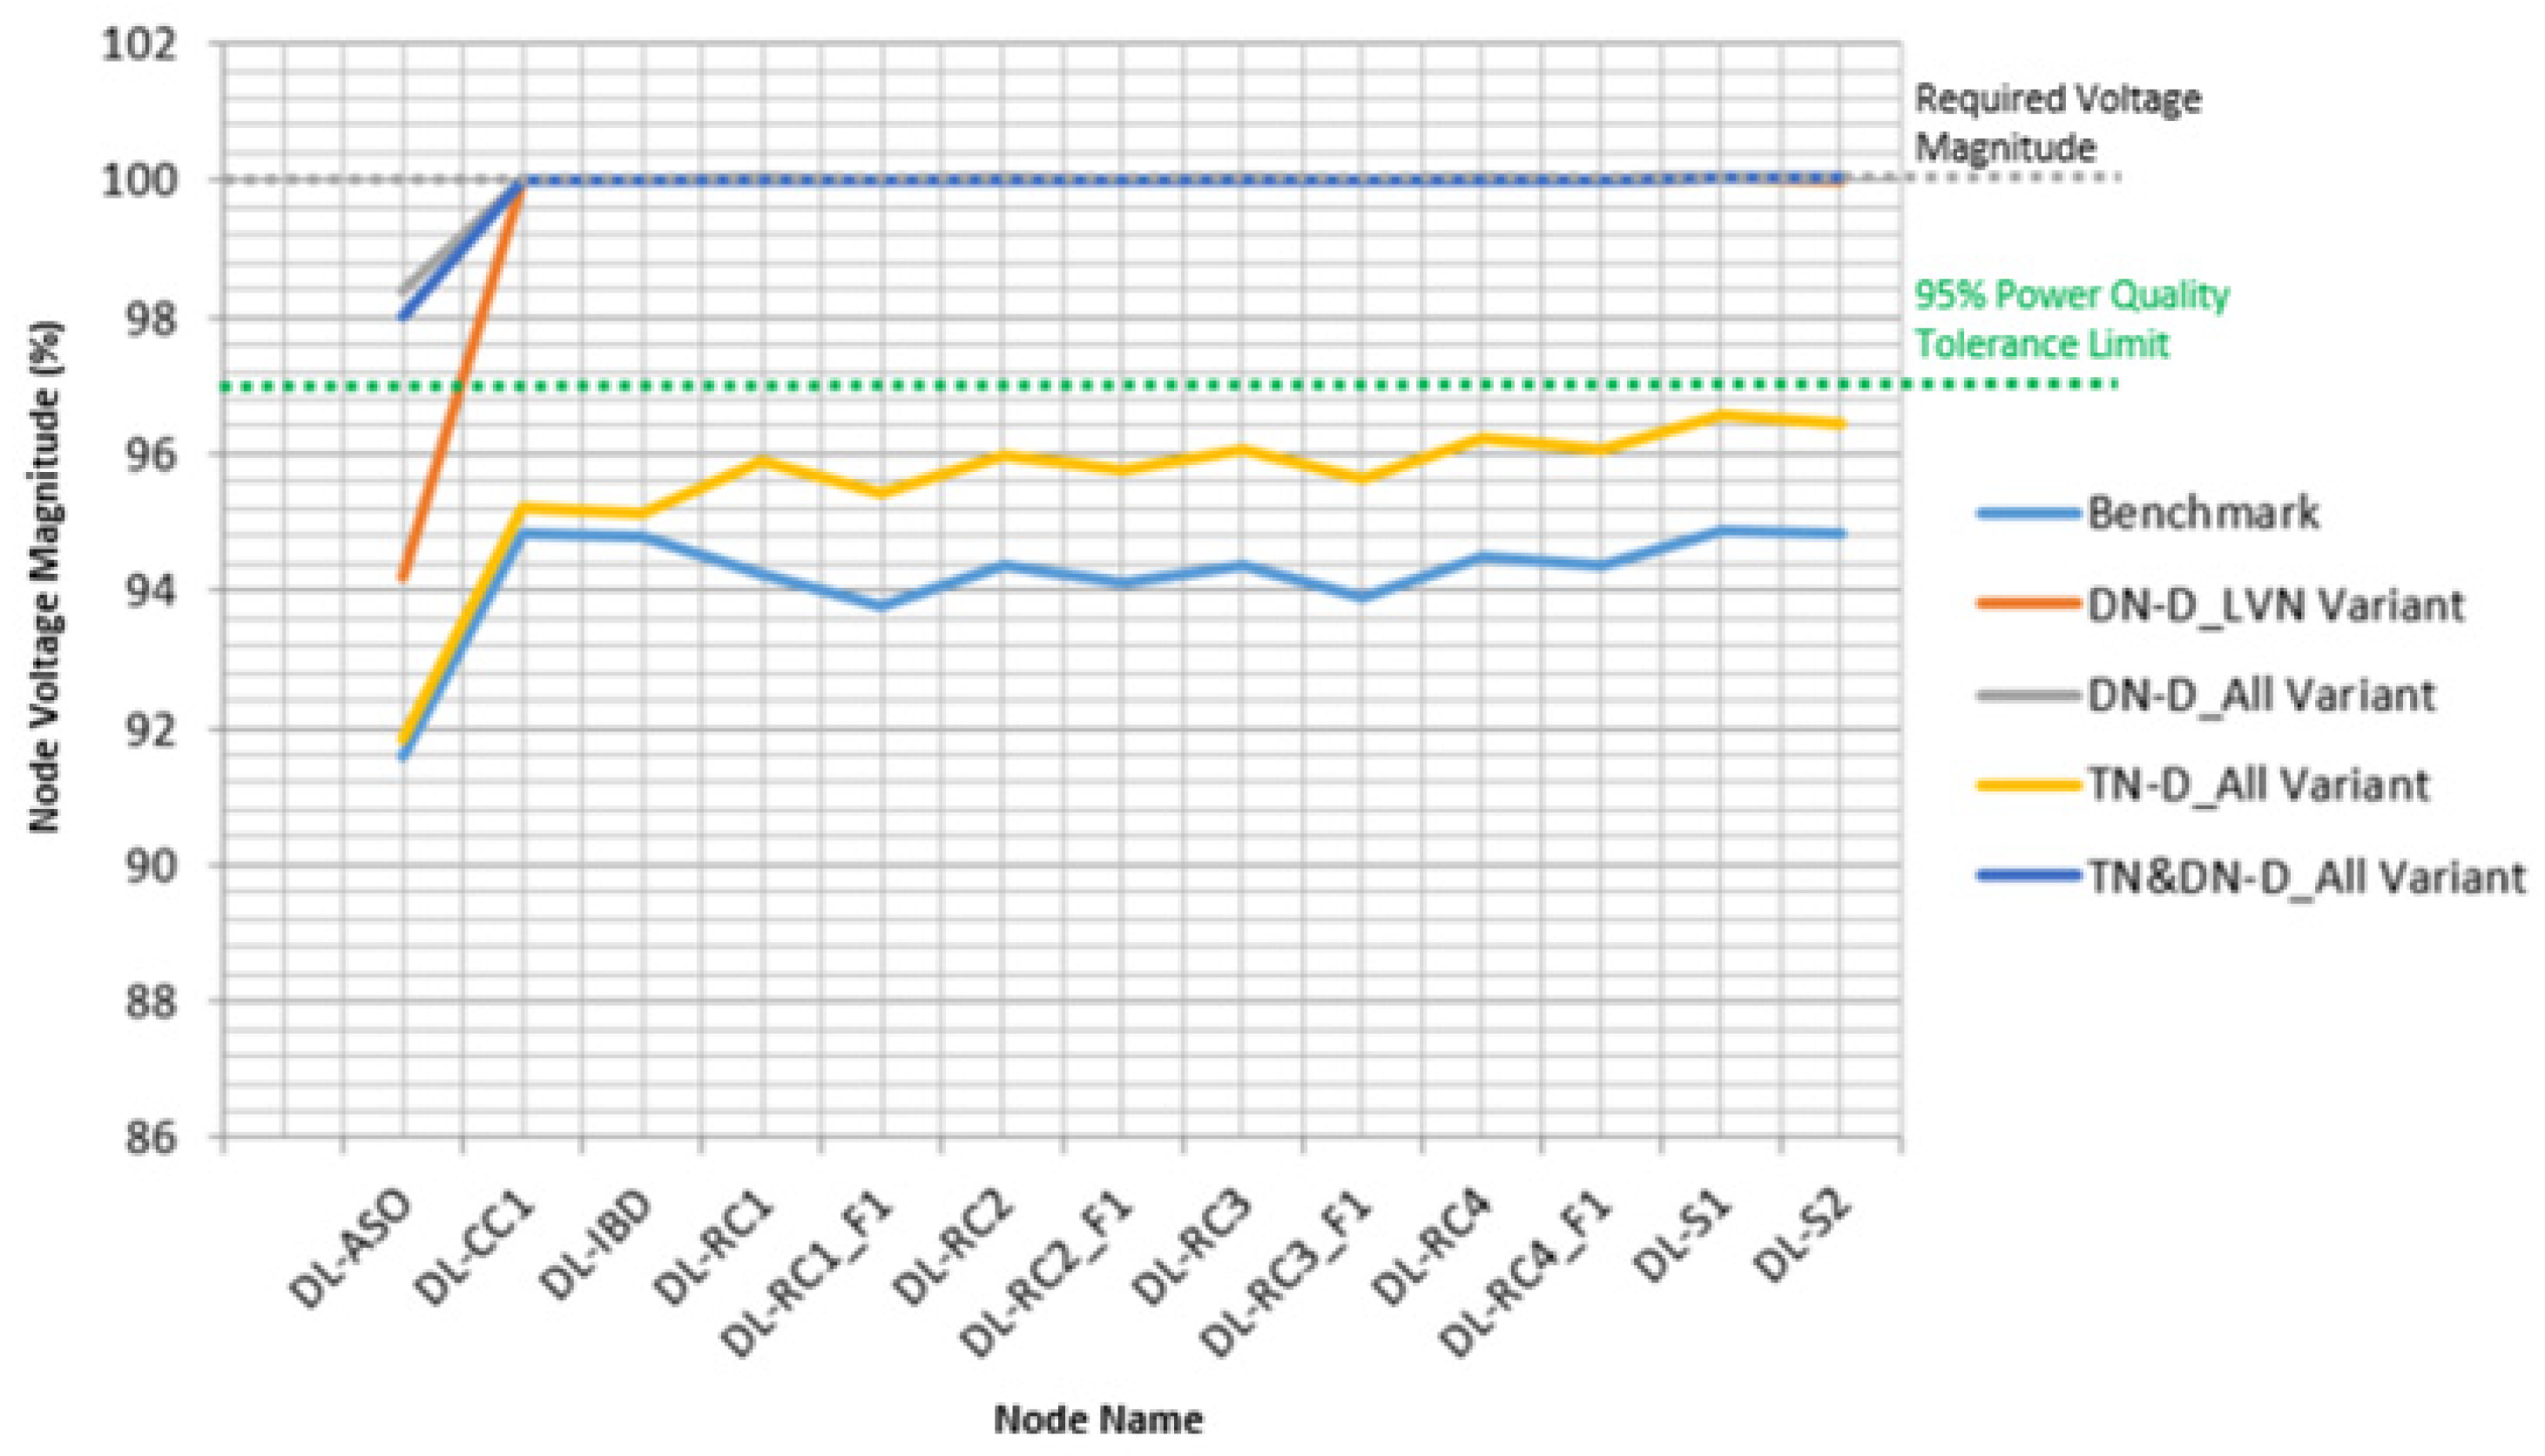
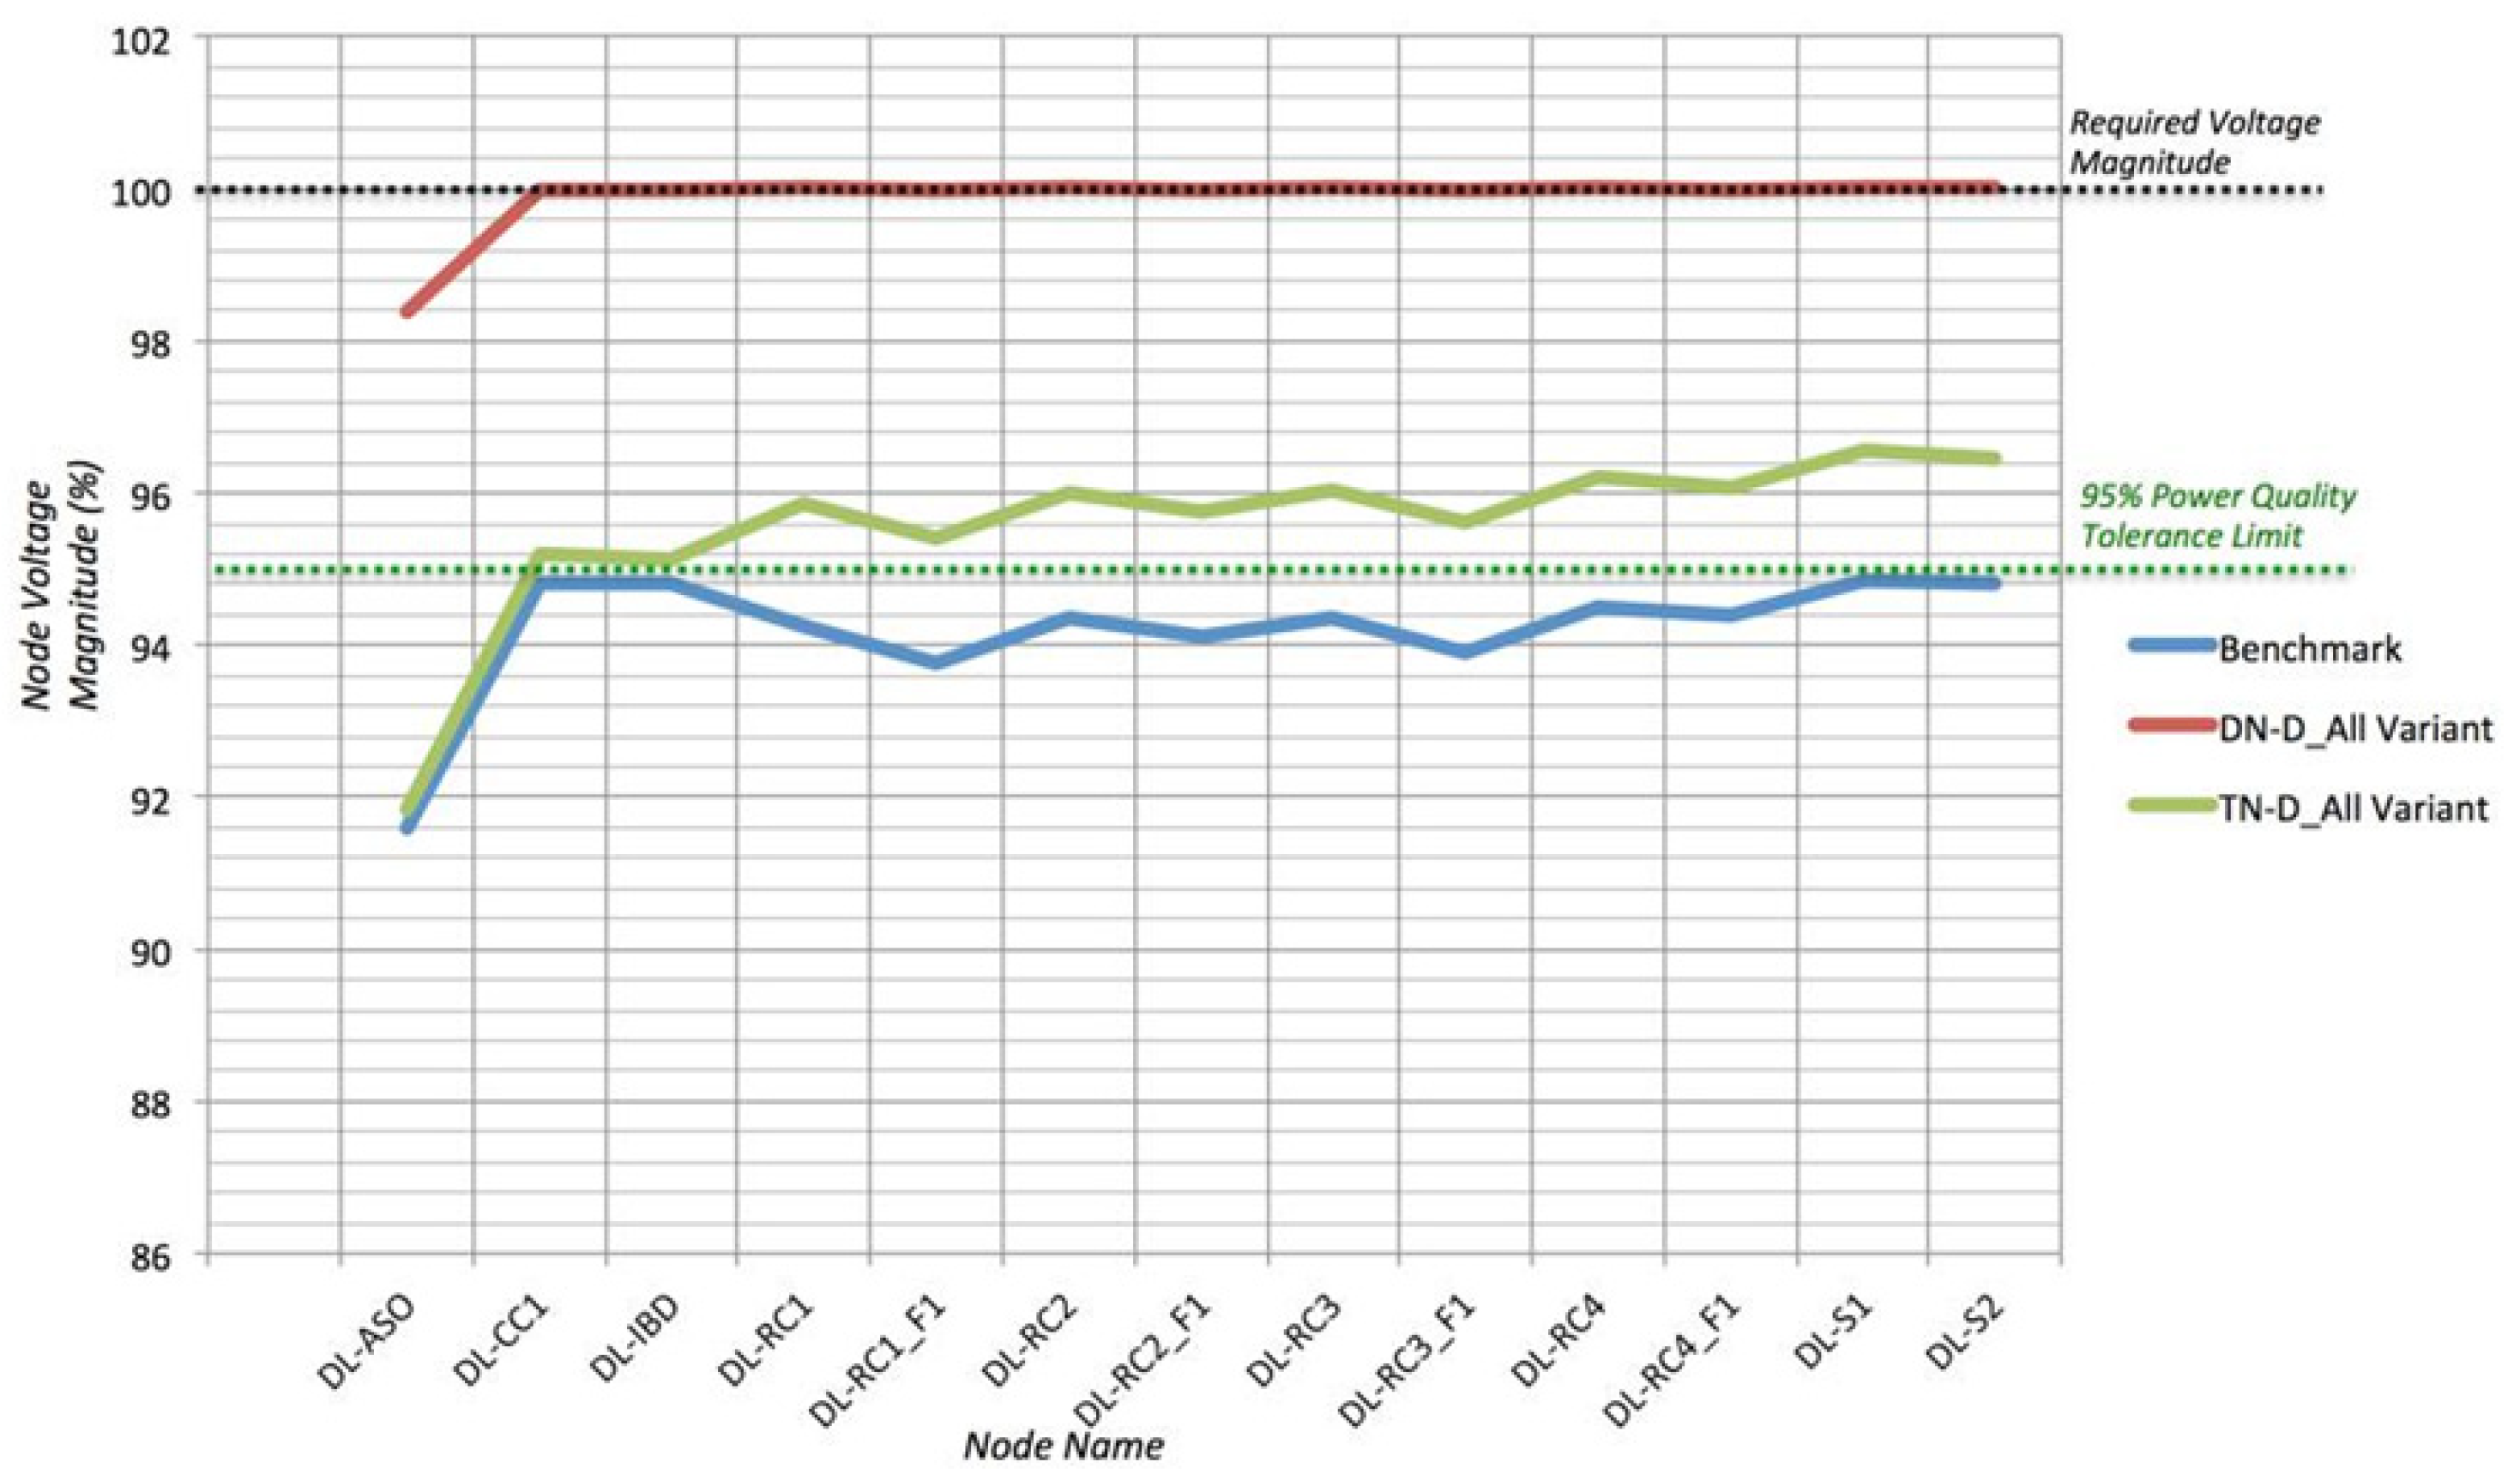
The relative impact of variants using the Distributed ESS Integration Architecture is shown in Figure 5. Three of the variants (DN-D_LVN, DN-D_All, and TN&DN-D_All) for the out-of-range benchmark network nodes recorded a very positive compensatory effect on the restoration of the compliance. However, the DN-D_All variant was the best-performing variant, while the TN-D_All variant was the worst-performing variant in this ESS integration categorization, as shown in the graph presented in Figure 5. While the TN-D_All variant is the least performer, in general, its performance was plausible because all nodes were restored to compliance status except the 66 kV DL-ASO node. As earlier mentioned, both the DN-D_All and TN&DN-D_All variants result in almost identical voltage magnitude compensatory effects despite the fact that the latter not only has BESS integrated within its distribution topology but also PHSS at transmission-level nodes.
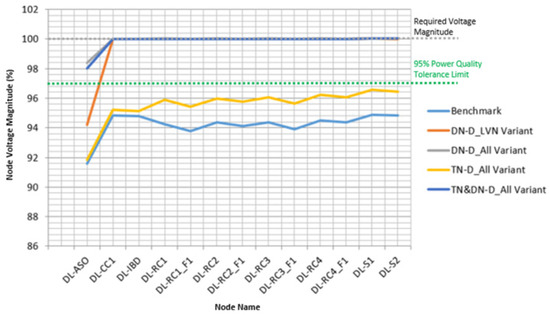
Figure 5.
Graphical representation of relative improvement in voltage magnitude arising from variants employing Distributed ESS Integration Architecture.
4.2.3. Cross-Comparison of Distribution Network ESS Integration Topology Variants
From the graph presented in Figure 6, it is clearly observed that the DN-D_All variant provided in voltage magnitude a bigger improvement (with just 66 kV DL-ASO node not achieving 100% rated node voltage), while the DN-C_KAT variant yielded the lowest improvement.
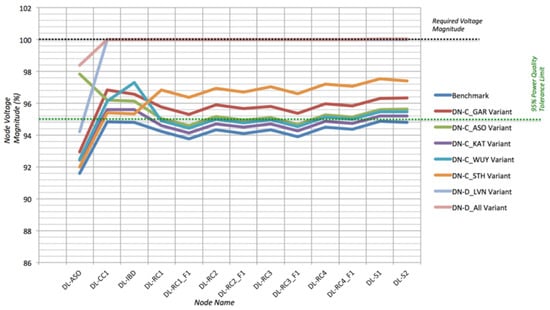
Figure 6.
Graphical representation of relative improvement in voltage magnitude arising from variants employing Distribution ESS Integration Topology.
4.2.4. Cross-Comparison of Transmission Network ESS Integration Topology Variants
The graph within Figure 7 depicts the relative strengths of the variant designs employing Transmission Network ESS Integration Topology.
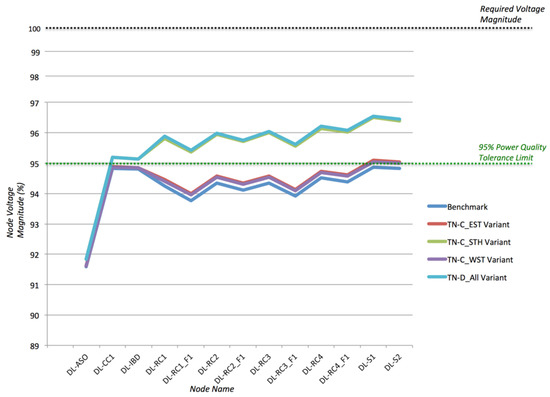
Figure 7.
Graphical representation of relative improvement in voltage magnitude arising from variants employing Transmission ESS Integration Topology.
It is simple to derive that TN-D_All variant recorded the best-in-class performance in spite of its inability to bring 66 kV DN-ASO node into the voltage magnitude tolerance band. On the other hand, the TN-C_WST variant was the least successful performer.
4.2.5. Cross-Comparison of Best Performing Centralized and Distributed ESS Integration Architecture Variants
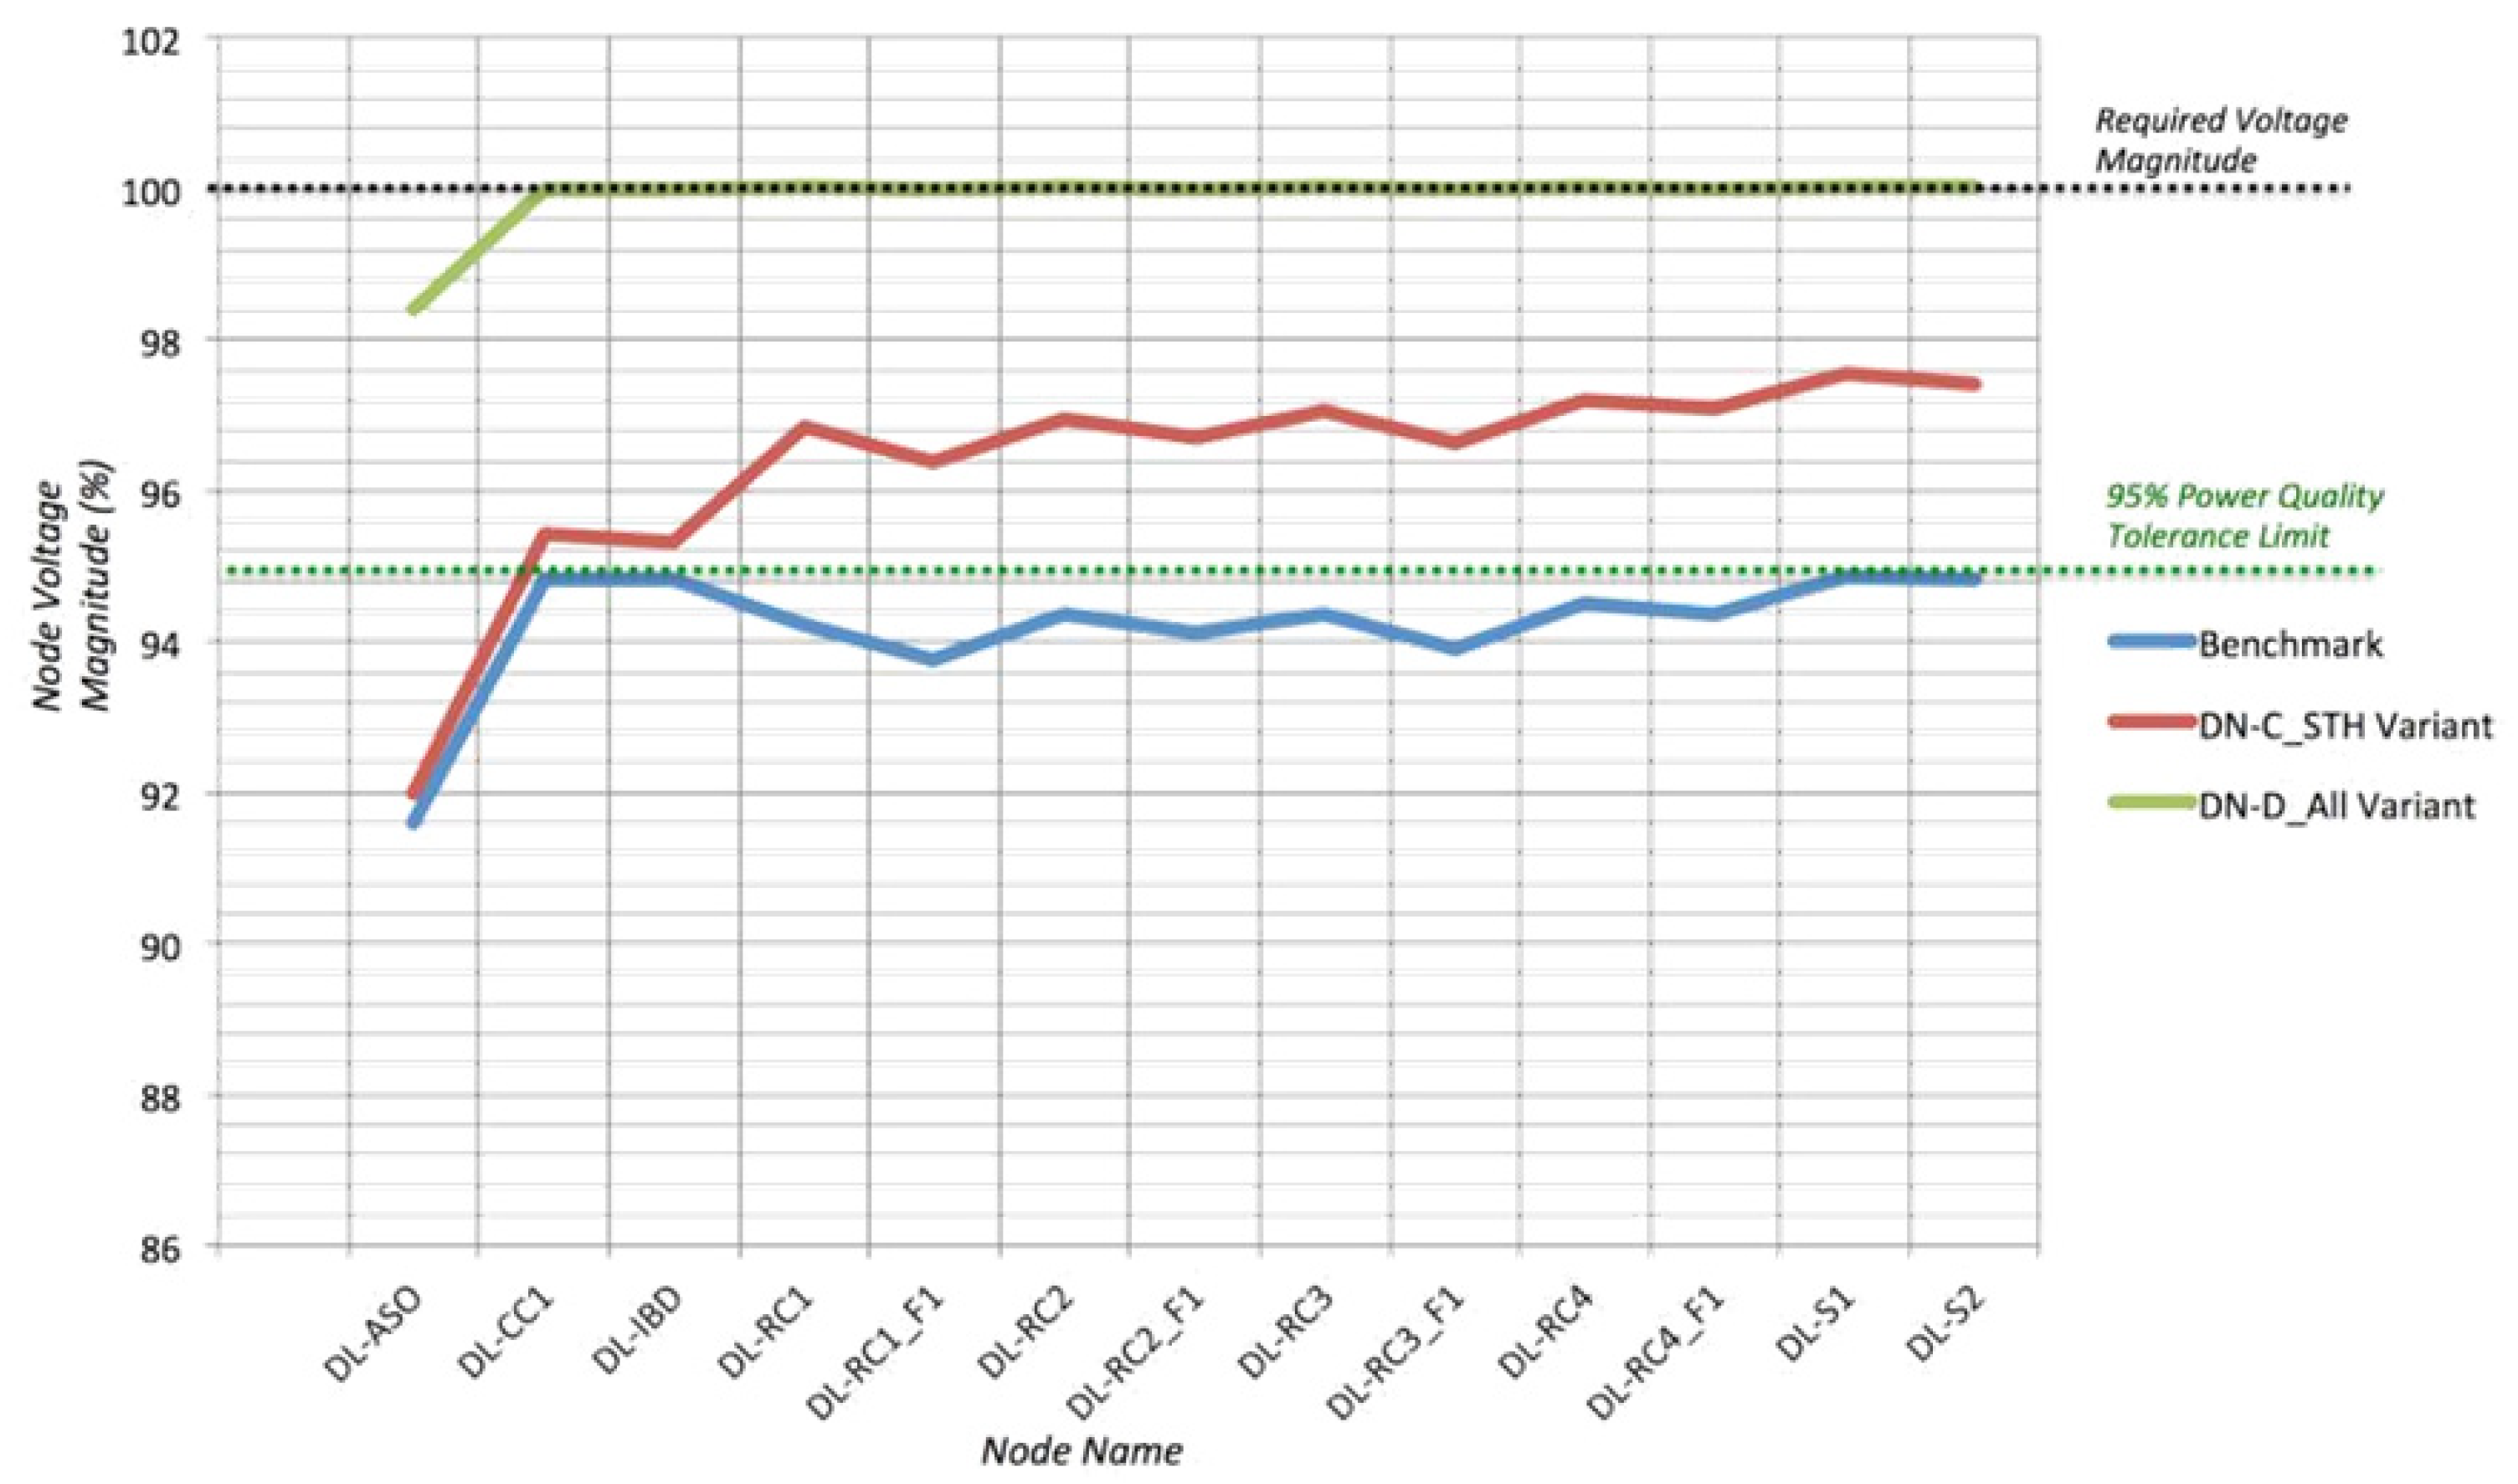
From Figure 8, the effect of the ESS architecture employed by the DN-D_All variant on the restoration of out-of-range benchmark network node voltage magnitudes was appreciably higher than its centralized complement, DN-C_STH.
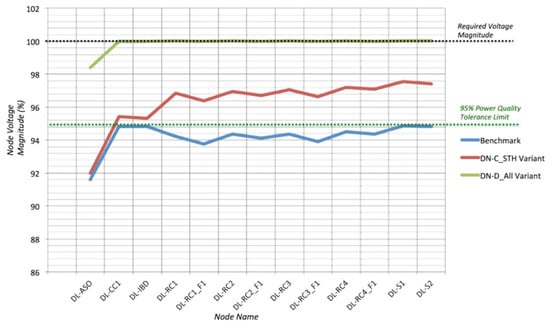
Figure 8.
Graphical Representation of Relative Improvement in Voltage Magnitude between Top Centralized and Top Distributed ESS Integration Architecture Variants.
4.2.6. Cross-Comparison of Best Performing Distribution Network and Transmission Network ESS Integration Topology Variants
The influence of BESS and the distribution Integration topology was once again evident because the DN-D_All variant outperformed the TN-D_All variant, as presented in Figure 9.
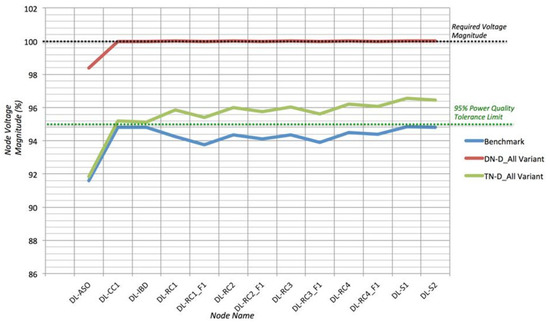
Figure 9.
Graphical representation of Relative Improvement in Voltage Magnitude between Top Centralized and Top Distributed ESS Integration Architecture Variants.
4.3. Comparing the Variants’ Power Quality Performance Results with Expectations
4.3.1. Significance of ESS Integration within an Interconnected Transmission and Distribution Network
The data analysis presented in paragraph 3, and Table 3 shows that integrating ESS into the benchmark network improved the voltage magnitude and voltage angle deviation performance parameters of power quality. The range of performance for improvement in average voltage magnitude ranged between 0.13% (for TN-C_WST and TN-C_EST variants) and 4.57% (for DN-D_All variant). While the improvement in voltage angle also at the same variants ranged between 0.04° and 2.07°.
4.3.2. Correlation between ESS Integration Architecture and Power Quality Improvement
The result of the data analysis illustrates that between the Distributed ESS Integration Architecture and power quality improvement exists a positive and significant relationship to the Centralized ESS Integration Architecture. In particular, the performance of the DN-D_All variant wherein the integrated ESS provided as high as 4.57% in an average improvement of voltage magnitude and 2.07° in voltage angle compensation. Having said that, the outperformed centralized ESS integration architecture variant, DN-C-STH, was a better performer than the TN-D_All variant despite the fact that the TN-D_All variant employed the Distributed ESS Integration Architecture.
4.3.3. Correlation between ESS Integration Topology and Power Quality Improvement
The results of the cross-comparison established that there is a significant association between the Distributed ESS Integration Topology and Power Quality. The variant, DN-D_All, achieved almost 100% node voltages at all nodes.
5. Conclusions
The integration of energy storage systems (ESS) inside interconnected transmission and distribution networks is linked to improvements in regulating power quality characteristics such as node voltage magnitude and phase angle, according to this study. A BESS that is properly scaled and situated can help meet peak energy demand, improve the benefits of integrating renewables and distributed energy sources, improve power quality management, and lower the distribution network expansion costs.
While the integration of ESS into the electric power system has historically provided desired effects in situations such as load balancing, relief of congested networks, diversification of energy mix, and so on, this research work shows that the specific approach for ESS integration, which includes architecture and or topology consideration, has a significant impact on the power quality compensation capacity of BESS. While all of the evaluated network topologies and (or) architectures for ESS integration provided some measure of compensation for restoring node voltages within the 5% Grid Code Compliance tolerance band, this project shows that distributed ESS within distribution network topologies across the power system provided the most effective solution for restoring out-of-range nodes to compliance. However, due to the previously mentioned technical and financial constraints of battery technology, the feasibility of this integration strategy using BESS is currently limited. As a result, centralized ESS architecture in distribution or transmission topologies still has a cost advantage over modern distributed ESS architecture in electrical networks, as seen by the amount of PHSS systems installed, notably at the transmission network level.
This study will benefit from further work, especially because the modeling of the benchmark network’s energy storage versions was done under steady-state settings. Furthermore, despite the fact that distributed and centralized energy storage systems use different technologies, they both have the same capacity for energy storage. As a result, it would be interesting to compare the results of the benchmark versions to the technical parameters (energy density, charge/discharge limits, ramp-up/ramp-down) of battery energy storage systems obtained in this project.
Another factor to explore in future research is the impact of diversification in the types of distributed energy storage technologies, notably flywheel technology, due to the potential for lower capital costs than battery energy storage systems. This is especially important because battery production is not only expensive and energy-intensive, but there are also considerable end-of-life costs for battery disposal because the components used to make batteries are not easily recycled.
Author Contributions
Conceptualization, O.B.A., G.F., V.V. and D.N.; methodology, O.B.A., G.F. and V.V.; validation, O.B.A., V.V. and L.E.; writing—original draft preparation, O.B.A. and G.F.; writing—review and editing, D.N. and L.E.; supervision, D.N. All authors have read and agreed to the published version of the manuscript.
Funding
The authors acknowledge the financial support for this work from the Special Account for Research of ASPETE, through the funding program “Strengthening Research of ASPETE Faculty Members”.
Conflicts of Interest
The authors declare no conflict of interest.
References
- Ter-Gazarian, A.G. Energy Storage for Power Systems, 2nd ed.; Institution of Engineering and Technology: London, UK, 2011. [Google Scholar]
- Nieto, A.; Vita, V.; Ekonomou, L.; Mastorakis, N.E. Economic analysis of energy storage system integration with a grid connected intermittent power plant, for power quality purposes. WSEAS Trans. Power Syst. 2016, 11, 65–71. [Google Scholar]
- Nieto, A.; Vita, V.; Maris, T.I. Power quality improvement in power grids with the integration of energy storage systems. Int. J. Eng. Res. Technol. 2016, 5, 438–443. [Google Scholar]
- Vita, V.; Christodoulou, C.; Zafeiropoulos, I.; Gonos, I.; Asprou, M.; Kyriakides, E. Evaluating the flexibility benefits of smart grid innovations in transmission networks. Appl. Sci. 2021, 11, 10692. [Google Scholar] [CrossRef]
- Mladenov, V.; Chobanov, V.; Seritan, G.C.; Porumb, R.F.; Enache, B.-A.; Vita, V.; Stănculescu, M.; Van, T.V.; Bargiotas, D. A flexibility market platform for electricity system operators using blockchain technology. Energies 2022, 15, 539. [Google Scholar] [CrossRef]
- Vita, V.; Christodoulou, C.A.; Zafeiropoulos, Ε.; Mladenov, V.; Chobanov, V.; Asprou, M.; Kyriakides, E. Flexibility adequacy assessment in the SEE region with new technology integration. WSEAS Trans. Power Syst. 2022, 17, 76–83. [Google Scholar] [CrossRef]
- Mladenov, V.; Chobanov, V.; Zafeiropoulos, E.; Vita, V. Characterisation and evaluation of flexibility of electrical power system. In Proceedings of the 10th Electrical Engineering Faculty Conference (BulEF), Sozopol, Bulgaria, 11–14 September 2018. [Google Scholar] [CrossRef]
- ECOFYS (Energy Storage Opportunities and Challenges—A West Coast Perspective White Paper). Available online: http://www.ecofys.com/files/files/ecofys-2014-energy-storage-white-paper (accessed on 13 May 2021).
- Fusion 4 Freedom. Available online: https://fusion4freedom.com/grid-scale-energy-storage-systems/ (accessed on 13 May 2022).
- NEPLAN|Electricity. Available online: http://www.neplan.ch/neplanproduct/en-electricity/#pa (accessed on 5 April 2022).
- Zuo, Y.; Paolone, M.; Sossan, F. Effect of voltage source converters with electrochemical storage systems on dynamics of reduced-inertia bulk power grids. In Proceedings of the 21st Power Systems Computation Conference, Porto, Portugal, 29 June 29–3 July 2020. [Google Scholar]
- Namor, E.; Sossan, F.; Cherkaoui, R.; Paolone, M. Control of battery storage systems for the simultaneous provision of multiple services. IEEE Trans. Smart Grid 2019, 10, 2799–2808. [Google Scholar] [CrossRef] [Green Version]
- Rosso, A.D.; Eckroad, S.W. Energy storage for relief of transmission congestion. IEEE Trans. Smart Grid 2014, 5, 1138–1146. [Google Scholar] [CrossRef]
- Hemmati, R.; Jirdehi, M.A.; Saboori, H. Reliability improvement in radial electrical distribution network by optimal planning of energy storage systems. Elsevier Energy 2015, 93, 2299–2312. [Google Scholar] [CrossRef]
- Motalleb, M.; Reihani, E.; Ghorbani, R. Optimal placement and sizing of the storage supporting transmission and distribution networks. Elsevier Renew. Energy 2016, 94, 651–659. [Google Scholar] [CrossRef] [Green Version]
- Chatterjee, K.; Shankar, R.; Bhushan, R. Impact of energy storage system on load frequency control for diverse sources of interconnected power systems in deregulated power environment. Int. J. Electr. Power Energy Syst. 2016, 79, 11–26. [Google Scholar] [CrossRef]
- Sandia National Laboratories (ES-Select™ Documentation and User’s Manual). Available online: http://www.sandia.gov/ess/tools/es-select-tool/ (accessed on 4 April 2021).
- Matthiss, B.; Momenifarahani, A.; Binder, J. Storage placement and sizing in a distribution grid with high PV generation. Energies 2021, 14, 303. [Google Scholar] [CrossRef]
- Chowdhury, N.; Pilo, F.; Pisano, G. Optimal energy storage system positioning and sizing with robust optimization. Energies 2020, 13, 512. [Google Scholar] [CrossRef] [Green Version]
- Grover-Silva, E.; Girard, R.; Kariniotakis, G. Optimal sizing and placement of distribution grid connected battery systems through an SOCP optimal power flow algorithm. Elsevier Appl. Energy 2018, 219, 385–393. [Google Scholar] [CrossRef] [Green Version]
- Das, C.K.; Bass, O.; Kothapalli, G.; Mahmoud, T.S.; Habibi, D. Optimal placement of distributed energy storage systems in distribution networks using artificial bee colony algorithm. Elsevier Appl. Energy 2018, 232, 212–228. [Google Scholar] [CrossRef]
- Resch, M.; Buhler, J.; Schachler, B. Technical and economic comparison of grid supportive vanadium redox flow batteries for primary control reserve and community electricity storage in Germany. Int. J. Energy Res. 2018, 43, 337–357. [Google Scholar] [CrossRef]
- Christakou, K. A unified control strategy for active distribution networks via demand response and distributed energy storage systems. Elsevier Sustain. Energy Grids Netw. 2016, 6, 1–6. [Google Scholar] [CrossRef] [Green Version]
- Vu, D.H.; Muttaqi, K.M.; Sutanto, D. An Integrated Energy Management Approach for the Economic Operation of Industrial Microgrids Under Uncertainty of Renewable Energy. Trans. Ind. Appl. 2020, 56, 1062–1073. [Google Scholar] [CrossRef] [Green Version]
- Alshehri, J.; Khalid, M. Power Quality Improvement in Microgrids Under Critical Disturbances Using an Intelligent Decoupled Control Strategy Based on Battery Energy Storage System. IEEE Access 2019, 7, 147314–147326. [Google Scholar] [CrossRef]
- Hrishikesan, V.M.; Das, D.; Kumar, C.; Gooi, H.B.; Mekhilef, S.; Guo, X. Increasing Voltage Support Using Smart Power Converter Based Energy Storage System and Load Control. IEEE Trans. Ind. Electron. 2021, 68, 12364–12374. [Google Scholar] [CrossRef]
- Gao, T.; Jiang, L.; Liu, K.; Xiong, D.; Lin, Z.; Bu, W.; Chen, Y. Field Exploration and Analysis of Power Grid Side Battery Energy Storage System. IEEE Access 2021, 9, 63213–63218. [Google Scholar] [CrossRef]
- Zhang, Y.; Srivastava, A. Voltage Control Strategy for Energy Storage System in Sustainable Distribution System Operation. Energies 2021, 14, 832. [Google Scholar] [CrossRef]
- Battula, A.R.; Vuddanti, S.; Salkuti, S.R. Review of Energy Management System Approaches in Microgrids. Energies 2021, 14, 5459. [Google Scholar] [CrossRef]
- Noh, S.G.; Choi, W.Y.; Kook, K.S. Operating-Condition-Based Voltage Control Algorithm of Distributed Energy Storage Systems in Variable Energy Resource Integrated Distribution System. Electronics 2020, 9, 211. [Google Scholar] [CrossRef] [Green Version]
- Atif, A.; Khalid, M. Saviztky–Golay Filtering for Solar Power Smoothing and Ramp Rate Reduction Based on Controlled Battery Energy Storage. IEEE Access 2020, 8, 33806–33817. [Google Scholar] [CrossRef]
- Escoto, M.; Montagud, M.; González, N.; Belinchón, A.; Trujillo, A.V.; Romero, J.; Díaz-Cabrera, J.C.; Pellicer García, M.; Quijano López, A. Optimal Scheduling for Energy Storage Systems in Distribution Networks. Energies 2020, 13, 3921. [Google Scholar] [CrossRef]
- Sikorski, T.; Jasiński, M.; Ropuszyńska-Surma, E.; Węglarz, M.; Kaczorowska, D.; Kostyla, P.; Leonowicz, Z.; Lis, R.; Rezmer, J.; Rojewski, W.; et al. A Case Study on Distributed Energy Resources and Energy-Storage Systems in a Virtual Power Plant Concept: Technical Aspects. Energies 2020, 13, 3086. [Google Scholar] [CrossRef]
- Li, X.; Ma, R.; Gan, W.; Yan, S. Optimal Dispatch for Battery Energy Storage Station in Distribution Network Considering Voltage Distribution Improvement and Peak Load Shifting. J. Mod. Power Syst. Clean Energy 2022, 10, 131–139. [Google Scholar] [CrossRef]
- Tareen, W.U.K.; Aamir, M.; Mekhilef, S.; Nakaoka, M.; Seyedmahmoudian, M.; Horan, B.; Memon, M.A.; Baig, N.A. Mitigation of Power Quality Issues Due to High Penetration of Renewable Energy Sources in Electric Grid Systems Using Three-Phase APF/STATCOM Technologies: A Review. Energies 2018, 11, 1491. [Google Scholar] [CrossRef] [Green Version]
- Ovaskainen, M.; Öörni, J.; Leinonen, A. Superposed control strategies of a BESS for power exchange and microgrid power quality improvement. In Proceedings of IEEE International Conference on Environment and Electrical Engineering and IEEE Industrial and Commercial Power Systems Europe, Genova, Italy, 10–14 June 2019. [Google Scholar] [CrossRef]
- National Grid (The Grid Code, Issue 5, Revision 21). Available online: https://www.nationalgrid.com/sites/default/files/documents/8589935310-Complete%20Grid%20Code.pdf (accessed on 5 May 2022).
- Luo, K.; Shi, W. Comparison of Voltage Control by Inverters for Improving the PV Penetration in Low Voltage Networks. IEEE Access 2020, 8, 161488–161497. [Google Scholar] [CrossRef]


Publisher’s Note: MDPI stays neutral with regard to jurisdictional claims in published maps and institutional affiliations. |
© 2022 by the authors. Licensee MDPI, Basel, Switzerland. This article is an open access article distributed under the terms and conditions of the Creative Commons Attribution (CC BY) license (https://creativecommons.org/licenses/by/4.0/).