Article

Influence of Pulse Amplitude and Frequency on Plasma Properties of a Pulsed Low-Current High-Voltage Discharge Operated at Atmospheric Pressure

1
Institute for Plasma Technology and Mathematics, Faculty of Electrical Engineering and Information Technology, Universität der Bundeswehr München, Werner-Heisenberg-Weg 39, 85577 Neubiberg, Germany
2
Institute for Measurement and Automation Technology, Faculty of Electrical Engineering and Information Technology, Universität der Bundeswehr München, Werner-Heisenberg-Weg 39, 85577 Neubiberg, Germany
*
Author to whom correspondence should be addressed.
Appl. Sci. 2022, 12(13), 6580; https://doi.org/10.3390/app12136580
Submission received: 19 May 2022 / Revised: 23 June 2022 / Accepted: 24 June 2022 / Published: 29 June 2022
(This article belongs to the Special Issue Low-Temperature Plasma and Its Applications)

Abstract

:
Non-equilibrium conditions in plasma are often achieved by pulsed power delivery, where the pulse shape and repetition rate determine the properties of the plasma constituents and thus its chemical reactivity. The evaluation of the latter is becoming increasingly important to understand the observed effects, especially when new application fields are targeted. The composition of the plasma and the occurring chemical reactions can be calculated using various models. Thereby, the temperature of the electrons, the electron number density, as well as the heavy particle temperature are usually required as the basis of such calculations. In this work, the influence of pulse amplitude and repetition rate on these plasma parameters is determined by laser scattering for a low-current, high-voltage discharge operated with nitrogen at atmospheric pressure. In particular, the characteristic parameters regarding the plasma free electrons in such discharges have not yet been experimentally determined to this extent. The results are validated by spectroscopic measurements, i.e., the electron density is estimated from the Stark broadening of the hydrogen beta line and the heavy particle temperature is estimated by fitting the spectrum of nitrogen molecular transitions. Depending on the operating frequency, a pure nitrogen discharge with an input power of about 650 W displays an electron density between 1.7 × 10 21 m 3 and 2.0 × 10 21 m 3 with electron temperatures in the range of 40,000 K and heavy particle temperatures of about 6000 K in the core of the discharge channel. Furthermore, a relatively slow electron recombination rate in the range of 20 µs is observed.

1. Introduction

Due to their chemical reactivity and the ability to be operated with low-cost molecular gases such as nitrogen or compressed air, non-equilibrium plasmas have a wide range of applications, both in industry and science [1,2,3]. The non-equilibrium conditions, i.e., an unequal energy distribution among the plasma constituents, are realized under atmospheric pressure by pulsed energy supply, often by a pulsed low-current high-voltage discharge [1,3,4,5]. Such plasmas are used to treat different materials before bonding, printing, or painting [6,7,8,9] and to deposit different layers [10,11,12,13]. The antibacterial properties of non-equilibrium plasmas are also used and intensively explored in food and medical industries [4,14,15,16,17]. In the environmental sector, such plasmas are used to neutralize industrial waste gases by selective removal of chemical compounds [18,19,20]. In addition, possible applications to increase efficiency in the production of synthetic fuels are being explored [21,22].
The energy distribution in a plasma and the associated energy transfer to the treated surface is important [23], as it can affect the treated surface by etching or thermal modification [9] or influence the efficiency of thin film deposition [10,11] or the antibacterial effects of a plasma [4,24,25]. As pointed out by Carton et al., who deposited and analysed acrylic acid thin films using a pulsed low-current high-voltage discharge [10], an increase in plasma temperature achieved by increasing the operating frequency can be compensated by faster lateral movement of the generator to achieve similar coating efficiencies. Nevertheless, the analysis of the deposited layers revealed different chemical properties when the frequency was varied, suggesting a temperature dependence of the plasma reactivity [10]. Pulpytel et al. reported similar effects and indicated that the steep axial temperature gradient plays an important role in the chemical composition of a coating [11]. The correlation between the plasma properties, i.e., chemical composition and characteristic temperatures, and the effects observed after a treatment become observable when considering different hydrodynamic models. Usually, a two-temperature model is assumed for a non-equilibrium plasma, where the kinetic energy of electrons is described by electron temperature T e , and consequently, the kinetic energy of heavy particles, i.e., ions, atoms, molecules, and neutrals, is described by the heavy particle temperature T h , assumed to be much lower than T e for such plasmas. Dorai and Kushner developed a detailed model for plasma modification of polypropylene, emphasizing the variety of reactions occurring in the plasma and the temperature dependence of the corresponding reaction rate coefficients [26]. The temperature dependence of the rate coefficients of N 2 and O 2 dissociation and ionization reactions governed mainly by the plasma’s free electrons was further explored in the work of Tanaka et al., who developed a hydrodynamic chemical non-equilibrium model of a pulsed discharge [27]. A chemical non-equilibrium is generally related to diffusive and convective transport processes as well as radiation [28] and is more pronounced the greater the separation between the electron and heavy particle temperature [29,30], which can be expected when the plasma interacts with other non-plasma media of higher mass density (for example, a treated surface) [31]. The model presented in [27] was further developed by Tanaka into a time-dependent two-temperature chemical non-equilibrium model. According to the author, several dissociation and ionization forward reactions are governed by a different temperature than the corresponding backward reactions when both thermal and chemical non-equilibriums are taken into account [32]. This, of course, increases the complexity and computational cost of such a model [31] but also indicates the need for experimental determination of plasma parameters for validation purposes. An even deeper analysis of the influence of different temperatures (especially of the nitrogen vibrational states) on the chemistry of plasma can be found in [33].
Based on an analysis of recent research trends [2,3], the need for comprehensive characterization of non-thermal plasmas is gaining importance as new application fields are targeted, particularly in the environmental and health domains. For example, in the recently popular research topic of plasma-activated water, due to the ability of such water to inactivate biofilm contamination in food, water, and medical applications [4,17,34,35], the plasma–water interface adds complexity to the analysis of the observed effects. The reactive species generated in the gaseous plasma dissolve in the water to form long-lasting aqueous species that enhance the antibacterial activity of such a plasma-treated water [4,24,36,37]. Thereafter, as reported by Machala and his co-workers, the concentration of the reactive species in water is determined not only by the concentration of species produced in the plasma but also by the solubility coefficients determining the transport into the aqueous medium [24]. Since the production rate of reactive nitrogen and oxygen species depends on the power consumed by a discharge [24,38], and thus on the electron density and temperature [35], a thorough plasma characterization is a key element for the overall understanding of the observed effects. Another recent application for which plasma characterization seems to be important is, for example, the conversion of CO 2 into synthetic fuels [22].
A low-current, high-voltage discharge operated with nitrogen at atmospheric pressure has been characterized by the authors of this paper by means of emission spectroscopy and laser scattering recently [39,40]. In this work, different pulse frequencies and pulse current amplitudes are investigated using laser scattering diagnostics and emission spectroscopy to assess their influence on the behavior of the characteristic plasma parameters, i.e., electron density ( n e ), as well as electron ( T e ) and heavy particle ( T h ) temperatures. By synchronizing the scattering setup with the operating frequency of the plasma generator, information about the temporal progression of the characteristic values is obtained. Thereafter, the scattering results are compared with emission spectroscopy and data published for related discharge types.

2. Experimental Setup

As stated at the end of the previous section, the experimental setups used in this work are similar to those used previously in [39,40]. Thus, only a brief description of the setups is given in this work. A more detailed description can be found in these references.

2.1. Plasma System

Similarly to [39,40], a PG31 plasma generator and a PS2000 OEM power supply, both produced by Relyon Plasma GmbH, Regensburg, Germany, are used as test object. The PG31 generator has a positively biased, finger-shaped non-refractory inner electrode, and a copper alloy nozzle acting as cathode. In the experiments, a conical shaped nozzle of type A450 with an exit diameter of 4 mm is used. Furthermore, the experiments are conducted for the generator operated with pure nitrogen at a flow rate of 35 L/min, regulated by a mass flow controller of type 8626 produced by Bürkert GmbH & Co. KG, Ingelfingen, Germany. The discharge is driven by unipolar, triangular current pulses with an amplitude variable between 0.7 and 1.0 A and a repetition rate variable between 40 kHz and 65 kHz in 1 kHz steps. The rise and fall times of the pulses are thereby fixed at 5 µs after steady-state operation is reached (usually after less than a tenth of a second). A detailed description of the system can be found in [13,40].

2.2. Laser Scattering

The laser scattering setup consisted of a Nd:YAG pulse laser of type Surelite SL II-10 made by Continuum, Santa Clara, CA, USA, which was coupled with a frequency doubler of type SSP-2, also produced by Continuum, and thus is operated at a central wavelength of 532 nm [41]. To reduce the size of the setup, the laser beam is diverted by 180 with two hardfaced 50 mm mirrors and focused onto the scattering volume using a planoconvex 500 mm lens. To ensure the recording of the highest possible intensity of the scattered signal, the laser beam is polarized vertically and is perpendicular to the propagation direction of the scattered wave, while the scattering plane is chosen to be horizontal and also perpendicular to the beam polarization. Such “square” setups are recommended for plasmas with low electron densities [42] and most commonly used in experiments [43,44,45]. Thereafter, a Fastie–Ebert spectrograph with a focal length of 250 mm is chosen for the detection apparatus of the setup. The spectrograph is coupled with an intensified camera of type 4 Picos from Stanford Computer Optics, Berkeley, CA, USA, which is positioned in the image plane of the spectrometer. The components thus selected allowed the plasma parameters to be measured without changing the setup or acquisition settings, reducing the potential risk of error. A detailed description of the setup can be found in [39]. To achieve a temporal resolution, the scattering setup was synchronized with the operating frequency of the discharge, with the triggering circuitry described in the next section.

2.3. Triggering Circuitry

The analysis of a pulsed process necessitates a temporal resolution. To achieve that, the plasma generator working in a frequency range between 40 and 65 kHz has to be synchronized with a fixed laser pulse frequency of 10 Hz . To synchronize both systems, the laser is operated in the so-called direct access triggering mode [46]. Hereby, the pumping flash lamps and the Q-switch are triggered by two separate TTL level signals, and the delay between both signals is controlled externally. The required signals are generated by a pulse-delay generator of type DG645 from Stanford Research Systems, Sunnyvale, CA, USA, in combination with an ancillary triggering circuit. The synchronization is based on the process voltage, which is tapped before the plasma generator.
The triggering circuit can be divided into several stages, as depicted in Figure 1. Firstly, in order to protect the electronic components and the following equipment from interference caused by the ignition pulse of the plasma torch, the circuitry is disconnected from the power supply network with a high-voltage relay. After ignition, the relay is manually closed. The supply voltage is then divided by a resistive voltage divider, filtered and preconditioned to obtain a signal amplitude suitable for TTL logic level components. The down-scaled voltage is compared with an adjustable threshold to create TTL pulses. Thereafter, the delay time between exceeding of the threshold value and the output logic pulse can be adjusted, so that the complete period between two pulses can be sampled steplessly.
The output of the TTL logic module is used as an external trigger input of a pulse-delay generator, which runs in advanced triggering mode. In this mode, a hold-off value specifies a minimum time allowed between successive triggers, and consequently, the fixed frequency of 10 Hz required for the laser is achieved. The DG645 thus provides an output signal for the laser pumping flash lamps and a preliminary Q-switch signal, as the rising edges of the flash lamps signal and the Q-switch signal should be within about 180 µs of each other [46]. Considering this time difference and the operating frequency of the plasma system, the Q-switch signal needs to be synchronized again with the process to obtain the desired temporal resolution. Consequently, the preliminary Q-switch signal is thus logically conjugated via an AND-gatter with the input signal of the pulse-delay generator. Finally, the conjugated signal triggers the laser’s Q-switch and is also used to trigger the MCP of the ICCD camera. With the triggering setup described above, the laser pulse is synchronized with the operating frequency of the plasma generator and the plasma parameters can be estimated at any point of the current waveform.

2.4. Emission Spectroscopy

The spectroscopic setup is based on a Czerny-Turner spectrograph of type THR1000 made by Jobin-Yvon (now Horiba), Oberursel, Germany, with a focal length of 1000 mm and a diffraction grating of 1200 L/mm. The horizontally placed effluent plasma jet is projected through a 100 mm planoconvex fused silica lens onto the vertically oriented entrance slit. Similar to the scattering setup, the same intensified camera of type 4 Picos is used as a detector placed in the imaging plane of the spectrograph. In this work, the camera is triggered at peak current by the circuit described in the section above (exactly by the “out A” output of the pulse-delay generator). The electron density n e is estimated from the linear Stark effect after recording the hydrogen beta line at 486.13 nm . The following equation, given in [47], is used for the estimation:
FWHA [ nm ] = 1.666 n e [ m 3 ] 10 23 0.68777 .
The heavy particle temperature, on the other hand, is determined by fitting the synthetic spectra to the measured spectra of the C 3 Π u B 3 Π g transition for the excited nitrogen molecule and of the B 2 Σ u + X 2 Σ g + transition for the ionized nitrogen molecule. For more details on the spectroscopic setup and data evaluation, it should be referred to [40].

3. Results

According to the initial scattering results presented in [39], the radial distribution of the estimated electron parameters ( n e , T e ) does not change significantly within the analyzed radial range ( ± 0.7 mm from plasma jet axis), so that an average value of n e and T e from this range is calculated for each measurement for the sake of clarity. The T h value is also averaged; however, only values within the plateau around the jet axis (see Figure 4 in [39] for further details) are used for the calculation. Thereafter, at least three scattering measurements are performed for each set of parameters. Hence, the values n ¯ e , T ¯ e and T ¯ h compared in the following of this section represent an average of all measurements taken at a particular parameter set. Similarly to this, the spectroscopic results also represent an average of at least three measurements for each axial position and parameter set.

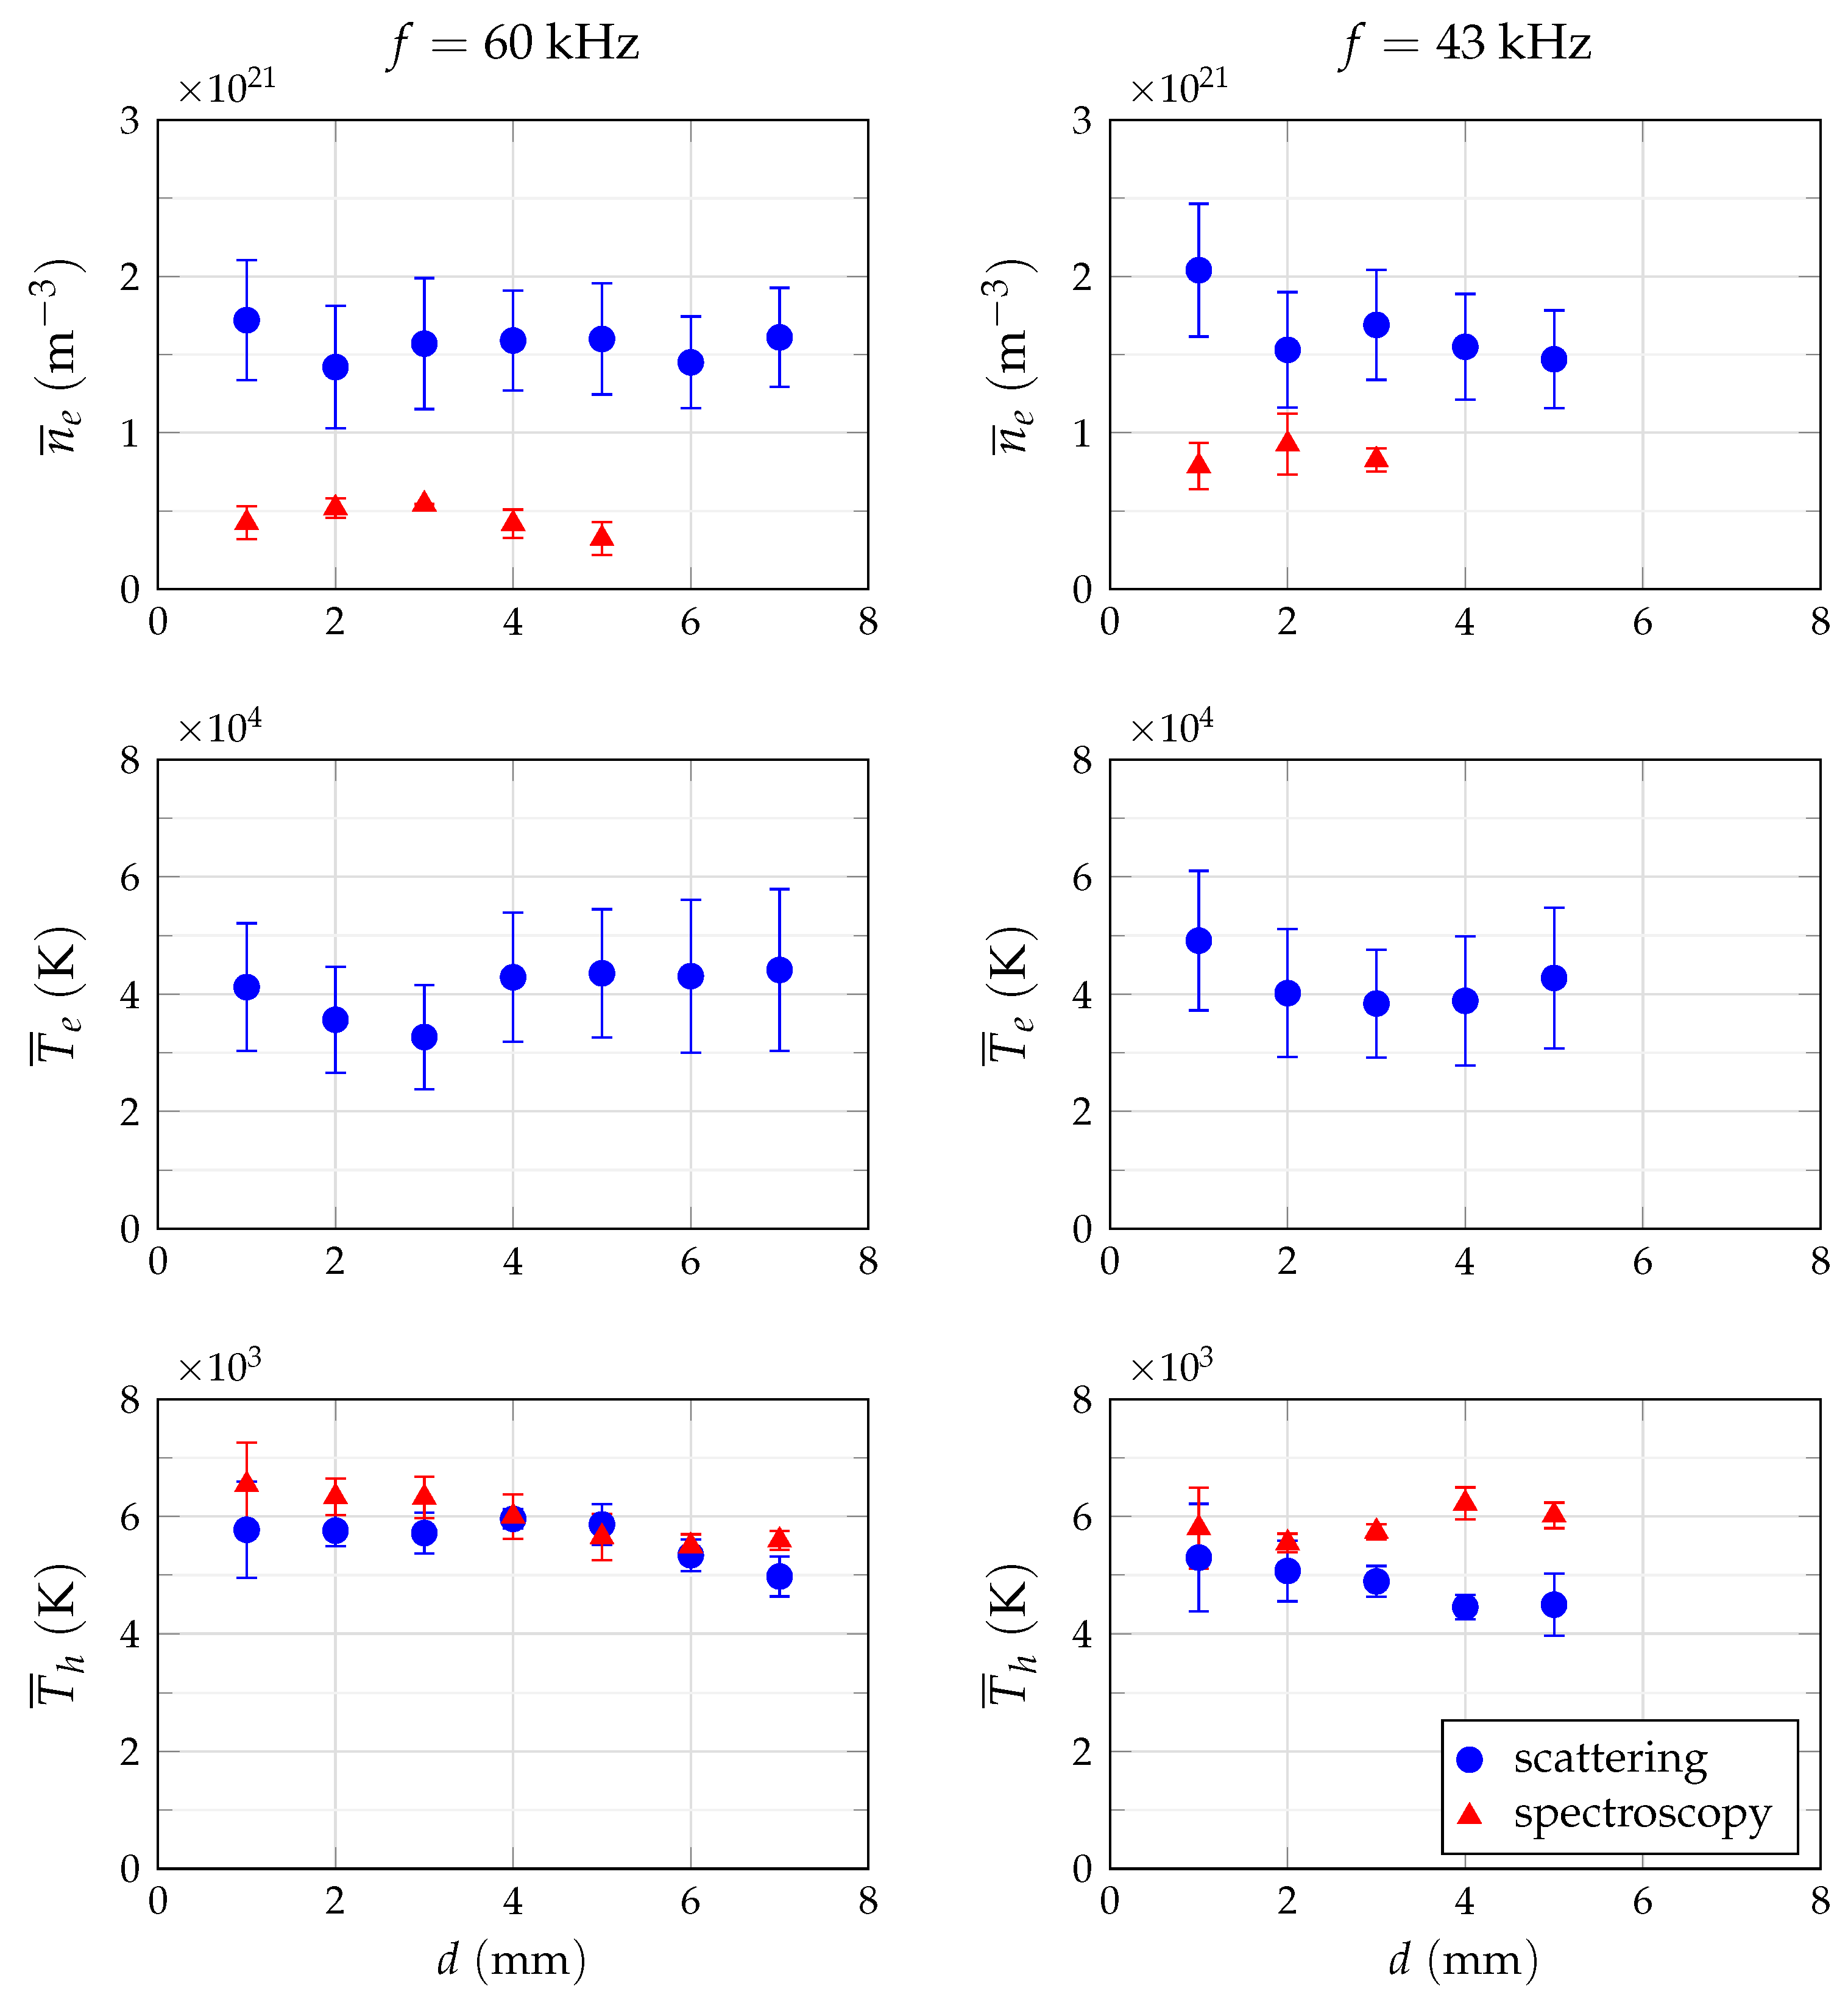
3.1. Spatial Distribution of the Plasma Parameters

The average values of n ¯ e , T ¯ e and T ¯ h are presented in Figure 2 for different axial distances d from the nozzle outlet. Thereby, the values estimated for the discharge pulsed at a frequency of 60 kHz are presented on the left-hand side of Figure 2, whereas the values determined for 43 kHz are shown on the right-hand side. Additionally, the spectroscopic results for both frequencies are also presented in Figure 2. In both cases, the experimental setups are triggered at the peak current (see Figure 3) with the current amplitude set to ∼ 1 A (i.e., a power setting of 100 % ).
According to the results, a higher electron density of 2.0 × 10 21 m 3 is obtained for the lower operating frequency of 43 kHz at a distance of 1 mm . At the same distance, a slightly lower mean density of 1.7 × 10 21 m 3 is reached for the higher frequency of 60 kHz . The difference is, however, present only in the immediate vicinity of the nozzle exit. The electron densities estimated for 2 mm and 3 mm are only marginally higher for the slower pulsed process and, similar to the data points further downstream, can be assumed to be constant at about 1.5 × 10 21 m 3 when the standard deviation is taken into account. In contrast, the spectroscopically estimated electron number densities increase insignificantly in the axial direction up to about 3 mm downstream from nozzle exit when operating at 60 kHz . However, after consideration of the measurement error, the density can be assumed to be constant at 0.52 × 10 21 m 3 for distances d < 3 mm . Thereafter, the values decrease for larger distances from nozzle outlet. The axial distribution of n e determined for the lower working frequency of 43 kHz , presented on the right-hand side in Figure 2, displays a similar character as for 60 kHz with maximal values measured at a distance of 2 mm . After consideration of the measurement error, an almost twice as high mean electron density of 0.95 × 10 21 m 3 is obtained in the analyzed distance range for the lower pulse repetition rate.
The progression of the axial distribution of the electron temperature in the downstream direction is somewhat different. The values decrease for both frequencies at a rate of approx. 10%/mm up to a distance of 3 mm . Throughout this distance range, the electron temperatures estimated for the lower operating frequency are about 15% higher than for 60 kHz . Thereafter, T ¯ e reaches about 43,000 K in both cases and can be assumed to be constant up to 7 mm for the higher frequency.
The temperature of heavy particles, on the contrary, is higher for the higher working frequency over the entire range of distance studied. It should be also noted that the T ¯ h values vary only insignificantly around 5900 K up to 5 mm for the higher and around 5200 K up to 3 mm for the lower frequency. The values start to decrease slowly from there on in both analyzed cases. As can be seen in the last row of Figure 2, the temperatures of heavy particles obtained by synthetic spectra fitting are almost identical to those estimated by laser scattering for the higher frequency. In the other case studied, the spectroscopically estimated temperatures are higher than the scattering estimates, but the absolute values are lower than the values determined for 60 kHz .
To assess the temperature of heavy particles at larger downstream distances, further measurements are undertaken for the discharge pulsed at 60 kHz . A full spatial distribution of T h up to a distance of 17 mm from nozzle outlet is shown in Figure 4. The distribution can be roughly divided into two zones: a 8 mm long inner finger-shaped zone with a diameter of about 0.5 mm and an almost constant core temperature of 5900 K up to 5 mm and a 12 mm long, 1 mm in diameter zone with a temperature around 3000 K . For further distances, the temperature value drops to 1000 K .

3.2. Temporal Evolution of the Plasma Parameters

The circuitry described in Section 2.3 allows triggering the laser scattering setup at different points of time of a current pulse. By doing so, the temporal evolution of the plasma parameters is assessed. The parameters are examined at four trigger timeframes stretching across a current pulse, as depicted in the upper left diagram in Figure 3. No exact trigger time points can be defined, since the plasma system operates without a control loop, which implies fluctuations in plasma and thus in the tapped electrical signals. Accordingly, the width of the timeframes in Figure 3 illustrates approximately the small jitter of the trigger time point.
The temporal distribution is analyzed for both operating frequencies at an axial distance of 1 mm from nozzle exit and a pulse current amplitude of ∼ 1 A . Similarly to the analysis of the axial distribution in the previous section, the results presented in Figure 3 are averages calculated from the full radial range of several measurements.
For a pulse frequency of 60 kHz , the amplitudes of the plasma parameters follow the current trajectory, i.e., the maximum value of 1.7 × 10 21 m 3 is reached for the peak current timeframe I p e a k . From there, the electron density follows the current trajectory with an almost linear decrease from the current peak towards the rising edge of the next current pulse. Here, an almost 24 % reduction is observed compared to the maximal n ¯ e value. A similar behavior is observed for the mean electron temperature T ¯ e at 60 kHz , although the values remain unchanged at the current minimum ( I v a l l e y ) after an initial reduction of 5 % for the falling edge. Again, the lowest mean temperature, which is about 15 % lower than at I p e a k , is estimated for the rising current edge. Looking at the mean heavy particle temperature T ¯ h , an almost linear decrease is observed from I p e a k towards the current minimum, where the temperature is reduced by about 15 % . The lowest temperature of approx. 4800 K is estimated for the rising edge of the following current edge, giving a reduction of 18 % when compared to the highest value at I p e a k .
The behavior of the plasma parameters estimated for the lower operating frequency of 43 kHz does not correlate so well with the current trace as before. According to the results in Figure 3, only the mean electron number density follows the current progression with a maximal value of 2.0 × 10 21 m 3 reached at the current peak when the process is pulsed with 43 kHz . Thereafter, the electron density decreases about 10 % while the current is falling towards the minimal current value I v a l l e y . The n ¯ e values recorded for the rising edge are almost identical to those estimated for I v a l l e y and almost 15 % lower than for peak current. The mean electron temperature on the other hand behaves differently with the highest value of 53,000 K registered for the rising edge of the current pulse, about 10 % higher than for peak current. The temperature decreases by a further 10 % for the remaining two timeframes. In addition, the T ¯ h values progress differently than at 60 kHz . The highest heavy particle temperature of almost 5900 K registered for the falling current edge, over 10 % higher than at I p e a k . A 5 % lower temperature is recorded for the current minimum I v a l l e y when compared to the value estimated for I p e a k and does not change while the current is rising, showing somewhat similar behavior to n ¯ e for these two timeframes.

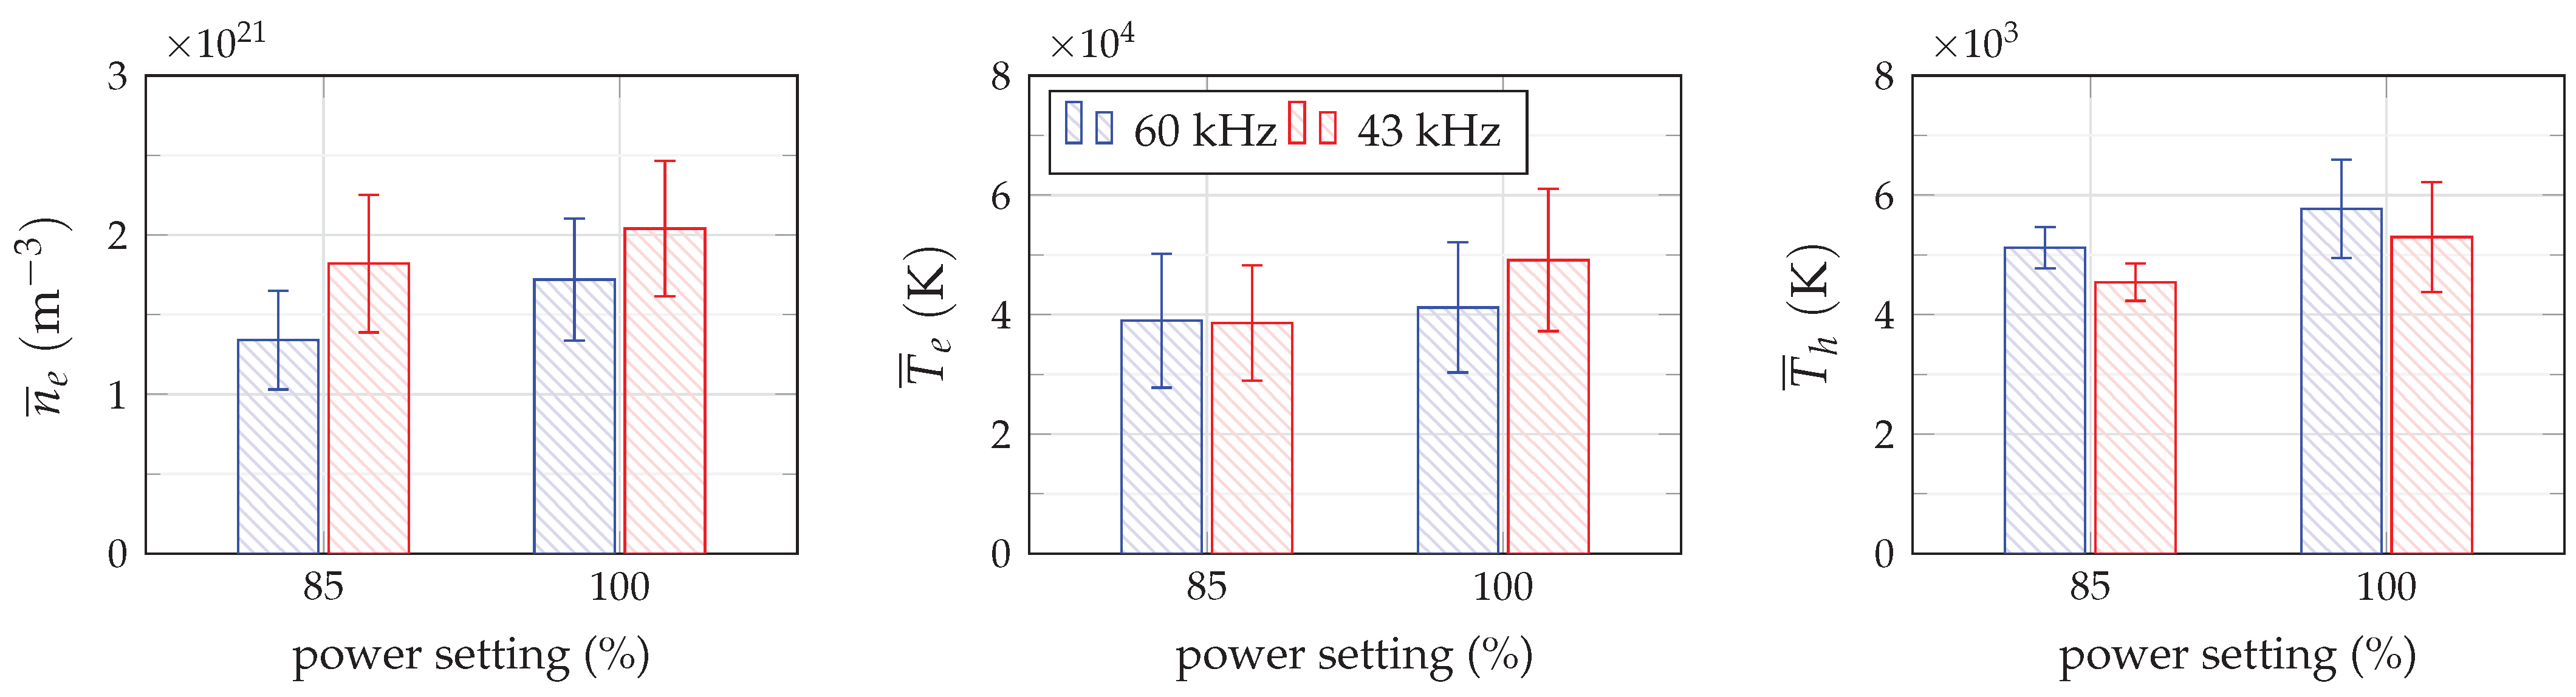
3.3. Influence of the Amplitude of the Excitation Pulses

Apart from the frequency, the power supply allows for an adjustment of the output amplitude of the current pulses. Thus, an attempt is made to evaluate the distribution of the plasma parameters for different pulse amplitudes as well. More precisely, two power settings, 85 % and 100 % , are compared, which correlate to current amplitudes of ∼ 0.85 A and ∼ 1.0 A , respectively. The trigger timeframe is set to I p e a k and the distance from the nozzle to 1 mm . As before, the results compiled in Figure 5 represent averages of at least three measurements calculated according to the description at the beginning of this section.
By reducing the pulse amplitude from 100 % to 85 % the mean electron number density decreases regardless the operating frequency, although a much more significant reduction of over 20 % is observed when the discharge current is pulsed with 60 kHz . The reduction of n ¯ e for the lower operating frequency is in the range of about 10 % . Interestingly, contrary to n ¯ e , no change in mean electron temperature is observed when the amplitude is changed at 60 kHz , while it decreases by about 20 % when operating at 43 kHz . In addition, a change in the current amplitude at the output of the power source entails a reduction in the average temperatures of heavy particles, almost 10 % for a working frequency of 60 kHz and 14 % for a frequency of 43 kHz . Moreover, it should be noted that the estimated T ¯ h values are higher when operating at 60 kHz for both power settings.

4. Discussion

The characteristic parameters of the free electrons in pulsed low-current high-voltage discharges have not yet been determined experimentally to this extent in previously published works. Therefore, the results obtained with the laser scattering technique are firstly compared with estimates based on spectroscopic measurements. Variations in plasma parameters due to changes in pulse amplitude or repetition rate are discussed thereafter.

4.1. Validity of Results

The results achieved with laser scattering are considered to be plausible, according to the comparison with previously published works given in [39]. Furthermore, the results of laser scattering and emission spectroscopy can be considered to be in good agreement, although discrepancies are observed in absolute values between the two diagnostic techniques. The values are of the same order of magnitude and show similar trends for both electron number density and temperature of heavy particles. With both diagnostic methods, higher n ¯ e and lower T ¯ h values are obtained for the lower operating frequency of 43 kHz . The differences in the electron densities determined by the scattering experiment between the two frequencies studied are much more subtle than those estimated by means of spectroscopy. Furthermore, the spectroscopically determined number densities are only half or even only a third as large as the corresponding values determined by laser scattering (compared to each other at the same frequency).
The discrepancy between the n e values might be related to the evaluation methodology of the Stark broadening, as indicated in [48]. According to [40], the Stark effect can be approximated with two limiting cases, the linear and the quadratic case. The approximation formula given in [47], used by most authors [48,49,50] and also used in this work, is derived for the linear case, in which the line broadening is proportional to ∼ n e 2 / 3 [51]. Such a linear method assumes a non-spherically symmetric distribution of electrons within an atom, i.e., that the emitting atom already displays a dipole moment, and that the free electrons act collectively. In contrast, the quadratic Stark effect assumes a sequence of two consecutive interactions between the atom and the free plasma electrons. The first interaction “deforms” an initially spherical symmetric atom inducing a short-lived dipole moment, while the second interaction with another free electron is responsible for the eventual emission of radiation by the atom. As a consequence, the line broadening is directly proportional (in a good first approximation) to ∼ n e [51]. However, if the effects occurring in the analyzed plasma correspond to an intermediate situation between both limiting approximations, for example, due to the complicated ionization process of nitrogen plasmas in non-equilibrium, then the estimation of n e is more complex, and the values cannot be calculated directly with the approximation formula corresponding to the linear case. This may be the reason for the difference between the n e values determined spectroscopically and by the scattering experiment. However, the observed discrepancy may also be caused by a different effect. To estimate the electron density, a commercially available canister of a nitrogen mixture with a small addition of hydrogen (1 vol.%) is used as the plasma gas. Although the gas is already premixed, segregation effects of the gas components can occur in a plasma, as reported, for example, in [52,53]. The transient nature of a pulsed discharge, where the energy pulses lead to the creation of pressure waves [5,54], can amplify the demixing effect. Thus, the hydrogen may not be homogeneously distributed in the measurement volume, leading to the observed differences between the two diagnostic methods. Nonetheless, as mentioned above, the values shown in Figure 2 are of the same order of magnitude and, more importantly, show the same trends, which appears to be a sufficient validation of the laser scattering results in combination with temperatures determined from molecular transitions.

4.2. Temporal Evolution of the Estimated Plasma Parameters

The scattering results show that slightly lower T h values are observed when either the frequency or the power setting is reduced (see Figure 2 and Figure 5). According to theoretical models of Lu [55] as well as Naidis [56], the gas temperature in pulsed discharges is associated with the dissipated power rather than the separate behavior of voltage or current. Naidis, who modeled nanosecond pulsed spark discharges in air, discussed two case studies in [56] and observed no significant difference in the heavy particle temperature. In the first case, the discharge was pulsed at a frequency of 30 kHz . In the second case, the frequency was reduced to 15 kHz , but the pulse duration was doubled so that the input power was similar in both cases. Assuming that the power supply delivers a nearly equal electric charge and thus also a similar energy amount into the system with each single current pulse, then a higher power is dissipated in the plasma generator with increased frequency, since, with a faster repetition of similar pulses, the power transferred to the discharge increases (under the above assumption). Such an increase for higher pulse repetition rates is measured at the exit of the power supply. Although a slower response of T h to steeper current slopes can be observed in the temporal distribution of the mean plasma parameters (see Figure 3), this does not have a significant effect on the mean temperature. Thereafter, the above statement that the heavy particle temperature depends mainly on the dissipated power can be confirmed experimentally for the analyzed system.
The effect of a delayed response of heavy particles to input power changes (particularly visible for 43 kHz in Figure 3) was observed by several research groups. An increase in the heavy particle temperature of a gliding arc discharge was observed by Gutsol et al. while the current and power decreased at the same time [57]. A possible explanation for this “memory effect”, as called by Gutsol et al., is provided by Janda et al. [58]. According to their observations, the effect is connected with the exchange of rotational and vibrational energy of molecular species leading to additional heating of heavy particles. Furthermore, taking into consideration that recombination reactions in nitrogen plasmas can occur on timescales of hundreds of microseconds or even milliseconds [5,59,60], this energy exchange can lead to a possible accumulation of various charged species in the discharge channel if the discharge is operated at sufficiently high frequencies (as is the case in this work). This can lead to the appearance of a space charge field that has to be first overcome by the external electric field of the next pulse [58]. Similar considerations on the influence of the heavy particle temperature and gas flow on the discharge behavior can be found in [61,62,63]. According to the above discussion, the effect observed in Figure 3, the fact that a higher gas temperature is measured even though the current is already decreasing is attributed to such a “memory effect”.
The parameters estimated in this work for the plasma free electrons are relatively insensitive to fast changes of the discharge current (see Figure 3 and Figure 5). According to a theoretical model of a low-current DC discharge developed by Benilov and Naidis [64], a reduction in electron density by about one order of magnitude can be expected when the current value decreases from amperes to milliamperes (see upper left plot in Figure 3). This reduction is attributed by the authors to a change in the ionization rate. Hence, for lower current values, for which non-LTE conditions are assumed, higher values of the reduced electric field are expected, and thus the ionization rate of neutral particles is mainly controlled by the electron impact. For higher currents, for which LTE conditions are assumed by the authors, lower E / n and higher T h values are expected; hence, the excitation process leading to ionization is reported to be controlled instead by associative ionization of metastable states [64]. A comparable statement can be found in the works of Akishev et al., who reported that the excitation and de-excitation rates of nitrogen electronic states change with increasing temperature of heavy particles [65,66]. While the excitation of the ground state X 1 Σ g + is mainly governed by electron impact, the excitation of metastables such as A 3 Σ u + to higher energy states as well as most de-excitation reactions are caused by collisions with other heavy particles. Thus, according to Akishev et al., for low E / n values the resulting free electrons are predominantly provided by associative ionization of following states:
N 2 A 3 Σ u + + N 2 a 1 Σ u N 4 + + q e , N 2 a 1 Σ u + N 2 a 1 Σ u N 4 + ( X ) + q e ,
although both initial states, A 3 Σ u + and a 1 Σ u , have been mutually formed by collisions with electrons.
Naidis developed further the mathematical models presented in [64] and performed calculations for nanosecond repetitively pulsed sparks operated in air [56]. The initial pulse conditions were adopted from experiments with a voltage amplitude of 5 kV , a pulse length of 5 ns and repetition rate of 30 kHz . According to the simulated results, the number density decreases after a pulse due to electron–ion recombination with a characteristic time constant of approximately 30 µs. Electron recombination times in a similar range of about 10 µs are also reported by Kruger et al. [67]. A slow recombination rate of electrons is furthermore observed by Orrière et al. while investigating a nanosecond pulsed microgap discharge operated in air at a frequency of 8 kHz [68]. Similarly to others, the researchers postulated that the slower-than-expected recombination rate may originate from a combination of associative and stepwise ionization processes during the recombination phase. Moreover, they suggest that a high density of excited nitrogen atoms may also play a significant role in slowing down the recombination of free electrons [68].
The correlation of the above discussion with the experimental results obtained in this work suggests that the excitation and de-excitation processes of heavy particles may be responsible not only for the “memory effect” but also for the relatively slow decay of electron parameters observed here (especially since the plasma generator operates at pulse repetition rates comparable to those of electron recombination). Hence, when the current is rising, the excitation and dissociation of nitrogen molecules is mainly caused by electron collisions. Both electron density and electron temperature increase with increasing current and energy is transferred to heavy particles. After a pulse, the reduction in the electron density does not immediately follow the current trajectory due to complex de-excitation reactions, which slow down the recombination rate of free plasma electrons. This maintains a relative high electron density and may lead to the formation of further electrons, even during a phase of low current.
The above hypothesis may also explain the difference in the electron parameters observed for both frequencies. As shown in Figure 2, a higher electron density and higher electron temperature are measured for the lower operating frequency of 43 kHz . At this frequency, however, a lower power is coupled into the generator, as discussed above. Furthermore, nitrogen is a plasma gas whose recombination displays a somewhat slower rate due to de-excitation channels consisting of several steps. The resulting recombination time scale at atmospheric pressure thus happens to be in the same order of magnitude as the considered pulse repetition period (∼ 23 µs for 43 kHz and ∼ 17 µs for 60 kHz ). If a recombination time of ∼ 20 µs is assumed, a slight change in the repetition rate of the pulsed excitation can strongly influence the ionization degree. Accordingly, if the repetition period is shorter than the recombination time scale, each current pulse excitation encounters a plasma channel, which is not yet fully neutralized and whose still-charged ions may strongly disturb and hinder the acceleration of the free electrons, making any collision less efficient for an eventual ionization. As a result, the higher repetition rate of 60 kHz leads to a plasma with a lower ionization than in the case of the 43 kHz pulse repetition rate.

5. Conclusions

The main objective of this work has been to experimentally determine the influence of different operating conditions, i.e., pulse frequencies and pulse current amplitudes, on the relevant plasma parameters, in particular the electron number density and the electron temperature of a pulsed low-current, high-voltage discharge operated at atmospheric pressure. No information on these values could be found in published works so far. According to these results, depending on the operating frequency, an electron density between 1.7 × 10 21 m 3 and 2.0 × 10 21 m 3 with electron temperatures in the range of 40,000 K can be expected for a pure nitrogen discharge operated at atmospheric pressure. A heavy particle temperature of about 6000 K is reached in the core of the discharge channel, with the values decreasing further downstream on the axis of the effluent plasma jet from 4000 K to 2000 K at typical treatment distances of 10– 15 mm from the nozzle outlet. Due to the complex nature of the de-excitation processes of nitrogen, relatively slow electron recombination rates are observed, and thus the once ionized channel does not extinguish between consecutive pulses at the considered pulse frequencies of 43 kHz and 60 kHz but rather undergoes a transition from a glow discharge to a spark with each current pulse. The observed influence of the temporal changes of the excitation current on the estimated plasma parameters is slightly less than 20 % . Based on the obtained findings, the hypothesis that the temperature of heavy particles is determined by dissipated power, while the electron parameters, and therefore, to some extent, the chemical reactivity of the plasma, are defined by the shape of the excitation pulse could be confirmed for this type of discharge. Furthermore, a coupling of the pulse shape and frequency with the resulting plasma properties is now possible.
In conclusion, the results obtained in this work contribute significantly to the understanding of pulsed low-current discharges operated at atmospheric pressure. The presented results facilitate the development and validation of a computational model, which can be based on one of the existing works [26,30,32] and may provide a more accurate chemical description of the plasma composition. With this knowledge, such discharges can be better adapted to specific applications in industrial or experimental environments, such as chemical vapor deposition, the plasma-activation of liquids, CO 2 reforming, or, in general, applications with more stringent plasma chemistry requirements.

Author Contributions

Conceptualization, M.S., G.F. and J.S.; methodology, M.S., G.F. and J.-L.M.-L.; software, M.S. and G.F.; validation, M.S. and J.-L.M.-L.; formal analysis, J.-L.M.-L. and J.S.; investigation, M.S.; resources, M.S. and G.F.; data curation, M.S., G.F. and J.-L.M.-L.; writing—original draft preparation, M.S.; writing—review and editing, J.-L.M.-L. and J.S.; visualization, M.S.; supervision, J.S.; project administration, M.S.; funding acquisition, J.S. All authors have read and agreed to the published version of the manuscript.

Funding

This research received no external funding.

Institutional Review Board Statement

Not applicable.

Informed Consent Statement

Not applicable.

Data Availability Statement

Not applicable.

Acknowledgments

The publication of this manuscript was financially supported by Universität der Bundeswehr München.

Conflicts of Interest

The authors declare no conflict of interest.

References

  1. Bogaerts, A.; Neyts, E.; Gijbels, R.; van der Mullen, J.J.A.M. Gas discharge plasmas and their applications. Spectrochim. Acta B 2002, 57, 609–658. [Google Scholar] [CrossRef]
  2. Kim, Y. Exploring emerging technologies with analysis of bibliographic data focused on plasma surface treatment. Coatings 2021, 11, 1291. [Google Scholar] [CrossRef]
  3. Weltmann, K.D.; Kolb, J.F.; Holub, M.; Uhrlandt, D.; Šimek, M.; Ostrikov, K.K.; Hamaguchi, S.; Cvelbar, U.; Černák, M.; Locke, B.; et al. The future for plasma science and technology. Plasma Process. Polym. 2019, 16, 1800118. [Google Scholar] [CrossRef] [Green Version]
  4. Aggelopoulos, C.A. Recent advances of cold plasma technology for water and soil remediation: A critical review. Chem. Eng. J. 2022, 428, 131657. [Google Scholar] [CrossRef]
  5. Bruggeman, P.J.; Iza, F.; Brandenburg, R. Foundations of atmospheric pressure non-equilibrium plasmas. Plasma Sources Sci. Technol. 2017, 26, 123002. [Google Scholar] [CrossRef] [Green Version]
  6. Dowling, D.P.; O’Neill, F.T.; Langlais, S.J.; Law, V.J. Influence of a DC pulsed atmospheric pressure plasma jet processing conditions on polymer activation. Plasma Process. Polym. 2011, 8, 718–727. [Google Scholar] [CrossRef] [Green Version]
  7. Jofre-Reche, J.A.; Pulpytel, J.; Arefi-Khonsari, F.; Martín-Martínez, J.M. Increased adhesion of polydimethylsiloxane (PDMS) to acrylic adhesive tape for medical use by surface treatment with an atmospheric pressure rotating plasma jet. J. Phys. D Appl. Phys. 2016, 49, 334001. [Google Scholar] [CrossRef]
  8. Kehrer, M.; Rottensteiner, A.; Hartl, W.; Duchoslav, J.; Stehrer, T.; Stifter, D. Cold atmospheric pressure plasma treatment for adhesion improvement on polypropylene surfaces. Surf. Coat. Technol. 2020, 403, 126389. [Google Scholar] [CrossRef]
  9. Noeske, M.; Degenhardt, J.; Strudthoff, S.; Lommatzsch, U. Plasma jet treatment of five polymers at atmospheric pressure: Surface modifications and the relevance for adhesion. Int. J. Adhes. Adhes. 2004, 24, 171–177. [Google Scholar] [CrossRef]
  10. Carton, O.; Ben Salem, D.; Bhatt, S.; Pulpytel, J.; Arefi-Khonsari, F. Plasma polymerization of acrylic acid by atmospheric pressure nitrogen plasma jet for biomedical applications. Plasma Process. Polym. 2012, 9, 984–993. [Google Scholar] [CrossRef]
  11. Pulpytel, J.; Kumar, V.; Peng, P.; Micheli, V.; Laidani, N.; Arefi-Khonsari, F. Deposition of organosilicon coatings by a non-equilibrium atmospheric pressure plasma jet: Design, analysis and macroscopic scaling law of the process. Plasma Process. Polym. 2011, 8, 664–675. [Google Scholar] [CrossRef]
  12. Köhler, R.; Sauerbier, P.; Militz, H.; Viöl, W. Atmospheric pressure plasma coating of wood and MDF with polyester powder. Coatings 2017, 7, 171. [Google Scholar] [CrossRef] [Green Version]
  13. Korzec, D.; Nettesheim, S. Application of a pulsed atmospheric arc plasma jet for low-density polyethylene coating. Plasma Process. Polym. 2020, 17, 1900098. [Google Scholar] [CrossRef]
  14. Dobeic, M.; Vadnjal, S.; Bajc, Z.; Umek, P.; Pintarič, S.; Uranjek, I.; Gačnik, K.Š. Antibacterial properties of a non-thermal, atmospheric, Openair®, plasma jet in surface decontamination of eggs in shell. Slov. Vet. Res. 2016, 53, 29–41. [Google Scholar]
  15. Szulc, M.; Schein, S.; Schaup, J.; Schein, J.; Zimmermann, S. Suitability of thermal plasmas for large-area bacteria inactivation on temperature-sensitive surfaces—First results with Geobacillus stearothermophilus spores. J. Phys. Conf. Ser. 2017, 825, 012017. [Google Scholar] [CrossRef] [Green Version]
  16. Wiegand, C.; Beier, O.; Horn, K.; Pfuch, A.; Tölke, T.; Hipler, U.C.; Schimanski, A. Antimicrobial impact of cold atmospheric pressure plasma on medical critical yeasts and bacteria cultures. Skin Pharmacol. Physiol. 2014, 27, 25–35. [Google Scholar] [CrossRef]
  17. Tan, J.; Karwe, M.V. Inactivation and removal of Enterobacter aerogenes biofilm in a model piping system using plasma-activated water (PAW). Innov. Food Sci. Emerg. Technol. 2021, 69, 102664. [Google Scholar] [CrossRef]
  18. Chen, B.; Zhu, C.; Chen, L.; Fei, J.; Gao, Y.; Wen, W.; Shan, M.; Ren, Z. Atmospheric pressure plasma jet in organic solution: Spectra, degradation effects of solution flow rate and initial pH value. Plasma Sci. Technol. 2014, 16, 1126. [Google Scholar] [CrossRef] [Green Version]
  19. Dowling, D.P.; Stallard, C.P. Achieving enhanced material finishing using cold plasma treatments. Trans. IMF 2015, 93, 119–125. [Google Scholar] [CrossRef]
  20. Urashima, K.; Chang, J.S. Removal of volatile organic compounds from air streams and industrial flue gases by non-thermal plasma technology. IEEE Trans. Dielectr. Electr. Insul. 2000, 7, 602–614. [Google Scholar] [CrossRef]
  21. Iwarere, S.; Rohani, V.; Ramjugernath, D.; Fabry, F.; Fulcheri, L. Hydrocarbons synthesis from syngas by very high pressure plasma. Chem. Eng. J. 2014, 241, 1–8. [Google Scholar] [CrossRef]
  22. Snoeckx, R.; Bogaerts, A. Plasma technology—A novel solution for CO2 conversion? Chem. Soc. Rev. 2017, 46, 5805–5863. [Google Scholar] [CrossRef] [PubMed] [Green Version]
  23. Dowling, D.P.; Donegan, M.; Cullen, P.J.; Law, V.J.; Milosavljevic, V. Importance of plasma thermal energy transfer for plasma jet systems. IEEE Trans. Plasma Sci. 2014, 42, 2426–2427. [Google Scholar] [CrossRef]
  24. Machala, Z.; Tarabová, B.; Sersenová, D.; Janda, M.; Hensel, K. Chemical and antibacterial effects of plasma activated water: Correlation with gaseous and aqueous reactive oxygen and nitrogen species, plasma sources and air flow conditions. J. Phys. D Appl. Phys. 2019, 52, 034002. [Google Scholar] [CrossRef]
  25. Pawłat, J.; Terebun, P.; Kwiatkowski, M.; Tarabová, B.; Koval’ová, Z.; Kučerová, K.; Machala, Z.; Janda, M.; Hensel, K. Evaluation of oxidative species in gaseous and liquid phase generated by mini-gliding arc discharge. Plasma Chem. Plasma Process. 2019, 39, 627–642. [Google Scholar] [CrossRef] [Green Version]
  26. Dorai, R.; Kushner, M.J. A model for plasma modification of polypropylene using atmospheric pressure discharges. J. Phys. D Appl. Phys. 2003, 36, 666–685. [Google Scholar] [CrossRef]
  27. Tanaka, Y.; Michishita, T.; Uesugi, Y. Hydrodynamic chemical non-equilibrium model of a pulsed arc discharge in dry air at atmospheric pressure. Plasma Sources Sci. Technol. 2005, 14, 134–151. [Google Scholar] [CrossRef]
  28. Baeva, M. Thermal and chemical nonequilibrium effects in free-burning arcs. Plasma Chem. Plasma Process. 2016, 36, 151–167. [Google Scholar] [CrossRef]
  29. Baeva, M. A survey of chemical nonequilibrium in argon arc plasma. Plasma Chem. Plasma Process. 2017, 37, 513–530. [Google Scholar] [CrossRef]
  30. Teulet, P.; Sarrette, J.P.; Gomes, A.M. Collisional-radiative modelling of one- and two-temperature air and air-sodium plasmas at atmospheric pressure with temperatures of 2000–12000 K. J. Quant. Spectrosc. Radiat. Transf. 2001, 70, 159–187. [Google Scholar] [CrossRef]
  31. Trelles, J.P. Nonequilibrium phenomena in (quasi-)thermal plasma flows. Plasma Chem. Plasma Process. 2020, 40, 727–748. [Google Scholar] [CrossRef]
  32. Tanaka, Y. Time-dependent two-temperature chemically non-equilibrium modelling of high-power Ar-N2 pulse-modulated inductively coupled plasmas at atmospheric pressure. J. Phys. D Appl. Phys. 2006, 39, 307–319. [Google Scholar] [CrossRef]
  33. Yu, L.; Pierrot, L.; Laux, C.O.; Kruger, C.H. Effects of vibrational nonequilibrium on the chemistry of two-temperature nitrogen plasmas. Plasma Chem. Plasma Process. 2001, 21, 483–503. [Google Scholar] [CrossRef]
  34. Mai-Prochnow, A.; Zhou, R.; Zhang, T.; Ostrikov, K.K.; Mugunthan, S.; Rice, S.A.; Cullen, P.J. Interactions of plasma-activated water with biofilms: Inactivation, dispersal effects and mechanisms of action. NPJ Biofilms Microbiomes 2021, 7, 11. [Google Scholar] [CrossRef] [PubMed]
  35. Zeghioud, H.; Nguyen-Tri, P.; Khezami, L.; Amrane, A.; Assadi, A.A. Review on discharge plasma for water treatment: Mechanism, reactor geometries, active species and combined processes. J. Water Process. Eng. 2020, 38, 101664. [Google Scholar] [CrossRef]
  36. Ikawa, S.; Tani, A.; Nakashima, Y.; Kitano, K. Physicochemical properties of bactericidal plasma-treated water. J. Phys. D Appl. Phys. 2016, 49, 425401. [Google Scholar] [CrossRef]
  37. Xu, Z.; Zhou, X.; Yang, W.; Zhang, Y.; Ye, Z.; Hu, S.; Ye, C.; Li, Y.; Lan, Y.; Shen, J.; et al. In vitro antimicrobial effects and mechanism of air plasma-activated water on Staphylococcus aureus biofilm. Plasma Process. Polym. 2020, 17, 1900270. [Google Scholar] [CrossRef]
  38. Gupta, T.T.; Ayan, H. Application of non-thermal plasma on biofilm: A review. Appl. Sci. 2019, 9, 3548. [Google Scholar] [CrossRef] [Green Version]
  39. Szulc, M.; Forster, G.; Marques, J.L.; Schein, J. A simple and compact laser scattering setup for characterization of a pulsed low-current discharge. Appl. Sci. 2022. to be published. [Google Scholar]
  40. Szulc, M.; Forster, G.; Marques, J.L.; Schein, J. Spectroscopic characterization of a pulsed low-current high-voltage discharge operated at atmospheric pressure. Appl. Sci. 2022, 12, 6366. [Google Scholar] [CrossRef]
  41. Continuum. Specification of Surelite I, II, III Series; 2002. Available online: https://amplitude-laser.com/wp-content/uploads/2019/03/Surelite-I-II-III_ref-d_BD.pdf (accessed on 13 March 2022).
  42. Kempkens, H.; Uhlenbusch, J. Scattering diagnostics of low-temperature plasmas (Rayleigh scattering, Thomson scattering, CARS). Plasma Sources Sci. Technol. 2000, 9, 492–506. [Google Scholar] [CrossRef]
  43. Carbone, E.A.D.; Nijdam, S. Thomson scattering on non-equilibrium low density plasmas: Principles, practice and challenges. Plasma Phys. Control. Fusion 2015, 57, 014026. [Google Scholar] [CrossRef]
  44. Hübner, S.; Santos Sousa, J.; Graham, W.G.; van der Mullen, J.J.A.M. Thomson scattering on non-thermal atmospheric pressure plasma jets. Plasma Sources Sci. Technol. 2015, 24, 054005. [Google Scholar] [CrossRef] [Green Version]
  45. van de Sande, M.J. Laser Scattering on Low Temperature Plasmas. High Resolution and Stray Light Rejection. Ph.D. Thesis, Technische Universiteit Eindhoven, Eindhoven, The Netherlands, 2002. [Google Scholar]
  46. Continuum. Operating and Maintenance Manual for Surelite Lasers; 996-0207 Revision; Continuum Electro Optics Inc.: Santa Clara, CA, USA, 2002. [Google Scholar]
  47. Gigosos, M.A.; Gonzalez, M.A.; Cardenoso, V. Computer simulated Balmer-alpha, -beta and -gamma Stark line profiles for non-equilibrium plasmas diagnostics. Spectrochim. Acta B 2003, 58, 1489–1504. [Google Scholar] [CrossRef]
  48. Palomares, J.M.; Hübner, S.; Carbone, E.A.D.; de Vries, N.; van Veldhuizen, E.M.; Sola, A.; Gamero, A.; van der Mullen, J.J.A.M. Hβ Stark broadening in cold plasmas with low electron densities calibrated with Thomson scattering. Spectrochim. Acta B 2012, 73, 39–47. [Google Scholar] [CrossRef] [Green Version]
  49. Konjević, N.; Ivković, M.; Sakan, N. Hydrogen Balmer lines for low electron number density plasma diagnostics. Spectrochim. Acta B 2012, 76, 16–26. [Google Scholar] [CrossRef]
  50. Xiao, D.; Cheng, C.; Shen, J.; Lan, Y.; Xie, H.; Shu, X.; Meng, Y.; Li, J.; Chu, P.K. Electron density measurements of atmospheric-pressure non-thermal N2 plasma jet by Stark broadening and irradiance intensity methods. Phys. Plasmas 2014, 21, 053510. [Google Scholar] [CrossRef] [Green Version]
  51. Szulc, M. Diagnostics of a Pulsed Low-Current High-Voltage Discharge Operated at Atmospheric Pressure. Ph.D. Thesis, Universität der Bundeswehr München, Neubiberg, Germany, 2022. [Google Scholar]
  52. Murphy, A.B. Demixing in free-burning arcs. Phys. Rev. E 1997, 55, 7473. [Google Scholar] [CrossRef]
  53. Kühn-Kauffeldt, M.; Marques, J.L.; Forster, G.; Schein, J. Electron temperature and density measurement of tungsten inert gas arcs with Ar-He shielding gas mixture. J. Instrum. 2013, 8, C10017. [Google Scholar] [CrossRef]
  54. Xu, D.A.; Shneider, M.N.; Lacoste, D.A.; Laux, C.O. Thermal and hydrodynamic effects of nanosecond discharges in atmospheric pressure air. J. Phys. D Appl. Phys. 2014, 47, 235202. [Google Scholar] [CrossRef]
  55. Lu, X. Effects of gas temperature and electron temperature on species concentration of air plasmas. J. Appl. Phys. 2007, 102, 033302. [Google Scholar] [CrossRef]
  56. Naidis, G.V. Simulation of spark discharges in high-pressure air sustained by repetitive high-voltage nanosecond pulses. J. Phys. D Appl. Phys. 2008, 41, 234017. [Google Scholar] [CrossRef]
  57. Gutsol, A.; Kossitsyn, M.; Fridman, A.A. Generation and diagnostics of non-equilibrium plasma in gliding arc discharge. In Proceedings of the 16th International Symposium on Plasma Chemistry, Taormina, Italy, 22–27 June 2003. [Google Scholar]
  58. Janda, M.; Machala, Z.; Dvonč, L.; Lacoste, D.A.; Laux, C.O. Self-pulsing discharges in pre-heated air at atmospheric pressure. J. Phys. D Appl. Phys. 2015, 48, 035201. [Google Scholar] [CrossRef] [Green Version]
  59. Becker, K.H.; Kogelschatz, U.; Schoenbach, K.H.; Barker, R.J. Non-Equilibrium Air Plasmas at Atmospheric Pressure; Plasma Physics, Institute of Physics Publishing: Bristol, UK, 2005. [Google Scholar]
  60. Kong, C.; Gao, J.; Zhu, J.; Ehn, A.; Aldén, M.; Li, Z. Re-igniting the afterglow plasma column of an AC powered gliding arc discharge in atmospheric-pressure air. Appl. Phys. Lett. 2018, 112, 264101. [Google Scholar] [CrossRef]
  61. Hontañón, E.; Palomares, J.M.; Stein, M.; Guo, X.; Engeln, R.; Nirschl, H.; Kruis, F.E. The transition from spark to arc discharge and its implications with respect to nanoparticle production. J. Nanopart. Res. 2013, 15, 1957. [Google Scholar] [CrossRef]
  62. Kruger, C.H.; Laux, C.O.; Machala, Z.; Candler, G.V. Scaled-Up Nonequilibrium Air Plasmas; Technical Report; Mechanical Engineering Department, Stanford University: Stanford, CA, USA, 2004. [Google Scholar]
  63. Machala, Z.; Laux, C.O.; Kruger, C.H.; Candler, G.V. Atmospheric air and nitrogen DC glow discharges with thermionic cathodes and swirl flow. In Proceedings of the 42nd AIAA Aerospace Sciences Meeting and Exhibit, Reno, NV, USA, 5–8 January 2004. [Google Scholar]
  64. Benilov, M.S.; Naidis, G.V. Modelling of low-current discharges in atmospheric-pressure air taking account of non-equilibrium effects. J. Phys. D Appl. Phys. 2003, 36, 1834. [Google Scholar] [CrossRef] [Green Version]
  65. Akishev, Y.; Grushin, M.; Karalnik, V.; Petryakov, A.; Trushkin, N. Non-equilibrium constricted dc glow discharge in N2 flow at atmospheric pressure: Stable and unstable regimes. J. Phys. D Appl. Phys. 2010, 43, 075202. [Google Scholar] [CrossRef]
  66. Akishev, Y.; Grushin, M.; Karalnik, V.; Petryakov, A.; Trushkin, N. On basic processes sustaining constricted glow discharge in longitudinal N2 flow at atmospheric pressure. J. Phys. D Appl. Phys. 2010, 43, 215202. [Google Scholar] [CrossRef]
  67. Kruger, C.H.; Laux, C.O.; Yu, L.; Packan, D.M.; Pierrot, L. Nonequilibrium discharges in air and nitrogen plasmas at atmospheric pressure. Pure Appl. Chem. 2002, 74, 337–347. [Google Scholar] [CrossRef]
  68. Orrière, T.; Moreau, E.; Pai, D.Z. Ionization and recombination in nanosecond repetitively pulsed microplasmas in air at atmospheric pressure. J. Phys. D Appl. Phys. 2018, 51, 494002. [Google Scholar] [CrossRef]
Figure 1. Simplified schematic of the triggering setup used for laser scattering.
Applsci 12 06580 g001
Figure 2. Mean electron density ( n ¯ e ) and particle temperatures ( T ¯ e , T ¯ h ) estimated with laser scattering and emission spectroscopy for different axial distances d downstream from nozzle outlet and different working frequencies at a power setting of 100 % .
Applsci 12 06580 g002
Figure 3. Temporal distribution of the mean plasma parameters for both considered frequencies of 60 kHz and 43 kHz at a power setting of 100 % and axial distance d = 1 mm . The upper left diagram shows a typical current trace and the timeframes at which the scattering setup was triggered in relation to a current pulse.
Applsci 12 06580 g003
Figure 4. Spatial distribution of the heavy particle temperature estimated based on Rayleigh scattering for a pulse frequency of 60 kHz and power setting of 100 % (corresponding to a current amplitude of ∼ 1 A ).
Applsci 12 06580 g004
Figure 5. Mean plasma parameters estimated for different power settings at an axial distance of 1 mm from nozzle exit while the scattering setup is triggered at I p e a k . A power setting of 100 % corresponds to a current amplitude of ∼ 1.0 A .
Applsci 12 06580 g005
Publisher’s Note: MDPI stays neutral with regard to jurisdictional claims in published maps and institutional affiliations.

