
Visual Demands of Walking Are Reflected in Eye-Blink-Evoked EEG-Activity

 ,
,  , ,
, ,
Abstract
:1. Introduction
2. Methods
2.1. Participants
2.2. Tasks
2.2.1. Auditory Tasks
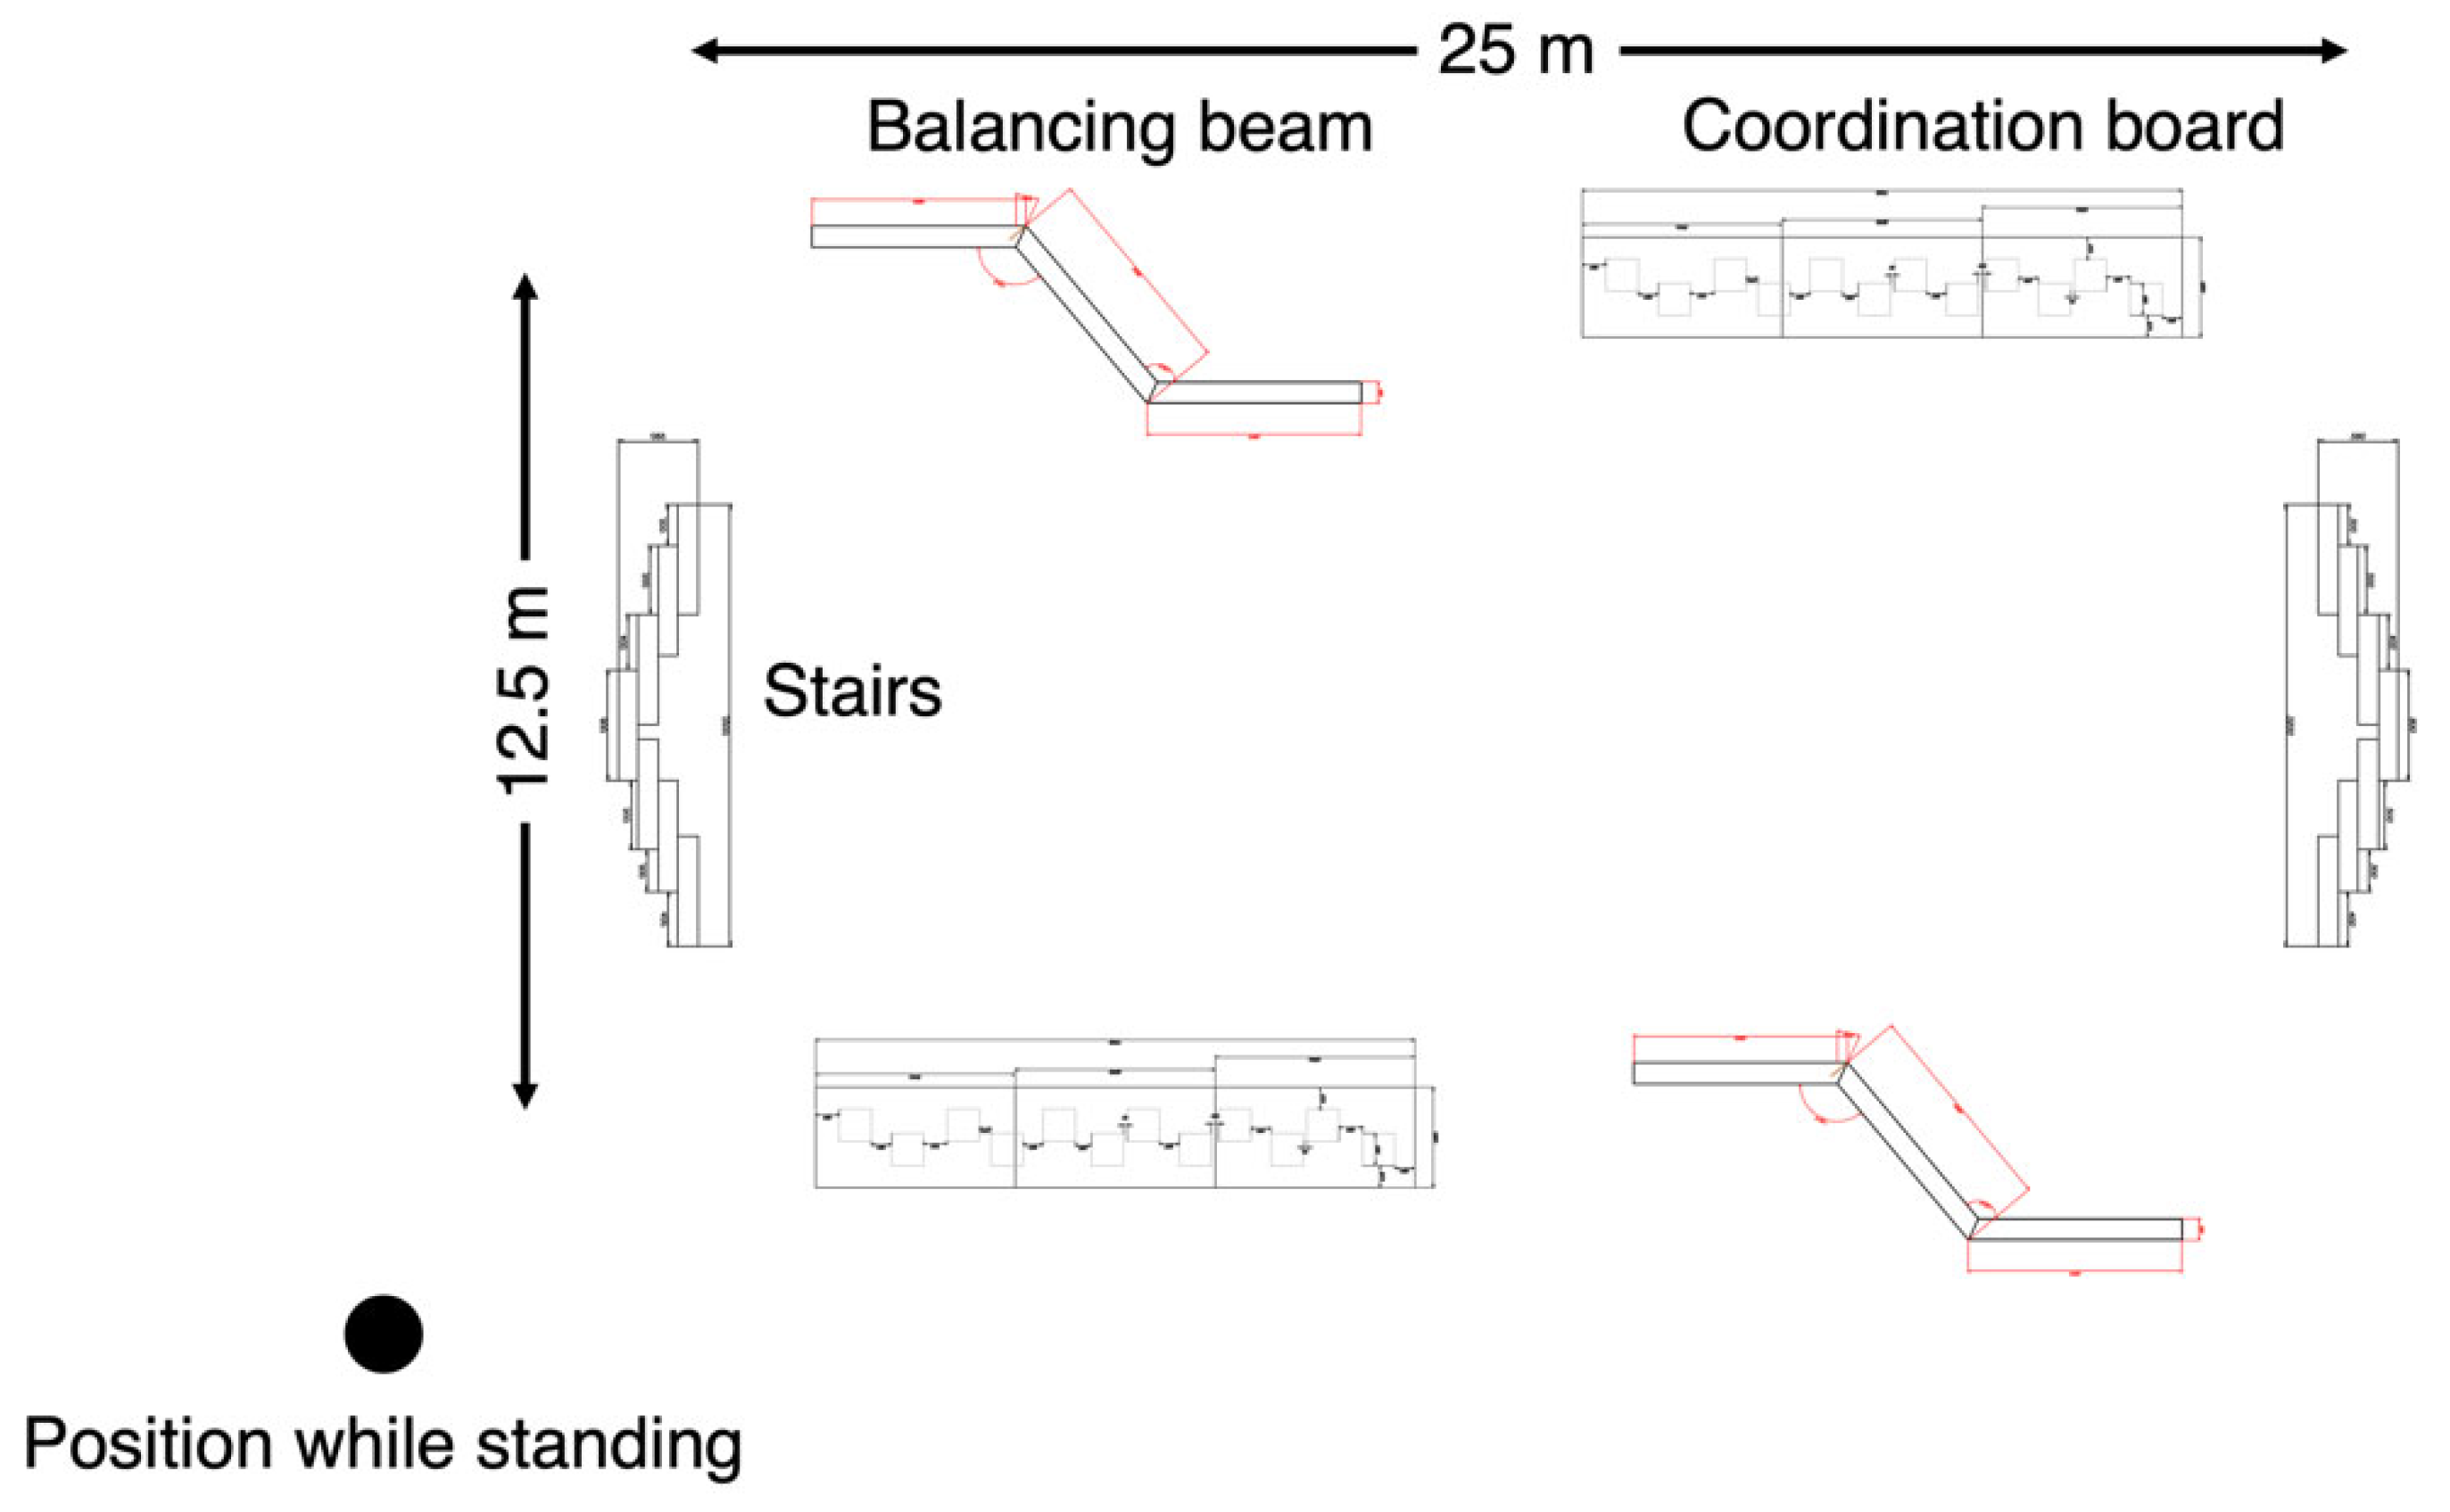
2.2.2. Walking Conditions
2.3. Recording and EEG Data Processing
2.3.1. Data Recording and Preprocessing
2.3.2. Data Analyses
3. Results
3.1. Behavioral Data
3.2. EEG Parameters
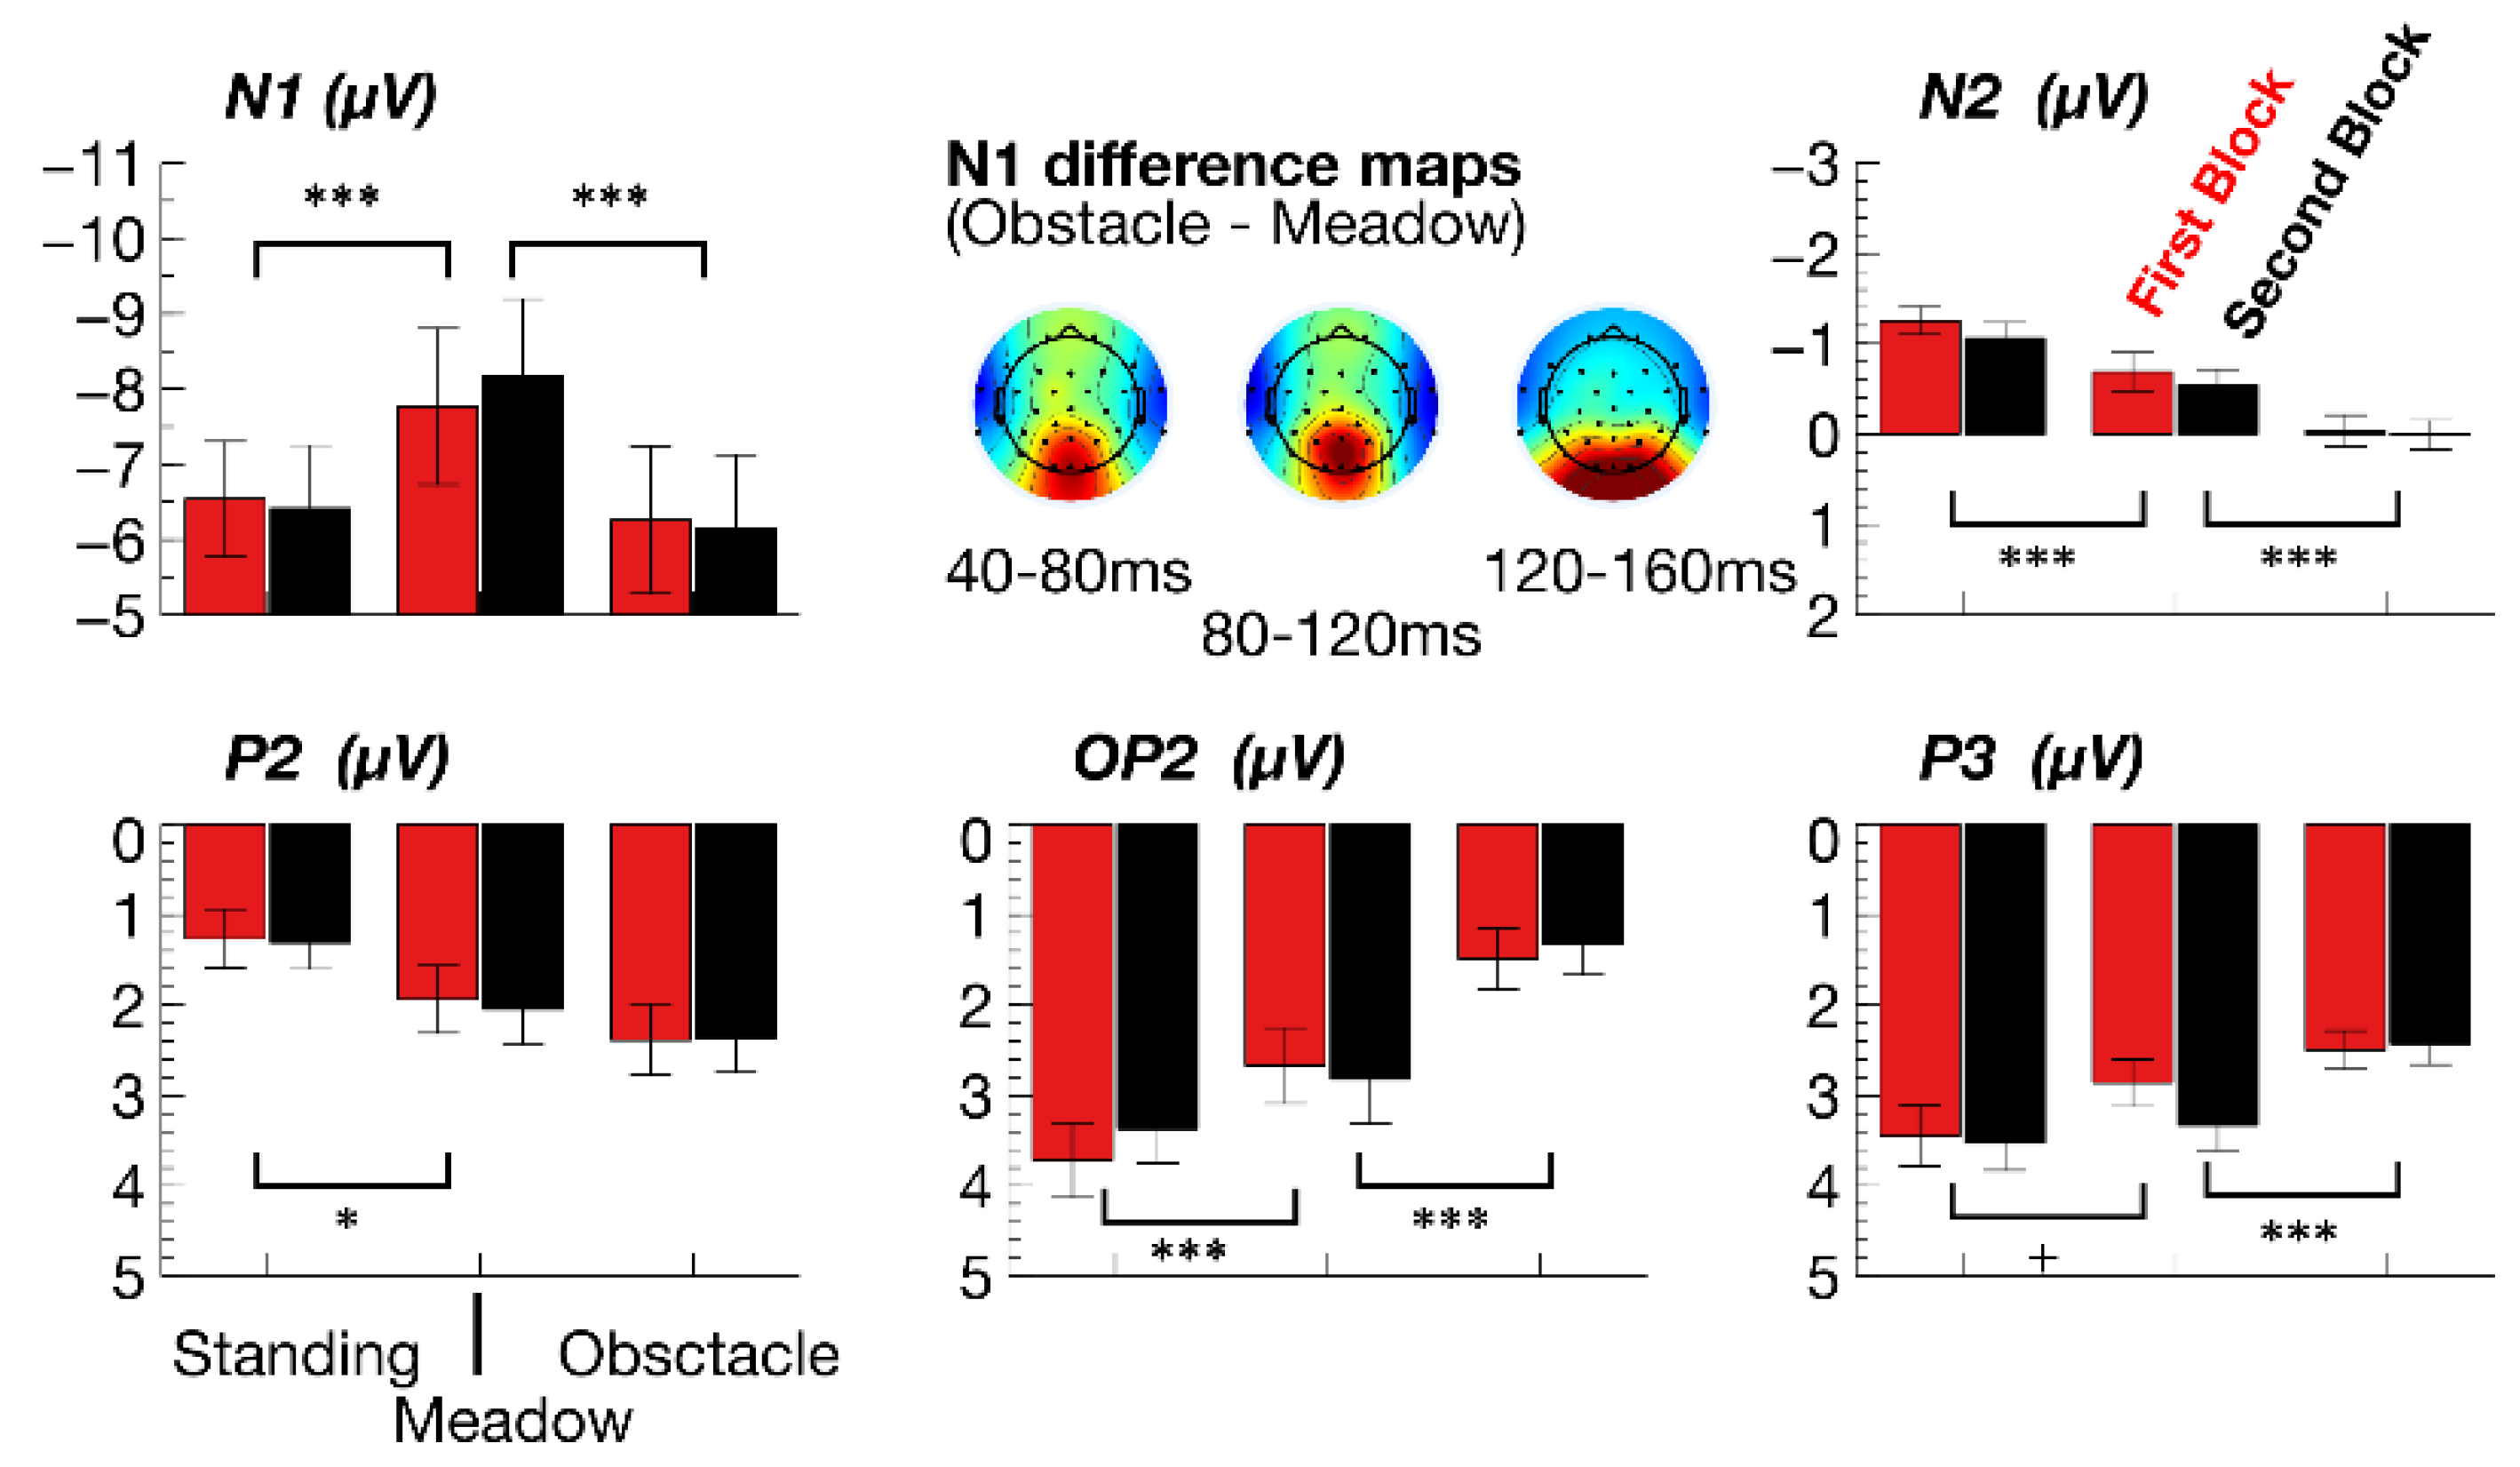
3.2.1. ERPs
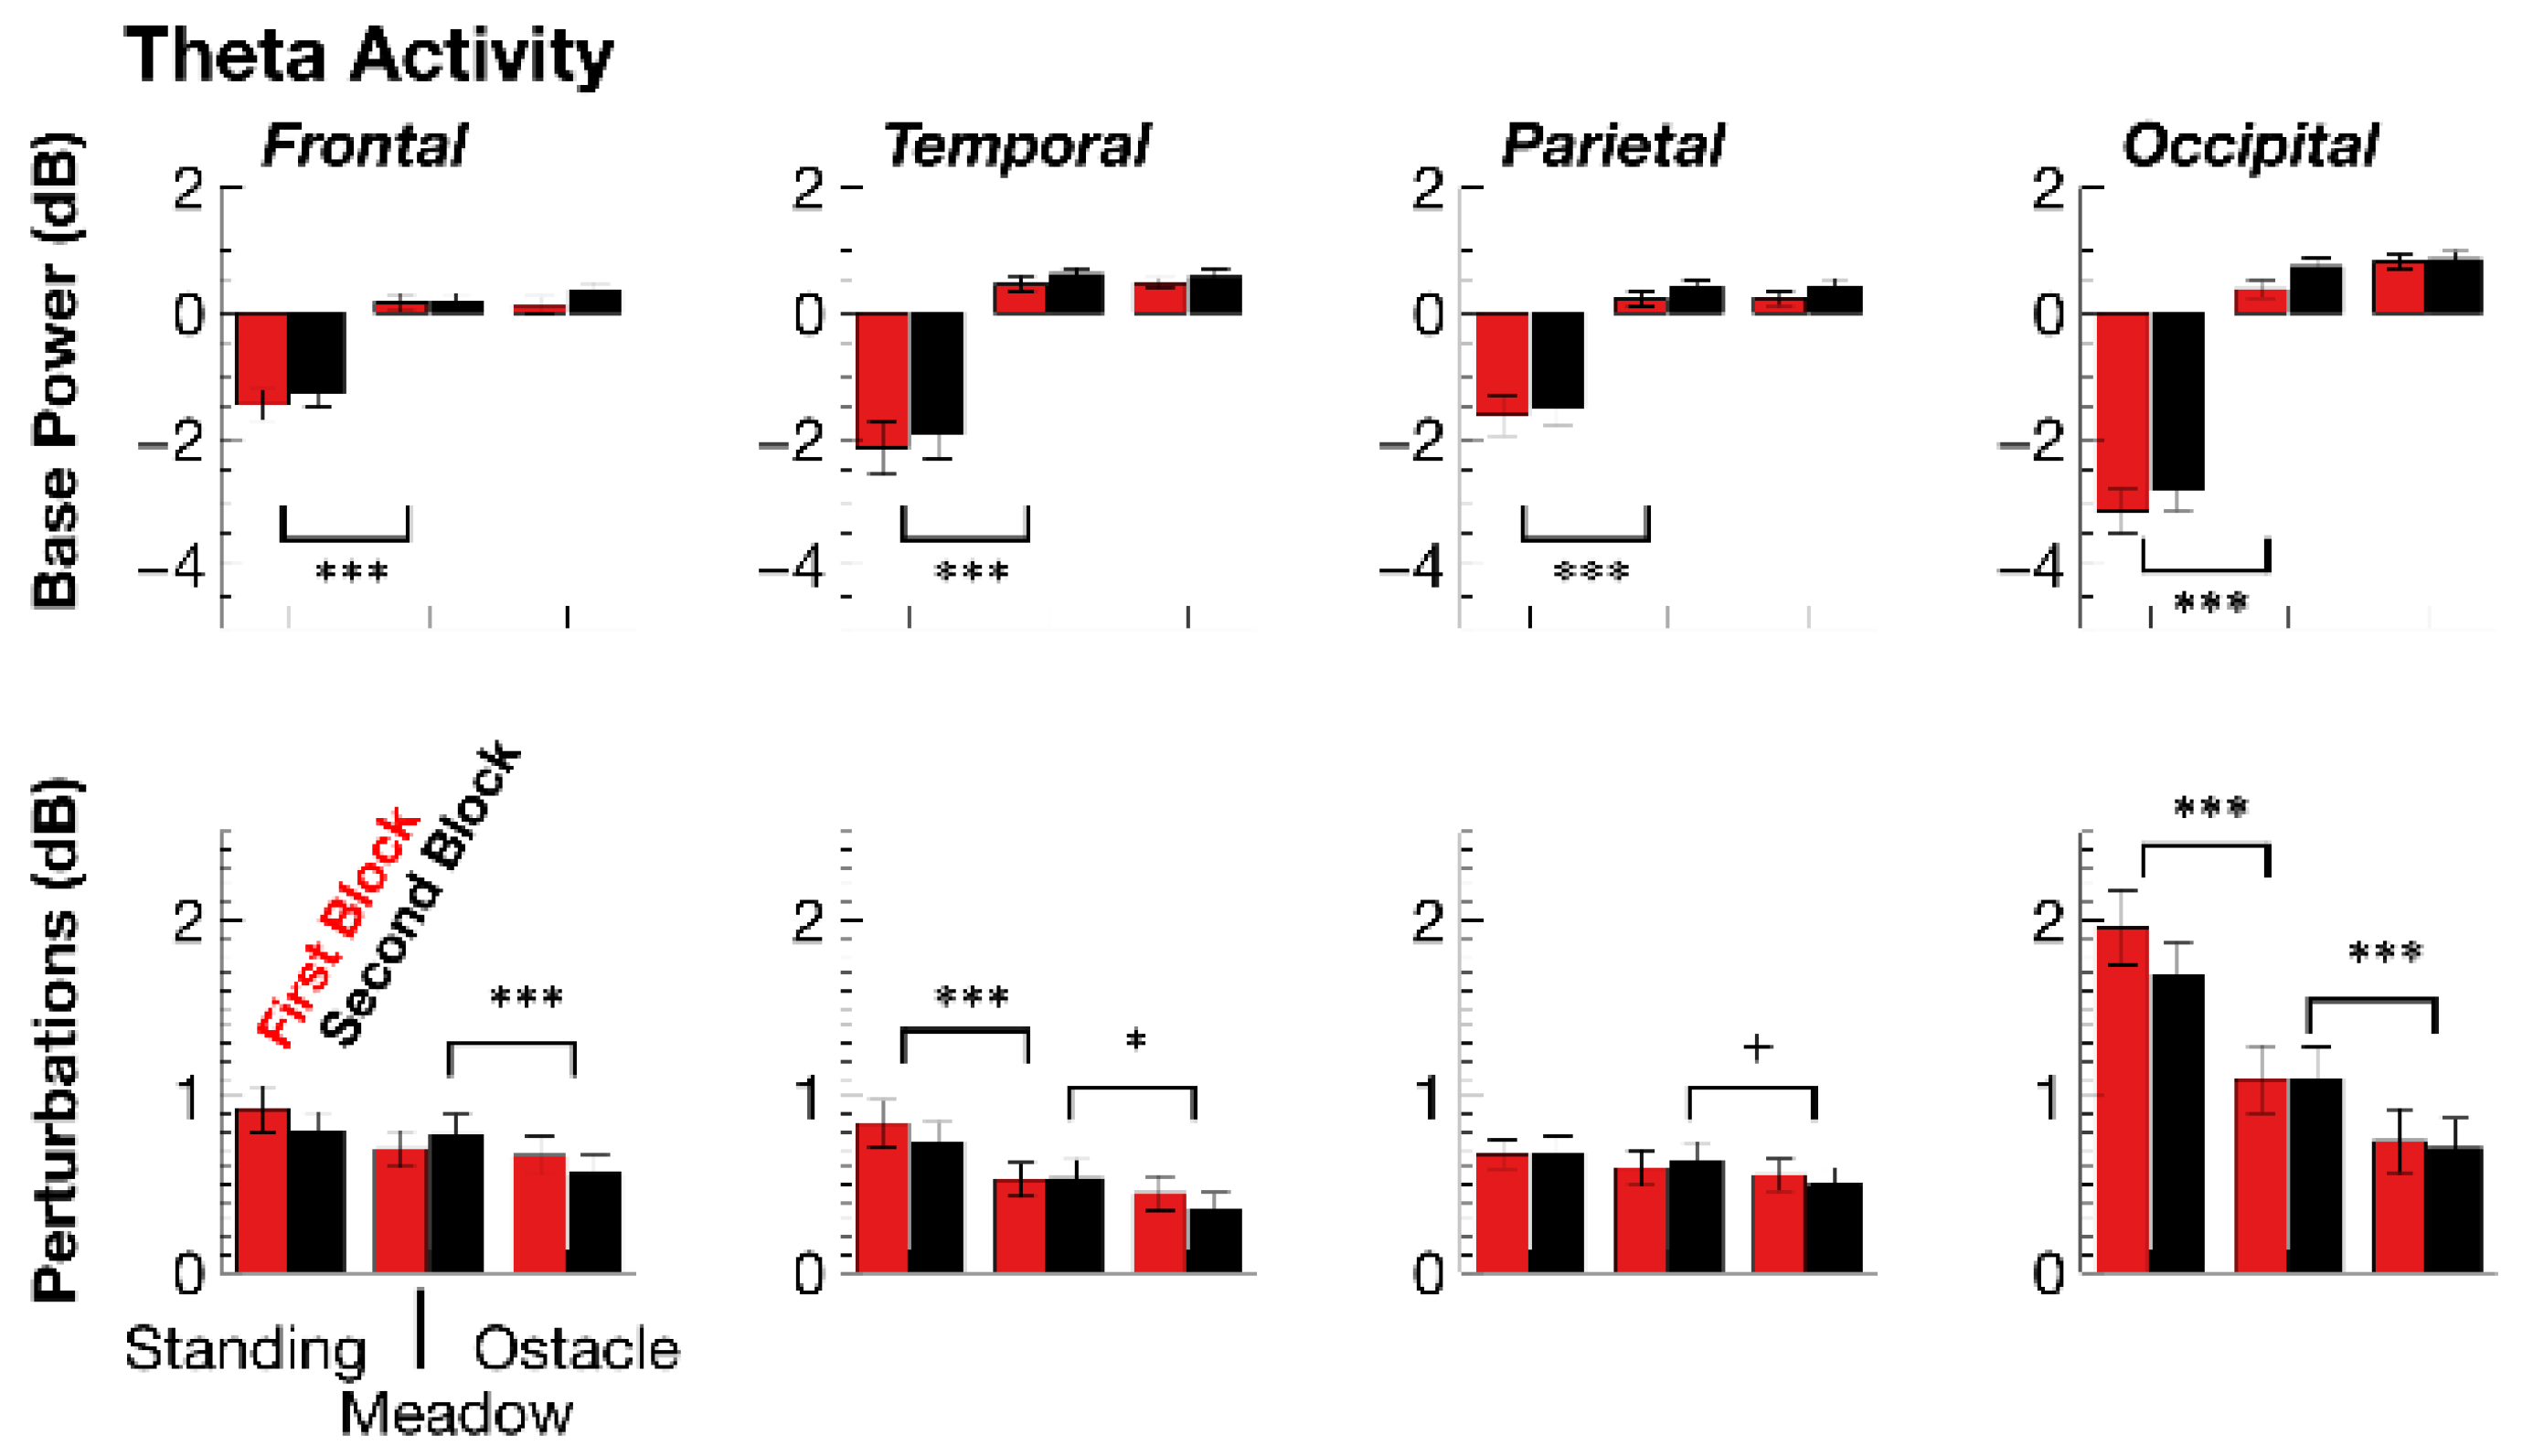
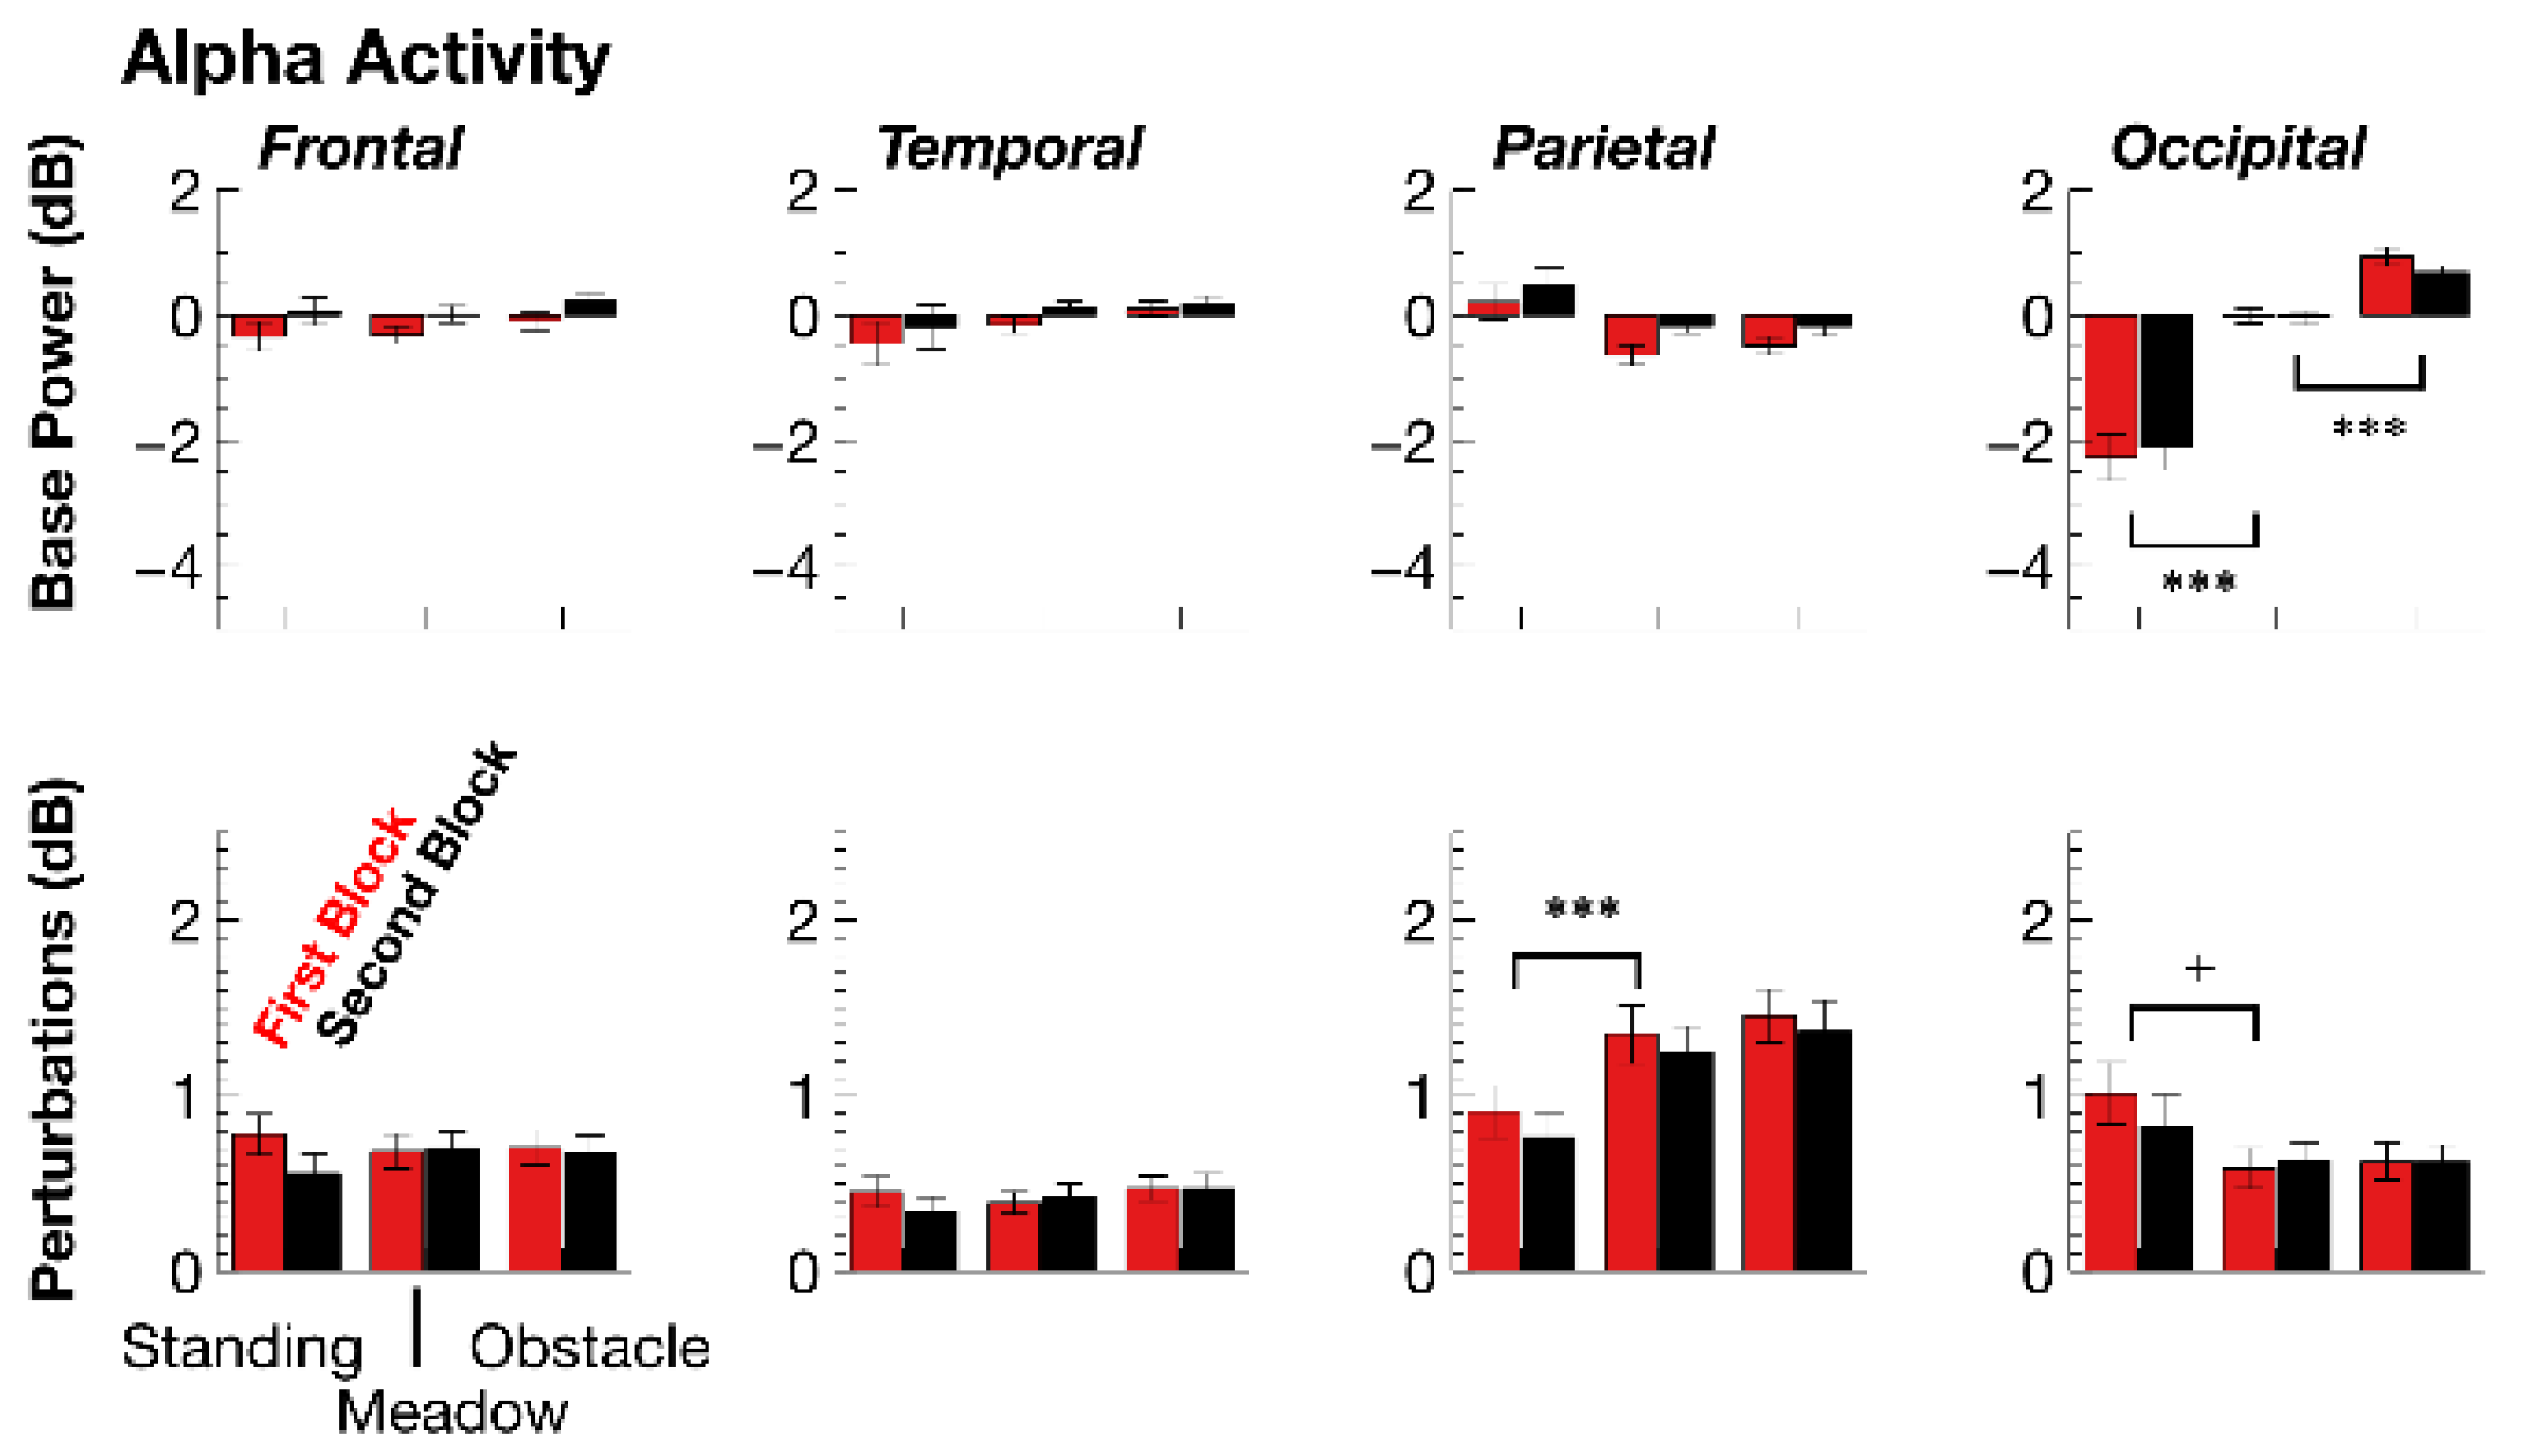
3.2.2. ERSPs
4. Discussion
Author Contributions
Funding
Institutional Review Board Statement
Informed Consent Statement
Data Availability Statement
Conflicts of Interest
Appendix A

| Behavioral parameters | |||||||
|---|---|---|---|---|---|---|---|
| Standing vs. meadow | Meadow vs. obstacle | ||||||
| Head Acceleration | DF | F | p | adjηp2 | F | p | adjηp2 |
| walking task | 1,35 | 144.81 | p < 0.001 | 0.8 | 195.68 | p < 0.001 | 0.84 |
| experimental block | 1,35 | 0.57 | p > 0.1 | - | 1.66 | p = 0.015 | 0.02 |
| walking × block | 1,35 | 0.02 | p > 0.1 | - | 8.01 | p = 0.015 | 0.16 |
| Standing vs. meadow | Meadow vs. obstacle | ||||||
| Head Dynamics | DF | F | p | adjηp2 | F | p | adjηp2 |
| walking task | 1,35 | 330.06 | p < 0.001 | 0.9 | 9.94 | p = 0.006 | 0.2 |
| experimental block | 1,35 | 2.87 | p > 0.1 | - | 1.14 | p > 0.1 | - |
| walking × block | 1,35 | 0.17 | p > 0.1 | - | 0.24 | p > 0.1 | - |
| Standing vs. meadow | Meadow vs. obstacle | ||||||
| Blink Interval | DF | F | p | adjηp2 | F | p | adjηp2 |
| walking task | 1,35 | 0.12 | p > 0.1 | - | 46.06 | p < 0.001 | 0.56 |
| experimental block | 1,35 | 0.01 | p > 0.1 | - | 0.08 | p > 0.1 | - |
| walking × block | 1,35 | 0.05 | p > 0.1 | - | 0 | p > 0.1 | - |
| Standing vs. meadow | Meadow vs. obstacle | ||||||
| Blink Duration | DF | F | p | adjηp2 | F | p | adjηp2 |
| walking task | 1,35 | 9.23 | p = 0.009 | 0.19 | 3.87 | p > 0.1 | - |
| experimental block | 1,35 | 6.79 | p = 0.027 | 0.14 | 9.47 | p = 0.008 | 0.19 |
| walking x block | 1,35 | 0.34 | p > 0.1 | - | 0.29 | p > 0.1 | - |
| ERPs | |||||||
| Standing vs. meadow | Meadow vs. obstacle | ||||||
| N1 Amplitude | DF | F | p | adjηp2 | F | p | adjηp2 |
| walking task | 1,35 | 14.72 | p = 0.001 | 0.28 | 47.57 | p < 0.001 | 0.56 |
| experimental block | 1,35 | 0.9 | p > 0.1 | - | 0.63 | p > 0.1 | - |
| walking x block | 1,35 | 3.38 | p > 0.1 | - | 7.24 | p = 0.021 | 0.15 |
| Standing vs. meadow | Meadow vs. obstacle | ||||||
| N2 Ampl. (fronto-central) | DF | F | p | adjηp2 | F | p | adjηp2 |
| walking task | 1,35 | 14.53 | p = 0.001 | 0.27 | 16.77 | p < 0.001 | 0.3 |
| experimental block | 1,35 | 3.59 | p > 0.1 | - | 2.41 | p > 0.1 | - |
| walking × block | 1,35 | 0.05 | p > 0.1 | - | 0.18 | p > 0.1 | - |
| Standing vs. meadow | Meadow vs. obstacle | ||||||
| P2 Amplitude (parietal) | DF | F | p | adjηp2 | F | p | adjηp2 |
| walking task | 1,35 | 8.44 | p = 0.012 | 0.17 | 3.17 | p > 0.1 | - |
| experimental block | 1,35 | 0.37 | p > 0.1 | - | 0.11 | p > 0.1 | - |
| walking × block | 1,35 | 0.06 | p > 0.1 | - | 0.35 | p > 0.1 | - |
| Standing vs. meadow | Meadow vs. obstacle | ||||||
| P2 Amplitude (occipital) | DF | F | p | adjηp2 | F | p | adjηp2 |
| walking task | 1,35 | 15.28 | p < 0.001 | 0.28 | 25.57 | p < 0.001 | 0.41 |
| experimental block | 1,35 | 0.51 | p > 0.1 | - | 6.52 | p > 0.1 | - |
| walking × block | 1,35 | 3.92 | p > 0.1 | - | 1.61 | p > 0.1 | - |
| P3 Amplitude (parietal) | Standing vs. meadow | Meadow vs. obstacle | |||||
| DF | F | p | adjηp2 | F | p | adjηp2 | |
| walking task | 1,35 | 5.24 | p = 0.056 | 0.11 | 16.72 | p < 0.001 | 0.3 |
| experimental block | 1,35 | 10.28 | p = 0.006 | 0.2 | 6.15 | p = 0.036 | 0.13 |
| walking × block | 1,35 | 4.09 | p > 0.1 | - | 8.87 | p = 0.011 | 0.18 |
| ERSPs | |||||||
| Standing vs. meadow | Meadow vs. obstacle | ||||||
| Theta ERSP Base | DF | F | p | adjηp2 | F | p | adjηp2 |
| walking task | 1,35 | 68.13 | p < 0.001 | 0.65 | 0.76 | p > 0.1 | - |
| walking × topography | 3,105 | 16.21 | p < 0.001 | 0.29 | 2.42 | p > 0.1 | - |
| walking (frontal) | 1,35 | 43.58 | p < 0.001 | 0.54 | 0.38 | p > 0.1 | - |
| walking (temporal) | 1,35 | 32.63 | p < 0.001 | 0.47 | 0.03 | p > 0.1 | - |
| walking (parietal) | 1,35 | 27.51 | p < 0.001 | 0.42 | 0 | p > 0.1 | - |
| walking (occipital) | 1,35 | 132.97 | p < 0.001 | 0.79 | 3.37 | p > 0.1 | - |
| experimental block | 1,35 | 10.20 | p = 0.006 | 0.20 | 2.66 | p > 0.1 | - |
| walking × block | 1,35 | 0.10 | p > 0.1 | - | 0.10 | p > 0.1 | - |
| block × topography | 3,105 | 3.07 | p = 0.092 | 0.05 | 0.16 | p > 0.1 | - |
| block (frontal) | 1,35 | 2.18 | p > 0.1 | - | 0.95 | p > 0.1 | - |
| block (temporal) | 1,35 | 4.96 | p = 0.064 | 0.10 | 1.69 | p > 0.1 | - |
| block (parietal) | 1,35 | 4.39 | p = 0.087 | 0.09 | 2.2 | p > 0.1 | - |
| block (occipital) | 1,35 | 12.19 | p = 0.002 | 0.24 | 1.69 | p > 0.1 | - |
| walking × block × topography | 3,105 | 0.75 | p > 0.1 | - | 2.91 | p > 0.1 | - |
| Standing vs. meadow | Meadow vs. obstacle | ||||||
| Theta Perturbation | DF | F | p | adjηp2 | F | p | adjηp2 |
| walking task | 1,35 | 16.22 | p < 0.001 | 0.30 | 31.28 | p < 0.001 | 0.46 |
| walking × topography | 3,105 | 25.60 | p < 0.001 | 0.41 | 10.55 | p < 0.001 | 0.21 |
| walking (frontal) | 1,35 | 2.98 | p > 0.1 | - | 10.41 | p = 0.005 | 0.21 |
| walking (temporal) | 1,35 | 13.41 | p < 0.001 | 0.26 | 10.77 | p = 0.002 | 0.21 |
| walking (parietal) | 1,35 | 0.5 | p > 0.1 | - | 4.79 | p = 0.071 | 0.1 |
| walking (occipital) | 1,35 | 36.54 | p < 0.001 | 0.5 | 33.37 | p < 0.001 | 0.47 |
| experimental block | 1,35 | 1.87 | p > 0.1 | - | 0.29 | p > 0.1 | - |
| walking × block | 1,35 | 7.52 | p = 0.019 | 0.15 | 4.02 | p > 0.1 | - |
| block × topography | 3,105 | 3.13 | p = 0.090 | 0.06 | 0.21 | p > 0.1 | - |
| block (frontal) | 1,35 | 0.29 | p > 0.1 | - | 0.06 | p > 0.1 | - |
| block (temporal) | 1,35 | 1.16 | p > 0.1 | - | 0.86 | p > 0.1 | - |
| block (parietal) | 1,35 | 0.5 | p > 0.1 | - | 0.02 | p > 0.1 | - |
| block (occipital) | 1,35 | 5.08 | p = 0.061 | 0.1 | 0.12 | p > 0.1 | - |
| walking × block × topography | 3,105 | 2.46 | p > 0.1 | - | 1.16 | p > 0.1 | - |
| Standing vs. meadow | Meadow vs. obstacle | ||||||
| Alpha ERSP Base | DF | F | p | adjηp2 | F | p | adjηp2 |
| walking task | 1,35 | 1.74 | p > 0.1 | - | 14,12 | p = 0.001 | 0.27 |
| walking × topography | 3,105 | 38.43 | p < 0.001 | 0.51 | 21.79 | p < 0.001 | 0.37 |
| walking (frontal) | 1,35 | 0 | p > 0.1 | - | 3.63 | p > 0.1 | - |
| walking (temporal) | 1,35 | 0.54 | p > 0.1 | - | 3.75 | p > 0.1 | - |
| walking (parietal) | 1,35 | 3.59 | p > 0.1 | - | 0.93 | p > 0.1 | - |
| walking (occipital) | 1,35 | 32.4 | p < 0.001 | 0.47 | 33.91 | p < 0.001 | 0.48 |
| experimental block | 1,35 | 12.67 | p = 0.002 | 0.24 | 6.30 | p = 0.033 | 0.13 |
| walking × block | 1,35 | 0.02 | p > 0.1 | - | 1.27 | p > 0.1 | - |
| block × topography | 3,105 | 5.94 | p = 0.015 | 0.12 | 12.76 | p < 0.001 | 0.25 |
| block (frontal) | 1,35 | 27.05 | p < 0.001 | 0.42 | 8.79 | p = 0.011 | 0.18 |
| block (temporal) | 1,35 | 9.38 | p = 0.008 | 0.19 | 4.58 | p = 0.008 | 0.09 |
| block (parietal) | 1,35 | 13.94 | p = 0.001 | 0.26 | 23.05 | p < 0.001 | 0.38 |
| block (occipital) | 1,35 | 0.44 | p > 0.1 | - | 2.08 | p > 0.1 | - |
| walking × block × topography | 3,105 | 3.87 | p = 0.032 | 0.07 | 0.61 | p > 0.1 | - |
| Standing vs. meadow | Meadow vs. obstacle | ||||||
| Alpha Perturbation | DF | F | p | adjηp2 | F | p | adjηp2 |
| walking task | 1,35 | 0.39 | p > 0.1 | - | 1.82 | p > 0.1 | - |
| walking × topography | 3,105 | 20.70 | p < 0.001 | 0.35 | 2.55 | p > 0.1 | - |
| walking (frontal) | 1,35 | 0.11 | p > 0.1 | - | 0.01 | p > 0.1 | - |
| walking (temporal) | 1,35 | 0.03 | p > 0.1 | - | 1.99 | p > 0.1 | - |
| walking (parietal) | 1,35 | 23.93 | p < 0.001 | 0.39 | 3.18 | p > 0.1 | - |
| walking (occipital) | 1,35 | 5.43 | p = 0.051 | 0.11 | 0.13 | p > 0.1 | - |
| experimental block | 1,35 | 4.78 | p = 0.071 | 0.10 | 0.35 | p > 0.1 | - |
| walking × block | 1,35 | 5.23 | p = 0.056 | 0.11 | 0.16 | p > 0.1 | - |
| block × topography | 3,105 | 0.99 | p > 0.1 | - | 3.13 | p = 0.095 | 0.06 |
| block (frontal) | 1,35 | 4.37 | p = 0.088 | 0.09 | 0.04 | p > 0.1 | - |
| block (temporal) | 1,35 | 1.40 | p > 0.1 | - | 0.14 | p > 0.1 | - |
| block (parietal) | 1,35 | 5.98 | p = 0.039 | 0.12 | 5.44 | p = 0.051 | 0.11 |
| block (occipital) | 1,35 | 1.35 | p > 0.1 | - | 0.23 | p > 0.1 | - |
| walking × block × topography | 3,105 | 2.38 | p > 0.1 | - | 0.35 | p > 0.1 | - |
References
- Berka, C.; Levendowski, D.J.; Lumicao, M.N.; Yau, A.; Davis, G.; Zivkovic, V.T.; Olmstead, R.E.; Tremoulet, P.D.; Craven, P.L. EEG Correlates of Task Engagement and Mental Workload in Vigilance, Learning, and Memory Tasks. Aviat. Space Environ. Med. 2007, 78, 14. [Google Scholar]
- Dehais, F.; Lafont, A.; Roy, R.; Fairclough, S. A Neuroergonomics Approach to Mental Workload, Engagement and Human Performance. Front. Neurosci. 2020, 14, 268. [Google Scholar] [CrossRef]
- Lal, S.K.L.; Craig, A. A Critical Review of the Psychophysiology of Driver Fatigue. Biol. Psychol. 2001, 55, 173–194. [Google Scholar] [CrossRef]
- Wascher, E.; Heppner, H.; Kobald, S.O.; Arnau, S.; Getzmann, S.; Mockel, T. Age-Sensitive Effects of Enduring Work with Alternating Cognitive and Physical Load. A Study Applying Mobile EEG in a Real Life Working Scenario. Front. Hum. Neurosci. 2015, 9, 711. [Google Scholar] [CrossRef] [Green Version]
- Lal, S.K.L.; Craig, A. Electroencephalography Activity Associated with Driver Fatigue: Implications for a Fatigue Countermeasure Device. J. Psychophysiol. 2001, 15, 183–189. [Google Scholar] [CrossRef]
- Wascher, E.; Arnau, S.; Reiser, J.E.; Rudinger, G.; Karthaus, M.; Rinkenauer, G.; Dreger, F.; Getzmann, S. Evaluating Mental Load during Realistic Driving Simulations by Means of Round the Ear Electrodes. Front. Neurosci. 2019, 13, 940. [Google Scholar] [CrossRef]
- Mijović, P.; Ković, V.; De Vos, M.; Mačužić, I.; Todorović, P.; Jeremić, B.; Gligorijević, I. Towards Continuous and Real-Time Attention Monitoring at Work: Reaction Time versus Brain Response. Ergonomics 2017, 60, 241–254. [Google Scholar] [CrossRef]
- Mijović, P.; Ković, V.; De Vos, M.; Mačužić, I.; Jeremić, B.; Gligorijević, I. Benefits of Instructed Responding in Manual Assembly Tasks: An ERP Approach. Front. Hum. Neurosci. 2016, 10, 171. [Google Scholar] [CrossRef] [Green Version]
- De Vos, M.; Gandras, K.; Debener, S. Towards a Truly Mobile Auditory Brain–Computer Interface: Exploring the P300 to Take Away. Int. J. Psychophysiol. 2014, 91, 46–53. [Google Scholar] [CrossRef]
- Wascher, E.; Reiser, J.; Rinkenauer, G.; Larrá, M.; Dreger, F.A.; Schneider, D.; Karthaus, M.; Getzmann, S.; Gutberlet, M.; Arnau, S. Neuroergonomics on the Go: An Evaluation of the Potential of Mobile EEG for Workplace Assessment and Design. Hum. Factors J. Hum. Factors Ergon. Soc. 2021, 001872082110077. [Google Scholar] [CrossRef]
- Wunderlich, A.; Gramann, K. Eye Movement-Related Brain Potentials during Assisted Navigation in Real-World Environments. Eur. J. Neurosci. 2021, 54, 8336–8354. [Google Scholar] [CrossRef]
- Reiser, J.E.; Wascher, E.; Arnau, S. Recording Mobile EEG in an Outdoor Environment Reveals Cognitive-Motor Interference Dependent on Movement Complexity. Sci. Rep. 2019, 9, 13086. [Google Scholar] [CrossRef] [Green Version]
- Reiser, J.E.; Wascher, E.; Rinkenauer, G.; Arnau, S. Cognitive-Motor Interference in the Wild: Assessing the Effects of Movement Complexity on Task Switching Using Mobile EEG. Eur. J. Neurosci. 2021, 54, 8175–8195. [Google Scholar] [CrossRef]
- Hayhoe, M.M.; Matthis, J.S. Control of Gaze in Natural Environments: Effects of Rewards and Costs, Uncertainty and Memory in Target Selection. Interface Focus 2018, 8, 20180009. [Google Scholar] [CrossRef]
- Matthis, J.S.; Fajen, B.R. Visual Control of Foot Placement When Walking over Complex Terrain. J. Exp. Psychol. Hum. Percept. Perform. 2014, 40, 106–115. [Google Scholar] [CrossRef]
- Matthis, J.S.; Barton, S.L.; Fajen, B.R. The Critical Phase for Visual Control of Human Walking over Complex Terrain. Proc. Natl. Acad. Sci. USA 2017, 114, E6720–E6729. [Google Scholar] [CrossRef] [Green Version]
- Hollands, M.A.; Marple-Horvath, D.E. Coordination of Eye and Leg Movements During Visually Guided Stepping. J. Mot. Behav. 2001, 33, 205–216. [Google Scholar] [CrossRef]
- François, M.; Morice, A.H.P.; Bootsma, R.J.; Montagne, G. Visual Control of Walking Velocity. Neurosci. Res. 2011, 70, 214–219. [Google Scholar] [CrossRef]
- Mohler, B.J.; Thompson, W.B.; Creem-Regehr, S.H.; Pick, H.L.; Warren, W.H. Visual Flow Influences Gait Transition Speed and Preferred Walking Speed. Exp. Brain Res. 2007, 181, 221–228. [Google Scholar] [CrossRef]
- Hallemans, A.; Ortibus, E.; Meire, F.; Aerts, P. Low Vision Affects Dynamic Stability of Gait. Gait Posture 2010, 32, 547–551. [Google Scholar] [CrossRef]
- Warren, W.H.; Kay, B.A.; Yilmaz, E.H. Visual Control of Posture during Walking: Functional Specificity. J. Exp. Psychol. Hum. Percept. Perform. 1996, 22, 818–838. [Google Scholar] [CrossRef]
- Marigold, D.S.; Patla, A.E. Visual Information from the Lower Visual Field Is Important for Walking across Multi-Surface Terrain. Exp. Brain Res. 2008, 188, 23–31. [Google Scholar] [CrossRef] [PubMed]
- Cao, L.; Händel, B. Walking Enhances Peripheral Visual Processing in Humans. PLOS Biol. 2019, 17, e3000511. [Google Scholar] [CrossRef] [PubMed] [Green Version]
- Menz, H.B.; Lord, S.R.; Fitzpatrick, R.C. Acceleration Patterns of the Head and Pelvis When Walking Are Associated with Risk of Falling in Community-Dwelling Older People. J. Gerontol. Ser. A Biol. Sci. Med. Sci. 2003, 58, M446–M452. [Google Scholar] [CrossRef] [PubMed]
- Gramann, K.; Jung, T.-P.; Ferris, D.P.; Lin, C.-T.; Makeig, S. Toward a New Cognitive Neuroscience: Modeling Natural Brain Dynamics. Front. Hum. Neurosci. 2014, 8, 444. [Google Scholar] [CrossRef]
- Cao, L.; Chen, X.; Haendel, B.F. Overground Walking Decreases Alpha Activity and Entrains Eye Movements in Humans. Front. Hum. Neurosci. 2020, 14, 561755. [Google Scholar] [CrossRef]
- De Sanctis, P.; Butler, J.S.; Malcolm, B.R.; Foxe, J.J. Recalibration of Inhibitory Control Systems during Walking-Related Dual-Task Interference: A Mobile Brain-Body Imaging (MOBI) Study. NeuroImage 2014, 94, 55–64. [Google Scholar] [CrossRef] [Green Version]
- Debener, S.; Emkes, R.; De Vos, M.; Bleichner, M. Unobtrusive Ambulatory EEG Using a Smartphone and Flexible Printed Electrodes around the Ear. Sci. Rep. 2015, 5, 16743. [Google Scholar] [CrossRef] [Green Version]
- Ladouce, S.; Donaldson, D.I.; Dudchenko, P.A.; Ietswaart, M. Mobile EEG Identifies the Re-Allocation of Attention during Real-World Activity. Sci. Rep. 2019, 9, 15851. [Google Scholar] [CrossRef] [Green Version]
- Scanlon, J.E.M.; Redman, E.X.; Kuziek, J.W.P.; Matthewson, K.E. A Ride in the Park: Cycling in Different Outdoor Environments Modulates the Auditory Evoked Potentials. Int. J. Psychophysiol. 2020, 151, 59–69. [Google Scholar] [CrossRef]
- Zink, R.; Hunyadi, B.; Huffel, S.V.; De Vos, M. Mobile EEG on the Bike: Disentangling Attentional and Physical Contributions to Auditory Attention Tasks. J. Neural Eng. 2016, 13, 1–11. [Google Scholar] [CrossRef] [PubMed]
- Wickens, C.D. Multiple Resources and Mental Workload. Hum. Factors J. Hum. Factors Ergon. Soc. 2008, 50, 449–455. [Google Scholar] [CrossRef] [PubMed] [Green Version]
- Orchard, L.N.; Stern, J.A. Blinks as an Index of Cognitive Activity during Reading. Integr. Physiol. Behav. Sci. 1991, 26, 108–116. [Google Scholar] [CrossRef] [PubMed]
- Nakano, T.; Yamamoto, Y.; Kitajo, K.; Takahashi, T.; Kitazawa, S. Synchronization of Spontaneous Eyeblinks While Viewing Video Stories. Proc. R. Soc. B Biol. Sci. 2009, 276, 3635–3644. [Google Scholar] [CrossRef] [Green Version]
- Wascher, E.; Heppner, H.; Möckel, T.; Kobald, S.O.; Getzmann, S. Eye-Blinks in Choice Response Tasks Uncover Hidden Aspects of Information Processing. EXCLI J. 2015, 14, 1207. [Google Scholar] [CrossRef]
- Kobald, S.O.; Wascher, E.; Heppner, H.; Getzmann, S. Eye Blinks Are Related to Auditory Information Processing: Evidence from a Complex Speech Perception Task. Psychol. Res. 2019, 83, 1281–1291. [Google Scholar] [CrossRef]
- Folstein, J.R.; Van Petten, C. Influence of Cognitive Control and Mismatch on the N2 Component of the ERP: A Review. Psychophysiology 2007, 42, 152–170. [Google Scholar] [CrossRef] [Green Version]
- Polich, J. Updating P300: An Integrative Theory of P3a and P3b. Clin. Neurophysiol. 2007, 118, 2128–2148. [Google Scholar] [CrossRef] [Green Version]
- Bradley, M.M.; Hamby, S.; Löw, A.; Lang, P.J. Brain Potentials in Perception: Picture Complexity and Emotional Arousal. Psychophysiology 2007, 44, 364–373. [Google Scholar] [CrossRef]
- Klimesch, W.; Doppelmayr, M.; Russegger, H.; Pachinger, T.; Schwaiger, J. Induced Alpha Band Power Changes in the Human EEG and Attention. Neurosci. Lett. 1998, 244, 73–76. [Google Scholar] [CrossRef]
- Hanslmayr, S.; Gross, J.; Klimesch, W.; Shapiro, K.L. The Role of Alpha Oscillations in Temporal Attention. Brain Res. Rev. 2011, 67, 331–343. [Google Scholar] [CrossRef] [PubMed] [Green Version]
- Bonacci, L.M.; Bressler, S.; Kwasa, J.A.C.; Noyce, A.L.; Shinn-Cunningham, B.G. Effects of Visual Scene Complexity on Neural Signatures of Spatial Attention. Front. Hum. Neurosci. 2020, 14, 91. [Google Scholar] [CrossRef] [PubMed] [Green Version]
- Bigdely-Shamlo, N.; Mullen, T.; Kothe, C.; Su, K.-M.; Robbins, K.A. The PREP Pipeline: Standardized Preprocessing for Large-Scale EEG Analysis. Front. Neuroinform. 2015, 9, 16. [Google Scholar] [CrossRef]
- Pion-Tonachini, L.; Kreutz-Delgado, K.; Makeig, S. ICLabel: An Automated Electroencephalographic Independent Component Classifier, Dataset, and Website. NeuroImage 2019, 198, 181–197. [Google Scholar] [CrossRef] [PubMed] [Green Version]
- Mordkoff, J.T. A Simple Method for Removing Bias from a Popular Measure of Standardized Effect Size: Adjusted Partial Eta Squared. Adv. Methods Pract. Psychol. Sci. 2019, 2, 228–232. [Google Scholar] [CrossRef]
- Shaw, E.P.; Rietschel, J.C.; Shuggi, I.M.; Xu, Y.; Chen, S.; Miller, M.W.; Hatfield, B.D.; Gentili, R.J. Cerebral Cortical Networking for Mental Workload Assessment under Various Demands during Dual-Task Walking. Exp. Brain Res. 2019, 237, 2279–2295. [Google Scholar] [CrossRef]
- Wascher, E.; Heppner, H.; Hoffmann, S. Towards the Measurement of Event-Related EEG Activity in Real-Life Working Environments. Int. J. Psychophysiol. 2014, 91, 3–9. [Google Scholar] [CrossRef]
- Luck, S.J. An Introduction to the Event-Related Potential Technique; MIT Press: Cambridge, MA, USA, 2014. [Google Scholar]
- Stern, J.A.; Skelly, J.J. The Eye Blink and Workload Considerations. Proc. Hum. Factors Soc. Annu. Meet. 1984, 28, 942–944. [Google Scholar] [CrossRef]
- Veltman, J.A.; Gaillard, A.W.K.; Veltman, J.A.; Gaillard, A.W.K. Physiological Workload Reactions to Increasing Levels of Task Difficulty. Ergonomics. Ergonomics 1998, 41, 656–669. [Google Scholar] [CrossRef]
- Hülsdünker, T.; Mierau, A.; Neeb, C.; Kleinöder, H.; Strüder, H.K. Cortical Processes Associated with Continuous Balance Control as Revealed by EEG Spectral Power. Neurosci. Lett. 2015, 592, 1–5. [Google Scholar] [CrossRef]
- Wittenberg, E.; Thompson, J.; Nam, C.S.; Franz, J.R. Neuroimaging of Human Balance Control: A Systematic Review. Front. Hum. Neurosci. 2017, 11, 170. [Google Scholar] [CrossRef] [PubMed] [Green Version]
- Getzmann, S.; Golob, E.J.; Wascher, E. Focused and Divided Attention in a Simulated Cocktail-Party Situation: ERP Evidence from Younger and Older Adults. Neurobiol. Aging 2016, 41, 138–149. [Google Scholar] [CrossRef]
- Zeki, S. Area V5—A Microcosm of the Visual Brain. Front. Integr. Neurosci. 2015, 9, 21. [Google Scholar] [CrossRef] [PubMed]
- Uusitalo, M.A.; Virsu, V.; Salenius, S.; Näsänen, R.; Hari, R. Activation of Human V5 Complex and Rolandic Regions in Association with Moving Visual Stimuli. NeuroImage 1997, 5, 241–250. [Google Scholar] [CrossRef] [PubMed]
- Sterman, M.B.; Mann, C.A.; Kaiser, D.A.; Kuninobu, B.Y. Multiband Topographic EEG Analysis of a Simulated Visuomotor Aviation Task. Int. J. Psychophysiol. 1994, 16, 49–56. [Google Scholar] [CrossRef]
- Fink, A.; Grabner, R.H.; Neuper, C.; Neubauer, A.C. EEG Alpha Band Dissociation with Increasing Task Demands. Cogn. Brain Res. 2005, 24, 252–259. [Google Scholar] [CrossRef]
- Hanslmayr, S.; Staudigl, T.; Fellner, M.-C. Oscillatory Power Decreases and Long-Term Memory: The Information via Desynchronization Hypothesis. Front. Hum. Neurosci. 2012, 6, 74. [Google Scholar] [CrossRef] [Green Version]


Publisher’s Note: MDPI stays neutral with regard to jurisdictional claims in published maps and institutional affiliations. |
© 2022 by the authors. Licensee MDPI, Basel, Switzerland. This article is an open access article distributed under the terms and conditions of the Creative Commons Attribution (CC BY) license (https://creativecommons.org/licenses/by/4.0/).
Share and Cite
Wascher, E.; Arnau, S.; Gutberlet, M.; Chuang, L.L.; Rinkenauer, G.; Reiser, J.E. Visual Demands of Walking Are Reflected in Eye-Blink-Evoked EEG-Activity. Appl. Sci. 2022, 12, 6614. https://doi.org/10.3390/app12136614
Wascher E, Arnau S, Gutberlet M, Chuang LL, Rinkenauer G, Reiser JE. Visual Demands of Walking Are Reflected in Eye-Blink-Evoked EEG-Activity. Applied Sciences. 2022; 12(13):6614. https://doi.org/10.3390/app12136614
Chicago/Turabian StyleWascher, Edmund, Stefan Arnau, Marie Gutberlet, Lewis L. Chuang, Gerhard Rinkenauer, and Julian Elias Reiser. 2022. "Visual Demands of Walking Are Reflected in Eye-Blink-Evoked EEG-Activity" Applied Sciences 12, no. 13: 6614. https://doi.org/10.3390/app12136614