
Calculation of the Rearfoot Angle Representing Flatfoot from Comparison to the Cavanagh Arch Index


 ,
,
Abstract
:1. Introduction
2. Materials and Methods
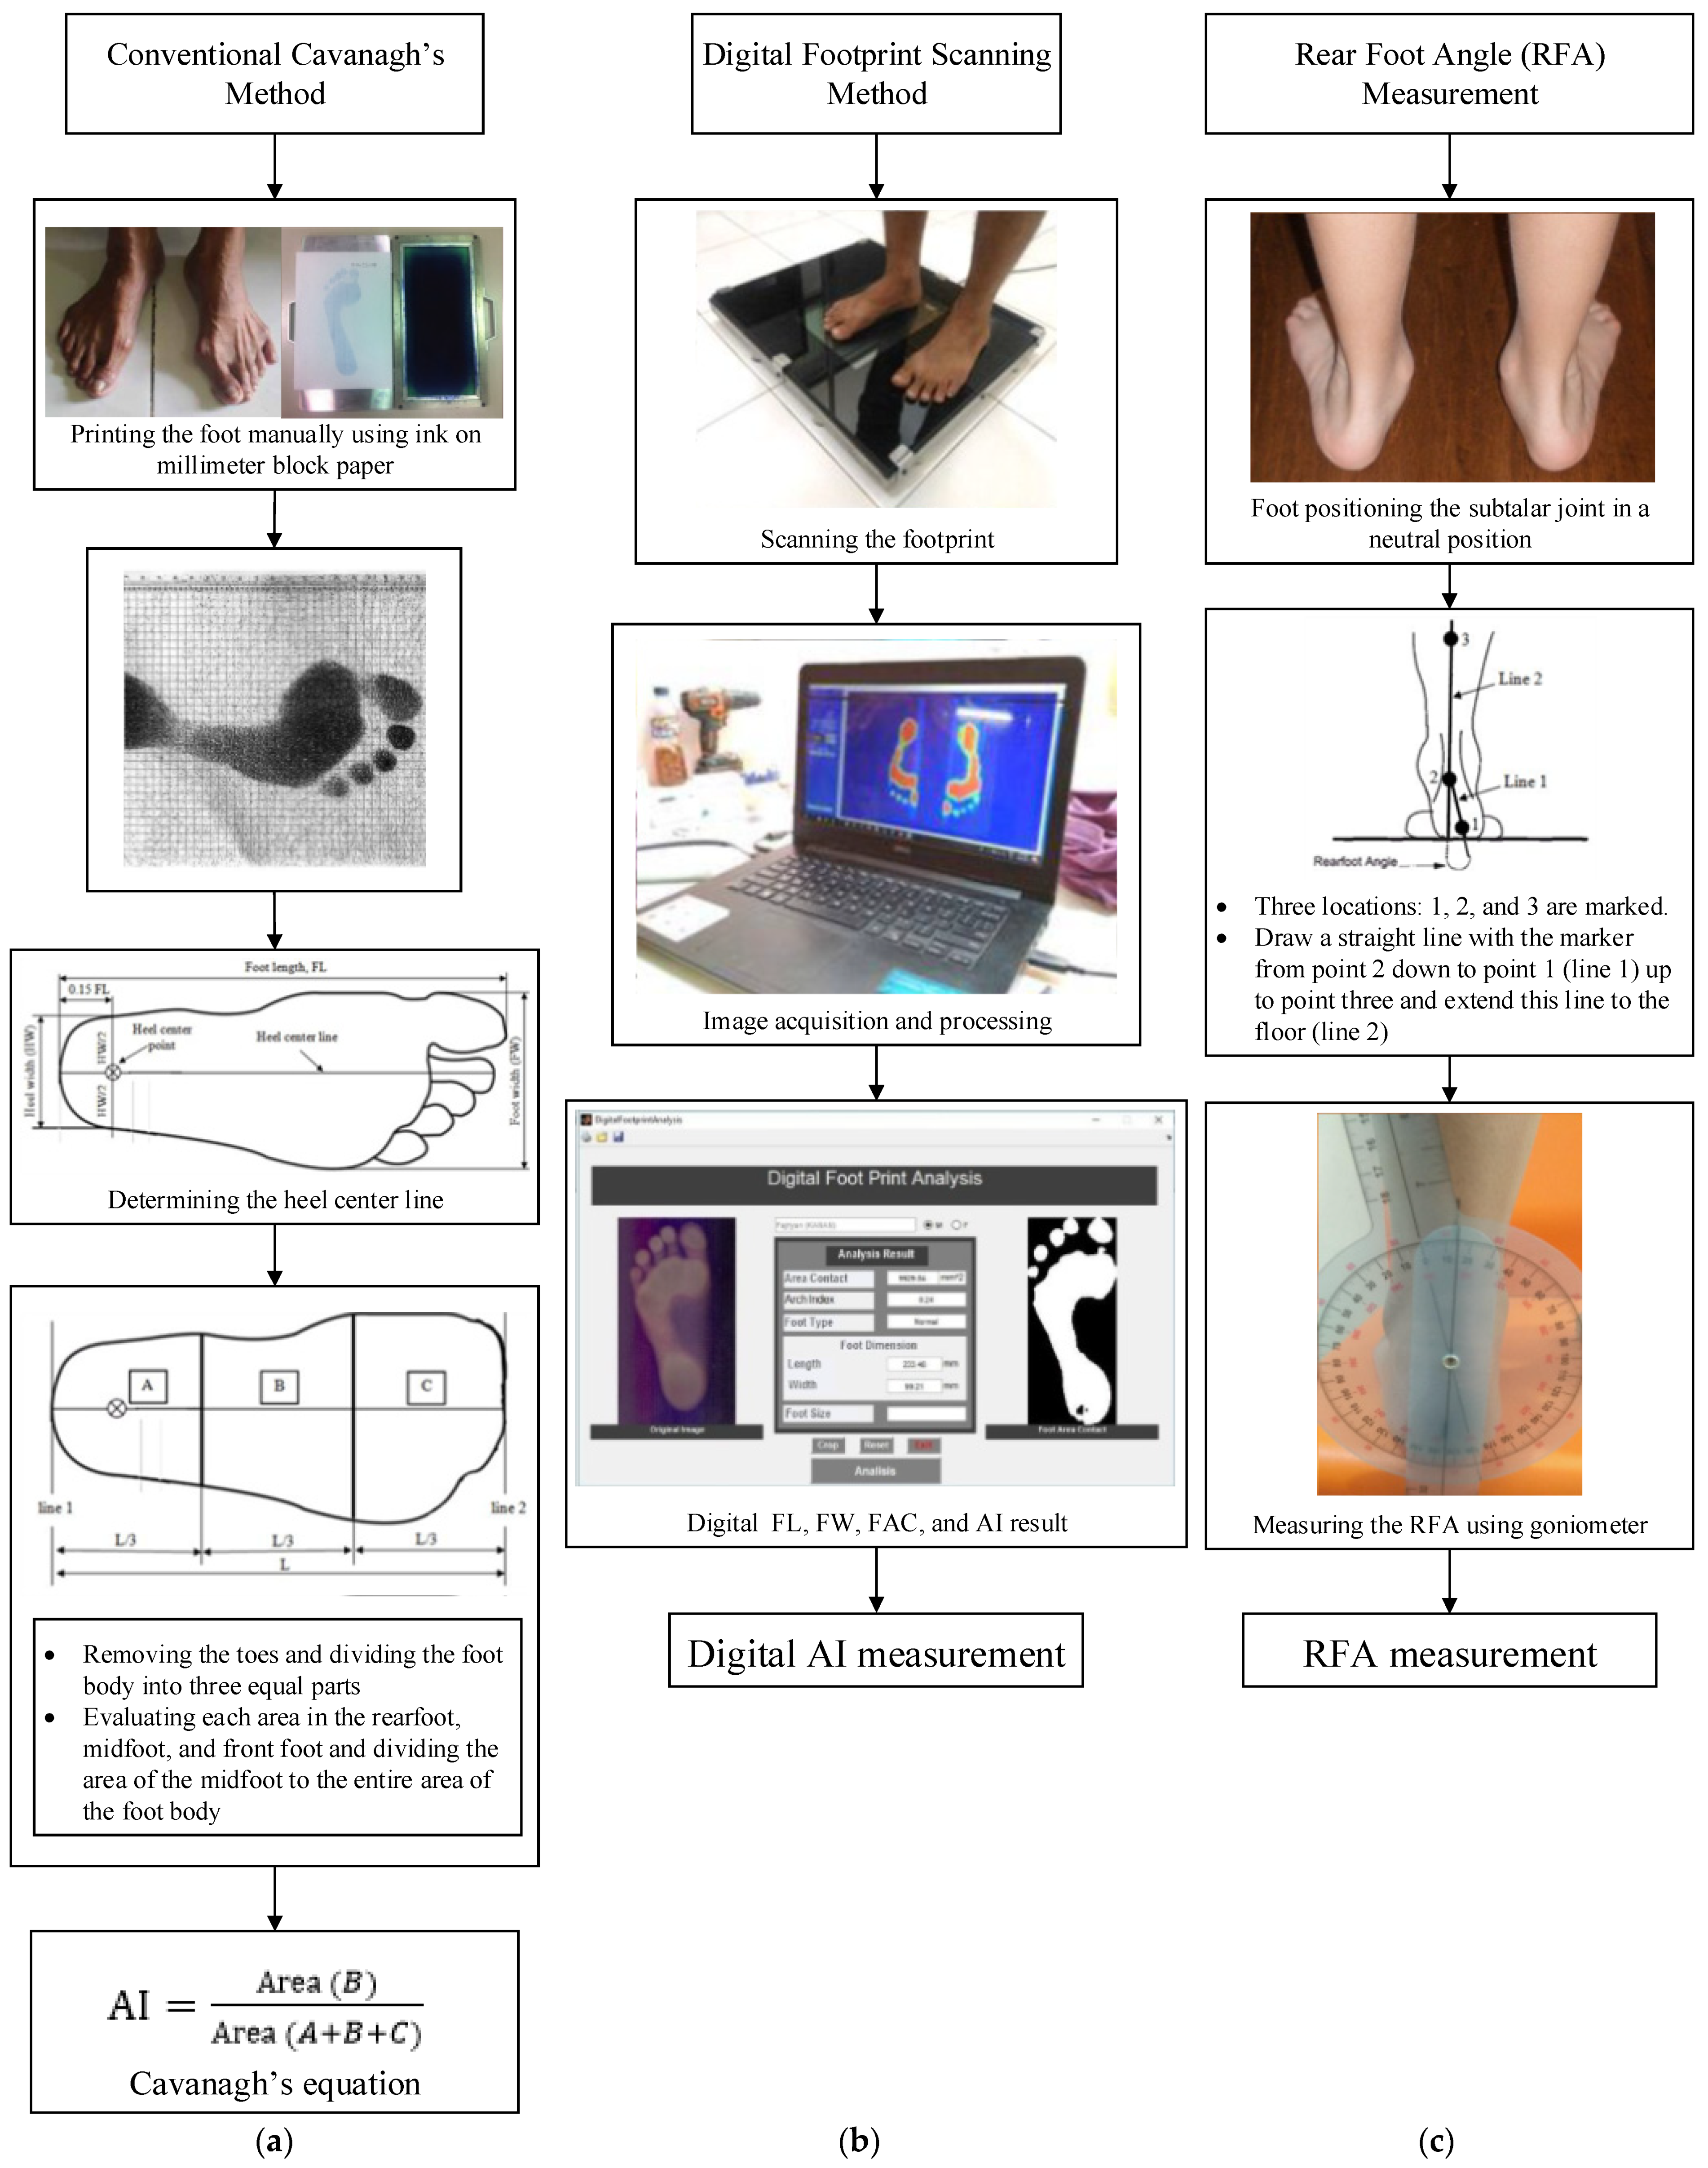
2.1. Conventional Cavanagh’s AI Measurement Method
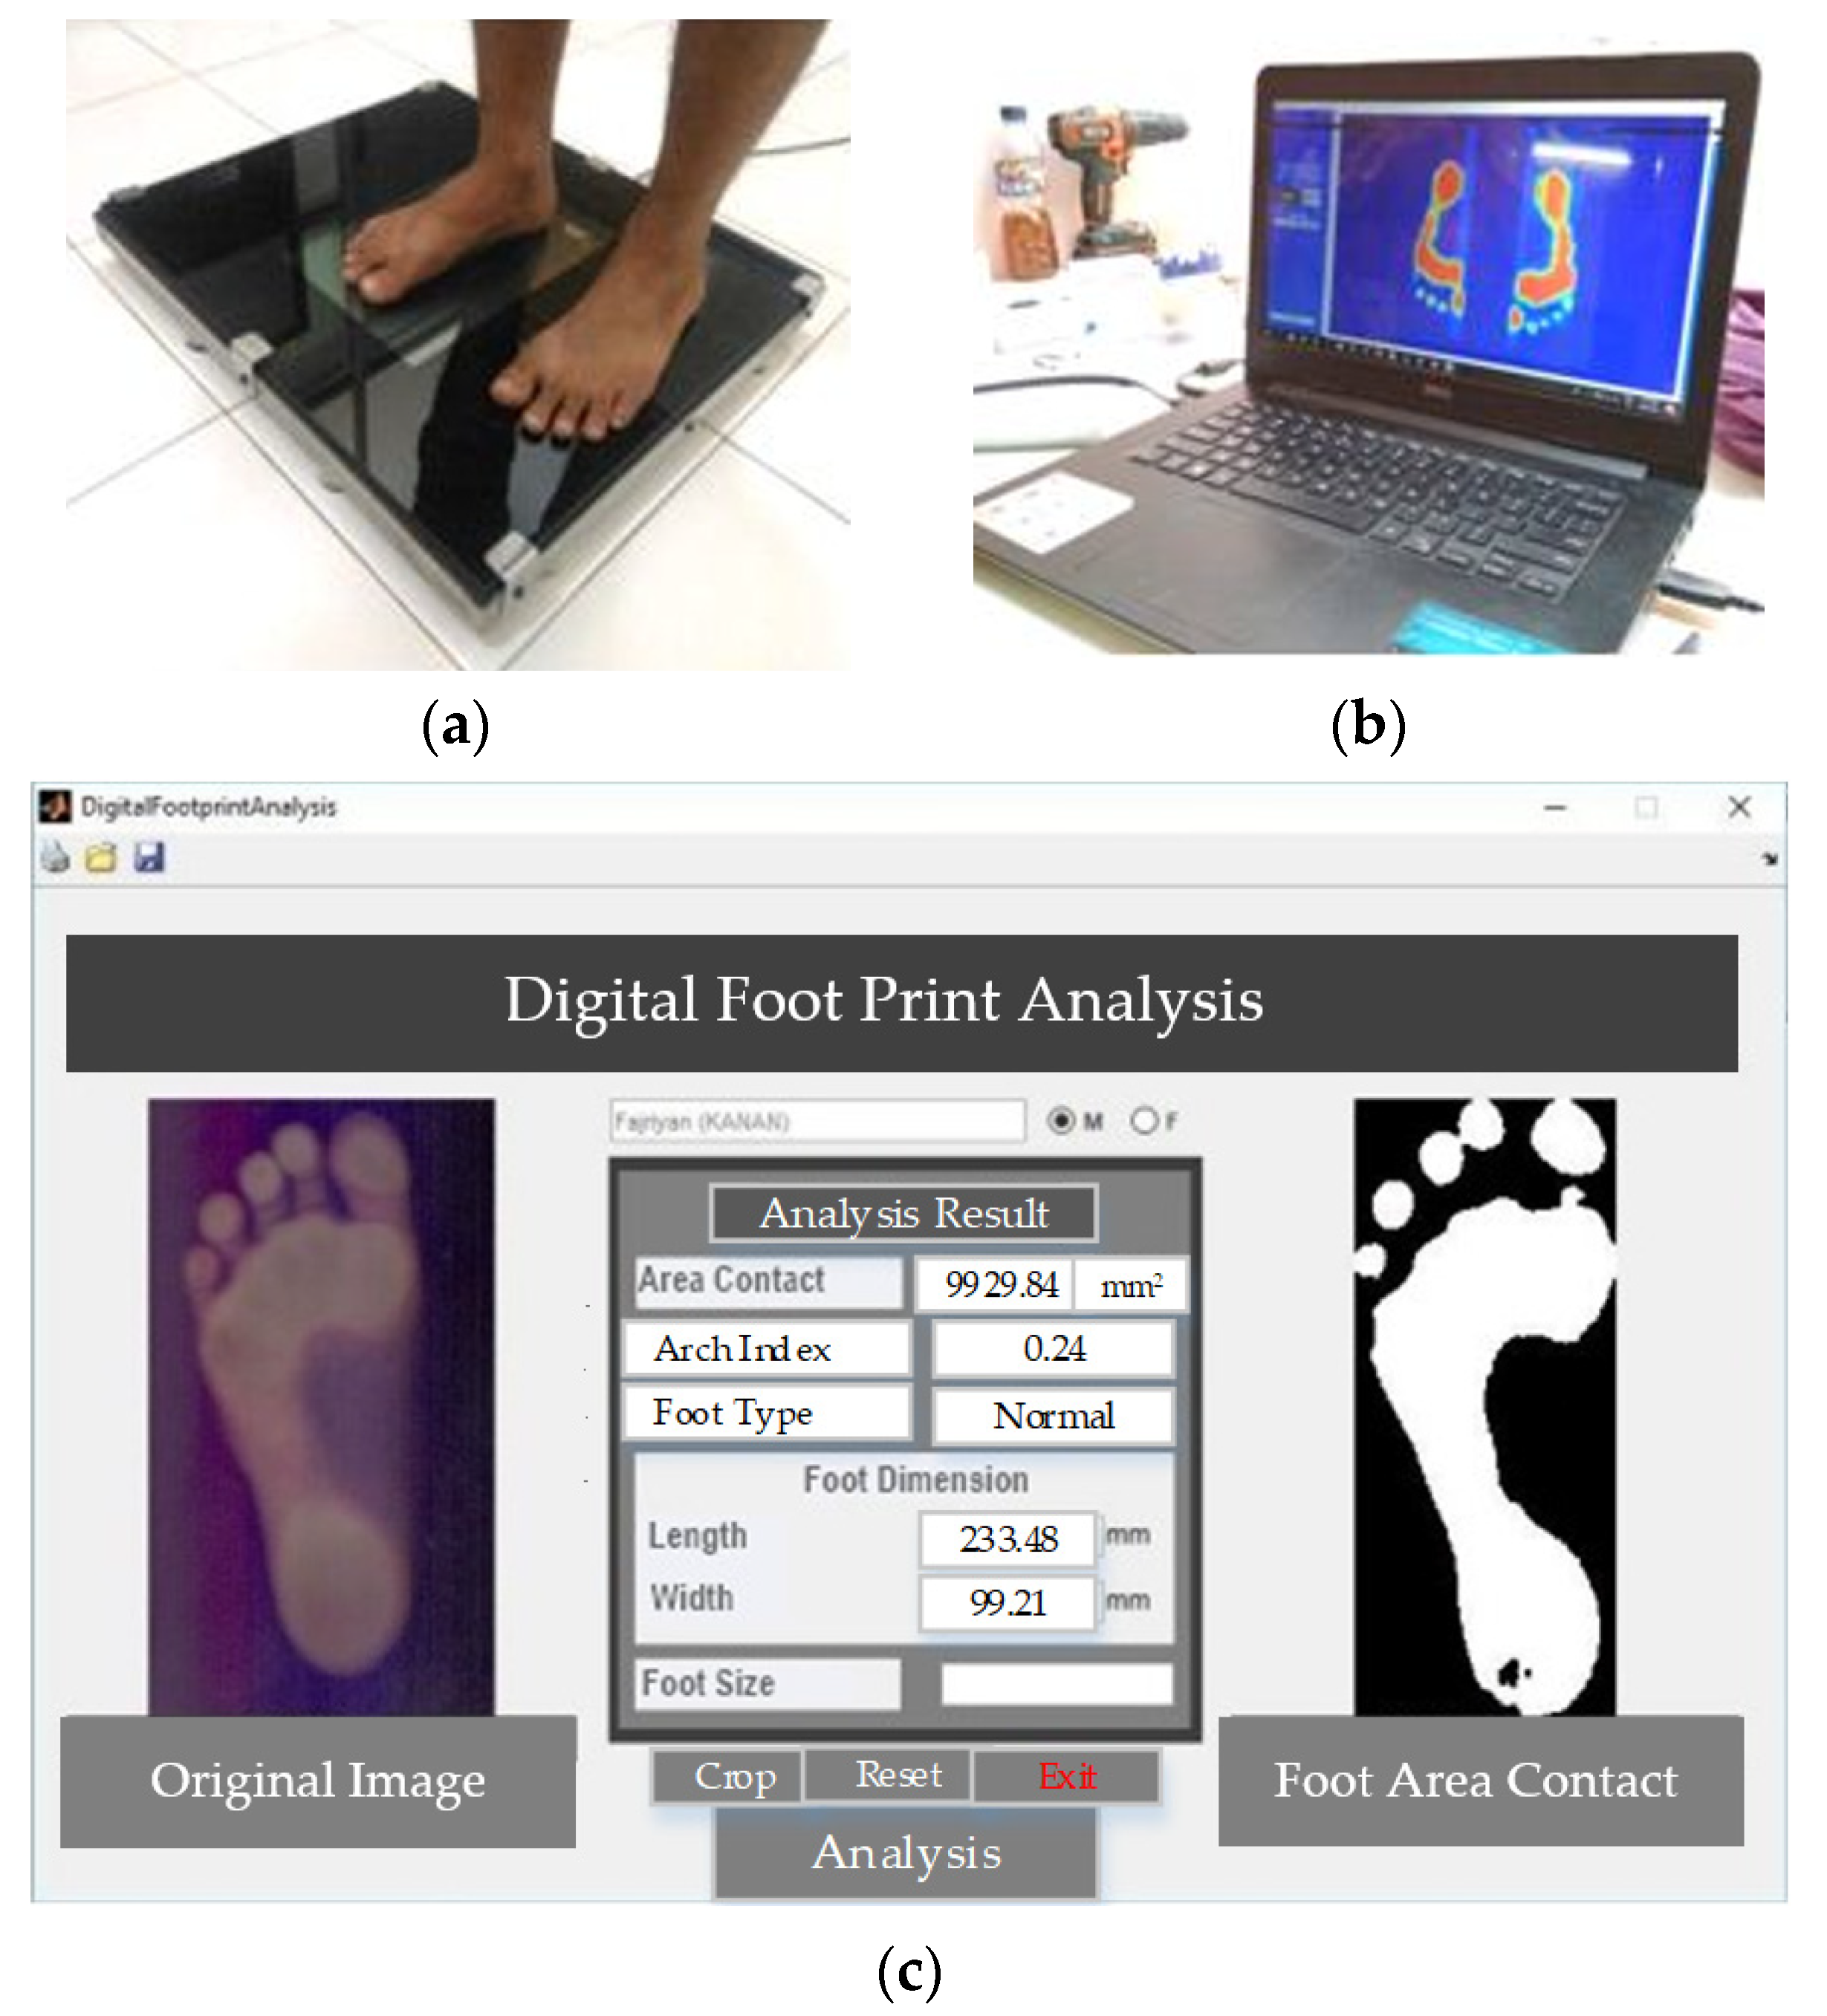
2.2. Digital AI Measurement Method
2.3. Rearfoot Angle (RFA) Measurement
2.4. Research Subjects
3. Results
3.1. General Statistical Results
3.2. Correlation Results between Subject Characteristics and Cavanagh’s AI
3.3. Correlation Results of Arc Index (AI) and Rear Foot Angle (RFA)
4. Discussion
5. Conclusions
Author Contributions
Funding
Institutional Review Board Statement
Acknowledgments
Conflicts of Interest
Appendix A

| No. | Gender (M/F) | Age (yr) | Weight (kg) | Height (cm) | BMI (kg/m2) | Foot Width (mm) | Foot Length (mm) | Foot | FAC (mm2) | Arch Index (AI) | RFA (°) | |||||
|---|---|---|---|---|---|---|---|---|---|---|---|---|---|---|---|---|
| Left | Right | Left | Right | Size | Left | Right | Left | Right | Left | Right | ||||||
| 1 | M | 22 | 66 | 164 | 24.5 | 97.18 | 99.08 | 249.49 | 252.41 | 41 | 15,943.3 | 15,943.3 | 0.43 | 0.45 | 16.0 | 16 |
| 2 | M | 21 | 61 | 166 | 22.1 | 105.53 | 107.72 | 247.16 | 244.41 | 40 | 10,829 | 10,829 | 0.27 | 0.31 | 12.0 | 12 |
| 3 | M | 21 | 59 | 168 | 20.9 | 96.54 | 96.04 | 250.13 | 248.22 | 40 | 10,807.45 | 10,807.45 | 0.32 | 0.34 | 10.0 | 9 |
| 4 | M | 22 | 57 | 158 | 22.8 | 98.45 | 97.43 | 221.29 | 226.88 | 37 | 11,066.8 | 11,066.8 | 0.31 | 0.30 | 9.0 | 9 |
| 5 | M | 22 | 68 | 172 | 23.0 | 97.56 | 98.83 | 264.73 | 264.1 | 42 | 14,331.5 | 14,331.5 | 0.42 | 0.41 | 14.0 | 14 |
| 6 | M | 20 | 62 | 161 | 23.9 | 94.77 | 95.53 | 232.85 | 234.37 | 39 | 14,847.6 | 14,847.6 | 0.36 | 0.37 | 10.0 | 11 |
| 7 | M | 21 | 68 | 171 | 23.3 | 102.3 | 102.35 | 247.58 | 252.37 | 41 | 10,812.4 | 10,812.4 | 0.33 | 0.33 | 12.0 | 12 |
| 8 | M | 22 | 55 | 159 | 21.8 | 94.13 | 94.08 | 229.17 | 226.69 | 37 | 10,702.4 | 10,702.4 | 0.26 | 0.27 | 6.0 | 6 |
| 9 | M | 22 | 55 | 151 | 24.1 | 88.03 | 85.62 | 211.51 | 217.86 | 36 | 11,660 | 11,660 | 0.26 | 0.28 | 5.5 | 6 |
| 10 | M | 22 | 56 | 156 | 23.0 | 88.92 | 86.38 | 231.58 | 225.86 | 37 | 11,634.1 | 11,634.1 | 0.32 | 0.23 | 7.0 | 4 |
| 11 | M | 22 | 58 | 157 | 23.5 | 85.24 | 87.4 | 230.05 | 223.96 | 37 | 11,858.7 | 11,858.7 | 0.30 | 0.27 | 6.0 | 5 |
| 12 | M | 22 | 76 | 173 | 25.4 | 103.53 | 96.93 | 247.71 | 246.95 | 41 | 16,668.8 | 16,668.8 | 0.35 | 0.36 | 10.0 | 11 |
| 13 | M | 22 | 56 | 162 | 21.3 | 98.58 | 94.13 | 242.76 | 246.31 | 40 | 11,881.03 | 11,881.03 | 0.31 | 0.30 | 7.0 | 6 |
| 14 | M | 23 | 58 | 167 | 20.8 | 102.01 | 97.05 | 246.95 | 245.81 | 40 | 10,179.8 | 10,179.8 | 0.38 | 0.28 | 8.0 | 8 |
| 15 | F | 22 | 70 | 170 | 24.2 | 95.15 | 95.15 | 236.66 | 236.66 | 40 | 11,016.22 | 11,016.22 | 0.37 | 0.37 | 10.0 | 9 |
| 16 | F | 22 | 49 | 157 | 19.9 | 108.74 | 95.15 | 232.09 | 229.17 | 37 | 10,690.7 | 10,690.7 | 0.38 | 0.38 | 10.0 | 10 |
| 17 | F | 21 | 62 | 170 | 21.5 | 101.24 | 101.24 | 247.08 | 247.08 | 41 | 9083.65 | 9083.65 | 0.39 | 0.39 | 9.0 | 9 |
| 18 | F | 21 | 60 | 167 | 21.5 | 93.75 | 90.7 | 235.14 | 235.39 | 40 | 11,222.1 | 11,222.1 | 0.39 | 0.37 | 7.0 | 8 |
| 19 | F | 21 | 51 | 158 | 20.4 | 92.86 | 89.94 | 227.77 | 225.35 | 37 | 9440.3 | 9440.3 | 0.41 | 0.42 | 15.0 | 15 |
| 20 | F | 22 | 55 | 161 | 21.2 | 83.84 | 87.14 | 218.24 | 222.31 | 36 | 9672.23 | 9672.23 | 0.27 | 0.29 | 4.5 | 6.5 |
| 21 | F | 20 | 59 | 159 | 23.3 | 96.93 | 99.85 | 244.15 | 239.71 | 40 | 12,478.3 | 12,478.3 | 0.33 | 0.37 | 7.1 | 7.1 |
| 22 | F | 20 | 56 | 172 | 18.9 | 89.56 | 119.79 | 247.71 | 245.17 | 40 | 9932.19 | 9932.19 | 0.33 | 0.30 | 7.0 | 7 |
| 23 | F | 19 | 53 | 156 | 21.8 | 95.15 | 94.51 | 229.17 | 227.39 | 38 | 11,104.5 | 11,104.5 | 0.40 | 0.41 | 8.5 | 11.5 |
| 24 | F | 18 | 44 | 151 | 19.3 | 95.78 | 121.57 | 218.49 | 215.45 | 36 | 9756 | 9756 | 0.42 | 0.41 | 12.0 | 12 |
| 25 | F | 19 | 61 | 153 | 26.1 | 97.18 | 92.1 | 223.58 | 227.77 | 36 | 13,554.2 | 13,554.2 | 0.42 | 0.42 | 13.0 | 12.5 |
| 26 | F | 18 | 61 | 165 | 22.4 | 91.97 | 142.4 | 245.55 | 260.29 | 40 | 13,058.4 | 13,058.4 | 0.40 | 0.40 | 11.0 | 11 |
| 27 | F | 22 | 51 | 153 | 21.8 | 92.99 | 91.97 | 217.61 | 218.24 | 36 | 10,319.79 | 10,319.79 | 0.37 | 0.40 | 12.5 | 11.5 |
| 28 | F | 25 | 60 | 166 | 21.8 | 102.51 | 102.64 | 245.81 | 245.55 | 40 | 11,391.9 | 11,391.9 | 0.29 | 0.36 | 7.8 | 7.8 |
| 29 | F | 21 | 54 | 156 | 22.2 | 86.76 | 90.19 | 235.26 | 232.34 | 39 | 10,896.03 | 10,896.03 | 0.37 | 0.33 | 12.0 | 12.5 |
| 30 | F | 22 | 50 | 163 | 18.8 | 95.15 | 98.2 | 246.95 | 243.01 | 40 | 9280.07 | 9280.07 | 0.31 | 0.34 | 12.0 | 11 |
| 31 | F | 22 | 57 | 162 | 21.7 | 92.99 | 92.99 | 234.12 | 234.5 | 39 | 10,495.3 | 10,495.3 | 0.43 | 0.34 | 15.0 | 11 |
References
- Yung-Hui, L.; Wei-Hsien, H. Effects of shoe inserts and heel height on foot pressure, impact force, and perceived comfort during walking. Appl. Ergon. 2005, 36, 335–362. [Google Scholar] [CrossRef] [PubMed]
- Orr, J.D.; Nunley, J.A. Isolated Spring Ligament Failure as a Cause of Adult-Acquired Flatfoot Deformity. Foot Ankle Int. 2013, 34, 818–823. [Google Scholar] [CrossRef] [PubMed]
- Vulcano, E.; Deland, J.T.; Ellis, S.J. Approach and treatment of the adult acquired flatfoot deformity. Curr. Rev. Musculoskelet. Med. 2013, 6, 294–303. [Google Scholar] [CrossRef] [Green Version]
- Irving, D.B.; Cook, J.L.; A Young, M.; Menz, H.B. Obesity and pronated foot type may increase the risk of chronic plantar heel pain: A matched case-control study. BMC Musculoskelet. Disord. 2007, 8, 41. [Google Scholar] [CrossRef] [PubMed] [Green Version]
- Wearing, S.C.; Smeathers, J.E.; Urry, S.R. The Effect of Plantar Fasciitis on Vertical Foot-Ground Reaction Force. Clin. Orthop. Relat. Res. 2003, 409, 175–185. [Google Scholar] [CrossRef] [PubMed]
- Atik, A.; Ozyurek, S. Flexible flatfoot. North. Clin. Istanb. 2014, 1, 57–64. [Google Scholar] [CrossRef] [PubMed]
- Kenneth, H.; Noll, C.O. The use of orthotic devices in adult-acquired flatfoot deformity. Foot Ankle Clin. 2001, 6, 1. [Google Scholar]
- Cavanagh, P.R.; Rodgers, M.M. The arch index: A useful measure from footprints. J. Biomech. 1987, 20, 547–551. [Google Scholar] [CrossRef]
- Pauk, J.; Ihnatouski, M.; Najafi, B. Assessing Plantar Pressure Distribution in Children with Flatfoot Arch. J. Am. Podiatr. Med. Assoc. 2014, 104, 622–632. [Google Scholar] [CrossRef] [PubMed]
- Tashiro, Y.; Fukumoto, T.; Uritani, D.; Matsumoto, D.; Nishigucki, S.; Fukutani, N.; Adachi, D.; Hotta, T.; Morina, S.; Shirooka, H.; et al. Children with flat feet have weaker to grip strength than those having a normal arch. J. Phys. Ther. Sci. 2015, 27, 3533–3536. [Google Scholar] [CrossRef]
- Chen, K.-C.; Tung, L.-C.; Tung, C.-H.; Yeh, C.-J.; Yang, J.-F.; Wang, C.-H. An investigation of the factors affecting flatfoot in children with delayed motor development. Res. Dev. Disabil. 2014, 35, 639–645. [Google Scholar] [CrossRef] [PubMed]
- Sobel, E.; Levitz, S.; Caselli, M.; Brentnall, Z.; Tran, M.Q. Natural history of the rearfoot angle: Preliminary values in 150 children. Foot Ankle Int. 1999, 20, 119–125. [Google Scholar] [CrossRef]
- Hunt, A.E.; Fahey, A.J.; Smith, R.M. Static measures of calcaneal deviation and arch angle as predictors of rearfoot motion during walking. Aust. J. Physiother. 2000, 46, 9–16. [Google Scholar] [CrossRef]
- Pita-Fernandez, S.; Gonzalez-Martin, C.; Alonso-Tajes, F.; Seoane-Pillado, T.; Pertega-Diaz, S.; Perez-Garcia, S.; Seijo-Bestilleiro, R.S.; Balboa-Barreiore, V. Flatfoot in a Random Population and its Impact on Quality of Life and Functionality. J. Clin. Diagn. Res. 2017, 11, LC22–LC27. [Google Scholar]
- MATLAB. Release R2021a; The MathWorks Inc.: Natick, MA, USA, 2021. [Google Scholar]
- Rodrigo, A.S.; Goonetilleke, R.S.; Xiong, S. Load distribution to minimize pressure-related pain on foot: A model. Ergonomics 2013, 56, 1180–1193. [Google Scholar] [CrossRef] [PubMed]
- Haryadi, G.D.; Wibowo, D.B.; Ariyanto, M.; Suprihanto, A. Digital Scanning Method for Evaluation of Dimensional Parameters and Identification of Foot Type. Indonesian Patent No. IDS000002253, 2 April 2019. [Google Scholar]
- Wibowo, D.B.; Widodo, A.; Haryadi, G.D.; Caesarendra, W.; Harahap, R. Effect of in-shoe foot orthosis contours on heel pain due to calcaneal spurs. Appl. Sci. 2019, 9, 495. [Google Scholar] [CrossRef] [Green Version]
- Maiwald, C.; Grau, S.; Krauss, I.; Mauch, M.; Axmann, D.; Horstmann, T. Reproducibility of plantar pressure distribution data in barefoot running. J. Appl. Biomech. 2008, 24, 14–23. [Google Scholar] [CrossRef]
- Mathieson, I.; Upton, D.; Birchenough, A. Comparison of footprint parameters calculated from static and dynamic footprints. Foot 1999, 9, 145–149. [Google Scholar] [CrossRef]
- Wibowo, D.B.; Suprihanto, A.; Haryanto, I. Body Mass Index Measurement Tool with Software to Evaluate Ideal Body Weight. Indonesian Patent No. IDS000002589, 4 October 2019. [Google Scholar]
- WHOIASO/IOTF. The Asia-Pacific Perspective: Redefining Obesity and Its Treatment; Health Communications Australia Pty Ltd.: Balmain, Australia, 2000. [Google Scholar]
- Abtahian, A.; Farzan, S. A study of the prevalence of flatfoot in high school children. Biomed. Res. 2016, 27, 1295–1301. [Google Scholar]
- Vijayakumar, K.; Kumar, S.; Subramanian, R. A study on Relationship between BMI and prevalence of flatfoot among the adults using footprint parameters. Int. J. Adv. Res. 2016, 4, 1428–1431. [Google Scholar] [CrossRef] [Green Version]
- Wunderlich, R.E.; Cavanagh, P.R. Gender differences in adult foot shape: Implications for shoe design. Med. Sci. Sports Exerc. 2001, 33, 605–611. [Google Scholar] [CrossRef] [PubMed]
- Telfer, S.; Woodburn, J. The use of 3D surface scanning for the measurement and assessment of the human foot. J. Foot Ankle Res. 2010, 3, 19. [Google Scholar] [CrossRef] [PubMed] [Green Version]
- Wibowo, D.B.; Haryadi, G.D.; Widodo, A.; Rahayu, S.P. Correlation of loaded and unloaded foot area with arch index in younger flatfoot. MATEC Web Conf. 2017, 135, 00060. [Google Scholar] [CrossRef] [Green Version]


| Variable | Left Foot | Right Foot | Male | Female | All Subjects | |||||
|---|---|---|---|---|---|---|---|---|---|---|
| Mean ± SD | Median | Mean ± SD | Median | Mean ± SD | Median | Mean ± SD | Median | Mean ± SD | Median | |
| Age (year) | 21.8 ± 0.7 | 22.0 | 20.9 ± 1.8 | 21.0 | 21.3 ± 1.5 | 22.0 | ||||
| BMI (kg/m2) | 22.7 ± 1.2 | 23.0 | 21.4 ± 1.6 | 21.7 | 22.0 ± 1.5 | 21.8 | ||||
| FL (mm) | 236.7 ± 12.3 | 235.3 | 236.8 ± 12.6 | 235.4 | 239.6 ± 13.7 | 245.2 | 234.4 ± 0.9 | 234.3 | 236.8 ± 12.3 | 235.3 |
| FW (mm) | 95.7 ± 5.9 | 95.2 | 95.6 ± 7.1 | 95.2 | 96.1 ± 5.9 | 97.2 | 95.2 ± 5.9 | 94.6 | 95.6 ± 5.8 | 95.2 |
| FAC (mm2) | 11,504 ± 1874 | 11016 | 11,504 ± 1874 | 11,016 | 12,373 ± 2136 | 11,647 | 10,788 ± 1293 | 10,691 | 11,504 ± 1874 | 11,016 |
| AI | 0.35 ± 0.04 | 0.36 | 0.35 ± 0.06 | 0.36 | 0.33 ± 0.05 | 0.32 | 0.37 ± 0.04 | 0.38 | 0.35 ± 0.05 | 0.35 |
| RFA (o) | 9.9 ± 3.5 | 10.0 | 9.6 ± 3.4 | 9.0 | 8.6 ± 3.4 | 9.0 | 10.7 ± 3.1 | 10.5 | 9.7 ± 3.4 | 9.5 |
| Degree of Flatfoot | Number of Subjects | Gender (Male/Female) | AI Range | RFA Range (o) |
|---|---|---|---|---|
| Minor | 6 (19.4%) | 5/1 | 0.26–0.29 | 5.8–7.2 |
| Moderate | 8 (25.8%) | 5/3 | 0.3–0.33 | 7.2–9.1 |
| Severe | 3 (9.7%) | 1/2 | 0.34–0.36 | 9.1–10.4 |
| Worst | 14 (45.1%) | 3/11 | 0.37–0.39 | 10.5–11.3 |
| Source of Variation | SS | df | MS | F | p-Value | F Crit |
|---|---|---|---|---|---|---|
| Between Groups | 1301.352 | 1 | 1301.352 | 315.9038 | 3.83 × 10⁻²⁵ | 4.006873 |
| Within Groups | 238.9285 | 58 | 4.119458 | |||
| Total | 1540.281 | 59 |
| Source of Variation | SS | df | MS | F | p-Value | F Crit |
|---|---|---|---|---|---|---|
| Between Groups | 1260.875 | 1 | 1260.875 | 327.2441 | 1.61 × 10⁻²⁵ | 4.006873 |
| Within Groups | 223.4746 | 58 | 3.853011 | |||
| Total | 1484.35 | 59 |
| 0.43 | 16 | |
|---|---|---|
| Mean | 0.349 | 9.663333 |
| Variance | 0.00272 | 8.236195 |
| Observations | 30 | 30 |
| Hypothesized Mean Difference | 0 | |
| df | 29 | |
| t Stat | −17.7737 | |
| P(T ≤ t) one-tail | 1.96 × 10⁻¹⁷ | |
| t Critical one-tail | 1.699127 |
| 0.45 | 16 | |
|---|---|---|
| Mean | 0.345 | 9.513333 |
| Variance | 0.002757 | 7.703264 |
| Observations | 30 | 30 |
| Hypothesized Mean Difference | 0 | |
| df | 29 | |
| t Stat | −18.0899 | |
| P(T ≤ t) one-tail | 1.22 × 10⁻¹⁷ | |
| t Critical one-tail | 1.699127 |
Publisher’s Note: MDPI stays neutral with regard to jurisdictional claims in published maps and institutional affiliations. |
© 2022 by the authors. Licensee MDPI, Basel, Switzerland. This article is an open access article distributed under the terms and conditions of the Creative Commons Attribution (CC BY) license (https://creativecommons.org/licenses/by/4.0/).
Share and Cite
Umardani, Y.; Wibowo, D.B.; Caesarendra, W.; Suprihanto, A.; Pranoto, K.A. Calculation of the Rearfoot Angle Representing Flatfoot from Comparison to the Cavanagh Arch Index. Appl. Sci. 2022, 12, 6764. https://doi.org/10.3390/app12136764
Umardani Y, Wibowo DB, Caesarendra W, Suprihanto A, Pranoto KA. Calculation of the Rearfoot Angle Representing Flatfoot from Comparison to the Cavanagh Arch Index. Applied Sciences. 2022; 12(13):6764. https://doi.org/10.3390/app12136764
Chicago/Turabian StyleUmardani, Yusuf, Dwi Basuki Wibowo, Wahyu Caesarendra, Agus Suprihanto, and Kirana Astari Pranoto. 2022. "Calculation of the Rearfoot Angle Representing Flatfoot from Comparison to the Cavanagh Arch Index" Applied Sciences 12, no. 13: 6764. https://doi.org/10.3390/app12136764
APA StyleUmardani, Y., Wibowo, D. B., Caesarendra, W., Suprihanto, A., & Pranoto, K. A. (2022). Calculation of the Rearfoot Angle Representing Flatfoot from Comparison to the Cavanagh Arch Index. Applied Sciences, 12(13), 6764. https://doi.org/10.3390/app12136764