Article

Nanomechanical, Structural and Antioxidant Characterization of Nixtamalized Popcorn Pericarp

by
Liliana Edith Rojas-Candelas
1,
Mayra Díaz-Ramírez
1,*,
Adolfo Armando Rayas-Amor
1,
Rosy Gabriela Cruz-Monterrosa
1,
Juan Vicente Méndez-Méndez
2,
Adriana Villanueva-Carvajal
3 and
Alejandro de Jesús Cortés-Sánchez
4
1
Departamento de Ciencias de la Alimentación, División de Ciencias Biológicas y de la Salud, Universidad Autónoma Metropolitana Unidad Lerma, Av. de las Garzas No. 10, Col. El Panteón, Lerma de Villada C.P. 52005, Estado de México, Mexico
2
Centro de Nanociencias y Micro y Nanotecnologías, Instituto Politécnico Nacional, Luis Enrique Erro s/n, Zacatenco, Gustavo A. Madero, Ciudad Mexico C.P. 07738, Mexico
3
Facultad de Ciencias Agrícolas, Universidad Autónoma del Estado de México, Campus Universitario “El Cerrillo” A.P. 435, Toluca C.P. 50200, Estado de México, Mexico
4
Consejo Nacional de Ciencia y Tecnología (CONACYT), Unidad Nayarit del Centro de Investigaciones Biológicas del Noroeste (UNCIBNOR+), Calle Dos No. 23. Cd. del Conocimiento, Av. Emilio M. González, Cd. Industrial, Tepic C.P. 63173, Nayarit, Mexico
*
Author to whom correspondence should be addressed.
Appl. Sci. 2022, 12(13), 6789; https://doi.org/10.3390/app12136789
Submission received: 8 June 2022 / Revised: 22 June 2022 / Accepted: 23 June 2022 / Published: 4 July 2022
(This article belongs to the Special Issue New Trends in the Structure Characterization of Food)

Abstract

:
Expanded popcorn grain is widely consumed as a healthy snack all around the world; however, the study of the behavior of its components by processes such as nixtamalization is scarce. Therefore, the aim of this work was to characterize the nanomechanical, structural, and antioxidant properties of nixtamalized popcorn grain pericarp. FT-IR results showed that the secondary structure of proteins of the nixtamalized pericarp was α-helix with 42.10%, the turn was 21.5% and 36.33% β-sheet, and proteins of the pericarp did not present the random coil structure. Pericarp showed antioxidant activity, as their values were 550.1 ± 2.9 and 44.2 ± 1.6 (TE)/mL for ABTS and DPPH, respectively; total phenols content was 0.21 ± 0.008 (TE)/mL; reducing power values were around 29 to 31%; hydroxyl radical scavenging ranged from 36 to 55% and iron chelation around 115 to 140% compared to the standard acids. Thickness values of the nixtamalized pericarp by SEM image analysis were 0.15 ± 0.1 mm near the pedicel inferior tip, 0.07 ± 0.01 mm at middle, and 0.03 ± 0.02 mm at upper of the grain. Young’s modulus value was 261.72 ± 23.58 MPa with a Gaussian function fitting at the distribution of all values. This research provides novel and valuable information for understanding the nanomechanical and protein arrangement, as well as and the antioxidant activity of nixtamalized popcorn grain pericarp in order to promote other processes and uses for this kind of pericarp maize.

1. Introduction

Popcorn grain is composed by endosperm (83%), germ (11%), pedicel (1%), and pericarp (3.4 to 9.5%). The pericarp contains hemicellulose (67%), cellulose (23%), starch (7%), proteins (1.4%), lipids (1%), lignin (0.1%), and sugars (0.5%) [1]. In addition, it contains phenolic acids such as ferulic acid. It is recognized that the pericarp of popcorn grain is strongly linked to the expansion process, the nutritional quality, and the sensory properties of popcorn kernels [2]; and the antioxidant activity varies significantly with the color of the pericarp and the expansion process [2,3]. Pericarp is a semipermeable barrier covering the endosperm and germ [4] that influences the drying rates [5] and diffusion of calcium and water into the inner kernel during nixtamalization [1].
The wide versatility of the nixtamalization process for detaching the pericarp allows for increasing the soluble fiber, decreasing the lipid content and promoting higher protein content in the derived product, such as tortillas. In addition, the nixtamalization increases the solubility and availability of amino acids with major nutritional value, such as glutenin and tryptophan, and the calcium is accumulated in the pericarp [6]. Therefore, the use of nixtamalization could modify the nutrimental quality of the pericarp; however, the information about it is scarce.
Regarding the studies on popcorn pericarp, technological development could improve the knowledge of its properties with the use of several analytical tools such as sensorial and physicochemical analyses, microscopy, spectroscopy techniques, and antioxidant assays [2,3,7,8,9]. The published studies are about the effect of the expansion process on its biochemical composition [10,11] and the effect of pericarp thickness on the expansion process [12] and genetic traits [13], but the studies about the nanomechanical and structural properties, which explains, in part, the macro-scale material changes and properties, are scarce.
Regarding the nutrimental composition and technological functions of the pericarp, this work aimed to perform a physicochemical, protein structure, antioxidant activity, and nanomechanical characterization of nixtamalized popcorn using microscopy techniques, image analysis, nanoindentation, antioxidant assays, and FT-IR. Consequently, this work provides valuable and unpublished information on nixtamalized popcorn pericarp regarding its cellular architecture, physicochemical, nanomechanical, antioxidant power, and structural properties. Based on the information obtained, it is proposed that this pericarp may be an alternative source of antioxidants and others compounds to apply in different industries and could provide guidelines for the characterization of another type of corn pericarp.

2. Materials and Methods

2.1. Sample

The pericarp was obtained from the popcorn grains (Great Value, Wal-Mart, Inc., Bentonville, AR, USA) after the nixtamalization process. The nixtamalization process was performed according to the Mexican Norm, NMX-FF-034/1-SCFI-2002, where 200 g of popcorn grains were added to 300 mL of NaOH 2N solution, and it was put into a water bath at 50 °C for 15 min. After cooling, the pericarp was manually removed from the grain, and it was stored in hermetic bags at 25 °C until its analysis.

2.2. Proximate Chemical Composition

The moisture of nixtamalized popcorn grain pericarp was determined according to the AOAC 942.05 methodology using a thermobalance (OHAUS, MB45, Parsippany, NJ, USA). Lipid content was determined by the method of [14], while ash content was analyzed following the AOAC 942.05 methodology. Protein total content of the pericarp was determined using an automated Kjeltec 8200 (FOSS, Minneapolis, MN USA) [15], and soluble protein was determined using the Bradford method [16]. The quantification of reducing sugars of pericarp popcorn was assessed in a spectrophotometer (Thermo Scientific-Genesys Uv, Carlsbad, CA, USA) at 540 nm according to the methodology reported by [17]. The total sugar was determined by adding 0.6 mL of 5% phenol to 10 uL of the 0.05% sample, kept in the dark, and stirred using a spectrophotometer (Thermo Scientific-Genesys Uv, Mexico) at 490 nm [18]. The measurements were expressed as the average of three replicates values ± standard deviation.

2.3. Fourier-Transform Infrared Spectroscopy (FT-IR)

The study of pericarp structure was carried out by FT-IR spectroscopy (Agilent Cary model 630, Santa Clara, CA, USA), according to [19]. Furthermore, FT-IR determined the secondary structure of proteins in the pericarp. The deconvolution method was used to evaluate the region of a protein, band amide 1. This band extends from 1610 to 1694 cm−1 [20], and the assigned structures were turns: 1662–1684 cm−1, random coil: 1640–1650 cm−1, α-helix: 1650–1658 cm−1, and β-sheet: 1610–1639 and 1685–1669 cm−1.

2.4. Total Phenolic Content

Total phenolic content was determined according to the methodology reported by [21], with modifications for the measurement in the microplate reader applied by [22].

2.5. Antioxidant Activity

2.5.1. ABTS and DPPH

DPPH radical scavenging activity was determined by the methodology of Bobo-García et al. [22], while ABTS radical scavenging activity was determined according to Leite et al. [23]. The results are expressed in mM Trolox equivalents (TE)/mL using a Trolox calibration curve and as a percentage of scavenging of each radical compared to three control solutions: coumaric acid, caffeic acid, and ferulic acid (0.1 M). A microplate reader was used (Multiskan Go, Thermo Fisher Scientific, Waltham, MA, USA).

2.5.2. Reducing Power

The reducing power of the sample was determined according to [24]. The results are presented as a percentage reduction in absorbance compared to four control solutions: ferulic acid, caffeic acid, Trolox, and coumaric acid (0.1 M). A microplate reader was used (Multiskan Go, Thermo Fisher Scientific, Waltham, MA, USA).

2.5.3. Hydroxyl Radical

The methodology of the hydroxyl radical reported by [25] was used in this research. The results are presented as a percentage reduction in absorbance compared to four control solutions: ferulic acid, caffeic acid, Trolox, and coumaric acid (0.1 M). A microplate reader was used (Multiskan Go, Thermo Fisher Scientific, Waltham, USA).

2.5.4. Iron Chelation

The chelating activity of the Fe +2 ion was determined by the methodology of [26] with a few modifications. The results are presented as a percentage reduction in absorbance compared to four control solutions: ferulic acid, caffeic acid, Trolox, and coumaric acid (0.1 M). A microplate reader was used (Multiskan Go, Thermo Fisher Scientific, Waltham, USA).

2.6. Scanning Electron Microscopy (SEM)

Dried samples were coated with gold using a sputter coater (SPI supplies, West Chester, PA, USA) and observed with a scanning electron microscope (Hitachi, SU3500 I, Santa Clara, CA, USA) at 10.0 kV. The pericarp thicknesses were obtained from SEM images. All image analyses were performed in the software ImageJ (v. 1.46, National Institute of Health, Bethesda, MD, USA).

2.7. Nanoindentation and Imaging with Atomic Force Microscopy (AFM)

The dried pericarp was observed using AFM (Bruker, Bioscope Catalyts ScanAsyst, Santa Barbara, CA, USA), and it was placed on a fixation glass slide system. ScanAsyst mode was used, and thus scans of 2 × 2 µm2 and 1 × 1 µm2 taken, producing five images. The study was carried out in ambient conditions, and the cantilevers used in this study were (DNP-10A) silicon cantilevers of spring constant 0.540 Nm-1 and resonant frequency 1 kHz. Using matrices, Young’s modulus (YM) is indented with the point and shot method (NanosScope 1.4, Bruker, Santa Barbara, CA, USA). They also used a maximum indentation force of 50 nN and a ramp rate of 1 Hz indentation depth. Three hundred force curves were obtained from pericarp using the Hertz–Sneddon model to find YM values in NanoScope software [27].

2.8. Statistical Analysis

The measurements were performed at least in triplicate and are expressed as average values and deviation standards. Data were compared using the ANOVA-Tukey test and significant differences (p < 0.05). Statistical analyses were carried out in SigmaPlot software, v.12 (Systat Software Inc., Palo Alto, CA, USA). Frequency histograms of Young’s modulus values were performed to fit the data with the best model to describe the data distribution

3. Results and Discussion

3.1. Physicochemical Parameters

The pericarp is a film that covers the maize endosperm; it is around 5% of all kernels [1]. The ash is the content of minerals in the sample, and in this research (Table 1), we found higher values (67.77 ± 3.13%) in the pericarp compared with those of the literature (1.50 to 0.88%) [2], probably because our corn underwent a nixtamalization process to detach the pericarp from the grain, and therefore, this process provided more minerals to the pericarp. The reducing sugar content of pericarp showed a higher value (3.93 ± 0.14%) than other research values in popcorn where the whole kernel was occupied (0.07 to 0.23% [7]), probably due to the sugar alkaline process by alkaline-high temperature treatment; but also, complex polysaccharides are maintained because the value of non-reducing sugars is 6.99 ± 0.23%. The value of lipid content in pericarp (6.76 ± 0.13%) is similar to [2], which worked with popcorn kernels of the red pericarp. They reported values of 5.53 ± 0.97% when popcorn was unexpanded. Moisture (5.71 ± 0.53%) and protein (7.2 ± 0.33%) content values of popcorn pericarp were lower than the reported (10.46 to 10.76 and 13.42 to 9.76%, respectively) [2]. Furthermore, Table 1 shows that the pericarp has more insoluble protein than soluble due to the fact that insoluble protein comes from the alkaline hydrolysis of the pericarp, while the soluble protein comes from the germ and even endosperm.

3.2. FTIR Spectra of Pericarp

The pericarp contains polysaccharides such as cellulose (23–40%) and hemicellulose (50–67%); in the FT-IR spectrum (Figure 1), these polysaccharides are observed at 1160 cm−1, and polysaccharide skeletons with arabinose residues in bands 1079 and 1100 cm−1 [28]. The presence of these residues is probably due to ferulic acid [29] (Figure 1, spectrum at 1519 cm−1) since it has been observed that this acid can modify the structure of arabinose to bind it to cellulose and hemicellulose [30]. The pericarp also contains lipids (3050 cm−1) and proteins (presence of aromatic molecules around 1609, 1608, 1516, and 1517 cm−1) [31]. These results are according to Table 1.
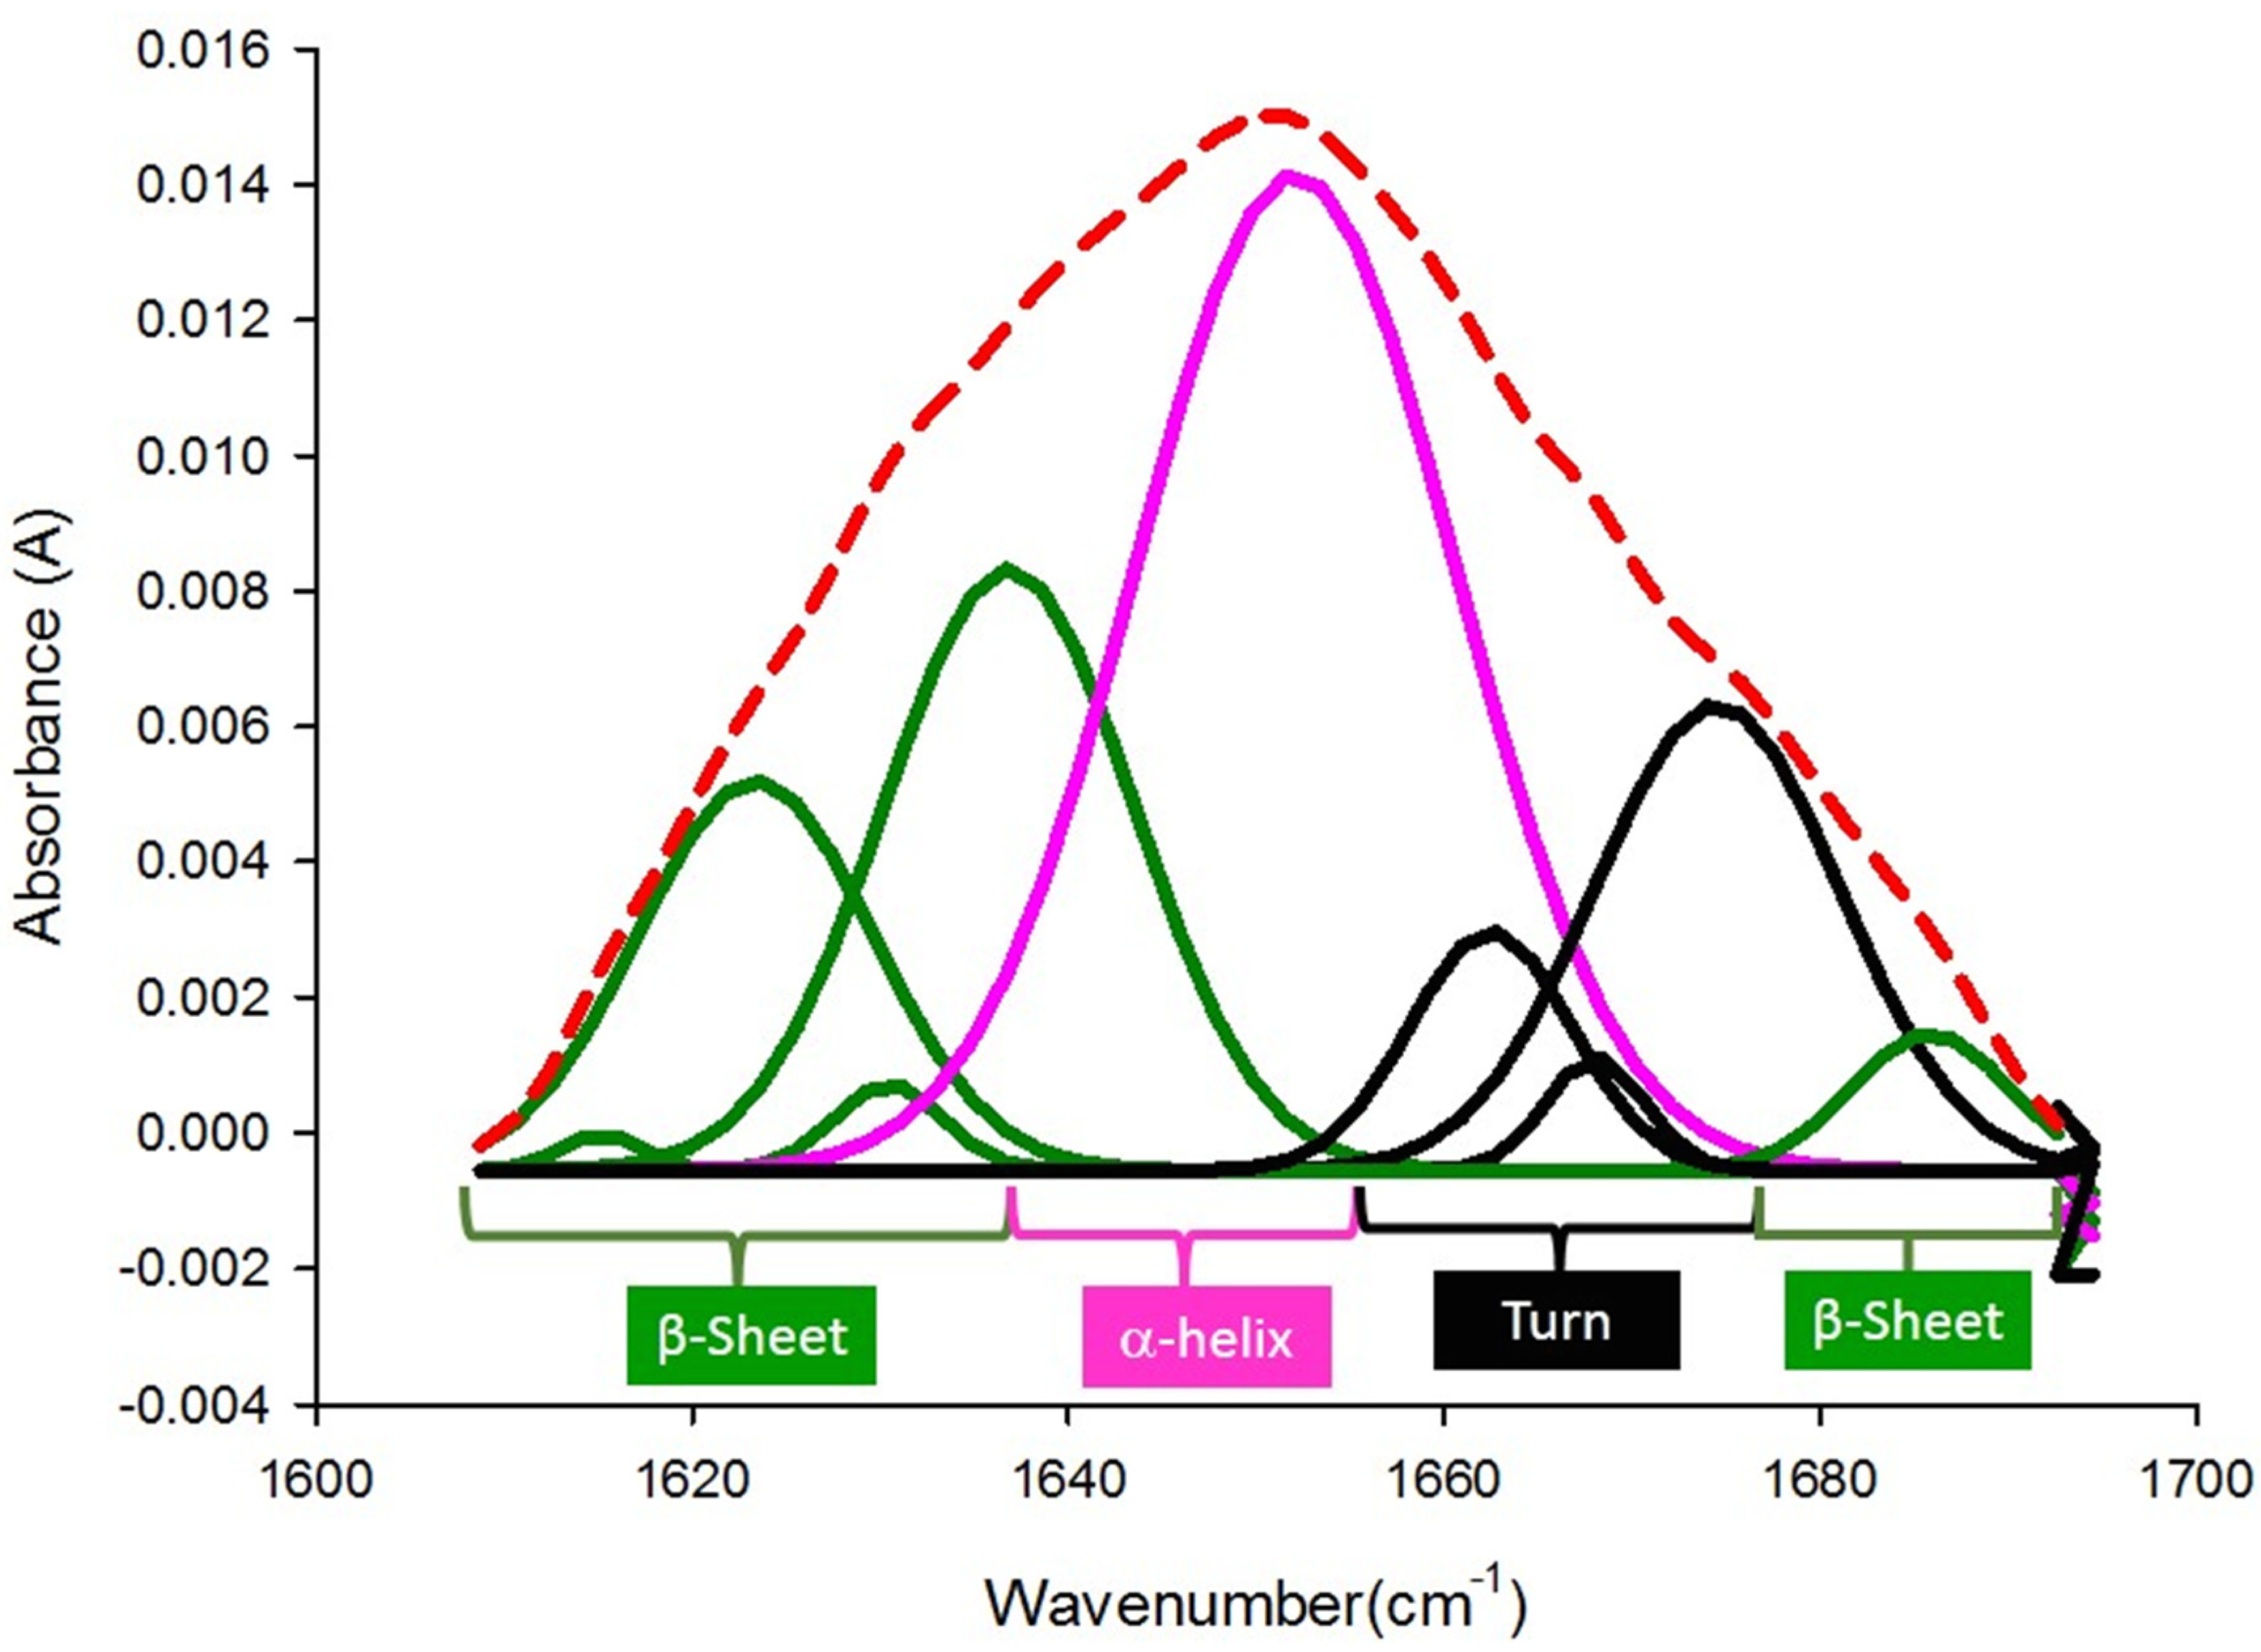
In addition, stretching of OH and NH groups was observed around 3350 cm−1, and CH was at 2929 cm−1 [30]; this chemical structure influences the interactions with other components and could modify the technological properties as foaming and emulsifying capacities of this system [32]. Finally, the protein of the pericarp was shown at the 1610–1694 cm−1 band, concerning amide I and band amide II at 1500–1560 cm−1. These bands are the protein zone, and they allow us to know the secondary structure of proteins (Figure 2). The protein of the pericarp showed that the highest value was 42.10%, which is an α-helix structure related to the emulsifier properties and force of the gel [32]. While 21.56% and 36.33% are related to the β-sheet, the protein of the pericarp did not present the random coil structure. This behavior allows understanding that the proteins found in partially unfolded structures could react with other components of the pericarp because the active sites are available and could react with other components or reactivate and change properties of the pericarp.

3.3. Total Phenolic Content

The obtained value of total phenolic content in the nixtamalized popcorn pericarp (Table 2) (0.21 mgGAE/mL) is lower than the reported values in the literature, probably because of the nixtamalization process. In this regard, Zhang et al. [33] reported values of around 138.00 to 57.04 mg GAE/100 g for eight representative sweet corn varieties grown. Other research found 232.9 ± 3.6 mg GAE/g DM in the barley and spelt flour [34], while Ragaee et al. [35], who conducted a study on different grain cereals, found in hard wheat a value of 562 ± 28.8, barley 879 ± 24.0 and millet 1387 ± 13.3 (results were expressed as gallic acid equivalent (µg/g)), while Lopez-Martinez et al. [36] reported values in different corn with different colors: white 170.2 ± 4.5 mg/100 g, blue 343.2 ± 6.8 mg/100 g, red 465.3 ± 5.7 mg/100 g and, green 1760 ± 8.2 mg/100 g. The blue and red color of the pericarp is related to the anthocyanins content, which, in turn, positively affect the antioxidant activity of the grain [2].

3.4. Antioxidant Activity

3.4.1. ABTS and DPPH

Table 2 shows the values of ABTS (550.1 ± 2.9) and DPPH (44.2 ± 1.6) radical scavenging activities of nixtamalized popcorn pericarp. Herrera-Balandrano et al. [37] worked with nixtamalized maize bran and reported values from 29.49 to 31.69 µmol TE/g of DPPH, while Ragaee et al. [35] conducted a study on different grain cereals about their antioxidant activity, and they found values of 4.33 ± 0.17 of DPPH and 8.8 ± 0.39 of ABTS in hard wheat, 21.00 ± 0.83 of DPPH and 14.9 ± 0.61 of ABTS in barley and 23.83 ± 0.67 of DPPH and 21.4 ± 0.43 of ABTS (results were expressed in µmol/g) in millet. These antioxidant activities of grain cereals depend on environmental and genetic factors. Paraginski et al. [2] concluded that there are relationships between the bioactive compounds and the color pericarp because the red pericarp grain had higher values of ABTS (13.99) than the others. The information on the total phenol content concluded that it is higher in whole kernel than in the pericarp, and it also depends on the color, being higher when they are red and blue and when popcorn explodes due to the heat [2,8]. Furthermore, the total phenol content and these antioxidant activities depend on the nixtamalization process.

3.4.2. Reducing Power

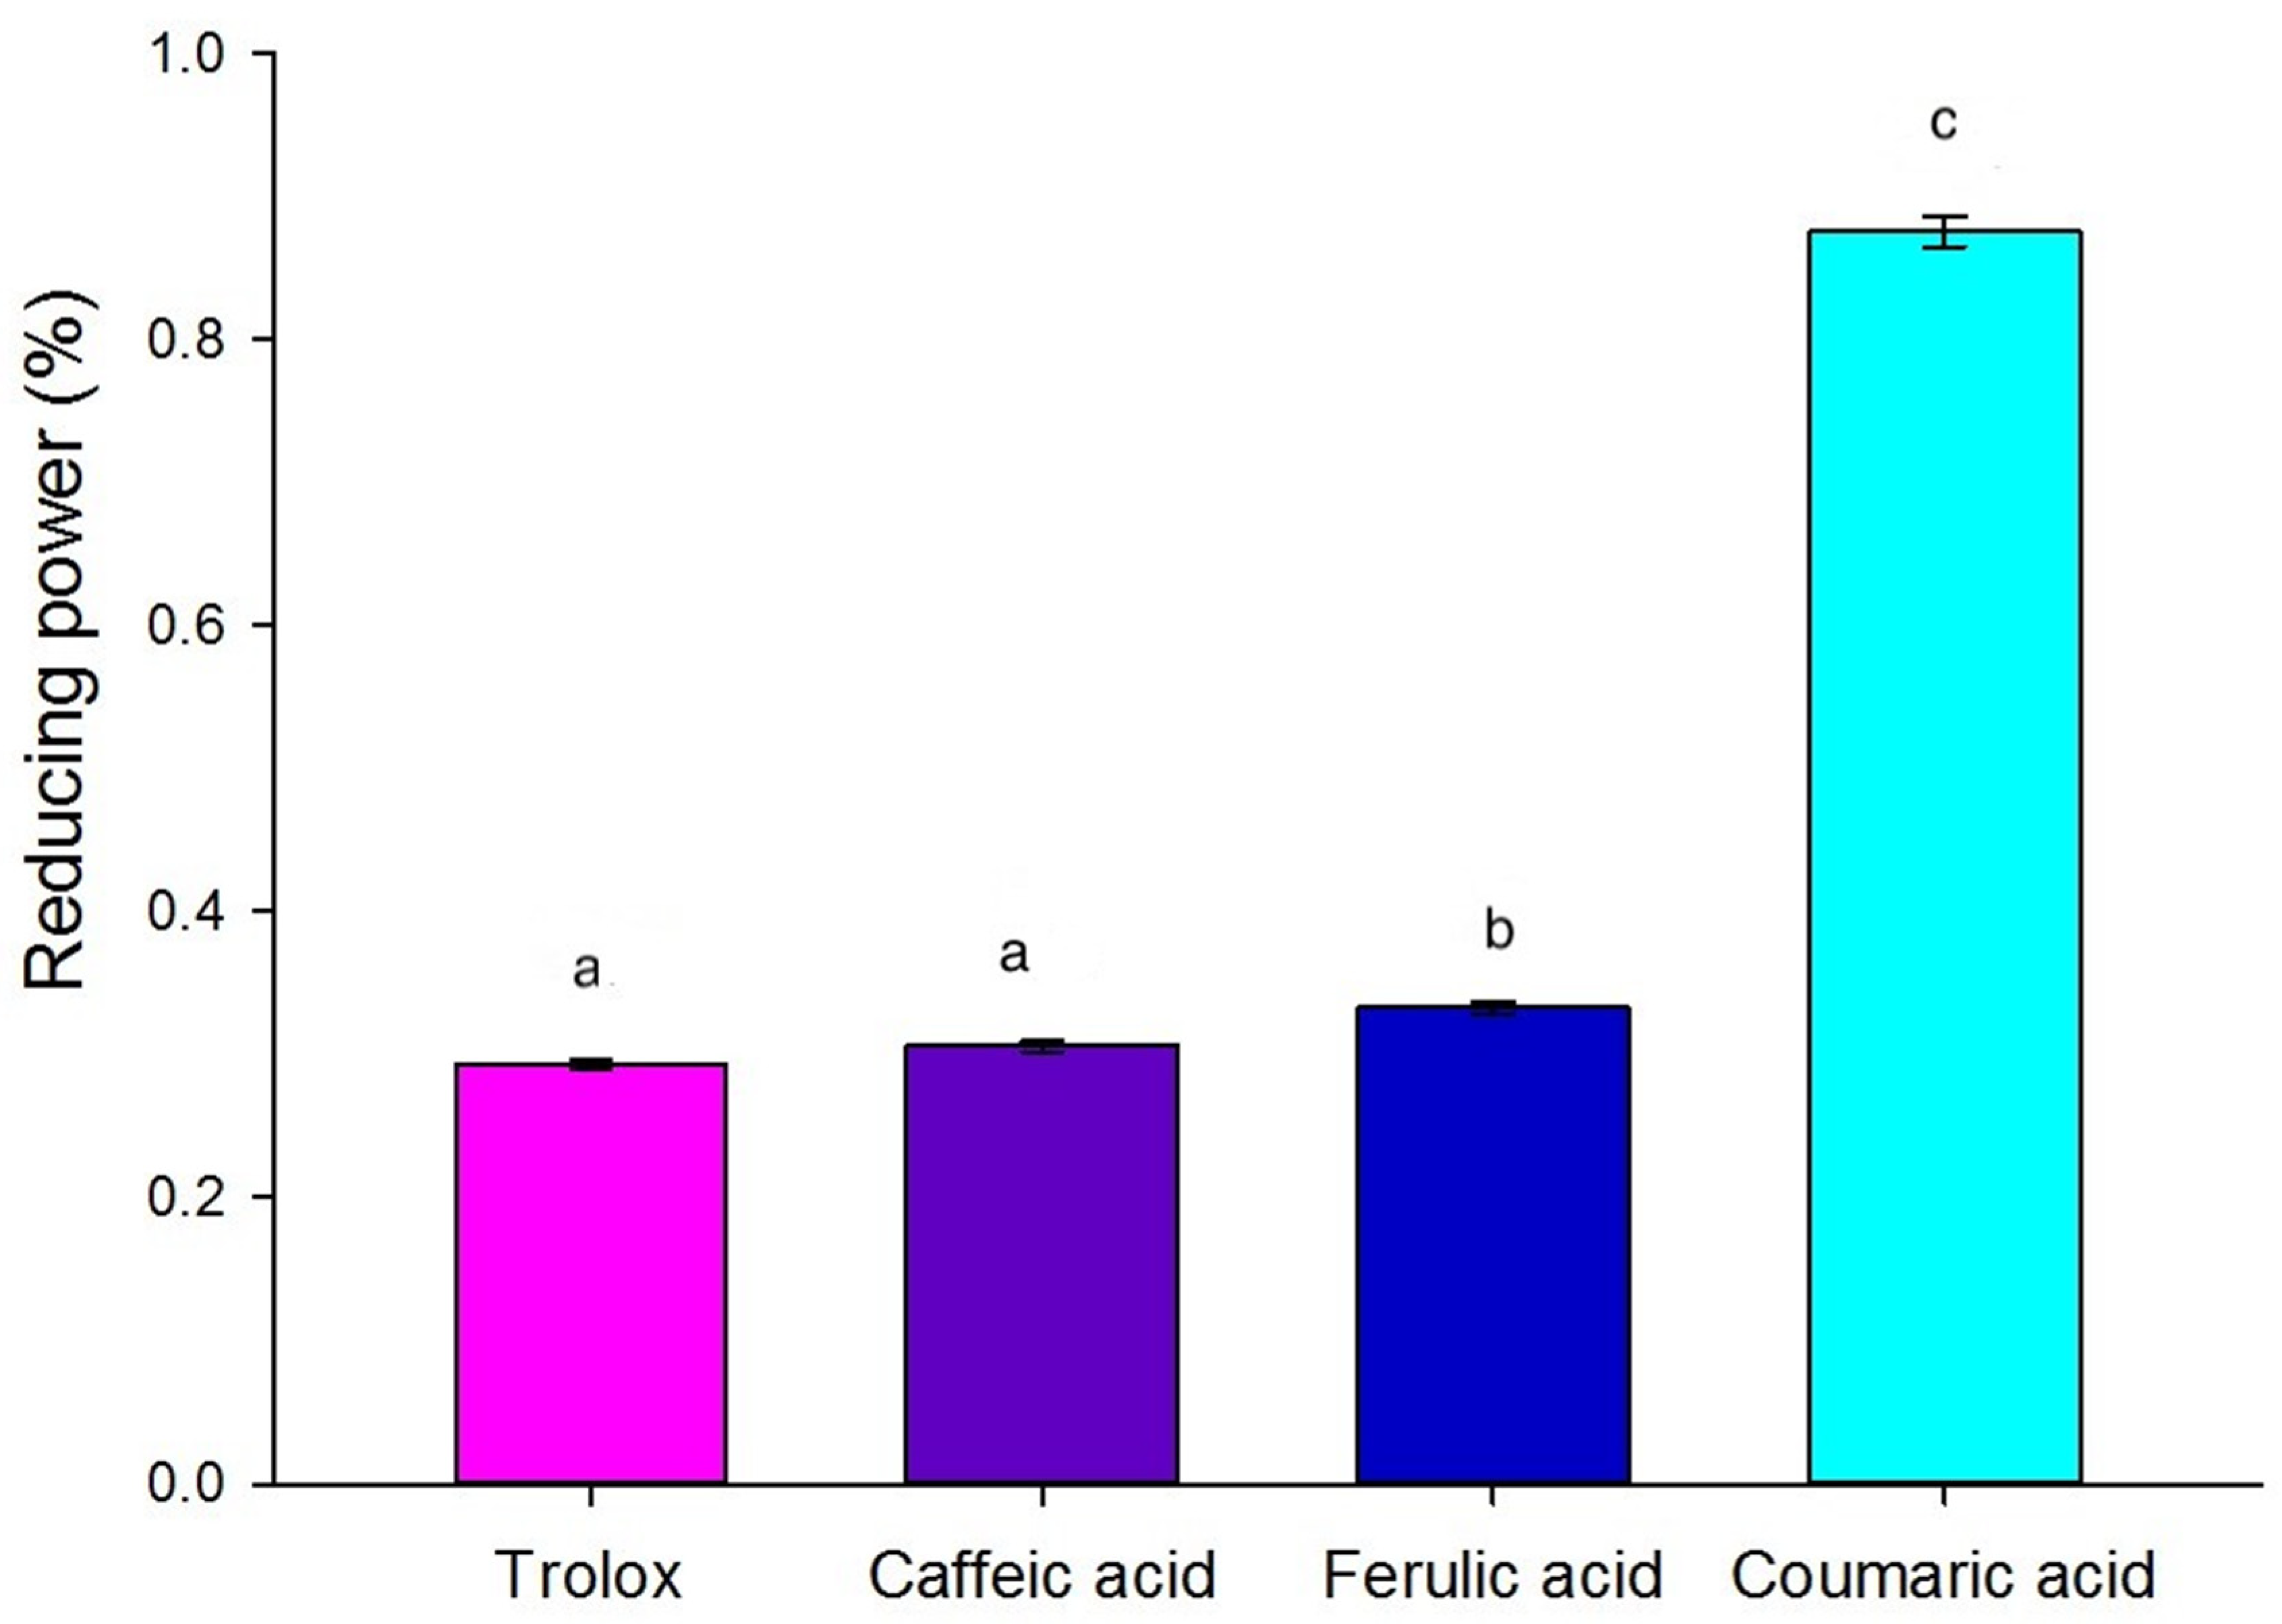
The results of reducing power are shown in Figure 3. The activity of the pericarp was compared with the activity shown by Trolox, caffeic acid, ferulic acid, and coumaric acid (0.1 M), as the pericarp contains these last three acids. The pericarp exerts a reducing power of 29% compared to the Trolox (0.1 M), 30% compared to caffeic acid (0.1 M), 33% compared to ferulic acid, and 88% compared to coumaric acid (0.1 M), being the coumaric acid, the control with a highest reducing power; high percentages are related to a bioactive component performance. The values of reducing power were not significantly different (p < 0.05) between caffeic acid and Trolox. Lopez-Martinez et al. [36] reported values of around 85% to 40% in different corn types, while Ivanišová et al. [34] studied reducing power in milling cereals such as barley, and they obtained values of around 32–38% expressed as mg of Trolox equivalent. Another study found the lowest values in reducing power in yellow and white maize from Nigeria at 2.27 d ± 0.06 and 0.94 ± 0.03 (mg AAE g−1), respectively [38]. Therefore, we concluded that the pericarp has an actual charge of reducing power.

3.4.3. Hydroxyl Radical

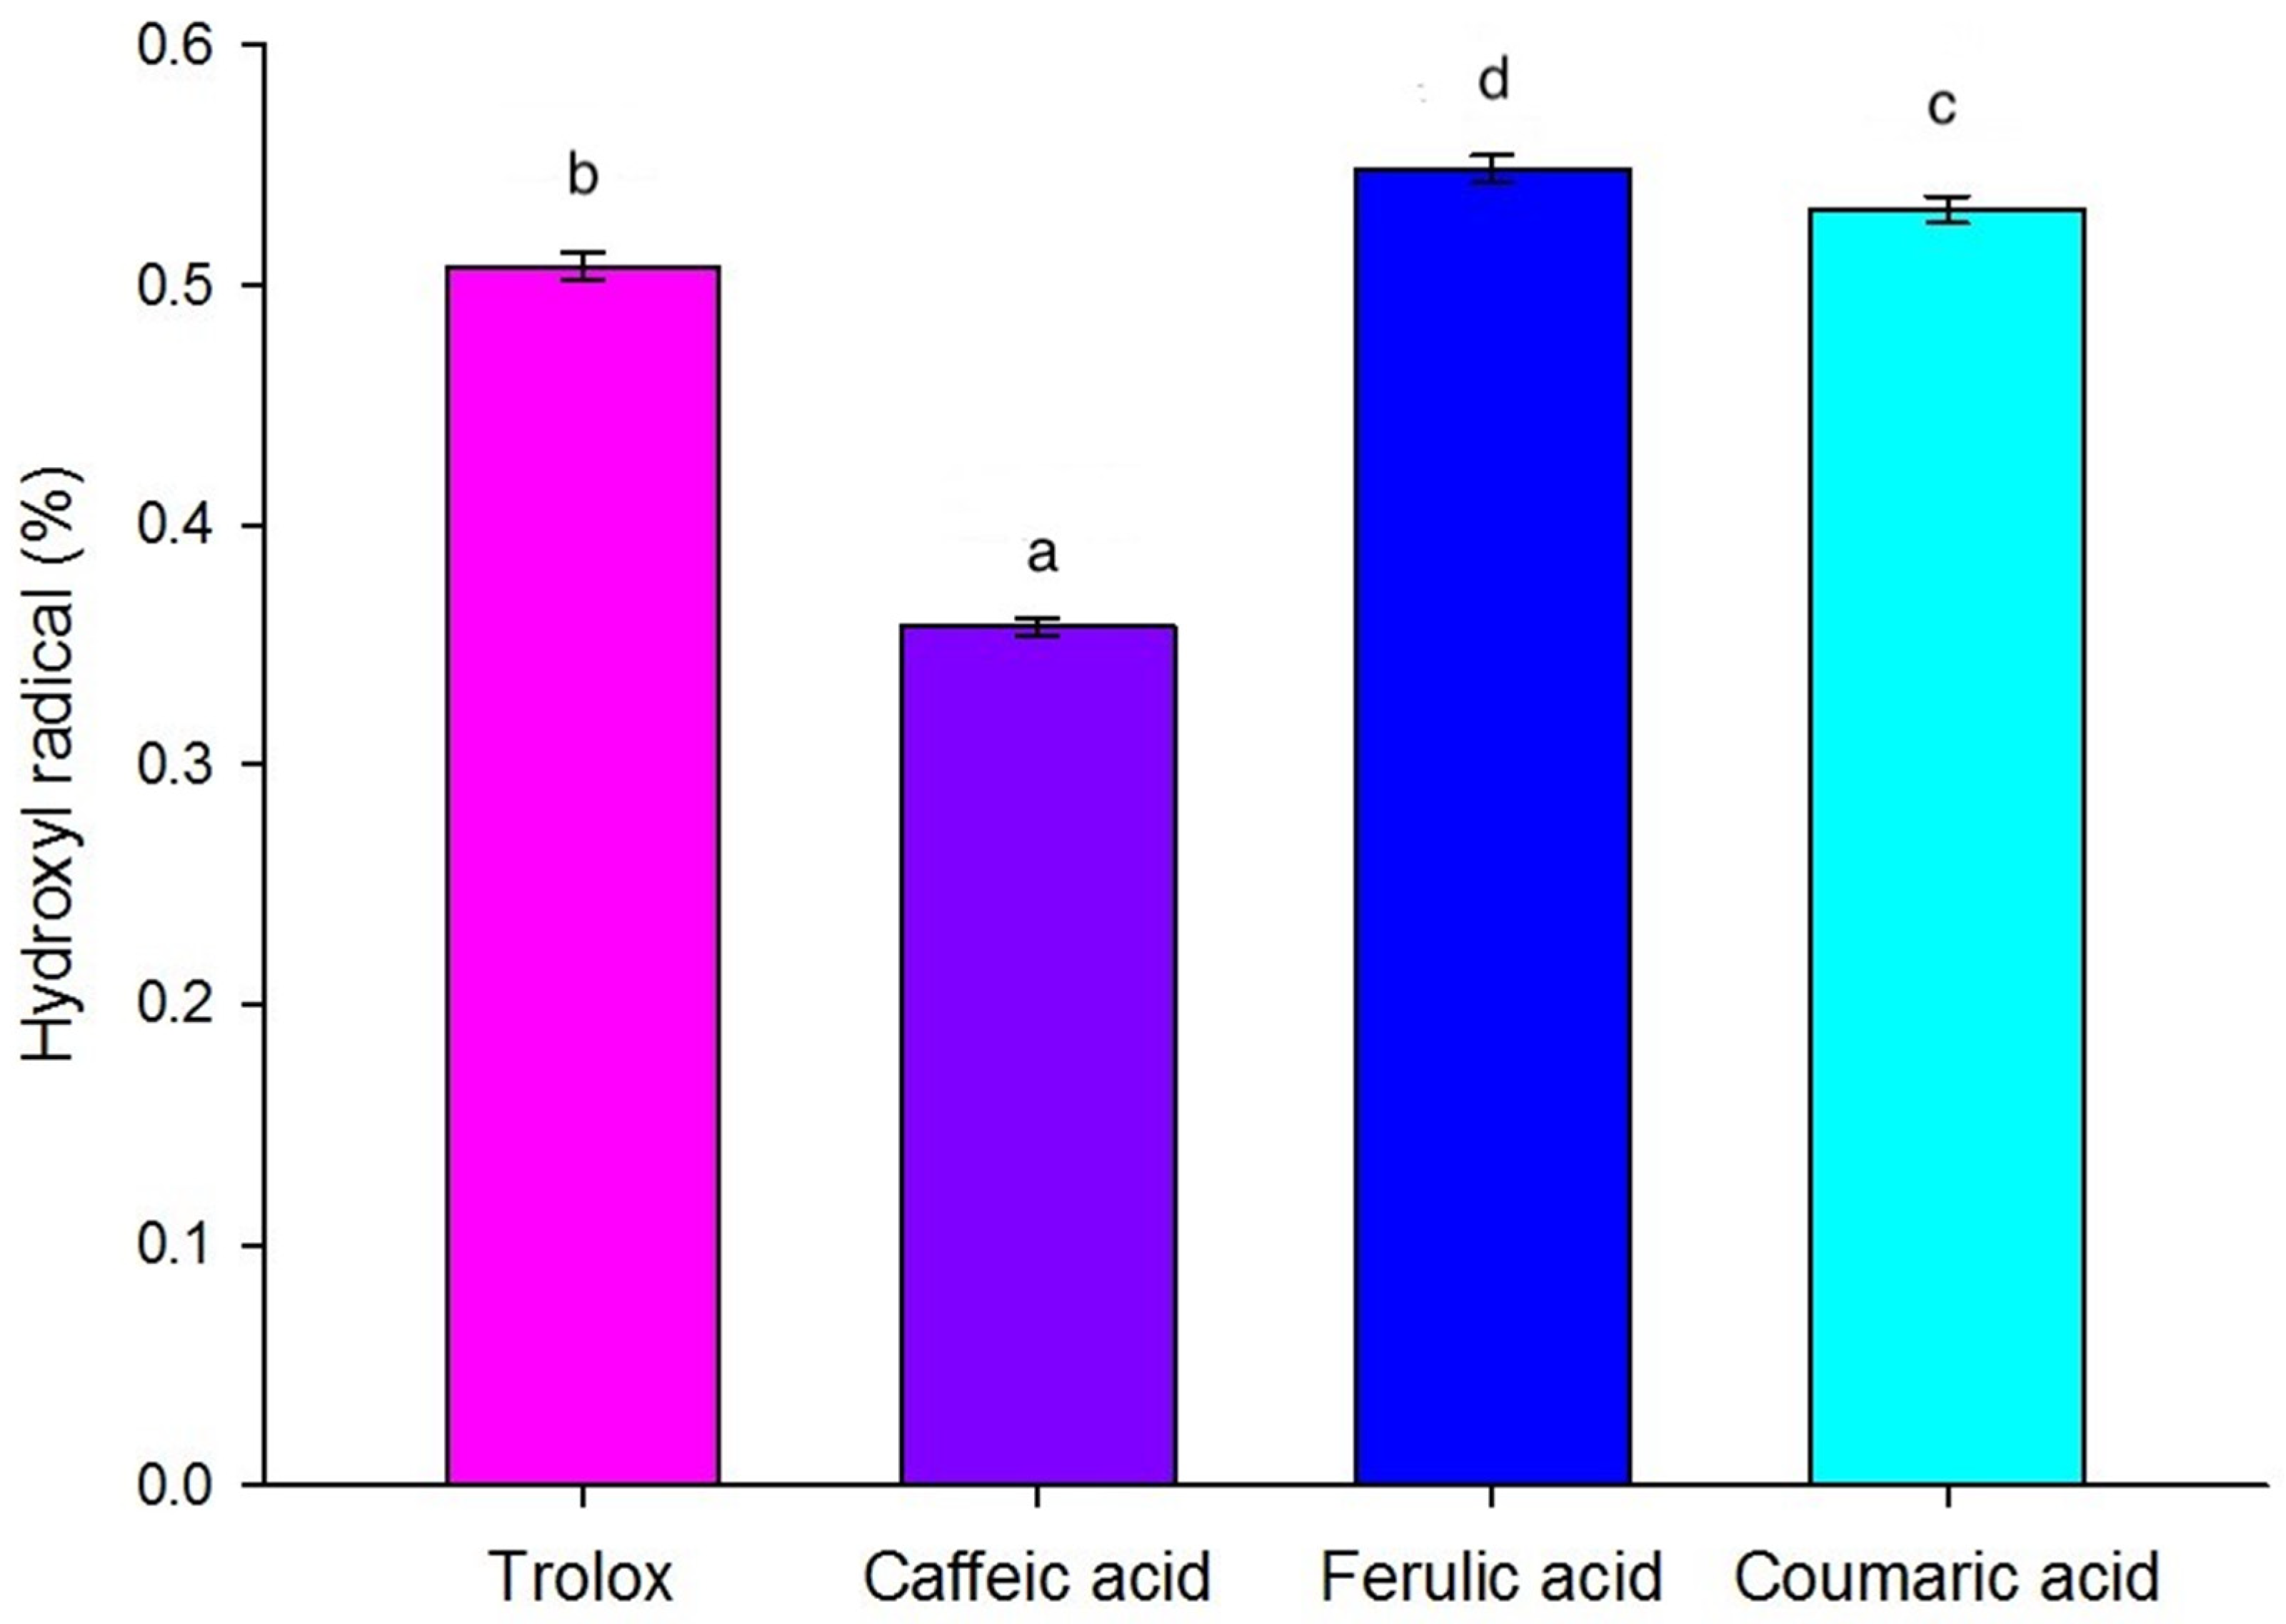
The results of OH radicals are shown in Figure 4. The activity of the pericarp is compared with the activity shown by Trolox, caffeic acid, ferulic acid, and coumaric acid (0.1M). The pericarp exerts OH radical scavenging activity of 51% compared to the Trolox (0.1 M), 36% compared to caffeic acid (0.1 M), 53% compared to coumaric acid (0.1 M), and 55% compared to ferulic acid. The activities showed by Trolox, caffeic acid, ferulic acid and coumaric acid are significantly different (p < 0.05). A high positive correlation (0.809) between total phenolic content and hydroxyl radical (OH) indicates that phenolic compounds catch radicals free [35]. Martínez-Tomé et al. [39] reported OH radical scavenging activity values in cereal brands, wheat bran with 79.2% and oat bran with 41.3%, while in another study, protein hydrolyzates from corn gluten meal reported hydroxyl radicals of around 20 to 100% [40]. A study on bonito (kasuto) from Japan reported similar values of around 54 ± 1 with ascorbic acid and garlic (88 ± 4), and onion (89 ± 4) had higher values than popcorn pericarp [41]. These show that the pericarp has a significant OH radical scavenging activity and can be applied in different industries (food, nutraceutical and cosmetic) as a good source of antioxidant compounds.

3.4.4. Iron Chelation

The results of iron chelation are shown in Figure 5. The activity of the pericarp is compared with the activity shown by Trolox, caffeic acid, ferulic acid, and coumaric acid (0.1 M). The pericarp exerts iron chelation of 134% compared to the Trolox (0.1 M), 116% compared to coumaric acid (0.1 M), 116% compared to ferulic acid (0.1 M), and 141% compared to caffeic acid. The activity showed no significant difference between ferulic acid and coumaric acid (p < 0.05). A study found values of iron chelation in six medicinal plant extracts, and Clinacanthus nutanshad had high values of around 88.2 ± 0.4 [42]. The values found in another study demonstrated that the pericarp has iron chelation significant enough to apply to the food, nutraceutical and cosmetic industries as a new source of antioxidant compounds [33].

3.5. Scanning Electron Microscopy (SEM)

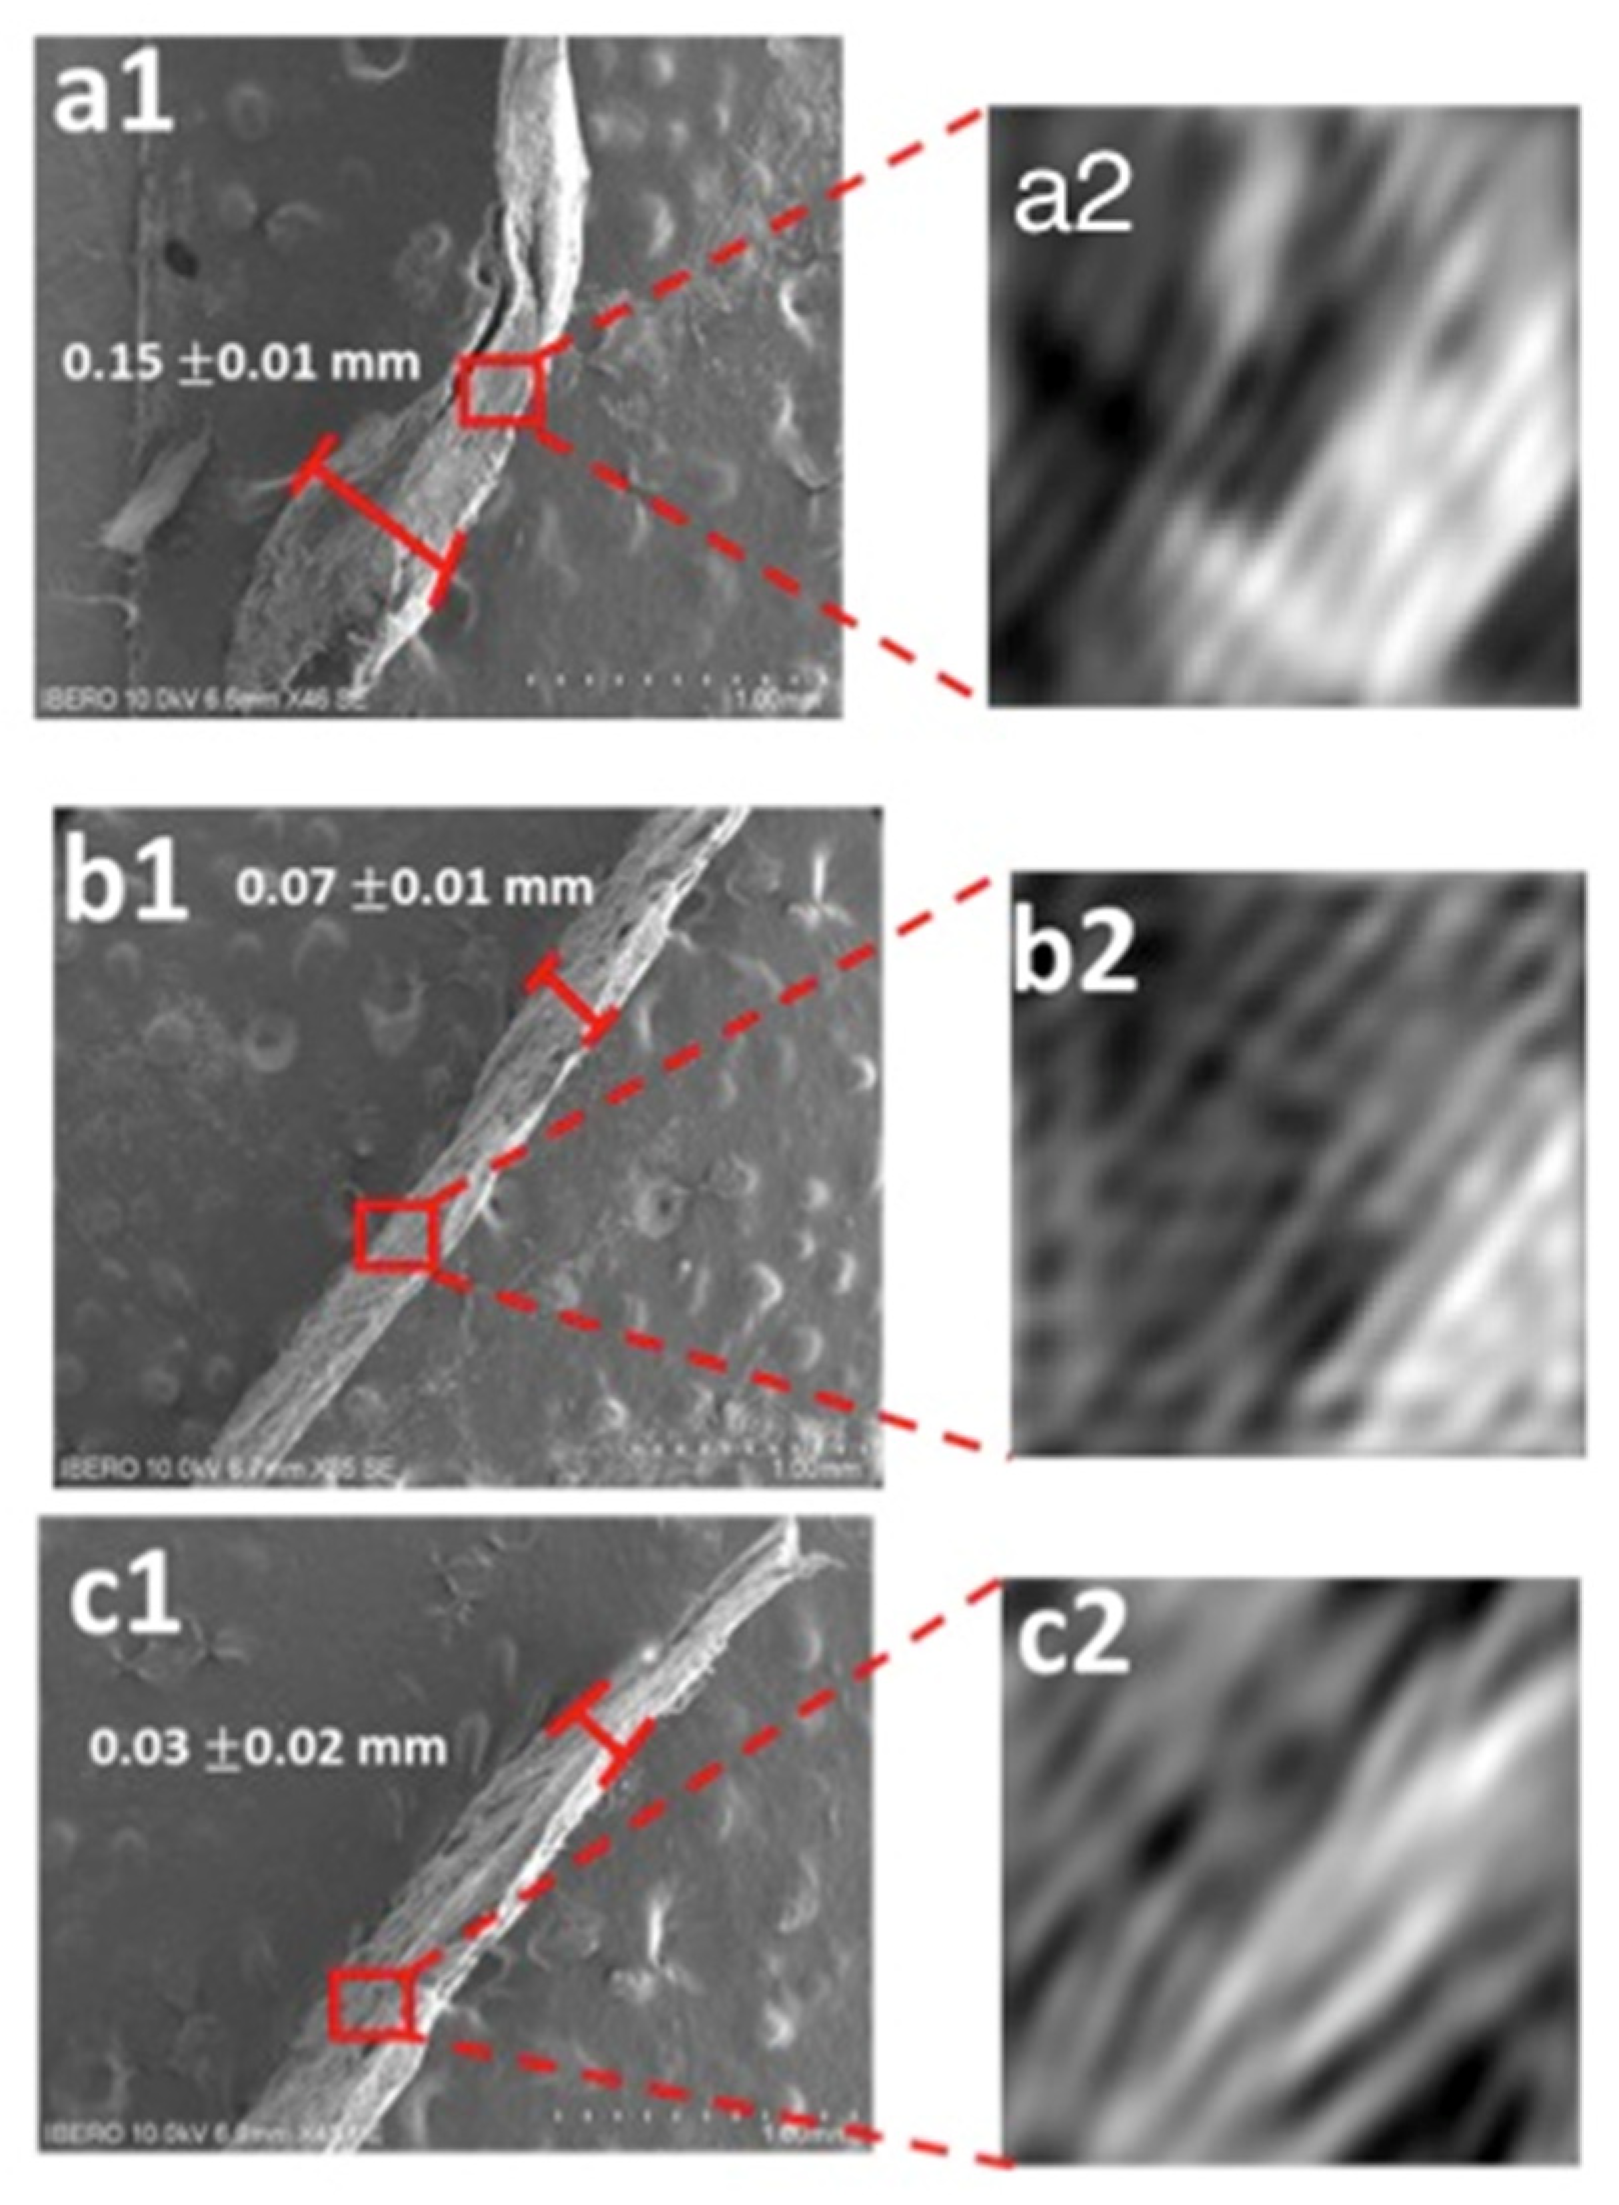
SEM images (Figure 6) show the microstructure, thickness and fibers of the popcorn pericarp; thickness values depend on the part of the grain, where the near pedicel tip is thicker than in the middle and end of grain (Figure 6(a1,b1,c1)) due to the fact that the pedicel is the principal structural medium that allows nutrient transportation and is related to the vascular tissue development [43]. The middle and near pedicel fibers were more alienated than the final part of the grain. These fibers contain cellulose, hemicellulose, and lignin. Furthermore, the pericarp surface has a waxy layer appearance that allows mass transfer [1]. A close-up of pericarp images (Figure 6(a2,b2,c2)) show the change in the fiber’s disposition and direction. The values of thickness at the end part of the popcorn pericarp (Figure 6(c1)) were similar to those reported in the Cacahuacintle sample from Mexico, the values of which were around 28 µm [44], while in the middle part of the pericarp (Figure 6(b1)), values of 70 ± 10 µm were found according to the values of Maíz Ancho and pozolero from Jalisco, Mexico [44]. Gutiérrez-Cortez et al. [1] reported values of white maize from Guanajuato, Mexico, and these authors found three zones with different thicknesses, which were around 75 to 87 µm. Finally, the thickness values of the near pedicel part were around 150 ± 10 µm—similar to the values of the study of Narváez-González et al. [9] in Popcorn, Cónico, Dulce, Arrocillo, and Nal-Tel.

3.6. Nanostructure and Nanoindentation

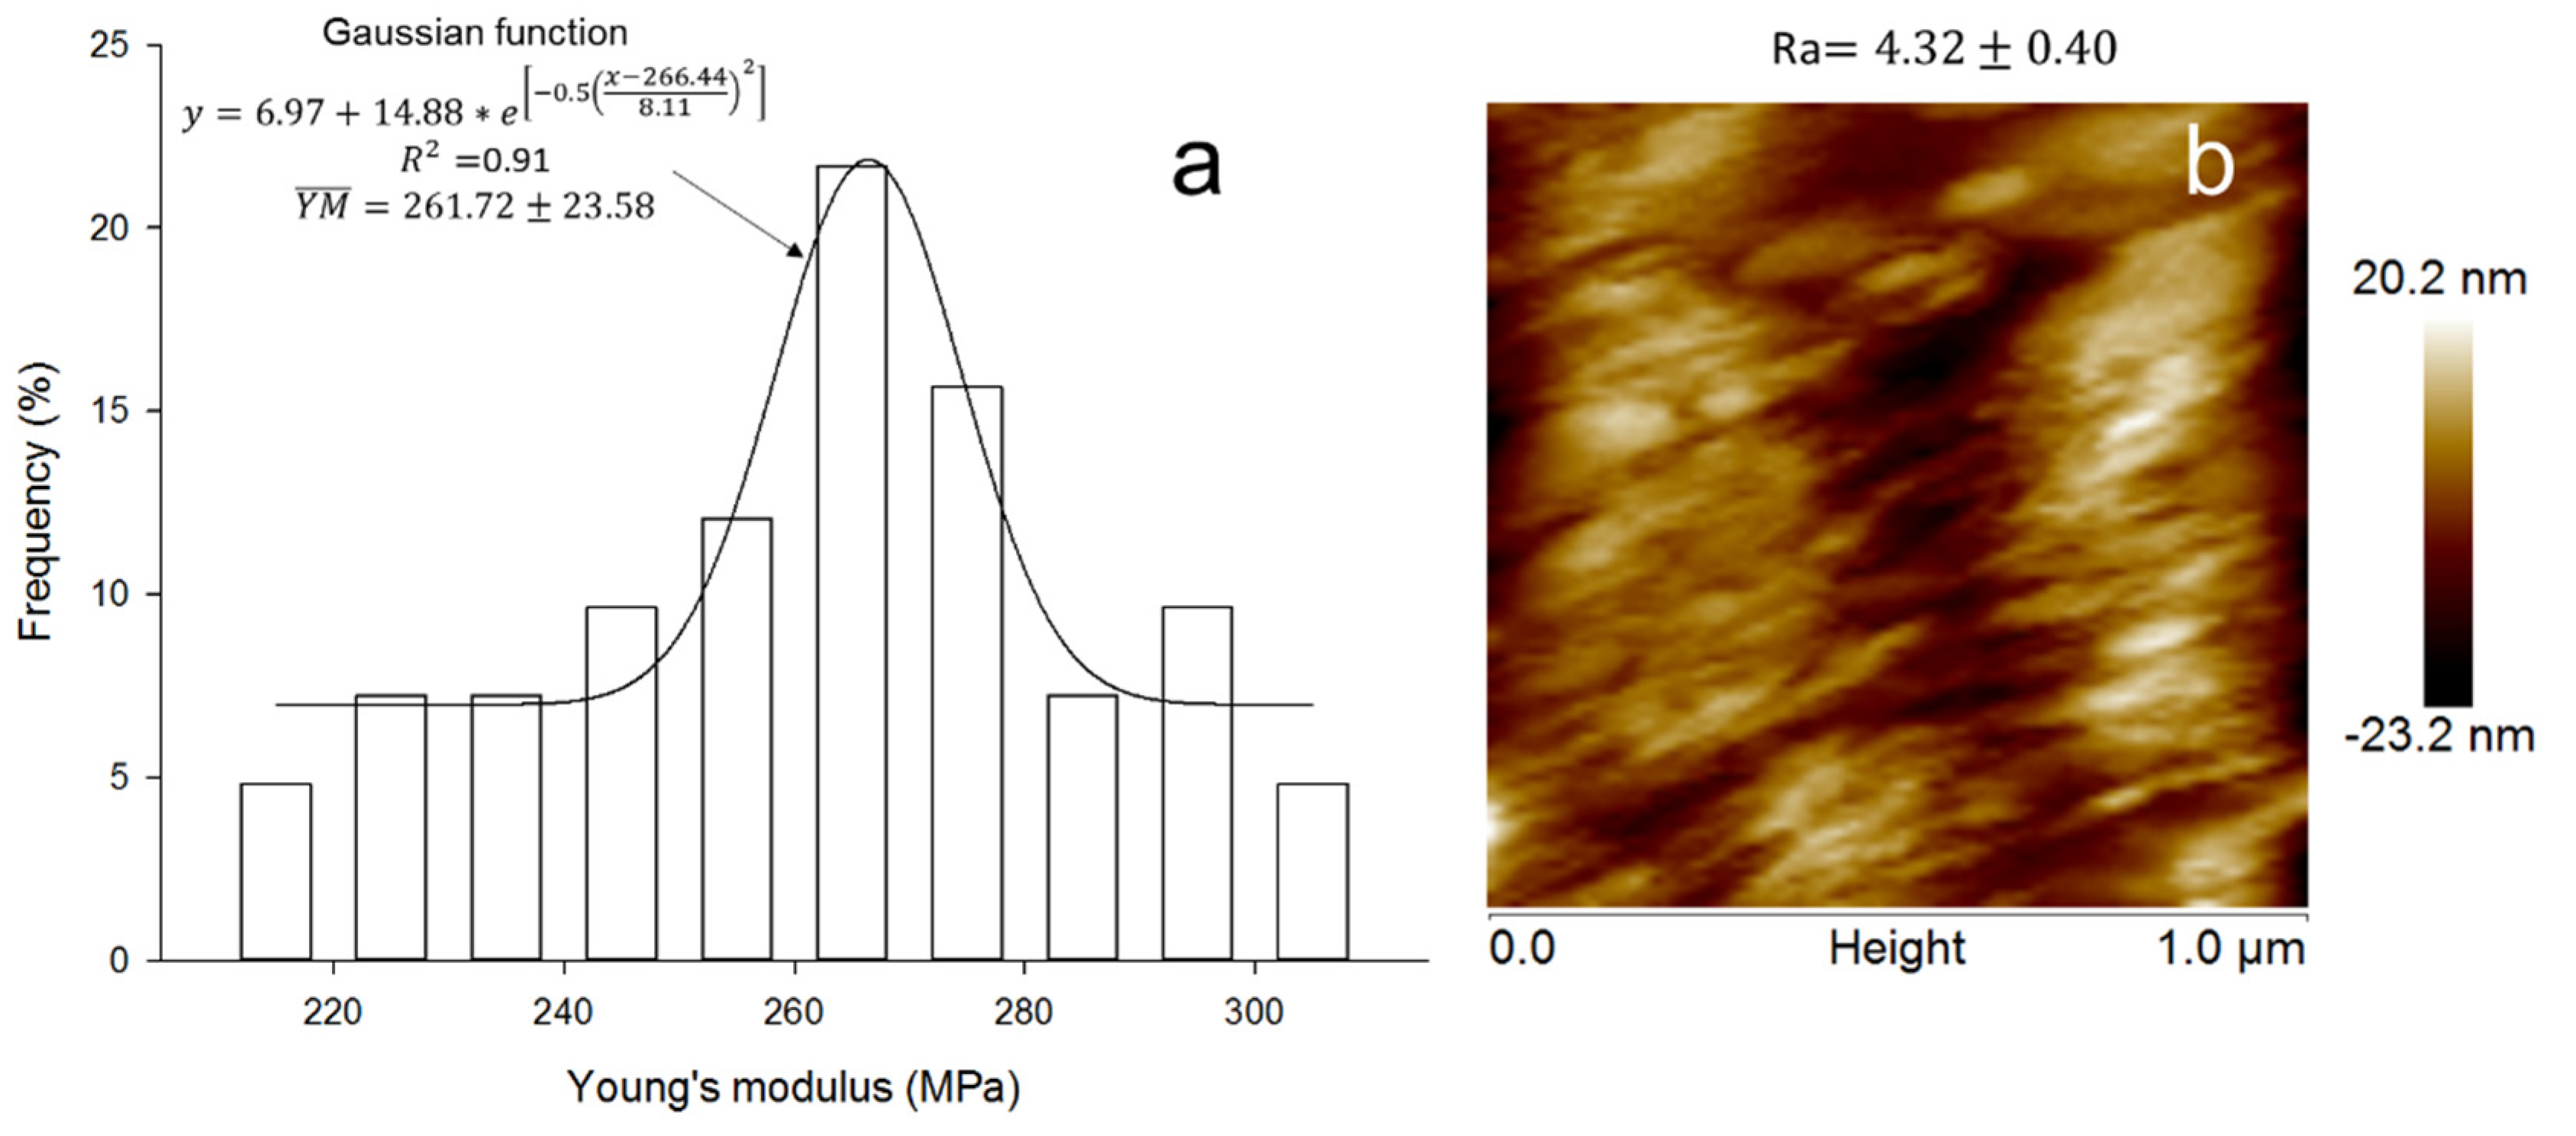
Pericarp mechanics play a pivotal role in grain firmness and protection, but their relationships with structure and stiffness remain unknown to a certain extent. For this reason, topography, stiffness, and the structure of the pericarp were studied using AFM. The surface of the popcorn pericarp is a heterogeneous topography with roughness values (Ra) of around 4.32 ± 0.40 nm. The pericarp’s surface is associated with a wide distribution of Young’s modulus (YM) values shown in the histogram of Figure 7 (261.72 ± 23.58 MPa). Furthermore, a Gaussian function was the most appropriate model for fitting the distribution of YM values according to the mathematical modeling optimization employed. Similar topography was observed in corn kernels from Jilin province of China, where they had values of Ra 3.41 ± 0.89 nm [45]. Another study of eggshells reported similar values (5.30 to 8.81 nm) to pericarp, but they had different surfaces because the eggshell showed pores [46]. In contrast, Rojas-Candelas et al. [27] reported higher values of Ra around from 20.63 to 38.65 nm in apple tissues, but they have lower values of Young’s modulus compared with pericarp (0.90 ± 1.30 to 1.76 ± 1.01 MPa). Antoine et al. [47] reported values of YM in the pericarp of grain’s wheat (cv. Baroudeur and, cv. Scipion) where the values were 20.6 ± 2.8 and 28.9 ± 6.7 N/mm, respectively. Another study determined YM in bread wheat Buck-Amancay cultivar and ACA 315 cultivar from Argentina. They found values of an outer layer of around 2799 ± 659 and 1404 ± 121 MPa, respectively, with 10% moisture [48].
Mechanical characterization of pericarp allows knowing the physiological state of cells and the effect of individual biomolecules and assemblies on overall properties on the cell surfaces.

4. Conclusions

The current study integrated different characterization techniques at the micro and nanostructural level along with statistical tools and provided novel data to study the popcorn pericarp. The secondary structure of the pericarp protein through FT-IR provided relevant information about the state that unfolds or folds the proteins. This study found that pericarp has significant antioxidant activities compared with other antioxidants, such as ferulic acid, caffeic acid, Trolox, and coumaric, and this behavior was related to the nixtamalization process. The qualitative information obtained by SEM indicated that the thickness depends on the pericarp parts. Atomic force microscopy allowed us to examine the nanomechanical properties of the pericarp, which showed significant values of Young’s modulus that correspond to a film that covers the popcorn that cannot be stronger because it would not allow it to pop but it is necessary to protect the grain. Nixtamalization increased antioxidant activity.

Author Contributions

Conceptualization, L.E.R.-C., A.V.-C. and M.D.-R.; methodology, L.E.R.-C., A.V.-C. and M.D.-R.; software, L.E.R.-C.; validation, L.E.R.-C. A.d.J.C.-S. and M.D.-R.; formal analysis L.E.R.-C.; investigation L.E.R.-C. and J.V.M.-M.; resources L.E.R.-C., A.d.J.C.-S. and M.D.-R.; data curation L.E.R.-C.; writing—original draft preparation, L.E.R.-C.; writing—review and editing, A.A.R.-A. and R.G.C.-M.; visualization, A.A.R.-A. and R.G.C.-M.; supervision, L.E.R.-C. and M.D.-R.; project administration, M.D.-R. funding acquisition, M.D.-R. All authors have read and agreed to the published version of the manuscript.

Funding

This research received no external funding.

Institutional Review Board Statement

Not applicable.

Informed Consent Statement

Not applicable.

Data Availability Statement

The authors declare the transparency of data.

Acknowledgments

Liliana Edith Rojas Candelas wishes to thank COMECYT in Mexico State for her professorship and the financial support provided by COMECYT (CAT2021-0080), also Felipe Cervantes Sodi of Universidad Iberoamericana for the micrographs SEM.

Conflicts of Interest

The authors declare no conflict of interest. The funders had no role in the design of the study; in the collection, analyses, or interpretation of data; in the writing of the manuscript, or in the decision to publish the results.

References

  1. Gutiérrez-Cortez, E.; Rojas-Molina, I.; Rojas, A.; Arjona, J.L.; Cornejo-Villegas, M.A.; Zepeda-Benítez, Y.; Velázquez-Hernández, R.; Ibarra-Alvarado, C.; Rodríguez-García, M.E. Microstructural Changes in the Maize Kernel Pericarp during Cooking Stage in Nixtamalization Process. J. Cereal Sci. 2010, 51, 81–88. [Google Scholar] [CrossRef]
  2. Paraginski, R.T.; de Souza, N.L.; Alves, G.H.; Ziegler, V.; de Oliveira, M.; Elias, M.C. Sensory and Nutritional Evaluation of Popcorn Kernels with Yellow, White and Red Pericarps Expanded in Different Ways. J. Cereal Sci. 2016, 69, 383–391. [Google Scholar] [CrossRef]
  3. Shavandi, M.; Javanmard, M.; Basiri, A. Novel Popping through Infrared: Effect on Some Physicochemical Properties of Popcorn (Zea Mays L. Var. Everta). LWT 2022, 155, 112955. [Google Scholar] [CrossRef]
  4. Gwirtz, J.A.; Garcia-Casal, M.N. Processing Maize Flour and Corn Meal Food Products. Ann. N. Y. Acad. Sci. 2014, 1312, 66–75. [Google Scholar] [CrossRef] [PubMed] [Green Version]
  5. Mohamed, A.A.; Ashman, R.B.; Kirleis, A.W. Pericarp Thickness and Other Kernel Physical Characteristics Relate to Microwave Popping Quality of Popcorn. J. Food Sci. 1993, 58, 342–346. [Google Scholar] [CrossRef]
  6. Escalante-Aburto, A.; Mariscal-Moreno, R.M.; Santiago-Ramos, D.; Ponce-García, N. An Update of Different Nixtamalization Technologies, and Its Effects on Chemical Composition and Nutritional Value of Corn Tortillas. Food Rev. Int. 2020, 36, 456–498. [Google Scholar] [CrossRef]
  7. Park, D.; Maga, J.A. Effects of Storage Temperature and Kernel Physical Condition on Popping Qualities of Popcorn Hybrids. Cereal Chem. 2002, 79, 572–575. [Google Scholar] [CrossRef]
  8. Acosta-Estrada, B.A.; Lazo-Vélez, M.A.; Nava-Valdez, Y.; Gutiérrez-Uribe, J.A.; Serna-Saldívar, S.O. Improvement of Dietary Fiber, Ferulic Acid and Calcium Contents in Pan Bread Enriched with Nejayote Food Additive from White Maize (Zea Mays). J. Cereal Sci. 2014, 60, 264–269. [Google Scholar] [CrossRef]
  9. Narváez-González, E.D.; Figueroa-Cárdenas, J.D.D.; Taba, S.; Tostado, E.C.; Peniche, R.Á.M.; Sánchez, F.R. Relationships between the Microstructure, Physical Features, and Chemical Composition of Different Maize Accessions from Latin America. Cereal Chem. 2006, 83, 595–604. [Google Scholar] [CrossRef]
  10. Junior, C.V.D.; Godoy, S.; Gonela, A.; Scapim, C.A.; Grandis, A.; Dos Santos, W.D.; Maria de Fátima, P.S. Biochemical composition of the pericarp cell wall of popcorn inbred lines with different popping expansion. Curr. Res. Food Sci. 2022, 5, 102–106. [Google Scholar] [CrossRef]
  11. Bocharova, O.; Reshta, S.; Bocharova, M. Investigation of the chemical safety of microwaved popcorn in respect of acrylamide formation. Int. Food Res. J. 2017, 24, 2274–2277. Available online: https://www.proquest.com/openview/f407abf46e96081584d9295290092f3a (accessed on 20 May 2022).
  12. Srichomporn, S.; Pothisoong, T.; Boonsri, N.; Srichomporn, K.; Malumpong, C. Effects of pericarp thickness of popcorn kernel on popping quality in cooked-oil popper. In Proceedings of the 51st Kasetsart University Annual Conference, Bangkok, Thailand, 5–7 February 2013; Kasetsart University: Bangkok, Thailand, 2013. Available online: https://www.cabdirect.org/cabdirect/abstract/20133409620 (accessed on 20 May 2022).
  13. Paes, G.P.; Viana, J.M.S.; Silva, F.F.; Mundim, G.B. Linkage disequilibrium, SNP frequency change due to selection, and association mapping in popcorn chromosome regions containing QTLs for quality traits. Genet. Mol. Biol. 2016, 39, 97–110. [Google Scholar] [CrossRef] [PubMed] [Green Version]
  14. Noman, A.S.M.; Hoque, M.A.; Haque, M.M.; Pervin, F.; Karim, M.R. Nutritional and Anti-Nutritional Components in Pachyrhizus Erosus L. Tuber. Food Chem. 2007, 102, 1112–1118. [Google Scholar] [CrossRef]
  15. González-Vázquez, M.; Calderón-Domínguez, G.; Mora-Escobedo, R.; Salgado-Cruz, M.P.; Arreguín-Centeno, J.H.; Monterrubio-López, R. Polysaccharides of Nutritional Interest in Jicama (Pachyrhizus Erosus) during Root Development. Food Sci. Nutr. 2022, 10, 1146–1158. [Google Scholar] [CrossRef] [PubMed]
  16. Pedrol, N.; Ramos, P. Protein Content Quantification By Bradford Method. In Handbook of Plant Ecophysiology Techniques; Kluwer Academic Publishers: Dordrecht, The Netherlands, 2001; pp. 283–295. [Google Scholar]
  17. Miller, G.L. Use of Dinitrosalicylic Acid Reagent for Determination of Reducing Sugar. Anal. Chem. 1959, 31, 426–428. [Google Scholar] [CrossRef]
  18. Dubois, M.; Gilles, K.A.; Hamilton, J.K.; Rebers, P.A.; Smith, F. Colorimetric Method for Determination of Sugars and Related Substances. Anal. Chem. 1956, 28, 350–356. [Google Scholar] [CrossRef]
  19. Rojas-Candelas, L.E.; Chanona-Pérez, J.J.; Méndez, J.V.M.; Morales-Hernández, J.A.; Benavides, H.A.C. Characterization of Structural Changes of Casein Micelles at Different PH Using Microscopy and Spectroscopy Techniques. Microsc. Microanal. 2022, 28, 527–536. [Google Scholar] [CrossRef]
  20. Carbonaro, M.; Nucara, A. Secondary Structure of Food Proteins by Fourier Transform Spectroscopy in the Mid-Infrared Region. Amino Acids 2010, 38, 679–690. [Google Scholar] [CrossRef]
  21. Jiang, Y.; Bai, X.; Lang, S.; Zhao, Y.; Liu, C.; Yu, L. Optimization of Ultrasonic-Microwave Assisted Alkali Extraction of Arabinoxylan from the Corn Bran Using Response Surface Methodology. Int. J. Biol. Macromol. 2019, 128, 452–458. [Google Scholar] [CrossRef]
  22. Bobo-García, G.; Davidov-Pardo, G.; Arroqui, C.; Vírseda, P.; Marín-Arroyo, M.R.; Navarro, M. Intra-Laboratory Validation of Microplate Methods for Total Phenolic Content and Antioxidant Activity on Polyphenolic Extracts, and Comparison with Conventional Spectrophotometric Methods. J. Sci. Food Agric. 2015, 95, 204–209. [Google Scholar] [CrossRef]
  23. Leite, A.V.; Malta, L.G.; Riccio, M.F.; Eberlin, M.N.; Pastore, G.M.; Maróstica Júnior, M.R. Antioxidant potential of rat plasma by administration of freeze-dried jaboticaba peel (Myrciaria jaboticaba Vell Berg). J. Agric. Food Chem. 2011, 59, 2277–2283. [Google Scholar] [CrossRef] [PubMed]
  24. Oyaizu, M. Studies on Products of Browning Reaction. Antioxidative Activities of Products of Browning Reaction Prepared from Glucosamine. Jpn. J. Nutr. Diet. 1986, 44, 307–315. [Google Scholar] [CrossRef] [Green Version]
  25. Li, X.; Han, L.; Chen, L. In Vitro Antioxidant Activity of Protein Hydrolysates Prepared from Corn Gluten Meal. J. Sci. Food Agric. 2008, 88, 1660–1666. [Google Scholar] [CrossRef]
  26. Carter, P. Spectrophotometric Determination of Serum Iron at the Submicrogram Level with a New Reagent (Ferrozine). Anal. Biochem. 1971, 40, 450–458. [Google Scholar] [CrossRef]
  27. Rojas-Candelas, L.E.; Chanona-Pérez, J.J.; Méndez Méndez, J.V.; Perea-Flores, M.J.; Cervantes-Sodi, H.F.; Hernández-Hernández, H.M.; Marin-Bustamante, M.Q. Physicochemical, Structural and Nanomechanical Study Elucidating the Differences in Firmness among Four Apple Cultivars. Postharvest Biol. Technol. 2021, 171, 111342. [Google Scholar] [CrossRef]
  28. Wellner, N. Fourier Transform Infrared (FTIR) and Raman Microscopy: Principles and Applications to Food Microstructures; Woodhead Publishing Limited: Thorston, UK, 2013; ISBN 9780857095251. [Google Scholar]
  29. Chateigner-Boutin, A.L.; Ordaz-Ortiz, J.J.; Alvarado, C.; Bouchet, B.; Durand, S.; Verhertbruggen, Y.; Barrière, Y.; Saulnier, L. Developing Pericarp of Maize: A Model to Study Arabinoxylan Synthesis and Feruloylation. Front. Plant Sci. 2016, 7, 1476. [Google Scholar] [CrossRef] [Green Version]
  30. Buitimea-Cantúa, N.E.; Antunes-Ricardo, M.; Gutiérrez-Uribe, J.A.; del Refugio Rocha-Pizaña, M.; de la Rosa-Millán, J.; Torres-Chávez, P.I. Protein-Phenolic Aggregates with Anti-Inflammatory Activity Recovered from Maize Nixtamalization Wastewaters (Nejayote). LWT 2020, 134, 109881. [Google Scholar] [CrossRef]
  31. Ogbaga, C.; Miller, M.; Athar, H.; Johnso, G. Fourier Transform Infrared Spectroscopic Analysis of Maize (Zea Mays) Subjected to Progressive Drought Reveals Involvement of Lipids, Amides and Carbohydrates. Afr. J. Biotechnol. 2017, 16, 1061–1066. [Google Scholar] [CrossRef] [Green Version]
  32. de la Rosa-Millán, J.; Orona-Padilla, J.L.; Flores-Moreno, V.M.; Serna-Saldívar, S.O. Physicochemical, Functional AndATR-FTIR Molecular Analysis of Protein Extracts Derived from Starchy Pulses. Int. J. Food Sci. Technol. 2018, 53, 1414–1424. [Google Scholar] [CrossRef]
  33. Li, P.; Huo, L.; Su, W.; Lu, R.; Deng, C.; Liu, L.; Deng, Y.; Guo, N.; Lu, C.; He, C. Free radical-scavenging capacity, antioxidant activity and phenolic content of Pouzolzia zeylanica. J. Serb. Chem. Soc. 2011, 76, 709–717. [Google Scholar] [CrossRef]
  34. Ivanišová, E.; Ondrejovid, M.; Šilhár, S. Antioxidant Activity of Milling Fractions of Selected Cereals. Nov. Biotechnol. Chim. 2012, 11, 45–56. [Google Scholar] [CrossRef]
  35. Ragaee, S.; Abdel-Aal, E.S.M.; Noaman, M. Antioxidant Activity and Nutrient Composition of Selected Cereals for Food Use. Food Chem. 2006, 98, 32–38. [Google Scholar] [CrossRef]
  36. Lopez-Martinez, L.X.; Parkin, K.L.; Garcia, H.S. Phase II-Inducing, Polyphenols Content and Antioxidant Capacity of Corn (Zea Mays L.) from Phenotypes of White, Blue, Red and Purple Colors Processed into Masa and Tortillas. Plant Foods Hum. Nutr. 2011, 66, 41–47. [Google Scholar] [CrossRef] [PubMed]
  37. Herrera-Balandrano, D.D.; Báez-González, J.G.; Carvajal-Millán, E.; Muy-Rangel, D.; Urías-Orona, V.; Martínez-López, A.L.; Márquez-Escalante, J.A.; Heredia, J.B.; Beta, T.; Niño-Medina, G. Alkali-Extracted Feruloylated Arabinoxylans from Nixtamalized Maize Bran Byproduct: A Synonymous with Soluble Antioxidant Dietary Fiber. Waste Biomass Valorization 2018, 11, 403–409. [Google Scholar] [CrossRef]
  38. Oboh, G.; Ademiluyi, A.O.; Akindahunsi, A.A. The Effect of Roasting on the Nutritional and Antioxidant Properties of Yellow and White Maize Varieties. Int. J. Food Sci. Technol. 2010, 45, 1236–1242. [Google Scholar] [CrossRef]
  39. Martínez-Tomé, M.; Murcia, M.A.; Frega, N.; Ruggieri, S.; Jiménez, A.M.; Roses, F.; Parras, P. Evaluation of Antioxidant Capacity of Cereal Brans. J. Agric. Food Chem. 2004, 52, 4690–4699. [Google Scholar] [CrossRef]
  40. Li, Y.; Jiang, B.; Zhang, T.; Mu, W.; Liu, J. Antioxidant and Free Radical-Scavenging Activities of Chickpea Protein Hydrolysate (CPH). Food Chem. 2008, 106, 444–450. [Google Scholar] [CrossRef]
  41. Sri Kantha, S.; Wada, S.; Takeuche, M.; Watabe, S.; Ochi, H. A Sensitive Method to Screen for Hydroxyl Radical Scavenging Activity in Natural Food Extracts Using Competitive Inhibition ELISA for 8-Hydroxydexyguanosine. Biotechnol. Tech. 1996, 10, 713–716. [Google Scholar] [CrossRef]
  42. Wong, F.C.; Yong, A.L.; Ting, E.P.S.; Khoo, S.C.; Ong, H.C.; Chai, T.T. Antioxidant, Metal Chelating, Anti-Glucosidase Activities and Phytochemical Analysis of Selected Tropical Medicinal Plants. Iran. J. Pharm. Res. 2014, 13, 1407–1413. [Google Scholar] [CrossRef]
  43. Kladnik, A.; Chamusco, K.; Dermastia, M.; Chourey, P. Evidence of Programmed Cell Death in Post-Phloem Transport Cells of the Maternal Pedicel Tissue in Developing Caryopsis of Maize. Plant Physiol. 2004, 136, 3572–3581. [Google Scholar] [CrossRef] [Green Version]
  44. Figueroa, J.D.C.; Véles-Medina, J.J.; Tolentino-Lõpez, E.M.; Gaytán-Martínez, M.; Aragõn-Cuevas, F.; Palacios, N.; Willcox, M. Effect of Traditional Nixtamalization Process on Starch Annealing and the Relation to Pozole Quality. J. Food Process Eng. 2013, 36, 704–714. [Google Scholar] [CrossRef]
  45. Li, S.; Chen, S.; Han, F.; Xv, Y.; Sun, H.; Ma, Z.; Chen, J.; Wu, W. Development and Optimization of Cold Plasma Pretreatment for Drying on Corn Kernels. J. Food Sci. 2019, 84, 2181–2189. [Google Scholar] [CrossRef] [PubMed]
  46. Arzate-Vázquez, I.; Méndez-Méndez, J.V.; Flores-Johnson, E.A.; Nicolás-Bermúdez, J.; Chanona-Pérez, J.J.; Santiago-Cortés, E. Study of the Porosity of Calcified Chicken Eggshell Using Atomic Force Microscopy and Image Processing. Micron 2019, 118, 50–57. [Google Scholar] [CrossRef] [PubMed]
  47. Antoine, C.; Peyron, S.; Mabille, F.; Lapierre, C.; Bouchet, B.; Abecassis, J.; Rouau, X. Individual Contribution of Grain Outer Layers and Their Cell Wall Structure to the Mechanical Properties of Wheat Bran. J. Agric. Food Chem. 2003, 51, 2026–2033. [Google Scholar] [CrossRef] [PubMed]
  48. Barrera, G.N.; Méndez-Méndez, J.; Arzate-Vázquez, I.; Calderón-Domínguez, G.; Ribotta, P.D. Nano- and Micro-Mechanical Properties of Wheat Grain by Atomic Force Microscopy (AFM) and Nano-Indentation (IIT) and Their Relationship with the Mechanical Properties Evaluated by Uniaxial Compression Test. J. Cereal Sci. 2019, 90, 102830. [Google Scholar] [CrossRef]
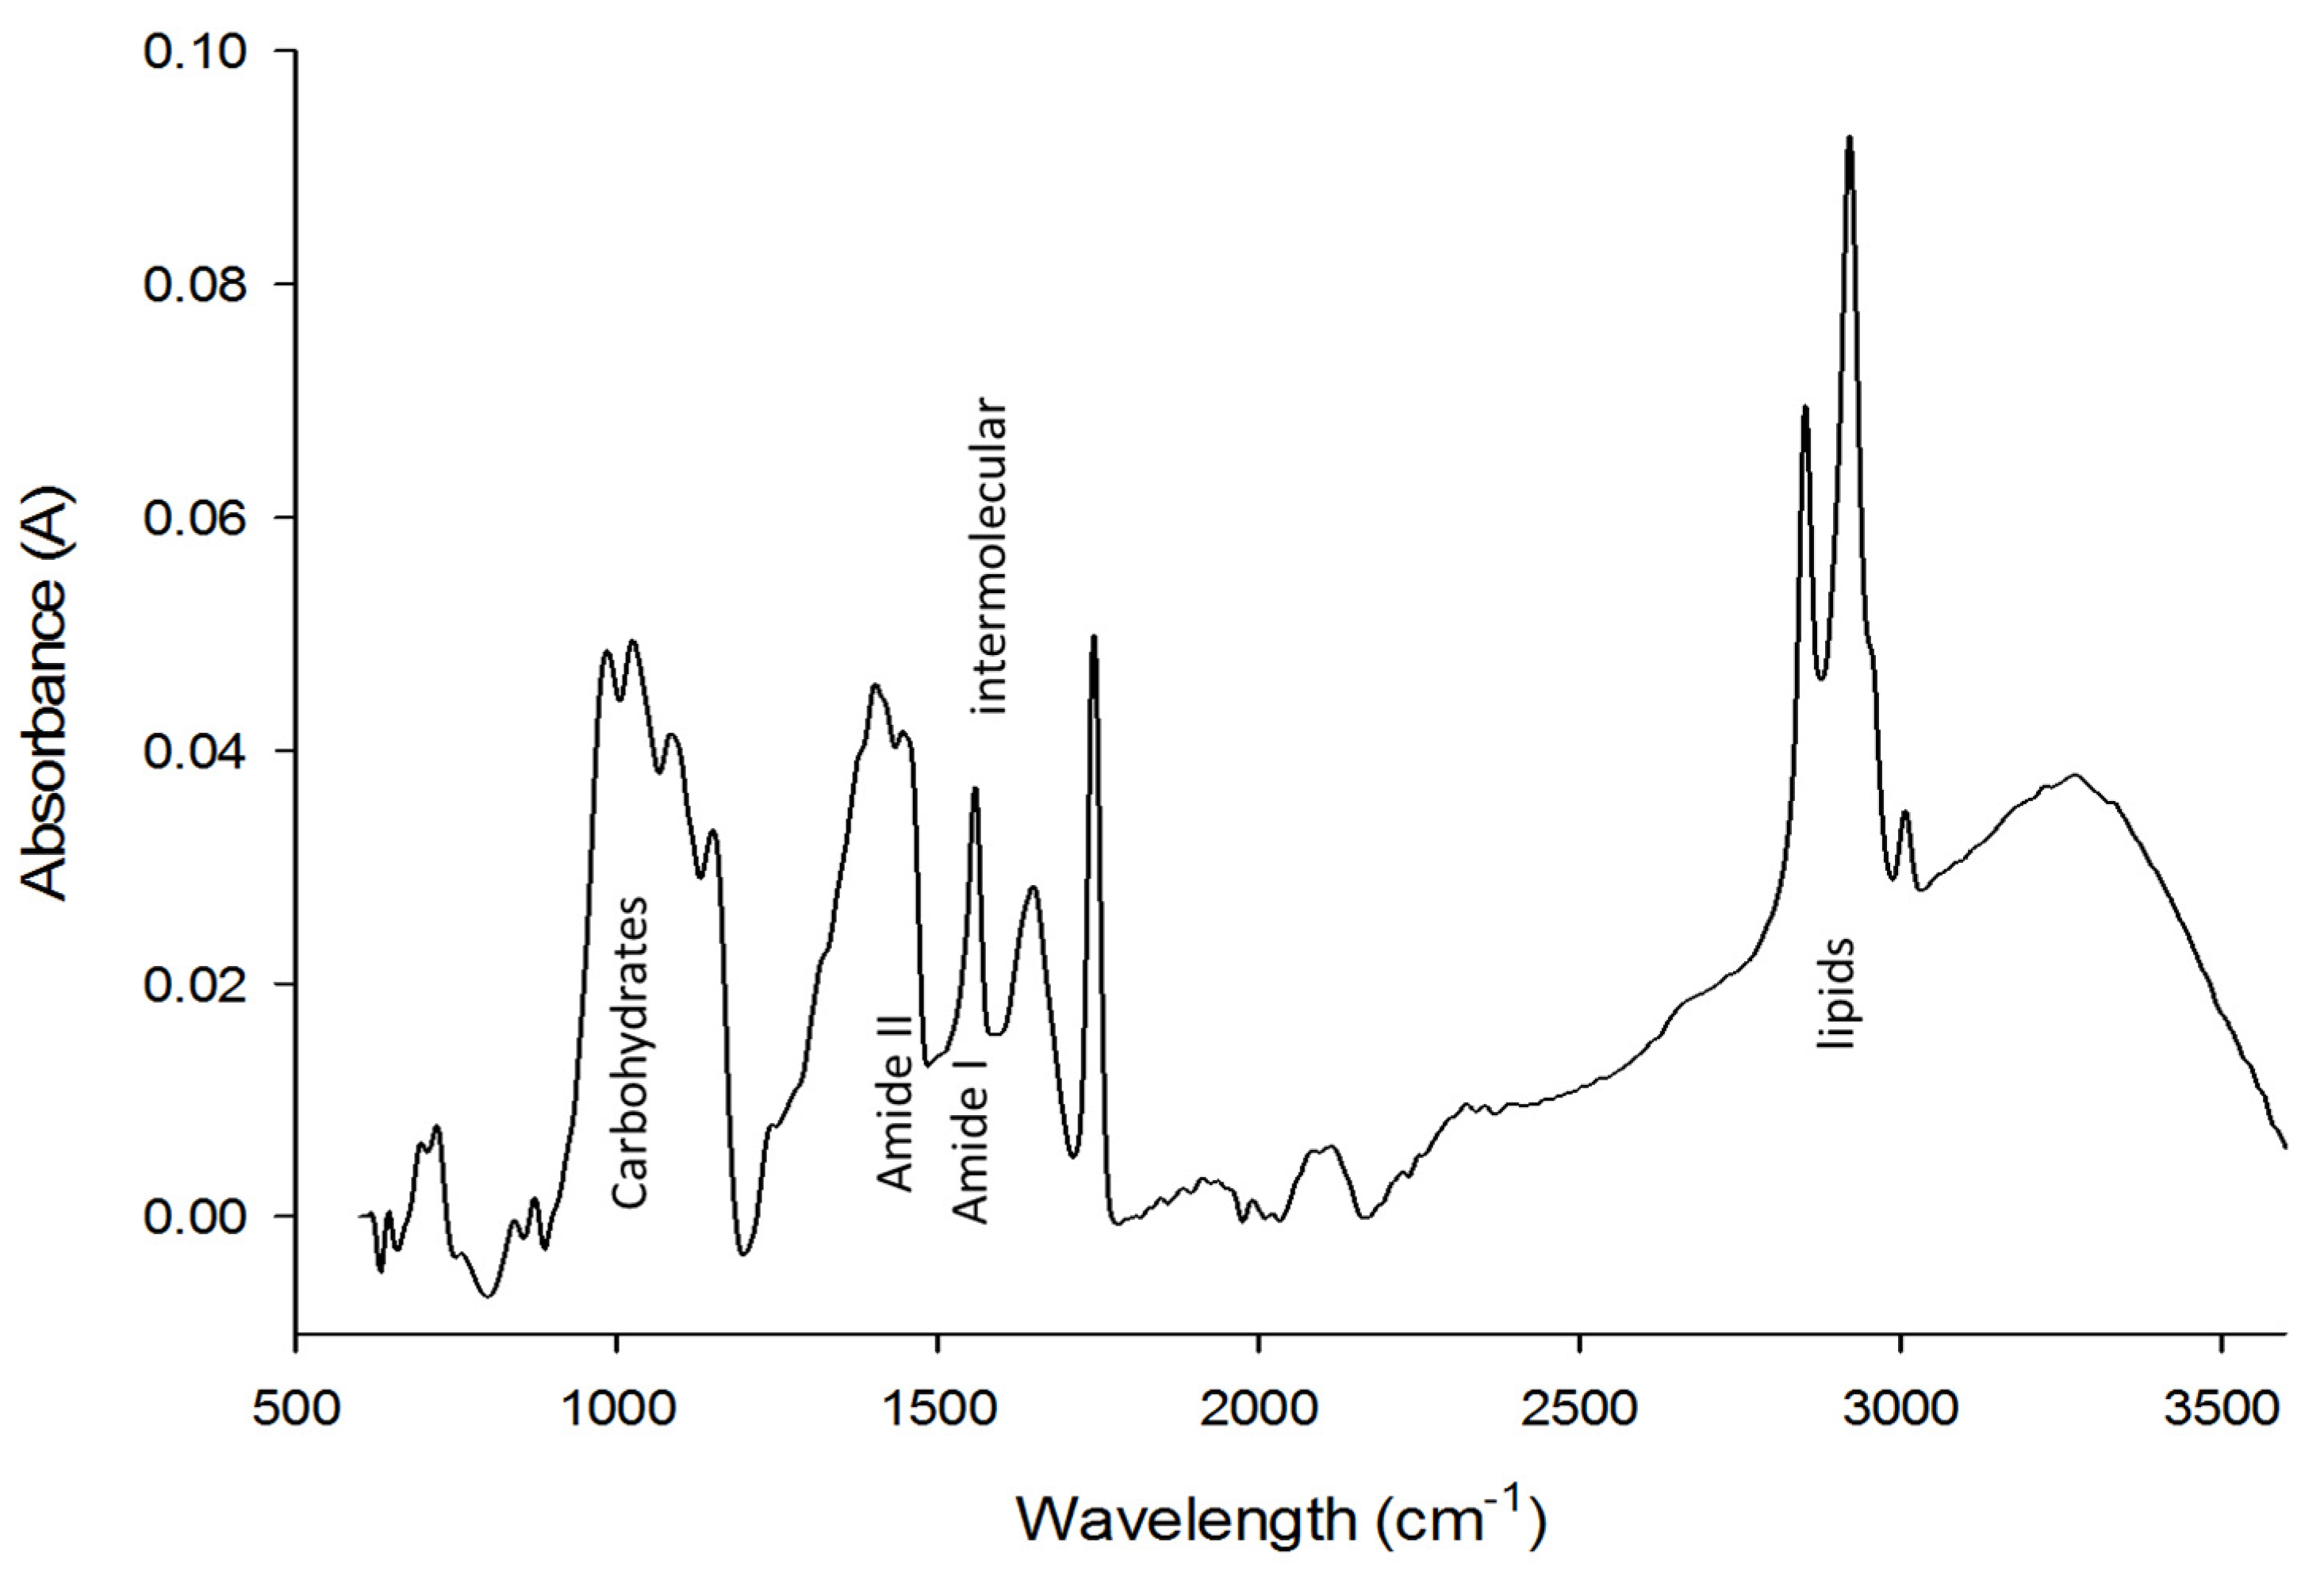
Figure 1. FT-IR spectra of the pericarp.
Applsci 12 06789 g001
Figure 2. FT-IR spectra of pericarp for the amide band I region, which represents peak-fitting of the second derivative curves of the spectra.
Applsci 12 06789 g002
Figure 3. Percentage of reducing power of Pericarp comparison with Trolox, caffeic acid, ferulic acid, coumaric acid (0.1 M). Values reported as percentage (%). Values presented are the average of three replicates ± standard deviation. Different letters indicate that the values are significantly different (p < 0.05).
Applsci 12 06789 g003
Figure 4. Percentage of hydroxyl radical of pericarp comparison with Trolox, caffeic acid, ferulic acid, coumaric acid (0.1 M). Values reported as percentage (%). Values presented are the average of three replicates ± standard deviation. Different letters indicate that the values are significantly different (p < 0.05).
Applsci 12 06789 g004
Figure 5. Percentage of iron chelation of pericarp comparison with Trolox, caffeic acid, ferulic acid, coumaric acid (0.1 M). Values reported as percentage (%). Values presented are the average of three replicates ± standard deviation. Different letters indicate that the values are significantly different (p < 0.05).
Applsci 12 06789 g005
Figure 6. SEM micrographs of pericarp in different parts. Scales correspond to 1 mm. (a1): The near pedicel part, (b1): in middle part, (c1): end part, and (a2,b2,c2): close up of pericarp parts, images by fast Fourier transform (FFT).
Applsci 12 06789 g006
Figure 7. Frequency histogram of YM values, YM: Young’s modulus. The line indicates the fit with a Gaussian function (a). AFM height image (1 × 1 μm) of pericarp. Ra: roughness (b).
Applsci 12 06789 g007
Table 1. Physicochemical parameters of nixtamalized popcorn pericarp.
Parameter
Ash (%)67.77 ± 3.13
Lipid (%)6.76 ± 0.13
Total sugars (%)10.93 ± 0.13
Reducing sugars (%)3.93 ± 0.14
Non-reducing sugars (%)6.99 ± 0.23
Moisture (%)5.71 ± 0.53
Nitrogen (%)1.15 ± 0.04
Crude protein total (%)7.2 ± 0.33
Crude protein soluble (%)0.11 ± 0.005
Crude protein insoluble (%)7.10 ± 0.30
Results expressed as mean value ± standard deviation.
Table 2. Antioxidant activity of pericarp (total phenolic content, ABTS and DPPH).
SampleTotal
Phenolic Content
ABTSDPPH
Pericarp0.21 ± 0.008550.1 ± 2.944.2 ± 1.6
The content of total phenols will be expressed in μg gallic acid equivalents/mL of sample (mg GAE/mL), ABTS and DPPH assays reported in mM Trolox equivalents (TE)/mL.
Publisher’s Note: MDPI stays neutral with regard to jurisdictional claims in published maps and institutional affiliations.